"daily" için komut dosyalarını ara

Daily Returns & STDWhat happened last time when xx increased by xx%? - Start collecting some stats!
You can choose the ticker and the timeframe you're interested in

RSI Oversold/UndersoldThe study script will place GREEN BUY arrows BELOW oversold conditions and RED SHORT arrows ABOVE overbought conditions. You can configure the period
Most RSI(14) indicators use a 14-period, I prefer a 5-period. The period, overbought and oversold periods are settings that can easily be changed by adding this study to your chart and clicking the "gear" icon next to the study inside your chart.


Daily SMAThis pine script on intraday chart is exactly the same SMA as built-in MovingAverage on a 1Day chart (with the same lengths)


Trinity Real Move Detector DashboardRelease Notes (critical)
1. This code "will" require tweaks for different timeframes to the multiplier, do not assume the data in the table is accurate, cross check it with the Trinity Real Move Detector or another ATR tool, to validate the values in the table and ensure you have set the correct values.
2. I mention this below. But please understand that pine code has a limitation in the number of security calls (40 request.security() calls per script). This code is on the limit of that threshold and I would encourage developers to see if they can find a way around this to improve the script and release further updates.
What do we have...
The Trinity Real Move Detector Dashboard is a powerful TradingView indicator designed to scan multiple assets at once and show when each one has genuine short-term volatility "energy" — the kind that makes directional options trades (especially 0DTE or short-dated) have a high probability of follow-through, and can be used for swing trading as well. It combines a simple ATR-based volatility filter with a SuperTrend-style bias to tell you not only if the market is "awake" but also in which direction the momentum is leaning.
At its core, the indicator calculates the current ATR on your chosen timeframe and compares it to a user-defined percentage of the asset's daily ATR. When the short-term ATR spikes above that threshold, it signals "enough energy" — meaning the underlying is moving with real force rather than choppy noise. The SuperTrend logic then determines bullish or bearish bias, so the status shows "BULLISH ENERGY" (green) or "BEARISH ENERGY" (red) when energy is on, or "WAIT" when it's not. It also counts how many bars the energy has been active and shows the current ATR vs threshold for quick visual confirmation.
The dashboard displays all this in a clean table with columns for Symbol, Multiplier, Current ATR, Threshold, Status, Bars Active, and Bias (UP/DOWN). It's perfect for 3-minute charts but works on any timeframe — just adjust the multiplier based on the hints in the settings.
Editing symbols and multipliers is straightforward and user-friendly. In the indicator settings, you'll see numbered inputs like "1. Symbol - NVDA" and "1. Multiplier". To change an asset, simply type the new ticker in the symbol field (e.g., replace "NVDA" with "TSLA", "AVGO", or "ADAUSD"). You can also adjust the multiplier for each asset individually in the corresponding "Multiplier" field to make it more or less sensitive — lower numbers give more signals, higher numbers give stricter, higher-quality ones. This lets you customize the dashboard to your watchlist without any coding. For example, if you switch to a 4-hour chart or a slower-moving stock like AVGO, you may need to raise the multiplier (e.g., to 0.3–0.4) to avoid false "bullish" signals during minor bounces in a larger downtrend.
One important note about the multiplier and timeframes: the default values are optimized for fast intraday charts (like 3-minute or 5-minute). On higher timeframes (15-minute, 1-hour, 4-hour, or daily), the SuperTrend bias can be too sensitive with low multipliers (1.0 default in the code), leading to situations like the AVGO 4-hour example — where price is clearly downtrending, but the dashboard shows "BULLISH ENERGY" because the tight bands flip on small bounces. To fix this, you need to manually increase the multiplier for that asset (or all assets) in the settings. For 4-hour or daily charts, 0.25–0.35 is often better to match smoother SuperTrend indicators like Trinity. Always test on your timeframe and asset — crypto usually needs slightly lower multipliers than stocks due to higher volatility.
TradingView has a hard limit of 40 request.security() calls per script. Each asset in the dashboard requires several calls (current ATR, daily ATR, SuperTrend components, etc.), so with the full ATR-based bias, you can safely monitor about 6–8 assets before hitting the limit. Adding more symbols increases the number of calls and will trigger the "too many securities" error. This is a platform restriction to prevent excessive server load, and there's no official way around it in a single script. Some advanced coders use tricks like caching or lower-timeframe requests to squeeze in a few more, but for reliability, sticking to 6–8 assets is recommended. If you need more, the common workaround is to create two separate indicators (e.g., one for stocks, one for crypto) and add both to the same chart.
Overall, this dashboard gives you a professional-grade multi-asset scanner that filters out low-energy noise and highlights real momentum opportunities across stocks and crypto — all in one glance. It's especially valuable for options traders who want to avoid theta decay on weak moves and only strike when the market has true fuel. By tweaking the per-symbol multipliers in the settings, you can perfectly adapt it to any timeframe or asset behavior, avoiding issues like the AVGO false bullish signal on higher timeframes.

VIX Term Structure Pro [v7.0 Enhanced]# VIX Term Structure Pro v7.0
[! (img.shields.io)](www.tradingview.com)
[! (img.shields.io)](www.tradingview.com)
[! (img.shields.io)](LICENSE)
**Professional VIX-based Market Sentiment & Timing Indicator**
专业的 VIX 市场情绪与择时指标
---
## 🌟 Overview / 概述
VIX Term Structure Pro is an advanced multi-factor market timing indicator that analyzes the VIX futures term structure, volatility regime, and market breadth to generate actionable buy/sell signals.
VIX Term Structure Pro 是一款高级多因子市场择时指标,通过分析 VIX 期货期限结构、波动率区间及市场广度,生成可操作的买卖信号。
---
## 🚀 Key Features / 核心功能
### 📊 Multi-Factor Scoring System / 多因子评分系统
- **Term Structure Z-Score**: Measures deviation from historical mean / 期限结构 Z 分数:衡量与历史均值的偏离
- **VIX/VX1 Basis**: Spot premium detection for panic signals / VIX 现货溢价:恐慌信号检测
- **Contango Analysis**: Futures curve shape insights / 期货升水分析
- **SKEW Integration**: Options skew for tail risk / SKEW 整合:尾部风险监测
- **Put/Call Ratio**: Sentiment extremes / 看跌/看涨比率:情绪极端
- **VVIX Support**: Volatility of volatility (optional) / VVIX 支持:波动率的波动率
### 🎯 Three-Tier Signal System / 三级信号系统
| Signal | Score | Description |
|--------|-------|-------------|
| 🚨 **CRASH BUY** | ≥ 6 | Extreme panic, rare opportunity / 极端恐慌,罕见机会 |
| 🟢 **STRONG BUY** | ≥ 5 | Multi-factor confluence / 多因子共振 |
| 🟡 **BUY DIP** | ≥ 4 | Accumulate on weakness / 逢低吸纳 |
| 🟠 **SELL/HEDGE** | ≤ -2 | Consider reducing risk / 考虑减仓对冲 |
| 🔴 **STRONG SELL** | ≤ -5 | Strong bearish signals / 强烈看跌信号 |
| 🔥 **EUPHORIA SELL** | ≤ -6 | Extreme greed, sell signal / 极度贪婪,卖出信号 |
### 📈 Dashboard Indicators / 仪表盘指标解读
| Indicator | Bullish 🟢 | Bearish 🔴 |
|-----------|------------|------------|
| Overall Bias | STRONG BUY / BUY DIP | STRONG SELL / SELL/HEDGE |
| AI Score | ≥ 5 (Extreme Fear) | ≤ -5 (Extreme Greed) |
| Market Trend | 🟢SPX 🟢NDX (Above MA200) | 🔴SPX 🔴NDX (Below MA200) |
| VIX Regime | LOW VOL (<15) | HIGH VOL (>25) |
| Term Struct Z | < -2.0 (Panic) | > 2.0 (Complacency) |
---
## ⚙️ Configuration / 配置选项
### 📡 Data Sources / 数据源
- **VIX Symbol**: Default `CBOE:VIX` (Alternative: `TVC:VIX`)
- **Put/Call Ratio**: Default `INDEX:CPCI` (Index P/C)
- **Timeframe**: Daily (stable) or Chart (real-time)
### ⚠️ Strategy Mode / 策略模式
- **High (Scalping)**: Sensitive, for short-term trades / 高敏感,短线
- **Normal (Swing)**: Balanced approach / 平衡模式
- **Low (Trend/Safe)**: Conservative, trend-following / 保守,趋势跟踪
### 🔬 Backtest Mode / 回测模式
- **OFF (Real-time)**: Shows current day data, suitable for live monitoring / 显示当日数据,适合实盘监控
- **ON (Historical)**: Uses only confirmed data, avoids look-ahead bias / 仅使用已确认数据,避免未来函数
---
## 📖 Usage Guide / 使用指南
### Best Practices / 最佳实践
1. **Apply to SPX/SPY/QQQ daily charts** for optimal signal accuracy
在 SPX/SPY/QQQ 日线图上使用,信号准确度最佳
2. **Wait for next trading day** to execute signals (signals trigger on daily close)
信号触发后在下一交易日执行(信号基于日线收盘)
3. **Use in conjunction with price action** for confirmation
结合价格走势确认信号
4. **Enable Market Trend Filter** (MA200) for safer entries in uncertain markets
开启趋势过滤(MA200)以在不确定市场中更安全入场
### Signal Interpretation / 信号解读
```
🚨 CRASH BUY (Score ≥ 6)
→ Rare extreme panic event
→ Historical average return: significant positive over 2 months
→ Consider aggressive positioning
🟢 STRONG BUY (Score ≥ 5)
→ Multiple indicators align
→ Historical average return: positive over 1 month
→ Consider building positions
🟡 BUY DIP (Score ≥ 4)
→ Moderate fear detected
→ Suitable for adding to existing positions
→ Filtered out in bear markets if Trend Filter is ON
```
---
## 📊 Historical Statistics / 历史统计
The indicator tracks signal frequency and average subsequent returns:
- **CRASH BUY**: 40-day return period (~2 months)
- **STRONG BUY**: 20-day return period (~1 month)
- **BUY DIP**: 10-day return period (~2 weeks)
指标追踪信号频率和后续平均收益,可在仪表盘中查看历史统计。
---
## 🔔 Alerts / 警报
Built-in alert conditions with cooldown mechanism to prevent spam:
| Alert | Condition |
|-------|-----------|
| Crash Buy Alert | Score ≥ 6, extreme panic |
| Strong Buy Alert | Score ≥ 5, multi-factor confluence |
| Buy Dip Alert | Score ≥ threshold |
| Euphoria Sell Alert | Score ≤ -6, extreme greed |
| Strong Sell Alert | Score ≤ -5 |
| VIX Basis Panic | VIX spot premium spike |
---
## 📋 Changelog / 更新日志
### v7.0 (Current)
- ✨ Three-tier buy/sell signal system
- 📊 Signal statistics with average return tracking
- 🔬 Backtest Mode toggle for historical testing
- 🎨 Configurable ±1 Z-Score reference lines
- ⚡ Modular scoring functions
- 🛡️ Dual index trend display (SPX + NDX)
- 📱 Compact & Full dashboard modes
---
## ⚠️ Disclaimer / 免责声明
**English:**
This indicator is for educational and informational purposes only. It does not constitute financial advice. Past performance does not guarantee future results. Always do your own research and consider your risk tolerance before trading.
**中文:**
本指标仅供教育和信息参考,不构成投资建议。过往表现不代表未来收益。交易前请自行研究并评估风险承受能力。
---
## 📄 License / 许可证
MIT License - Feel free to use, modify, and share.
---
## 🤝 Contributing / 贡献
Issues and pull requests are welcome!
欢迎提交问题和贡献代码!
---
**Made with ❤️ for the trading community**
**为交易社区用心打造**

JAM ORB Algo⚡ ORB Strategy + Backtesting (Pine Script v5)
This script implements a complete Opening Range Breakout (ORB) strategy, featuring built-in backtesting, advanced TP/SL visualization, full style customization, and a performance dashboard. It is designed for traders who want to clearly evaluate breakout performance directly on the chart.
🕑 ORB Window Configuration
🔹 Session selection: choose between Market Timezone or Custom Session.
🔹 Timezone support: configurable from UTC-8 to UTC+12.
🔹 Daily limit: option to allow only one trade per day.
🔹 Risk/Reward (RR) settings:
Configurable TP1, TP2, and TP3 levels.
Stop Loss calculated dynamically from the ORB range.
📊 Backtesting Engine
🔹 Interactive dashboard showing trades, wins, losses, and win rate.
🔹 Adjustable partial exits for each TP (TP1, TP2, TP3).
🔹 Automatic calculation of percentage-based profit and loss.
🔹 Tracks total trades, total profit, and average profit per trade.
🎨 Visual Customization
🔹 Fully customizable colors:
ORB high/low lines and range fill.
Buy/Sell entry labels.
TP and SL lines with background zones.
🔹 Line style and thickness options (solid, dotted, dashed).
🔹 Visibility controls for each TP/SL level.
🔹 Clear profit and loss zones drawn directly on the chart.
🚀 Trading Logic
🔹 LONG entries: triggered when price breaks above the ORB high.
🔹 SHORT entries: triggered when price breaks below the ORB low.
🔹 Automatic calculation of Stop Loss and TP1, TP2, TP3 based on ORB range and RR.
🔹 Customizable BUY / SELL labels displayed at entry.
✅ TP / SL Detection
🔹 Real-time detection of TP1, TP2, TP3, and SL hits.
🔹 Prevents double counting of the same level.
🔹 Extended TP/SL lines with shaded zones for better clarity.
📈 Backtesting Dashboard
🔹 Displayed in the top-right corner of the chart.
🔹 Shows:
Total trades
Wins / Losses
Win rate (%)
Total profit (%)
Average profit per trade
🔹 Fully customizable panel color.
✨ Summary
This script combines:
Opening Range detection
Breakout trading logic with advanced risk management
Professional-grade visualizations
Integrated historical performance tracking
High customization for sessions, styles, and colors
💡 Ideal for traders who want to trade ORB setups with clarity, structure, and measurable results.

DeMarker (DeM)The DeMarker (DeM) indicator is a momentum oscillator designed to identify overbought and oversold conditions by comparing the most recent price extremes (highs and lows) to those of the previous candle. It moves between 0 and 1 and is especially useful for spotting potential trend reversals, exhaustion, and better-timed entries within larger trends.
How the DeMarker works
The DeMarker focuses on the relationship between today’s highs and lows and those of the previous bar:
• When price is pushing to new highs but not making significantly lower lows, DeM tends to rise toward 1, reflecting buying pressure and potential overbought conditions.
• When price is making lower lows but not significantly higher highs, DeM falls toward 0, reflecting selling pressure and potential oversold conditions.
Internally, the indicator measures the positive difference between the current high and the previous high (up-move strength) and the positive difference between the previous low and the current low (down-move strength). These values are smoothed over a user-defined period and combined into a ratio that keeps the output bounded between 0 and 1, making it easy to interpret visually.
Default settings and parameters
Typical default settings are aimed at providing a balance between responsiveness and noise reduction:
• Length: 14
• Overbought level: 0.7
• Oversold level: 0.3
With these settings, readings above 0.7 suggest that the market may be overheated to the upside, while readings below 0.3 suggest potential exhaustion on the downside. Traders can adjust these parameters depending on their style and the volatility of the asset.
Example configurations
Here are a few practical configurations that can be suggested to users:
• Swing trading setup:
• Length: 14–21
• Overbought: 0.7–0.75
• Oversold: 0.25–0.3
This works well on 4H and daily charts for spotting potential swing highs and lows.
• Short-term intraday setup:
• Length: 7–10
• Overbought: 0.8
• Oversold: 0.2
A shorter length increases sensitivity, better for 5–15 minute charts, but also increases the number of signals.
• Trend-following filter:
• Length: 20–30
• Overbought: 0.65–0.7
• Oversold: 0.3–0.35
This smoother configuration can be used together with moving averages to filter trades in the direction of the main trend.
Basic trading usage
Traders commonly use DeMarker in three main ways:
• Mean-reversion entries:
• Look for DeM below the oversold level (for example, 0.3 or 0.25) while price is approaching a support zone.
• Consider long entries when DeM turns back up and crosses above the oversold level, ideally confirmed by a bullish candle pattern or break of minor resistance.
• Taking profits or trimming positions:
• When DeM moves above the overbought level (for example, 0.7–0.8) near a known resistance level, traders may choose to take partial profits or tighten stops.
• A downward turn from overbought after a strong rally often signals momentum exhaustion.
• Divergence signals:
• Bullish divergence: price makes a lower low while DeM makes a higher low. This can hint at weakening downside momentum and a possible reversal upward.
• Bearish divergence: price makes a higher high while DeM makes a lower high. This can warn of weakening upside momentum before a pullback.
Combining with other tools
DeMarker often performs best as part of a confluence-based approach rather than as a standalone signal generator:
• Combine with trend filters:
• Use a moving average (for example, 50 or 200 EMA) to define trend direction and take DeM oversold entries only in uptrends, or overbought entries only in downtrends.
• Use with support/resistance and price action:
• Prioritize DeM signals that occur near well-defined horizontal levels, trendlines, or supply/demand zones.
• Add volume or volatility tools:
• Strong signals tend to appear when DeM reverses from extreme zones in sync with a volume spike or volatility contraction/expansion.

BOTMAN STRATEGYThis indicator is made and updated by SPXHERO.
This indicator is specialized in specific Stocks only:
QQQ
TSLA
AAPL
NVDA
MSFT
based on a new invented strategy and updated daily by us for your future use.

AMT Structure: 80% Traverse, PD Levels & nPOCsHere is a clean, professional description formatted for the TradingView description box. It highlights the methodology (AMT/80% Rule), the specific features, and the credits.
Title: AMT Structure: 80% Traverse, PD Levels & nPOCs
Description:
This indicator is a comprehensive toolkit designed for futures traders utilizing Auction Market Theory (AMT) and Volume Profile strategies. It consolidates multiple scripts into a single, unified overlay to declutter your chart while providing essential structural references for the 80% Traverse setup, intraday context, and longer-term auction targets.
Key Features:
1. 80% Rule / Traverse Setup (Chart Champions Logic)
Automated RTH Open Detection: Hardcoded to the 08:30 AM CT Open to ensure accuracy for US Futures (ES/NQ) regardless of your chart's timezone settings.
Value Area Logic: Automatically calculates the Previous Day's Value Area High (VAH), Value Area Low (VAL), and Point of Control (POC).
Setup Detection: If the market opens outside of the previous day's value, the script highlights the Value Area in color (default: Purple), signaling that an 80% traverse (filling the value area) is structurally possible if price re-enters value.
Background Fill: Optional shading between VAH and VAL to clearly visualize the "playing field" for the traverse.
2. Auction Market Theory (AMT) Premarket Levels
Overnight High/Low: Automatically captures the highest and lowest prices traded during the overnight session (17:00 - 08:30 CT).
Breakout Alerts: Includes logic to detect and alert when these overnight levels are broken during the RTH session.
Auto-Cleanup: Lines can be set to auto-delete after a specified time (default: 60 mins into the session) to keep the chart clean after the Initial Balance (IB) period.
3. Structural Reference Levels
Previous Day Levels: Plots Previous Day High, Low, and Equilibrium (Midpoint) as standard reference lines.
Initial Balance (IB): Option to display the First Hour High and Low (08:30 - 09:30 CT) to assess day type (Neutral, Trend, Normal Variation, etc.).
RTH VWAP: An anchored VWAP that resets specifically at the RTH Open (08:30 CT), distinct from the standard 24-hour VWAP.
4. Naked Points of Control (nPOCs)
Multi-Timeframe Tracking: Tracks and plots Naked POCs for Daily, Weekly, and Monthly profiles.
Auto-Cleanup: Lines automatically delete themselves the moment price touches them, ensuring you only see untested levels.
Customization: Toggle each timeframe on/off individually.
Settings & Customization:
Global Offset: Move all text labels to the right with a single setting to prevent price action from obscuring text.
8:30 Open Offset: Independent offset for the Open label to distinguish it from other opening references.
Smart Coloring: Text labels automatically match their corresponding line colors for easy identification.
Modular Toggles: Every section (AMT, VWAP, PD Levels, CCV, nPOCs) can be turned on or off individually to suit your specific trading plan.
Usage: This tool is specifically tuned for ES and NQ futures trading but can be adapted for other instruments. It replaces the need for separate indicators for Overnight Highs/Lows, Previous Day Levels, and Volume Profile targeting.

ATR Trailing StopATR Trailing Stop (Dynamic Volatility Regimes)
==============================================
This indicator implements an adaptive ATR-based trailing stop for long positions. The stop automatically adjusts based on stock volatility, tightening during fast movements and widening during calm periods. It is designed as a trade management tool to help protect profits while staying aligned with strong trends.
How It Works
------------
* Tracks the highest high over a configurable lookback window and ensures this “top” never moves downward.
* Computes the trailing stop as:**Top – ATR × Dynamic Multiplier**
* The ATR multiplier changes depending on volatility:
* Low volatility → Wide stop (slower trailing)
* Medium volatility → Standard trailing
* High volatility → Tight stop (faster trailing)
* The trailing stop only moves upward; it never decreases.
* If price falls significantly below the stop (default: 5%), the system resets and begins trailing from a new top.
* An optional price-scale label displays:
* Current stop value
* Volatility regime (LOW / MID / HIGH)
* ATR percentage and active multiplier
Alerts
------
Two alert conditions are included:
### Trailing Stop – Near
Triggers when price moves within a user-defined percentage above the stop.
### Trailing Stop – Hit
Triggers when price touches or closes below the stop.
How to Use
----------
1. Add the indicator to any chart (daily timeframe recommended).
2. Configure:
* ATR length
* Lookback bars
* Volatility thresholds
* ATR multipliers
3. Set alerts for early warnings or stop-hit events.
4. Use the stop line as a dynamic risk-management tool to guide exit decisions and protect profits.
Notes
-----
* Designed for long-only trailing logic.
* This indicator does not generate entry signals; it is intended for stop management.
Khango's Key//@version=5
//@sbtnc thank you for doing the base code
//Added additional levels for convienience sake.
indicator('Key Levels SpacemanBTC IDWM', shorttitle='Khangos Key', overlay=true, max_lines_count=100)
//35 works
displayStyle = input.string(defval='Standard', title='Display Style', options= , inline='Display')
mergebool = input.bool(defval=true, title='Merge Levels?', inline='Display')
distanceright = input.int(defval=30, title='Distance', minval=5, maxval=500, inline='Dist')
radistance = input.int(defval=250, title='Anchor Distance', minval=5, maxval=500, inline='Dist')
labelsize = input.string(defval='Medium', title='Text Size', options= )
linesize = input.string(defval='Small', title='Line Width', options= , inline='Line')
linestyle = input.string(defval='Solid', title='Line Style', options= , inline='Line')
GlobalTextType = input.bool(defval=false, title='Global Text ShortHand', tooltip='Enable for shorthand text on all text')
var globalcoloring = input.bool(defval=false, title='Global Coloring', tooltip='Enable for all color controls via one color', inline='GC')
GlobalColor = input.color(title='', defval=color.white, inline='GC')
//var show_tails = input(defval = false, title = "Always Show", type = input.bool)
= request.security(syminfo.tickerid, 'D', , lookahead=barmerge.lookahead_on)
= request.security(syminfo.tickerid, 'D', [time , high ], lookahead=barmerge.lookahead_on)
= request.security(syminfo.tickerid, 'D', [time , low ], lookahead=barmerge.lookahead_on)
cdailyh_open = request.security(syminfo.tickerid, 'D', high, lookahead=barmerge.lookahead_on)
cdailyl_open = request.security(syminfo.tickerid, 'D', low, lookahead=barmerge.lookahead_on)
var monday_time = time
var monday_high = high
var monday_low = low
= request.security(syminfo.tickerid, 'W', , lookahead=barmerge.lookahead_on)
= request.security(syminfo.tickerid, 'W', [time , high ], lookahead=barmerge.lookahead_on)
= request.security(syminfo.tickerid, 'W', [time , low ], lookahead=barmerge.lookahead_on)
= request.security(syminfo.tickerid, 'M', , lookahead=barmerge.lookahead_on)
= request.security(syminfo.tickerid, 'M', [time , high ], lookahead=barmerge.lookahead_on)
= request.security(syminfo.tickerid, 'M', [time , low ], lookahead=barmerge.lookahead_on)
= request.security(syminfo.tickerid, '3M', , lookahead=barmerge.lookahead_on)
= request.security(syminfo.tickerid, '3M', [time , high ], lookahead=barmerge.lookahead_on)
= request.security(syminfo.tickerid, '3M', [time , low ], lookahead=barmerge.lookahead_on)
= request.security(syminfo.tickerid, '12M', , lookahead=barmerge.lookahead_on)
= request.security(syminfo.tickerid, '12M', , lookahead=barmerge.lookahead_on)
= request.security(syminfo.tickerid, '12M', , lookahead=barmerge.lookahead_on)
= request.security(syminfo.tickerid, '240', , lookahead=barmerge.lookahead_on)
= request.security(syminfo.tickerid, '240', [time , high ], lookahead=barmerge.lookahead_on)
= request.security(syminfo.tickerid, '240', [time , low ], lookahead=barmerge.lookahead_on)
//------------------------------ Inputs -------------------------------
var is_intra_enabled = input.bool(defval=false, title='Open', group='4H', inline='4H')
var is_intrarange_enabled = input.bool(defval=false, title='Prev H/L', group='4H', inline='4H')
var is_intram_enabled = input.bool(defval=false, title='Prev Mid', group='4H', inline='4H')
IntraTextType = input.bool(defval=false, title='ShortHand', group='4H', inline='4Hsh')
var is_daily_enabled = input.bool(defval=true, title='Open', group='Daily', inline='Daily')
var is_dailyrange_enabled = input.bool(defval=false, title='Prev H/L', group='Daily', inline='Daily')
var is_dailym_enabled = input.bool(defval=false, title='Prev Mid', group='Daily', inline='Daily')
DailyTextType = input.bool(defval=false, title='ShortHand', group='Daily', inline='Dailysh')
var is_monday_enabled = input.bool(defval=true, title='Range', group='Monday Range', inline='Monday')
var is_monday_mid = input.bool(defval=true, title='Mid', group='Monday Range', inline='Monday')
var untested_monday = false
MondayTextType = input.bool(defval=false, title='ShortHand', group='Monday Range', inline='Mondaysh')
var is_weekly_enabled = input.bool(defval=true, title='Open', group='Weekly', inline='Weekly')
var is_weeklyrange_enabled = input.bool(defval=true, title='Prev H/L', group='Weekly', inline='Weekly')
var is_weekly_mid = input.bool(defval=true, title='Prev Mid', group='Weekly', inline='Weekly')
WeeklyTextType = input.bool(defval=false, title='ShortHand', group='Weekly', inline='Weeklysh')
var is_monthly_enabled = input.bool(defval=true, title='Open', group='Monthly', inline='Monthly')
var is_monthlyrange_enabled = input.bool(defval=true, title='Prev H/L', group='Monthly', inline='Monthly')
var is_monthly_mid = input.bool(defval=true, title='Prev Mid', group='Monthly', inline='Monthly')
MonthlyTextType = input.bool(defval=false, title='ShortHand', group='Monthly', inline='Monthlysh')
var is_quarterly_enabled = input.bool(defval=true, title='Open', group='Quarterly', inline='Quarterly')
var is_quarterlyrange_enabled = input.bool(defval=false, title='Prev H/L', group='Quarterly', inline='Quarterly')
var is_quarterly_mid = input.bool(defval=true, title='Prev Mid', group='Quarterly', inline='Quarterly')
QuarterlyTextType = input.bool(defval=false, title='ShortHand', group='Quarterly', inline='Quarterlysh')
var is_yearly_enabled = input.bool(defval=true, title='Open', group='Yearly', inline='Yearly')
var is_yearlyrange_enabled = input.bool(defval=false, title='Current H/L', group='Yearly', inline='Yearly')
var is_yearly_mid = input.bool(defval=true, title='Mid', group='Yearly', inline='Yearly')
YearlyTextType = input.bool(defval=false, title='ShortHand', group='Yearly', inline='Yearlysh')
var is_londonrange_enabled = input.bool(defval=false, title='London Range', group='FX Sessions', inline='FX')
var is_usrange_enabled = input.bool(defval=false, title='New York Range', group='FX Sessions', inline='FX')
var is_asiarange_enabled = input.bool(defval=false, title='Asia Range', group='FX Sessions', inline='FX')
SessionTextType = input.bool(defval=false, title='ShortHand', group='FX Sessions', inline='FXColor')
Londont = input.session("0800-1600", "London Session")
USt = input.session("1400-2100", "New York Session")
Asiat = input.session("0000-0900", "Tokyo Session")
DailyColor = input.color(title='', defval=#08bcd4, group='Daily', inline='Dailysh')
MondayColor = input.color(title='', defval=color.white, group='Monday Range', inline='Mondaysh')
WeeklyColor = input.color(title='', defval=#fffcbc, group='Weekly', inline='Weeklysh')
MonthlyColor = input.color(title='', defval=#08d48c, group='Monthly', inline='Monthlysh')
YearlyColor = input.color(title='', defval=color.red, group='Yearly', inline='Yearlysh')
quarterlyColor = input.color(title='', defval=color.red, group='Quarterly', inline='Quarterlysh')
IntraColor = input.color(title='', defval=color.orange, group='4H', inline='4Hsh')
LondonColor = input.color(title='', defval=color.white, group='FX Sessions', inline='FXColor')
USColor = input.color(title='', defval=color.white, group='FX Sessions', inline='FXColor')
AsiaColor = input.color(title='', defval=color.white, group='FX Sessions', inline='FXColor')
var pdhtext = GlobalTextType or DailyTextType ? 'PDH' : 'Prev Day High'
var pdltext = GlobalTextType or DailyTextType ? 'PDL' : 'Prev Day Low'
var dotext = GlobalTextType or DailyTextType ? 'DO' : 'Daily Open'
var pdmtext = GlobalTextType or DailyTextType ? 'PDM' : 'Prev Day Mid'
var pwhtext = GlobalTextType or WeeklyTextType ? 'PWH' : 'Prev Week High'
var pwltext = GlobalTextType or WeeklyTextType ? 'PWL' : 'Prev Week Low'
var wotext = GlobalTextType or WeeklyTextType ? 'WO' : 'Weekly Open'
var pwmtext = GlobalTextType or WeeklyTextType ? 'PWM' : 'Prev Week Mid'
var pmhtext = GlobalTextType or MonthlyTextType ? 'PMH' : 'Prev Month High'
var pmltext = GlobalTextType or MonthlyTextType ? 'PML' : 'Prev Month Low'
var motext = GlobalTextType or MonthlyTextType ? 'MO' : 'Monthly Open'
var pmmtext = GlobalTextType or MonthlyTextType ? 'PMM' : 'Prev Month Mid'
var pqhtext = GlobalTextType or QuarterlyTextType ? 'PQH' : 'Prev Quarter High'
var pqltext = GlobalTextType or QuarterlyTextType ? 'PQL' : 'Prev Quarter Low'
var qotext = GlobalTextType or QuarterlyTextType ? 'QO' : 'Quarterly Open'
var pqmtext = GlobalTextType or QuarterlyTextType ? 'PQM' : 'Prev Quarter Mid'
var cyhtext = GlobalTextType or YearlyTextType ? 'CYH' : 'Current Year High'
var cyltext = GlobalTextType or YearlyTextType ? 'CYL' : 'Current Year Low'
var yotext = GlobalTextType or YearlyTextType ? 'YO' : 'Yearly Open'
var cymtext = GlobalTextType or YearlyTextType ? 'CYM' : 'Current Year Mid'
var pihtext = GlobalTextType or IntraTextType ? 'P-4H-H' : 'Prev 4H High'
var piltext = GlobalTextType or IntraTextType ? 'P-4H-L' : 'Prev 4H Low'
var iotext = GlobalTextType or IntraTextType ? '4H-O' : '4H Open'
var pimtext = GlobalTextType or IntraTextType ? 'P-4H-M' : 'Prev 4H Mid'
var pmonhtext = GlobalTextType or MondayTextType ? 'MDAY-H' : 'Monday High'
var pmonltext = GlobalTextType or MondayTextType ? 'MDAY-L' : 'Monday Low'
var pmonmtext = GlobalTextType or MondayTextType ? 'MDAY-M' : 'Monday Mid'
var lhtext = GlobalTextType or SessionTextType ? 'Lon-H' : 'London High'
var lltext = GlobalTextType or SessionTextType ? 'Lon-L' : 'London Low'
var lotext = GlobalTextType or SessionTextType ? 'Lon-O' : 'London Open'
var ushtext = GlobalTextType or SessionTextType ? 'NY-H' : 'New York High'
var usltext = GlobalTextType or SessionTextType ? 'NY-L' : 'New York Low'
var usotext = GlobalTextType or SessionTextType ? 'NY-O' : 'New York Open'
var asiahtext = GlobalTextType or SessionTextType ? 'AS-H' : 'Asia High'
var asialtext = GlobalTextType or SessionTextType ? 'AS-L' : 'Asia Low'
var asiaotext = GlobalTextType or SessionTextType ? 'AS-O' : 'Asia Open'
if globalcoloring == true
DailyColor := GlobalColor
MondayColor := GlobalColor
WeeklyColor := GlobalColor
MonthlyColor := GlobalColor
YearlyColor := GlobalColor
quarterlyColor := GlobalColor
IntraColor := GlobalColor
IntraColor
if weekly_time != weekly_time
untested_monday := false
untested_monday
if is_monday_enabled == true and untested_monday == false
untested_monday := true
monday_time := daily_time
monday_high := cdailyh_open
monday_low := cdailyl_open
monday_low
linewidthint = 1
if linesize == 'Small'
linewidthint := 1
linewidthint
if linesize == 'Medium'
linewidthint := 2
linewidthint
if linesize == 'Large'
linewidthint := 3
linewidthint
var DEFAULT_LINE_WIDTH = linewidthint
var DEFAULT_TAIL_WIDTH = linewidthint
fontsize = size.small
if labelsize == 'Small'
fontsize := size.small
fontsize
if labelsize == 'Medium'
fontsize := size.normal
fontsize
if labelsize == 'Large'
fontsize := size.large
fontsize
linestyles = line.style_solid
if linestyle == 'Dashed'
linestyles := line.style_dashed
linestyles
if linestyle == 'Dotted'
linestyles := line.style_dotted
linestyles
var DEFAULT_LABEL_SIZE = fontsize
var DEFAULT_LABEL_STYLE = label.style_none
var DEFAULT_EXTEND_RIGHT = distanceright
London = time(timeframe.period, Londont)
US = time(timeframe.period, USt)
Asia = time(timeframe.period, Asiat)
var clondonhigh = 0.0
var clondonlow = close
var londontime = time
var flondonhigh = 0.0
var flondonlow = 0.0
var flondonopen = 0.0
var onelondonfalse = false
if London
if high > clondonhigh
clondonhigh := high
clondonhigh
if low < clondonlow
clondonlow := low
clondonlow
if onelondonfalse
londontime := time
flondonopen := open
flondonopen
flondonhigh := clondonhigh
flondonlow := clondonlow
onelondonfalse := false
onelondonfalse
else
if onelondonfalse == false
flondonhigh := clondonhigh
flondonlow := clondonlow
flondonlow
onelondonfalse := true
clondonhigh := 0.0
clondonlow := close
clondonlow
//////////////////////////////////
var cushigh = 0.0
var cuslow = close
var ustime = time
var fushigh = 0.0
var fuslow = 0.0
var fusopen = 0.0
var oneusfalse = false
if US
if high > cushigh
cushigh := high
cushigh
if low < cuslow
cuslow := low
cuslow
if oneusfalse
ustime := time
fusopen := open
fusopen
fushigh := cushigh
fuslow := cuslow
oneusfalse := false
oneusfalse
else
if oneusfalse == false
fushigh := cushigh
fuslow := cuslow
fuslow
oneusfalse := true
cushigh := 0.0
cuslow := close
cuslow
//////////////////////////////////
var casiahigh = 0.0
var casialow = close
var asiatime = time
var fasiahigh = 0.0
var fasialow = 0.0
var fasiaopen = 0.0
var oneasiafalse = false
if Asia
if high > casiahigh
casiahigh := high
casiahigh
if low < casialow
casialow := low
casialow
if oneasiafalse
asiatime := time
fasiaopen := open
fasiaopen
fasiahigh := casiahigh
fasialow := casialow
oneasiafalse := false
oneasiafalse
else
if oneasiafalse == false
fasiahigh := casiahigh
fasialow := casialow
fasialow
oneasiafalse := true
casiahigh := 0.0
casialow := close
casialow
//------------------------------ Plotting ------------------------------
var pricearray = array.new_float(0)
var labelarray = array.new_label(0)
f_LevelMerge(pricearray, labelarray, currentprice, currentlabel, currentcolor) =>
if array.includes(pricearray, currentprice)
whichindex = array.indexof(pricearray, currentprice)
labelhold = array.get(labelarray, whichindex)
whichtext = label.get_text(labelhold)
label.set_text(labelhold, label.get_text(currentlabel) + ' / ' + whichtext)
label.set_text(currentlabel, '')
label.set_textcolor(labelhold, currentcolor)
else
array.push(pricearray, currentprice)
array.push(labelarray, currentlabel)
var can_show_daily = is_daily_enabled and timeframe.isintraday
var can_show_weekly = is_weekly_enabled and not timeframe.isweekly and not timeframe.ismonthly
var can_show_monthly = is_monthly_enabled and not timeframe.ismonthly
get_limit_right(bars) =>
timenow + (time - time ) * bars
// the following code doesn't need to be processed on every candle
if barstate.islast
is_weekly_open = dayofweek == dayofweek.monday
is_monthly_open = dayofmonth == 1
can_draw_daily = (is_weekly_enabled ? not is_weekly_open : true) and (is_monthly_enabled ? not is_monthly_open : true)
can_draw_weekly = is_monthly_enabled ? not(is_monthly_open and is_weekly_open) : true
can_draw_intra = is_intra_enabled
can_draw_intrah = is_intrarange_enabled
can_draw_intral = is_intrarange_enabled
can_draw_intram = is_intram_enabled
pricearray := array.new_float(0)
labelarray := array.new_label(0)
/////////////////////////////////
if is_londonrange_enabled
//label.new(bar_index,high)
london_limit_right = get_limit_right(DEFAULT_EXTEND_RIGHT)
if displayStyle == 'Right Anchored'
londontime := get_limit_right(radistance)
londontime
var londonh_line = line.new(x1=londontime, x2=london_limit_right, y1=flondonhigh, y2=flondonhigh, color=LondonColor, width=DEFAULT_LINE_WIDTH, xloc=xloc.bar_time, style=linestyles)
var londonl_line = line.new(x1=londontime, x2=london_limit_right, y1=flondonlow, y2=flondonlow, color=LondonColor, width=DEFAULT_LINE_WIDTH, xloc=xloc.bar_time, style=linestyles)
var londono_line = line.new(x1=londontime, x2=london_limit_right, y1=flondonopen, y2=flondonopen, color=LondonColor, width=DEFAULT_LINE_WIDTH, xloc=xloc.bar_time, style=linestyles)
var londonh_label = label.new(x=london_limit_right, y=flondonhigh, text=lhtext, style=DEFAULT_LABEL_STYLE, textcolor=LondonColor, size=DEFAULT_LABEL_SIZE, xloc=xloc.bar_time)
var londonl_label = label.new(x=london_limit_right, y=flondonlow, text=lltext, style=DEFAULT_LABEL_STYLE, textcolor=LondonColor, size=DEFAULT_LABEL_SIZE, xloc=xloc.bar_time)
var londono_label = label.new(x=london_limit_right, y=flondonopen, text=lotext, style=DEFAULT_LABEL_STYLE, textcolor=LondonColor, size=DEFAULT_LABEL_SIZE, xloc=xloc.bar_time)
line.set_x1(londonh_line, londontime)
line.set_x2(londonh_line, london_limit_right)
line.set_y1(londonh_line, flondonhigh)
line.set_y2(londonh_line, flondonhigh)
line.set_x1(londonl_line, londontime)
line.set_x2(londonl_line, london_limit_right)
line.set_y1(londonl_line, flondonlow)
line.set_y2(londonl_line, flondonlow)
line.set_x1(londono_line, londontime)
line.set_x2(londono_line, london_limit_right)
line.set_y1(londono_line, flondonopen)
line.set_y2(londono_line, flondonopen)
label.set_x(londonh_label, london_limit_right)
label.set_y(londonh_label, flondonhigh)
label.set_text(londonh_label, lhtext)
label.set_x(londonl_label, london_limit_right)
label.set_y(londonl_label, flondonlow)
label.set_text(londonl_label, lltext)
label.set_x(londono_label, london_limit_right)
label.set_y(londono_label, flondonopen)
label.set_text(londono_label, lotext)
if mergebool
f_LevelMerge(pricearray, labelarray, flondonhigh, londonh_label, LondonColor)
f_LevelMerge(pricearray, labelarray, flondonlow, londonl_label, LondonColor)
f_LevelMerge(pricearray, labelarray, flondonopen, londono_label, LondonColor)
//////////////////////////////////////////////////////////////////////////////////
/////////////////////////////////
if is_usrange_enabled
//label.new(bar_index,high)
us_limit_right = get_limit_right(DEFAULT_EXTEND_RIGHT)
if displayStyle == 'Right Anchored'
ustime := get_limit_right(radistance)
ustime
var ush_line = line.new(x1=ustime, x2=us_limit_right, y1=fushigh, y2=fushigh, color=USColor, width=DEFAULT_LINE_WIDTH, xloc=xloc.bar_time, style=linestyles)
var usl_line = line.new(x1=ustime, x2=us_limit_right, y1=fuslow, y2=fuslow, color=USColor, width=DEFAULT_LINE_WIDTH, xloc=xloc.bar_time, style=linestyles)
var uso_line = line.new(x1=ustime, x2=us_limit_right, y1=fusopen, y2=fusopen, color=USColor, width=DEFAULT_LINE_WIDTH, xloc=xloc.bar_time, style=linestyles)
var ush_label = label.new(x=us_limit_right, y=fushigh, text=lhtext, style=DEFAULT_LABEL_STYLE, textcolor=USColor, size=DEFAULT_LABEL_SIZE, xloc=xloc.bar_time)
var usl_label = label.new(x=us_limit_right, y=fuslow, text=lltext, style=DEFAULT_LABEL_STYLE, textcolor=USColor, size=DEFAULT_LABEL_SIZE, xloc=xloc.bar_time)
var uso_label = label.new(x=us_limit_right, y=fusopen, text=lotext, style=DEFAULT_LABEL_STYLE, textcolor=USColor, size=DEFAULT_LABEL_SIZE, xloc=xloc.bar_time)
line.set_x1(ush_line, ustime)
line.set_x2(ush_line, us_limit_right)
line.set_y1(ush_line, fushigh)
line.set_y2(ush_line, fushigh)
line.set_x1(usl_line, ustime)
line.set_x2(usl_line, us_limit_right)
line.set_y1(usl_line, fuslow)
line.set_y2(usl_line, fuslow)
line.set_x1(uso_line, ustime)
line.set_x2(uso_line, us_limit_right)
line.set_y1(uso_line, fusopen)
line.set_y2(uso_line, fusopen)
label.set_x(ush_label, us_limit_right)
label.set_y(ush_label, fushigh)
label.set_text(ush_label, ushtext)
label.set_x(usl_label, us_limit_right)
label.set_y(usl_label, fuslow)
label.set_text(usl_label, usltext)
label.set_x(uso_label, us_limit_right)
label.set_y(uso_label, fusopen)
label.set_text(uso_label, usotext)
if mergebool
f_LevelMerge(pricearray, labelarray, fushigh, ush_label, USColor)
f_LevelMerge(pricearray, labelarray, fuslow, usl_label, USColor)
f_LevelMerge(pricearray, labelarray, fusopen, uso_label, USColor)
/////////////////////////////////
if is_asiarange_enabled
//label.new(bar_index,high)
asia_limit_right = get_limit_right(DEFAULT_EXTEND_RIGHT)
if displayStyle == 'Right Anchored'
asiatime := get_limit_right(radistance)
asiatime
var asiah_line = line.new(x1=asiatime, x2=asia_limit_right, y1=fasiahigh, y2=fasiahigh, color=AsiaColor, width=DEFAULT_LINE_WIDTH, xloc=xloc.bar_time, style=linestyles)
var asial_line = line.new(x1=asiatime, x2=asia_limit_right, y1=fasialow, y2=fasialow, color=AsiaColor, width=DEFAULT_LINE_WIDTH, xloc=xloc.bar_time, style=linestyles)
var asiao_line = line.new(x1=asiatime, x2=asia_limit_right, y1=fasiaopen, y2=fasiaopen, color=AsiaColor, width=DEFAULT_LINE_WIDTH, xloc=xloc.bar_time, style=linestyles)
var asiah_label = label.new(x=asia_limit_right, y=fasiahigh, text=asiahtext, style=DEFAULT_LABEL_STYLE, textcolor=AsiaColor, size=DEFAULT_LABEL_SIZE, xloc=xloc.bar_time)
var asial_label = label.new(x=asia_limit_right, y=fasialow, text=asialtext, style=DEFAULT_LABEL_STYLE, textcolor=AsiaColor, size=DEFAULT_LABEL_SIZE, xloc=xloc.bar_time)
var asiao_label = label.new(x=asia_limit_right, y=fasiaopen, text=asiaotext, style=DEFAULT_LABEL_STYLE, textcolor=AsiaColor, size=DEFAULT_LABEL_SIZE, xloc=xloc.bar_time)
line.set_x1(asiah_line, asiatime)
line.set_x2(asiah_line, asia_limit_right)
line.set_y1(asiah_line, fasiahigh)
line.set_y2(asiah_line, fasiahigh)
line.set_x1(asial_line, asiatime)
line.set_x2(asial_line, asia_limit_right)
line.set_y1(asial_line, fasialow)
line.set_y2(asial_line, fasialow)
line.set_x1(asiao_line, asiatime)
line.set_x2(asiao_line, asia_limit_right)
line.set_y1(asiao_line, fasiaopen)
line.set_y2(asiao_line, fasiaopen)
label.set_x(asiah_label, asia_limit_right)
label.set_y(asiah_label, fasiahigh)
label.set_text(asiah_label, asiahtext)
label.set_x(asial_label, asia_limit_right)
label.set_y(asial_label, fasialow)
label.set_text(asial_label, asialtext)
label.set_x(asiao_label, asia_limit_right)
label.set_y(asiao_label, fasiaopen)
label.set_text(asiao_label, asiaotext)
if mergebool
f_LevelMerge(pricearray, labelarray, fasiahigh, asiah_label, AsiaColor)
f_LevelMerge(pricearray, labelarray, fasialow, asial_label, AsiaColor)
f_LevelMerge(pricearray, labelarray, fasiaopen, asiao_label, AsiaColor)
//////////////////////////////////////////////////////////////////////////////////
//////////////////////////////////////////////////////////////////////////////////
if can_draw_intra
intra_limit_right = get_limit_right(DEFAULT_EXTEND_RIGHT)
if displayStyle == 'Right Anchored'
intra_time := get_limit_right(radistance)
intra_time
var intra_line = line.new(x1=intra_time, x2=intra_limit_right, y1=intra_open, y2=intra_open, color=IntraColor, width=DEFAULT_LINE_WIDTH, xloc=xloc.bar_time, style=linestyles)
var intra_label = label.new(x=intra_limit_right, y=intra_open, text=iotext, style=DEFAULT_LABEL_STYLE, textcolor=IntraColor, size=DEFAULT_LABEL_SIZE, xloc=xloc.bar_time)
line.set_x1(intra_line, intra_time)
line.set_x2(intra_line, intra_limit_right)
line.set_y1(intra_line, intra_open)
line.set_y2(intra_line, intra_open)
label.set_x(intra_label, intra_limit_right)
label.set_y(intra_label, intra_open)
label.set_text(intra_label, iotext)
if mergebool
f_LevelMerge(pricearray, labelarray, intra_open, intra_label, IntraColor)
//////////////////////////////////////////////////////////////////////////////////
//HIGH HIGH HIGH HIGH HIGH HIGH HIGH HIGH HIGH HIGH HIGH HIGH HIGH HIGH HIGH HIGH
if can_draw_intrah
intrah_limit_right = get_limit_right(DEFAULT_EXTEND_RIGHT)
if displayStyle == 'Right Anchored'
intrah_time := get_limit_right(radistance)
intrah_time
var intrah_line = line.new(x1=intrah_time, x2=intrah_limit_right, y1=intrah_open, y2=intrah_open, color=IntraColor, width=DEFAULT_LINE_WIDTH, xloc=xloc.bar_time, style=linestyles)
var intrah_label = label.new(x=intrah_limit_right, y=intrah_open, text=pihtext, style=DEFAULT_LABEL_STYLE, textcolor=IntraColor, size=DEFAULT_LABEL_SIZE, xloc=xloc.bar_time)
line.set_x1(intrah_line, intrah_time)
line.set_x2(intrah_line, intrah_limit_right)
line.set_y1(intrah_line, intrah_open)
line.set_y2(intrah_line, intrah_open)
label.set_x(intrah_label, intrah_limit_right)
label.set_y(intrah_label, intrah_open)
label.set_text(intrah_label, pihtext)
if mergebool
f_LevelMerge(pricearray, labelarray, intrah_open, intrah_label, IntraColor)
//////////////////////////////////////////////////////////////////////////////////
//LOW LOW LOW LOW LOW LOW LOW LOW LOW LOW LOW LOW LOW LOW LOW LOW
if can_draw_intral
intral_limit_right = get_limit_right(DEFAULT_EXTEND_RIGHT)
if displayStyle == 'Right Anchored'
intral_time := get_limit_right(radistance)
intral_time
var intral_line = line.new(x1=intral_time, x2=intral_limit_right, y1=intral_open, y2=intral_open, color=IntraColor, width=DEFAULT_LINE_WIDTH, xloc=xloc.bar_time, style=linestyles)
var intral_label = label.new(x=intral_limit_right, y=intral_open, text=piltext, style=DEFAULT_LABEL_STYLE, textcolor=IntraColor, size=DEFAULT_LABEL_SIZE, xloc=xloc.bar_time)
line.set_x1(intral_line, intral_time)
line.set_x2(intral_line, intral_limit_right)
line.set_y1(intral_line, intral_open)
line.set_y2(intral_line, intral_open)
label.set_x(intral_label, intral_limit_right)
label.set_y(intral_label, intral_open)
label.set_text(intral_label, piltext)
if mergebool
f_LevelMerge(pricearray, labelarray, intral_open, intral_label, IntraColor)
///////////////////////////////////////////////////////////////////////////////
if can_draw_intram
intram_limit_right = get_limit_right(DEFAULT_EXTEND_RIGHT)
intram_time = intrah_time
intram_open = (intral_open + intrah_open) / 2
if displayStyle == 'Right Anchored'
intram_time := get_limit_right(radistance)
intram_time
var intram_line = line.new(x1=intram_time, x2=intram_limit_right, y1=intram_open, y2=intram_open, color=IntraColor, width=DEFAULT_LINE_WIDTH, xloc=xloc.bar_time, style=linestyles)
var intram_label = label.new(x=intram_limit_right, y=intram_open, text=pimtext, style=DEFAULT_LABEL_STYLE, textcolor=IntraColor, size=DEFAULT_LABEL_SIZE, xloc=xloc.bar_time)
line.set_x1(intram_line, intram_time)
line.set_x2(intram_line, intram_limit_right)
line.set_y1(intram_line, intram_open)
line.set_y2(intram_line, intram_open)
label.set_x(intram_label, intram_limit_right)
label.set_y(intram_label, intram_open)
label.set_text(intram_label, pimtext)
if mergebool
f_LevelMerge(pricearray, labelarray, intram_open, intram_label, IntraColor)
////////////////////////////////////////// MONDAY
if is_monday_enabled
monday_limit_right = get_limit_right(DEFAULT_EXTEND_RIGHT)
if displayStyle == 'Right Anchored'
monday_time := get_limit_right(radistance)
monday_time
var monday_line = line.new(x1=monday_time, x2=monday_limit_right, y1=monday_high, y2=monday_high, color=MondayColor, width=DEFAULT_LINE_WIDTH, xloc=xloc.bar_time, style=linestyles)
var monday_label = label.new(x=monday_limit_right, y=monday_high, text=pmonhtext, style=DEFAULT_LABEL_STYLE, textcolor=MondayColor, size=DEFAULT_LABEL_SIZE, xloc=xloc.bar_time)
line.set_x1(monday_line, monday_time)
line.set_x2(monday_line, monday_limit_right)
line.set_y1(monday_line, monday_high)
line.set_y2(monday_line, monday_high)
label.set_x(monday_label, monday_limit_right)
label.set_y(monday_label, monday_high)
label.set_text(monday_label, pmonhtext)
if mergebool
f_LevelMerge(pricearray, labelarray, monday_high, monday_label, MondayColor)
if is_monday_enabled
monday_limit_right = get_limit_right(DEFAULT_EXTEND_RIGHT)
if displayStyle == 'Right Anchored'
monday_time := get_limit_right(radistance)
monday_time
var monday_low_line = line.new(x1=monday_time, x2=monday_limit_right, y1=monday_low, y2=monday_low, color=MondayColor, width=DEFAULT_LINE_WIDTH, xloc=xloc.bar_time, style=linestyles)
var monday_low_label = label.new(x=monday_limit_right, y=monday_low, text=pmonltext, style=DEFAULT_LABEL_STYLE, textcolor=MondayColor, size=DEFAULT_LABEL_SIZE, xloc=xloc.bar_time)
line.set_x1(monday_low_line, monday_time)
line.set_x2(monday_low_line, monday_limit_right)
line.set_y1(monday_low_line, monday_low)
line.set_y2(monday_low_line, monday_low)
label.set_x(monday_low_label, monday_limit_right)
label.set_y(monday_low_label, monday_low)
label.set_text(monday_low_label, pmonltext)
if mergebool
f_LevelMerge(pricearray, labelarray, monday_low, monday_low_label, MondayColor)
if is_monday_mid
mondaym_limit_right = get_limit_right(DEFAULT_EXTEND_RIGHT)
mondaym_open = (monday_high + monday_low) / 2
if displayStyle == 'Right Anchored'
monday_time := get_limit_right(radistance)
monday_time
var mondaym_line = line.new(x1=monday_time, x2=mondaym_limit_right, y1=mondaym_open, y2=mondaym_open, color=MondayColor, width=DEFAULT_LINE_WIDTH, xloc=xloc.bar_time, style=linestyles)
var mondaym_label = label.new(x=mondaym_limit_right, y=mondaym_open, text=pmonmtext, style=DEFAULT_LABEL_STYLE, textcolor=MondayColor, size=DEFAULT_LABEL_SIZE, xloc=xloc.bar_time)
line.set_x1(mondaym_line, monday_time)
line.set_x2(mondaym_line, mondaym_limit_right)
line.set_y1(mondaym_line, mondaym_open)
line.set_y2(mondaym_line, mondaym_open)
label.set_x(mondaym_label, mondaym_limit_right)
label.set_y(mondaym_label, mondaym_open)
label.set_text(mondaym_label, pmonmtext)
if mergebool
f_LevelMerge(pricearray, labelarray, mondaym_open, mondaym_label, MondayColor)
//////////////////////////////////////////////////////////////////////////////////
////////////////////////DAILY OPEN DAILY OPEN DAILY OPEN DAILY OPEN DAILY OPEN DAILY OPEN DAILY OPEN
if is_daily_enabled
daily_limit_right = get_limit_right(DEFAULT_EXTEND_RIGHT)
if displayStyle == 'Right Anchored'
daily_time := get_limit_right(radistance)
daily_time
var daily_line = line.new(x1=daily_time, x2=daily_limit_right, y1=daily_open, y2=daily_open, color=DailyColor, width=DEFAULT_LINE_WIDTH, xloc=xloc.bar_time, style=linestyles)
var daily_label = label.new(x=daily_limit_right, y=daily_open, text=dotext, style=DEFAULT_LABEL_STYLE, textcolor=DailyColor, size=DEFAULT_LABEL_SIZE, xloc=xloc.bar_time)
line.set_x1(daily_line, daily_time)
line.set_x2(daily_line, daily_limit_right)
line.set_y1(daily_line, daily_open)
line.set_y2(daily_line, daily_open)
label.set_x(daily_label, daily_limit_right)
label.set_y(daily_label, daily_open)
label.set_text(daily_label, dotext)
if mergebool
f_LevelMerge(pricearray, labelarray, daily_open, daily_label, DailyColor)
//////////////////////////////////////////////////////////////////////////////////
//////////////////DAILY HIGH DAILY HIGH DAILY HIGH DAILY HIGH DAILY HIGH DAILY HIGH DAILY HIGH
if is_dailyrange_enabled
dailyh_limit_right = get_limit_right(DEFAULT_EXTEND_RIGHT)
if displayStyle == 'Right Anchored'
dailyh_time := get_limit_right(radistance)
dailyh_time
// draw tails before lines for better visual
var dailyh_line = line.new(x1=dailyh_time, x2=dailyh_limit_right, y1=dailyh_open, y2=dailyh_open, color=DailyColor, width=DEFAULT_LINE_WIDTH, xloc=xloc.bar_time, style=linestyles)
var dailyh_label = label.new(x=dailyh_limit_right, y=dailyh_open, text=pdhtext, style=DEFAULT_LABEL_STYLE, textcolor=DailyColor, size=DEFAULT_LABEL_SIZE, xloc=xloc.bar_time)
line.set_x1(dailyh_line, dailyh_time)
line.set_x2(dailyh_line, dailyh_limit_right)
line.set_y1(dailyh_line, dailyh_open)
line.set_y2(dailyh_line, dailyh_open)
label.set_x(dailyh_label, dailyh_limit_right)
label.set_y(dailyh_label, dailyh_open)
label.set_text(dailyh_label, pdhtext)
if mergebool
f_LevelMerge(pricearray, labelarray, dailyh_open, dailyh_label, DailyColor)
//////////////////////////////////////////////////////////////////////////////////
//////////////////DAILY LOW DAILY LOW DAILY LOW DAILY LOW DAILY LOW DAILY LOW DAILY LOW DAILY LOW
if is_dailyrange_enabled
dailyl_limit_right = get_limit_right(DEFAULT_EXTEND_RIGHT)
if displayStyle == 'Right Anchored'
dailyl_time := get_limit_right(radistance)
dailyl_time
var dailyl_line = line.new(x1=dailyl_time, x2=dailyl_limit_right, y1=dailyl_open, y2=dailyl_open, color=DailyColor, width=DEFAULT_LINE_WIDTH, xloc=xloc.bar_time, style=linestyles)
var dailyl_label = label.new(x=dailyl_limit_right, y=dailyl_open, text=pdltext, style=DEFAULT_LABEL_STYLE, textcolor=DailyColor, size=DEFAULT_LABEL_SIZE, xloc=xloc.bar_time)
line.set_x1(dailyl_line, dailyl_time)
line.set_x2(dailyl_line, dailyl_limit_right)
line.set_y1(dailyl_line, dailyl_open)
line.set_y2(dailyl_line, dailyl_open)
label.set_x(dailyl_label, dailyl_limit_right)
label.set_y(dailyl_label, dailyl_open)
label.set_text(dailyl_label, pdltext)
if mergebool
f_LevelMerge(pricearray, labelarray, dailyl_open, dailyl_label, DailyColor)
//////////////////////////////////////////////////////////////////////////////// Daily MID
if is_dailym_enabled
dailym_limit_right = get_limit_right(DEFAULT_EXTEND_RIGHT)
dailym_time = dailyh_time
dailym_open = (dailyl_open + dailyh_open) / 2
if displayStyle == 'Right Anchored'
dailym_time := get_limit_right(radistance)
dailym_time
var dailym_line = line.new(x1=dailym_time, x2=dailym_limit_right, y1=dailym_open, y2=dailym_open, color=DailyColor, width=DEFAULT_LINE_WIDTH, xloc=xloc.bar_time, style=linestyles)
var dailym_label = label.new(x=dailym_limit_right, y=dailym_open, text=pdmtext, style=DEFAULT_LABEL_STYLE, textcolor=DailyColor, size=DEFAULT_LABEL_SIZE, xloc=xloc.bar_time)
line.set_x1(dailym_line, dailym_time)
line.set_x2(dailym_line, dailym_limit_right)
line.set_y1(dailym_line, dailym_open)
line.set_y2(dailym_line, dailym_open)
label.set_x(dailym_label, dailym_limit_right)
label.set_y(dailym_label, dailym_open)
label.set_text(dailym_label, pdmtext)
if mergebool
f_LevelMerge(pricearray, labelarray, dailym_open, dailym_label, DailyColor)
//////////////////////////////////////////////////////////////////////////////////
if is_weekly_enabled
weekly_limit_right = get_limit_right(DEFAULT_EXTEND_RIGHT)
cweekly_time = weekly_time
if displayStyle == 'Right Anchored'
cweekly_time := get_limit_right(radistance)
cweekly_time
var weekly_line = line.new(x1=cweekly_time, x2=weekly_limit_right, y1=weekly_open, y2=weekly_open, color=WeeklyColor, width=DEFAULT_LINE_WIDTH, xloc=xloc.bar_time, style=linestyles)
var weekly_label = label.new(x=weekly_limit_right, y=weekly_open, text=wotext, style=DEFAULT_LABEL_STYLE, textcolor=WeeklyColor, size=DEFAULT_LABEL_SIZE, xloc=xloc.bar_time)
line.set_x1(weekly_line, cweekly_time)
line.set_x2(weekly_line, weekly_limit_right)
line.set_y1(weekly_line, weekly_open)
line.set_y2(weekly_line, weekly_open)
label.set_x(weekly_label, weekly_limit_right)
label.set_y(weekly_label, weekly_open)
label.set_text(weekly_label, wotext)
if mergebool
f_LevelMerge(pricearray, labelarray, weekly_open, weekly_label, WeeklyColor)
// the weekly open can be the daily open too (monday)
// only the weekly will be draw, in these case we update its label
// if is_weekly_open and can_show_daily
// label.set_text(weekly_label, "DO / WO ")
//////////////////////////////////////////////////////////////////////////////////
////////////////////////////////////////////////////////////////////////////////// WEEKLY HIGH WEEKLY HIGH WEEKLY HIGH
if is_weeklyrange_enabled
weeklyh_limit_right = get_limit_right(DEFAULT_EXTEND_RIGHT)
if displayStyle == 'Right Anchored'
weeklyh_time := get_limit_right(radistance)
weeklyh_time
var weeklyh_line = line.new(x1=weeklyh_time, x2=weeklyh_limit_right, y1=weeklyh_open, y2=weeklyh_open, color=WeeklyColor, width=DEFAULT_LINE_WIDTH, xloc=xloc.bar_time, style=linestyles)
var weeklyh_label = label.new(x=weeklyh_limit_right, y=weeklyh_open, text=pwhtext, style=DEFAULT_LABEL_STYLE, textcolor=WeeklyColor, size=DEFAULT_LABEL_SIZE, xloc=xloc.bar_time)
line.set_x1(weeklyh_line, weeklyh_time)
line.set_x2(weeklyh_line, weeklyh_limit_right)
line.set_y1(weeklyh_line, weeklyh_open)
line.set_y2(weeklyh_line, weeklyh_open)
label.set_x(weeklyh_label, weeklyh_limit_right)
label.set_y(weeklyh_label, weeklyh_open)
label.set_text(weeklyh_label, pwhtext)
if mergebool
f_LevelMerge(pricearray, labelarray, weeklyh_open, weeklyh_label, WeeklyColor)
//////////////////////////////////////////////////////////////////////////////////
////////////////////////////////////////////////////////////////////////////////// WEEKLY LOW WEEKLY LOW WEEKLY LOW
if is_weeklyrange_enabled
weeklyl_limit_right = get_limit_right(DEFAULT_EXTEND_RIGHT)
if displayStyle == 'Right Anchored'
weeklyl_time := get_limit_right(radistance)
weeklyl_time
var weeklyl_line = line.new(x1=weeklyl_time, x2=weeklyl_limit_right, y1=weekly_open, y2=weekly_open, color=WeeklyColor, width=DEFAULT_LINE_WIDTH, xloc=xloc.bar_time, style=linestyles)
var weeklyl_label = label.new(x=weeklyl_limit_right, y=weeklyl_open, text=pwltext, style=DEFAULT_LABEL_STYLE, textcolor=WeeklyColor, size=DEFAULT_LABEL_SIZE, xloc=xloc.bar_time)
line.set_x1(weeklyl_line, weeklyl_time)
line.set_x2(weeklyl_line, weeklyl_limit_right)
line.set_y1(weeklyl_line, weeklyl_open)
line.set_y2(weeklyl_line, weeklyl_open)
label.set_x(weeklyl_label, weeklyl_limit_right)
label.set_y(weeklyl_label, weeklyl_open)
label.set_text(weeklyl_label, pwltext)
if mergebool
f_LevelMerge(pricearray, labelarray, weeklyl_open, weeklyl_label, WeeklyColor)
//////////////////////////////////////////////////////////////////////////////////
//////////////////////////////////////////////////////////////////////////////// Weekly MID
if is_weekly_mid
weeklym_limit_right = get_limit_right(DEFAULT_EXTEND_RIGHT)
weeklym_time = weeklyh_time
weeklym_open = (weeklyl_open + weeklyh_open) / 2
if displayStyle == 'Right Anchored'
weeklym_time := get_limit_right(radistance)
weeklym_time
var weeklym_line = line.new(x1=weeklym_time, x2=weeklym_limit_right, y1=weeklym_open, y2=weeklym_open, color=WeeklyColor, width=DEFAULT_LINE_WIDTH, xloc=xloc.bar_time, style=linestyles)
var weeklym_label = label.new(x=weeklym_limit_right, y=weeklym_open, text=pwmtext, style=DEFAULT_LABEL_STYLE, textcolor=WeeklyColor, size=DEFAULT_LABEL_SIZE, xloc=xloc.bar_time)
line.set_x1(weeklym_line, weeklym_time)
line.set_x2(weeklym_line, weeklym_limit_right)
line.set_y1(weeklym_line, weeklym_open)
line.set_y2(weeklym_line, weeklym_open)
label.set_x(weeklym_label, weeklym_limit_right)
label.set_y(weeklym_label, weeklym_open)
label.set_text(weeklym_label, pwmtext)
if mergebool
f_LevelMerge(pricearray, labelarray, weeklym_open, weeklym_label, WeeklyColor)
////////////////////////////////////////////////////////////////////////////////// YEEEAARRLLYY LOW LOW LOW
if is_yearlyrange_enabled
yearlyl_limit_right = get_limit_right(DEFAULT_EXTEND_RIGHT)
if displayStyle == 'Right Anchored'
yearlyl_time := get_limit_right(radistance)
yearlyl_time
var yearlyl_line = line.new(x1=yearlyl_time, x2=yearlyl_limit_right, y1=yearlyl_open, y2=yearlyl_open, color=YearlyColor, width=DEFAULT_LINE_WIDTH, xloc=xloc.bar_time, style=linestyles)
var yearlyl_label = label.new(x=yearlyl_limit_right, y=yearlyl_open, text=cyltext, style=DEFAULT_LABEL_STYLE, textcolor=YearlyColor, size=DEFAULT_LABEL_SIZE, xloc=xloc.bar_time)
line.set_x1(yearlyl_line, yearlyl_time)
line.set_x2(yearlyl_line, yearlyl_limit_right)
line.set_y1(yearlyl_line, yearlyl_open)
line.set_y2(yearlyl_line, yearlyl_open)
label.set_x(yearlyl_label, yearlyl_limit_right)
label.set_y(yearlyl_label, yearlyl_open)
label.set_text(yearlyl_label, cyltext)
if mergebool
f_LevelMerge(pricearray, labelarray, yearlyl_open, yearlyl_label, YearlyColor)
//////////////////////////////////////////////////////////////////////////////////
////////////////////////////////////////////////////////////////////////////////// YEEEAARRLLYY HIGH HIGH HIGH
if is_yearlyrange_enabled
yearlyh_limit_right = get_limit_right(DEFAULT_EXTEND_RIGHT)
if displayStyle == 'Right Anchored'
yearlyh_time := get_limit_right(radistance)
yearlyh_time
var yearlyh_line = line.new(x1=yearlyh_time, x2=yearlyh_limit_right, y1=yearlyh_open, y2=yearlyh_open, color=YearlyColor, width=DEFAULT_LINE_WIDTH, xloc=xloc.bar_time, style=linestyles)
var yearlyh_label = label.new(x=yearlyh_limit_right, y=yearlyh_open, text=cyhtext, style=DEFAULT_LABEL_STYLE, textcolor=YearlyColor, size=DEFAULT_LABEL_SIZE, xloc=xloc.bar_time)
line.set_x1(yearlyh_line, yearlyh_time)
line.set_x2(yearlyh_line, yearlyh_limit_right)
line.set_y1(yearlyh_line, yearlyh_open)
line.set_y2(yearlyh_line, yearlyh_open)
label.set_x(yearlyh_label, yearlyh_limit_right)
label.set_y(yearlyh_label, yearlyh_open)
label.set_text(yearlyh_label, cyhtext)
if mergebool
f_LevelMerge(pricearray, labelarray, yearlyh_open, yearlyh_label, YearlyColor)
//////////////////////////////////////////////////////////////////////////////////
////////////////////////////////////////////////////////////////////////////////// YEEEAARRLLYY OPEN
if is_yearly_enabled
yearly_limit_right = get_limit_right(DEFAULT_EXTEND_RIGHT)
if displayStyle == 'Right Anchored'
yearly_time := get_limit_right(radistance)
yearly_time
var yearly_line = line.new(x1=yearly_time, x2=yearly_limit_right, y1=yearly_open, y2=yearly_open, color=YearlyColor, width=DEFAULT_LINE_WIDTH, xloc=xloc.bar_time, style=linestyles)
var yearly_label = label.new(x=yearly_limit_right, y=yearly_open, text=yotext, style=DEFAULT_LABEL_STYLE, textcolor=YearlyColor, size=DEFAULT_LABEL_SIZE, xloc=xloc.bar_time)
line.set_x1(yearly_line, yearly_time)
line.set_x2(yearly_line, yearly_limit_right)
line.set_y1(yearly_line, yearly_open)
line.set_y2(yearly_line, yearly_open)
label.set_x(yearly_label, yearly_limit_right)
label.set_y(yearly_label, yearly_open)
label.set_text(yearly_label, yotext)
if mergebool
f_LevelMerge(pricearray, labelarray, yearly_open, yearly_label, YearlyColor)
//////////////////////////////////////////////////////////////////////////////////
//////////////////////////////////////////////////////////////////////////////// yearly MID
if is_yearly_mid
yearlym_limit_right = get_limit_right(DEFAULT_EXTEND_RIGHT)
yearlym_time = yearlyh_time
yearlym_open = (yearlyl_open + yearlyh_open) / 2
if displayStyle == 'Right Anchored'
yearlym_time := get_limit_right(radistance)
yearlym_time
var yearlym_line = line.new(x1=yearlym_time, x2=yearlym_limit_right, y1=yearlym_open, y2=yearlym_open, color=YearlyColor, width=DEFAULT_LINE_WIDTH, xloc=xloc.bar_time, style=linestyles)
var yearlym_label = label.new(x=yearlym_limit_right, y=yearlym_open, text=cymtext, style=DEFAULT_LABEL_STYLE, textcolor=YearlyColor, size=DEFAULT_LABEL_SIZE, xloc=xloc.bar_time)
line.set_x1(yearlym_line, yearlym_time)
line.set_x2(yearlym_line, yearlym_limit_right)
line.set_y1(yearlym_line, yearlym_open)
line.set_y2(yearlym_line, yearlym_open)
label.set_x(yearlym_label, yearlym_limit_right)
label.set_y(yearlym_label, yearlym_open)
label.set_text(yearlym_label, cymtext)
if mergebool
f_LevelMerge(pricearray, labelarray, yearlym_open, yearlym_label, YearlyColor)
////////////////////////////////////////////////////////////////////////////////// QUATERLLYYYYY OPEN
if is_quarterly_enabled
quarterly_limit_right = get_limit_right(DEFAULT_EXTEND_RIGHT)
if displayStyle == 'Right Anchored'
quarterly_time := get_limit_right(radistance)
quarterly_time
var quarterly_line = line.new(x1=quarterly_time, x2=quarterly_limit_right, y1=quarterly_open, y2=quarterly_open, color=quarterlyColor, width=DEFAULT_LINE_WIDTH, xloc=xloc.bar_time, style=linestyles)
var quarterly_label = label.new(x=quarterly_limit_right, y=quarterly_open, text=qotext, style=DEFAULT_LABEL_STYLE, textcolor=quarterlyColor, size=DEFAULT_LABEL_SIZE, xloc=xloc.bar_time)
line.set_x1(quarterly_line, quarterly_time)
line.set_x2(quarterly_line, quarterly_limit_right)
line.set_y1(quarterly_line, quarterly_open)
line.set_y2(quarterly_line, quarterly_open)
label.set_x(quarterly_label, quarterly_limit_right)
label.set_y(quarterly_label, quarterly_open)
label.set_text(quarterly_label, qotext)
if mergebool
f_LevelMerge(pricearray, labelarray, quarterly_open, quarterly_label, quarterlyColor)
//////////////////////////////////////////////////////////////////////////////////
////////////////////////////////////////////////////////////////////////////////// QUATERLLYYYYY High
if is_quarterlyrange_enabled
quarterlyh_limit_right = get_limit_right(DEFAULT_EXTEND_RIGHT)
if displayStyle == 'Right Anchored'
quarterlyh_time := get_limit_right(radistance)
quarterlyh_time
var quarterlyh_line = line.new(x1=quarterlyh_time, x2=quarterlyh_limit_right, y1=quarterlyh_open, y2=quarterlyh_open, color=quarterlyColor, width=DEFAULT_LINE_WIDTH, xloc=xloc.bar_time, style=linestyles)
var quarterlyh_label = label.new(x=quarterlyh_limit_right, y=quarterlyh_open, text=pqhtext, style=DEFAULT_LABEL_STYLE, textcolor=quarterlyColor, size=DEFAULT_LABEL_SIZE, xloc=xloc.bar_time)
line.set_x1(quarterlyh_line, quarterlyh_time)
line.set_x2(quarterlyh_line, quarterlyh_limit_right)
line.set_y1(quarterlyh_line, quarterlyh_open)
line.set_y2(quarterlyh_line, quarterlyh_open)
label.set_x(quarterlyh_label, quarterlyh_limit_right)
label.set_y(quarterlyh_label, quarterlyh_open)
label.set_text(quarterlyh_label, pqhtext)
if mergebool
f_LevelMerge(pricearray, labelarray, quarterlyh_open, quarterlyh_label, quarterlyColor)
//////////////////////////////////////////////////////////////////////////////////
////////////////////////////////////////////////////////////////////////////////// QUATERLLYYYYY Low
if is_quarterlyrange_enabled
quarterlyl_limit_right = get_limit_right(DEFAULT_EXTEND_RIGHT)
if displayStyle == 'Right Anchored'
quarterlyl_time := get_limit_right(radistance)
quarterlyl_time
var quarterlyl_line = line.new(x1=quarterlyl_time, x2=quarterlyl_limit_right, y1=quarterlyl_open, y2=quarterlyl_open, color=quarterlyColor, width=DEFAULT_LINE_WIDTH, xloc=xloc.bar_time, style=linestyles)
var quarterlyl_label = label.new(x=quarterlyl_limit_right, y=quarterlyl_open, text=pqltext, style=DEFAULT_LABEL_STYLE, textcolor=quarterlyColor, size=DEFAULT_LABEL_SIZE, xloc=xloc.bar_time)
line.set_x1(quarterlyl_line, quarterlyl_time)
line.set_x2(quarterlyl_line, quarterlyl_limit_right)
line.set_y1(quarterlyl_line, quarterlyl_open)
line.set_y2(quarterlyl_line, quarterlyl_open)
label.set_x(quarterlyl_label, quarterlyl_limit_right)
label.set_y(quarterlyl_label, quarterlyl_open)
label.set_text(quarterlyl_label, pqltext)
if mergebool
f_LevelMerge(pricearray, labelarray, quarterlyl_open, quarterlyl_label, quarterlyColor)
//////////////////////////////////////////////////////////////////////////////////
//////////////////////////////////////////////////////////////////////////////// QUATERLLYYYYY MID
if is_quarterly_mid
quarterlym_limit_right = get_limit_right(DEFAULT_EXTEND_RIGHT)
quarterlym_time = quarterlyh_time
quarterlym_open = (quarterlyl_open + quarterlyh_open) / 2
if displayStyle == 'Right Anchored'
quarterlym_time := get_limit_right(radistance)
quarterlym_time
var quarterlym_line = line.new(x1=quarterlym_time, x2=quarterlym_limit_right, y1=quarterlym_open, y2=quarterlym_open, color=quarterlyColor, width=DEFAULT_LINE_WIDTH, xloc=xloc.bar_time, style=linestyles)
var quarterlym_label = label.new(x=quarterlym_limit_right, y=quarterlym_open, text=pqmtext, style=DEFAULT_LABEL_STYLE, textcolor=quarterlyColor, size=DEFAULT_LABEL_SIZE, xloc=xloc.bar_time)
line.set_x1(quarterlym_line, quarterlym_time)
line.set_x2(quarterlym_line, quarterlym_limit_right)
line.set_y1(quarterlym_line, quarterlym_open)
line.set_y2(quarterlym_line, quarterlym_open)
label.set_x(quarterlym_label, quarterlym_limit_right)
label.set_y(quarterlym_label, quarterlym_open)
label.set_text(quarterlym_label, pqmtext)
if mergebool
f_LevelMerge(pricearray, labelarray, quarterlym_open, quarterlym_label, quarterlyColor)
////////////////////////////////////////////////////////////////////////////////// Monthly LOW LOW LOW
if is_monthlyrange_enabled
monthlyl_limit_right = get_limit_right(DEFAULT_EXTEND_RIGHT)
if displayStyle == 'Right Anchored'
monthlyl_time := get_limit_right(radistance)
monthlyl_time
var monthlyl_line = line.new(x1=monthlyl_time, x2=monthlyl_limit_right, y1=monthlyl_open, y2=monthlyl_open, color=MonthlyColor, width=DEFAULT_LINE_WIDTH, xloc=xloc.bar_time, style=linestyles)
var monthlyl_label = label.new(x=monthlyl_limit_right, y=monthlyl_open, text=pmltext, style=DEFAULT_LABEL_STYLE, textcolor=MonthlyColor, size=DEFAULT_LABEL_SIZE, xloc=xloc.bar_time)
line.set_x1(monthlyl_line, monthlyl_time)
line.set_x2(monthlyl_line, monthlyl_limit_right)
line.set_y1(monthlyl_line, monthlyl_open)
line.set_y2(monthlyl_line, monthlyl_open)
label.set_x(monthlyl_label, monthlyl_limit_right)
label.set_y(monthlyl_label, monthlyl_open)
label.set_text(monthlyl_label, pmltext)
if mergebool
f_LevelMerge(pricearray, labelarray, monthlyl_open, monthlyl_label, MonthlyColor)
// the weekly open can be the daily open too (monday)
// only the weekly will be draw, in these case we update its label
//////////////////////////////////////////////////////////////////////////////////
////////////////////////////////////////////////////////////////////////////////// MONTHLY HIGH HIGH HIGH
if is_monthlyrange_enabled
monthlyh_limit_right = get_limit_right(DEFAULT_EXTEND_RIGHT)
if displayStyle == 'Right Anchored'
monthlyh_time := get_limit_right(radistance)
monthlyh_time
var monthlyh_line = line.new(x1=monthlyh_time, x2=monthlyh_limit_right, y1=monthlyh_open, y2=monthlyh_open, color=MonthlyColor, width=DEFAULT_LINE_WIDTH, xloc=xloc.bar_time, style=linestyles)
var monthlyh_label = label.new(x=monthlyh_limit_right, y=monthlyh_open, text=pmhtext, style=DEFAULT_LABEL_STYLE, textcolor=MonthlyColor, size=DEFAULT_LABEL_SIZE, xloc=xloc.bar_time)
line.set_x1(monthlyh_line, monthlyl_time)
line.set_x2(monthlyh_line, monthlyh_limit_right)
line.set_y1(monthlyh_line, monthlyh_open)
line.set_y2(monthlyh_line, monthlyh_open)
label.set_x(monthlyh_label, monthlyh_limit_right)
label.set_y(monthlyh_label, monthlyh_open)
label.set_text(monthlyh_label, pmhtext)
if mergebool
f_LevelMerge(pricearray, labelarray, monthlyh_open, monthlyh_label, MonthlyColor)
// the weekly open can be the daily open too (monday)
// only the weekly will be draw, in these case we update its label
//////////////////////////////////////////////////////////////////////////////// MONTHLY MID
if is_monthly_mid
monthlym_limit_right = get_limit_right(DEFAULT_EXTEND_RIGHT)
monthlym_time = monthlyh_time
monthlym_open = (monthlyl_open + monthlyh_open) / 2
if displayStyle == 'Right Anchored'
monthlym_time := get_limit_right(radistance)
monthlym_time
var monthlym_line = line.new(x1=monthlym_time, x2=monthlym_limit_right, y1=monthlym_open, y2=monthlym_open, color=MonthlyColor, width=DEFAULT_LINE_WIDTH, xloc=xloc.bar_time, style=linestyles)
var monthlym_label = label.new(x=monthlym_limit_right, y=monthlym_open, text=pmmtext, style=DEFAULT_LABEL_STYLE, textcolor=MonthlyColor, size=DEFAULT_LABEL_SIZE, xloc=xloc.bar_time)
line.set_x1(monthlym_line, monthlym_time)
line.set_x2(monthlym_line, monthlym_limit_right)
line.set_y1(monthlym_line, monthlym_open)
line.set_y2(monthlym_line, monthlym_open)
label.set_x(monthlym_label, monthlym_limit_right)
label.set_y(monthlym_label, monthlym_open)
label.set_text(monthlym_label, pmmtext)
if mergebool
f_LevelMerge(pricearray, labelarray, monthlym_open, monthlym_label, MonthlyColor)
//////////////////////////////////////////////////////////////////////////////////
if is_monthly_enabled
monthly_limit_right = get_limit_right(DEFAULT_EXTEND_RIGHT)
if displayStyle == 'Right Anchored'
monthly_time := get_limit_right(radistance)
monthly_time
var monthlyLine = line.new(x1=monthly_time, x2=monthly_limit_right, y1=monthly_open, y2=monthly_open, color=MonthlyColor, width=DEFAULT_LINE_WIDTH, xloc=xloc.bar_time, style=linestyles)
var monthlyLabel = label.new(x=monthly_limit_right, y=monthly_open, text=motext, style=DEFAULT_LABEL_STYLE, textcolor=MonthlyColor, size=DEFAULT_LABEL_SIZE, xloc=xloc.bar_time)
line.set_x1(monthlyLine, monthly_time)
line.set_x2(monthlyLine, monthly_limit_right)
line.set_y1(monthlyLine, monthly_open)
line.set_y2(monthlyLine, monthly_open)
label.set_x(monthlyLabel, monthly_limit_right)
label.set_y(monthlyLabel, monthly_open)
label.set_text(monthlyLabel, motext)
if mergebool
f_LevelMerge(pricearray, labelarray, monthly_open, monthlyLabel, MonthlyColor)
/////////////////////////////////////////////////////////////////////////////
// the monthly open can be the weekly open (monday 1st) and/or daily open too
// only the monthly will be draw, in these case we update its label
// if is_monthly_open
// if can_show_daily
// label.set_text(monthlyLabel, "DO / MO ")
// if is_weekly_open
// if can_show_weekly
// label.set_text(monthlyLabel, "WO / MO ")
// if can_show_daily and can_show_weekly
// label.set_text(monthlyLabel, "DO / WO / MO ")
// the start of the line is drew from the first week of the month
// if the first day of the weekly candle (monday) is the 2nd of the month
// we fix the start of the line position on the Prev weekly candle
if timeframe.isweekly and dayofweek(monthly_time) != dayofweek.monday
line.set_x1(monthlyLine, monthly_time - (weekly_time - weekly_time ))

Key Levels//@version=5
//@sbtnc thank you for doing the base code
//Added additional levels for convienience sake.
indicator('Key Levels SpacemanBTC IDWM', shorttitle='SpacemanBTC Key Level V13.1', overlay=true, max_lines_count=100)
//35 works
displayStyle = input.string(defval='Standard', title='Display Style', options= , inline='Display')
mergebool = input.bool(defval=true, title='Merge Levels?', inline='Display')
distanceright = input.int(defval=30, title='Distance', minval=5, maxval=500, inline='Dist')
radistance = input.int(defval=250, title='Anchor Distance', minval=5, maxval=500, inline='Dist')
labelsize = input.string(defval='Medium', title='Text Size', options= )
linesize = input.string(defval='Small', title='Line Width', options= , inline='Line')
linestyle = input.string(defval='Solid', title='Line Style', options= , inline='Line')
GlobalTextType = input.bool(defval=false, title='Global Text ShortHand', tooltip='Enable for shorthand text on all text')
var globalcoloring = input.bool(defval=false, title='Global Coloring', tooltip='Enable for all color controls via one color', inline='GC')
GlobalColor = input.color(title='', defval=color.white, inline='GC')
//var show_tails = input(defval = false, title = "Always Show", type = input.bool)
= request.security(syminfo.tickerid, 'D', , lookahead=barmerge.lookahead_on)
= request.security(syminfo.tickerid, 'D', [time , high ], lookahead=barmerge.lookahead_on)
= request.security(syminfo.tickerid, 'D', [time , low ], lookahead=barmerge.lookahead_on)
cdailyh_open = request.security(syminfo.tickerid, 'D', high, lookahead=barmerge.lookahead_on)
cdailyl_open = request.security(syminfo.tickerid, 'D', low, lookahead=barmerge.lookahead_on)
var monday_time = time
var monday_high = high
var monday_low = low
= request.security(syminfo.tickerid, 'W', , lookahead=barmerge.lookahead_on)
= request.security(syminfo.tickerid, 'W', [time , high ], lookahead=barmerge.lookahead_on)
= request.security(syminfo.tickerid, 'W', [time , low ], lookahead=barmerge.lookahead_on)
= request.security(syminfo.tickerid, 'M', , lookahead=barmerge.lookahead_on)
= request.security(syminfo.tickerid, 'M', [time , high ], lookahead=barmerge.lookahead_on)
= request.security(syminfo.tickerid, 'M', [time , low ], lookahead=barmerge.lookahead_on)
= request.security(syminfo.tickerid, '3M', , lookahead=barmerge.lookahead_on)
= request.security(syminfo.tickerid, '3M', [time , high ], lookahead=barmerge.lookahead_on)
= request.security(syminfo.tickerid, '3M', [time , low ], lookahead=barmerge.lookahead_on)
= request.security(syminfo.tickerid, '12M', , lookahead=barmerge.lookahead_on)
= request.security(syminfo.tickerid, '12M', , lookahead=barmerge.lookahead_on)
= request.security(syminfo.tickerid, '12M', , lookahead=barmerge.lookahead_on)
= request.security(syminfo.tickerid, '240', , lookahead=barmerge.lookahead_on)
= request.security(syminfo.tickerid, '240', [time , high ], lookahead=barmerge.lookahead_on)
= request.security(syminfo.tickerid, '240', [time , low ], lookahead=barmerge.lookahead_on)
//------------------------------ Inputs -------------------------------
var is_intra_enabled = input.bool(defval=false, title='Open', group='4H', inline='4H')
var is_intrarange_enabled = input.bool(defval=false, title='Prev H/L', group='4H', inline='4H')
var is_intram_enabled = input.bool(defval=false, title='Prev Mid', group='4H', inline='4H')
IntraTextType = input.bool(defval=false, title='ShortHand', group='4H', inline='4Hsh')
var is_daily_enabled = input.bool(defval=true, title='Open', group='Daily', inline='Daily')
var is_dailyrange_enabled = input.bool(defval=false, title='Prev H/L', group='Daily', inline='Daily')
var is_dailym_enabled = input.bool(defval=false, title='Prev Mid', group='Daily', inline='Daily')
DailyTextType = input.bool(defval=false, title='ShortHand', group='Daily', inline='Dailysh')
var is_monday_enabled = input.bool(defval=true, title='Range', group='Monday Range', inline='Monday')
var is_monday_mid = input.bool(defval=true, title='Mid', group='Monday Range', inline='Monday')
var untested_monday = false
MondayTextType = input.bool(defval=false, title='ShortHand', group='Monday Range', inline='Mondaysh')
var is_weekly_enabled = input.bool(defval=true, title='Open', group='Weekly', inline='Weekly')
var is_weeklyrange_enabled = input.bool(defval=true, title='Prev H/L', group='Weekly', inline='Weekly')
var is_weekly_mid = input.bool(defval=true, title='Prev Mid', group='Weekly', inline='Weekly')
WeeklyTextType = input.bool(defval=false, title='ShortHand', group='Weekly', inline='Weeklysh')
var is_monthly_enabled = input.bool(defval=true, title='Open', group='Monthly', inline='Monthly')
var is_monthlyrange_enabled = input.bool(defval=true, title='Prev H/L', group='Monthly', inline='Monthly')
var is_monthly_mid = input.bool(defval=true, title='Prev Mid', group='Monthly', inline='Monthly')
MonthlyTextType = input.bool(defval=false, title='ShortHand', group='Monthly', inline='Monthlysh')
var is_quarterly_enabled = input.bool(defval=true, title='Open', group='Quarterly', inline='Quarterly')
var is_quarterlyrange_enabled = input.bool(defval=false, title='Prev H/L', group='Quarterly', inline='Quarterly')
var is_quarterly_mid = input.bool(defval=true, title='Prev Mid', group='Quarterly', inline='Quarterly')
QuarterlyTextType = input.bool(defval=false, title='ShortHand', group='Quarterly', inline='Quarterlysh')
var is_yearly_enabled = input.bool(defval=true, title='Open', group='Yearly', inline='Yearly')
var is_yearlyrange_enabled = input.bool(defval=false, title='Current H/L', group='Yearly', inline='Yearly')
var is_yearly_mid = input.bool(defval=true, title='Mid', group='Yearly', inline='Yearly')
YearlyTextType = input.bool(defval=false, title='ShortHand', group='Yearly', inline='Yearlysh')
var is_londonrange_enabled = input.bool(defval=false, title='London Range', group='FX Sessions', inline='FX')
var is_usrange_enabled = input.bool(defval=false, title='New York Range', group='FX Sessions', inline='FX')
var is_asiarange_enabled = input.bool(defval=false, title='Asia Range', group='FX Sessions', inline='FX')
SessionTextType = input.bool(defval=false, title='ShortHand', group='FX Sessions', inline='FXColor')
Londont = input.session("0800-1600", "London Session")
USt = input.session("1400-2100", "New York Session")
Asiat = input.session("0000-0900", "Tokyo Session")
DailyColor = input.color(title='', defval=#08bcd4, group='Daily', inline='Dailysh')
MondayColor = input.color(title='', defval=color.white, group='Monday Range', inline='Mondaysh')
WeeklyColor = input.color(title='', defval=#fffcbc, group='Weekly', inline='Weeklysh')
MonthlyColor = input.color(title='', defval=#08d48c, group='Monthly', inline='Monthlysh')
YearlyColor = input.color(title='', defval=color.red, group='Yearly', inline='Yearlysh')
quarterlyColor = input.color(title='', defval=color.red, group='Quarterly', inline='Quarterlysh')
IntraColor = input.color(title='', defval=color.orange, group='4H', inline='4Hsh')
LondonColor = input.color(title='', defval=color.white, group='FX Sessions', inline='FXColor')
USColor = input.color(title='', defval=color.white, group='FX Sessions', inline='FXColor')
AsiaColor = input.color(title='', defval=color.white, group='FX Sessions', inline='FXColor')
var pdhtext = GlobalTextType or DailyTextType ? 'PDH' : 'Prev Day High'
var pdltext = GlobalTextType or DailyTextType ? 'PDL' : 'Prev Day Low'
var dotext = GlobalTextType or DailyTextType ? 'DO' : 'Daily Open'
var pdmtext = GlobalTextType or DailyTextType ? 'PDM' : 'Prev Day Mid'
var pwhtext = GlobalTextType or WeeklyTextType ? 'PWH' : 'Prev Week High'
var pwltext = GlobalTextType or WeeklyTextType ? 'PWL' : 'Prev Week Low'
var wotext = GlobalTextType or WeeklyTextType ? 'WO' : 'Weekly Open'
var pwmtext = GlobalTextType or WeeklyTextType ? 'PWM' : 'Prev Week Mid'
var pmhtext = GlobalTextType or MonthlyTextType ? 'PMH' : 'Prev Month High'
var pmltext = GlobalTextType or MonthlyTextType ? 'PML' : 'Prev Month Low'
var motext = GlobalTextType or MonthlyTextType ? 'MO' : 'Monthly Open'
var pmmtext = GlobalTextType or MonthlyTextType ? 'PMM' : 'Prev Month Mid'
var pqhtext = GlobalTextType or QuarterlyTextType ? 'PQH' : 'Prev Quarter High'
var pqltext = GlobalTextType or QuarterlyTextType ? 'PQL' : 'Prev Quarter Low'
var qotext = GlobalTextType or QuarterlyTextType ? 'QO' : 'Quarterly Open'
var pqmtext = GlobalTextType or QuarterlyTextType ? 'PQM' : 'Prev Quarter Mid'
var cyhtext = GlobalTextType or YearlyTextType ? 'CYH' : 'Current Year High'
var cyltext = GlobalTextType or YearlyTextType ? 'CYL' : 'Current Year Low'
var yotext = GlobalTextType or YearlyTextType ? 'YO' : 'Yearly Open'
var cymtext = GlobalTextType or YearlyTextType ? 'CYM' : 'Current Year Mid'
var pihtext = GlobalTextType or IntraTextType ? 'P-4H-H' : 'Prev 4H High'
var piltext = GlobalTextType or IntraTextType ? 'P-4H-L' : 'Prev 4H Low'
var iotext = GlobalTextType or IntraTextType ? '4H-O' : '4H Open'
var pimtext = GlobalTextType or IntraTextType ? 'P-4H-M' : 'Prev 4H Mid'
var pmonhtext = GlobalTextType or MondayTextType ? 'MDAY-H' : 'Monday High'
var pmonltext = GlobalTextType or MondayTextType ? 'MDAY-L' : 'Monday Low'
var pmonmtext = GlobalTextType or MondayTextType ? 'MDAY-M' : 'Monday Mid'
var lhtext = GlobalTextType or SessionTextType ? 'Lon-H' : 'London High'
var lltext = GlobalTextType or SessionTextType ? 'Lon-L' : 'London Low'
var lotext = GlobalTextType or SessionTextType ? 'Lon-O' : 'London Open'
var ushtext = GlobalTextType or SessionTextType ? 'NY-H' : 'New York High'
var usltext = GlobalTextType or SessionTextType ? 'NY-L' : 'New York Low'
var usotext = GlobalTextType or SessionTextType ? 'NY-O' : 'New York Open'
var asiahtext = GlobalTextType or SessionTextType ? 'AS-H' : 'Asia High'
var asialtext = GlobalTextType or SessionTextType ? 'AS-L' : 'Asia Low'
var asiaotext = GlobalTextType or SessionTextType ? 'AS-O' : 'Asia Open'
if globalcoloring == true
DailyColor := GlobalColor
MondayColor := GlobalColor
WeeklyColor := GlobalColor
MonthlyColor := GlobalColor
YearlyColor := GlobalColor
quarterlyColor := GlobalColor
IntraColor := GlobalColor
IntraColor
if weekly_time != weekly_time
untested_monday := false
untested_monday
if is_monday_enabled == true and untested_monday == false
untested_monday := true
monday_time := daily_time
monday_high := cdailyh_open
monday_low := cdailyl_open
monday_low
linewidthint = 1
if linesize == 'Small'
linewidthint := 1
linewidthint
if linesize == 'Medium'
linewidthint := 2
linewidthint
if linesize == 'Large'
linewidthint := 3
linewidthint
var DEFAULT_LINE_WIDTH = linewidthint
var DEFAULT_TAIL_WIDTH = linewidthint
fontsize = size.small
if labelsize == 'Small'
fontsize := size.small
fontsize
if labelsize == 'Medium'
fontsize := size.normal
fontsize
if labelsize == 'Large'
fontsize := size.large
fontsize
linestyles = line.style_solid
if linestyle == 'Dashed'
linestyles := line.style_dashed
linestyles
if linestyle == 'Dotted'
linestyles := line.style_dotted
linestyles
var DEFAULT_LABEL_SIZE = fontsize
var DEFAULT_LABEL_STYLE = label.style_none
var DEFAULT_EXTEND_RIGHT = distanceright
London = time(timeframe.period, Londont)
US = time(timeframe.period, USt)
Asia = time(timeframe.period, Asiat)
var clondonhigh = 0.0
var clondonlow = close
var londontime = time
var flondonhigh = 0.0
var flondonlow = 0.0
var flondonopen = 0.0
var onelondonfalse = false
if London
if high > clondonhigh
clondonhigh := high
clondonhigh
if low < clondonlow
clondonlow := low
clondonlow
if onelondonfalse
londontime := time
flondonopen := open
flondonopen
flondonhigh := clondonhigh
flondonlow := clondonlow
onelondonfalse := false
onelondonfalse
else
if onelondonfalse == false
flondonhigh := clondonhigh
flondonlow := clondonlow
flondonlow
onelondonfalse := true
clondonhigh := 0.0
clondonlow := close
clondonlow
//////////////////////////////////
var cushigh = 0.0
var cuslow = close
var ustime = time
var fushigh = 0.0
var fuslow = 0.0
var fusopen = 0.0
var oneusfalse = false
if US
if high > cushigh
cushigh := high
cushigh
if low < cuslow
cuslow := low
cuslow
if oneusfalse
ustime := time
fusopen := open
fusopen
fushigh := cushigh
fuslow := cuslow
oneusfalse := false
oneusfalse
else
if oneusfalse == false
fushigh := cushigh
fuslow := cuslow
fuslow
oneusfalse := true
cushigh := 0.0
cuslow := close
cuslow
//////////////////////////////////
var casiahigh = 0.0
var casialow = close
var asiatime = time
var fasiahigh = 0.0
var fasialow = 0.0
var fasiaopen = 0.0
var oneasiafalse = false
if Asia
if high > casiahigh
casiahigh := high
casiahigh
if low < casialow
casialow := low
casialow
if oneasiafalse
asiatime := time
fasiaopen := open
fasiaopen
fasiahigh := casiahigh
fasialow := casialow
oneasiafalse := false
oneasiafalse
else
if oneasiafalse == false
fasiahigh := casiahigh
fasialow := casialow
fasialow
oneasiafalse := true
casiahigh := 0.0
casialow := close
casialow
//------------------------------ Plotting ------------------------------
var pricearray = array.new_float(0)
var labelarray = array.new_label(0)
f_LevelMerge(pricearray, labelarray, currentprice, currentlabel, currentcolor) =>
if array.includes(pricearray, currentprice)
whichindex = array.indexof(pricearray, currentprice)
labelhold = array.get(labelarray, whichindex)
whichtext = label.get_text(labelhold)
label.set_text(labelhold, label.get_text(currentlabel) + ' / ' + whichtext)
label.set_text(currentlabel, '')
label.set_textcolor(labelhold, currentcolor)
else
array.push(pricearray, currentprice)
array.push(labelarray, currentlabel)
var can_show_daily = is_daily_enabled and timeframe.isintraday
var can_show_weekly = is_weekly_enabled and not timeframe.isweekly and not timeframe.ismonthly
var can_show_monthly = is_monthly_enabled and not timeframe.ismonthly
get_limit_right(bars) =>
timenow + (time - time ) * bars
// the following code doesn't need to be processed on every candle
if barstate.islast
is_weekly_open = dayofweek == dayofweek.monday
is_monthly_open = dayofmonth == 1
can_draw_daily = (is_weekly_enabled ? not is_weekly_open : true) and (is_monthly_enabled ? not is_monthly_open : true)
can_draw_weekly = is_monthly_enabled ? not(is_monthly_open and is_weekly_open) : true
can_draw_intra = is_intra_enabled
can_draw_intrah = is_intrarange_enabled
can_draw_intral = is_intrarange_enabled
can_draw_intram = is_intram_enabled
pricearray := array.new_float(0)
labelarray := array.new_label(0)
/////////////////////////////////
if is_londonrange_enabled
//label.new(bar_index,high)
london_limit_right = get_limit_right(DEFAULT_EXTEND_RIGHT)
if displayStyle == 'Right Anchored'
londontime := get_limit_right(radistance)
londontime
var londonh_line = line.new(x1=londontime, x2=london_limit_right, y1=flondonhigh, y2=flondonhigh, color=LondonColor, width=DEFAULT_LINE_WIDTH, xloc=xloc.bar_time, style=linestyles)
var londonl_line = line.new(x1=londontime, x2=london_limit_right, y1=flondonlow, y2=flondonlow, color=LondonColor, width=DEFAULT_LINE_WIDTH, xloc=xloc.bar_time, style=linestyles)
var londono_line = line.new(x1=londontime, x2=london_limit_right, y1=flondonopen, y2=flondonopen, color=LondonColor, width=DEFAULT_LINE_WIDTH, xloc=xloc.bar_time, style=linestyles)
var londonh_label = label.new(x=london_limit_right, y=flondonhigh, text=lhtext, style=DEFAULT_LABEL_STYLE, textcolor=LondonColor, size=DEFAULT_LABEL_SIZE, xloc=xloc.bar_time)
var londonl_label = label.new(x=london_limit_right, y=flondonlow, text=lltext, style=DEFAULT_LABEL_STYLE, textcolor=LondonColor, size=DEFAULT_LABEL_SIZE, xloc=xloc.bar_time)
var londono_label = label.new(x=london_limit_right, y=flondonopen, text=lotext, style=DEFAULT_LABEL_STYLE, textcolor=LondonColor, size=DEFAULT_LABEL_SIZE, xloc=xloc.bar_time)
line.set_x1(londonh_line, londontime)
line.set_x2(londonh_line, london_limit_right)
line.set_y1(londonh_line, flondonhigh)
line.set_y2(londonh_line, flondonhigh)
line.set_x1(londonl_line, londontime)
line.set_x2(londonl_line, london_limit_right)
line.set_y1(londonl_line, flondonlow)
line.set_y2(londonl_line, flondonlow)
line.set_x1(londono_line, londontime)
line.set_x2(londono_line, london_limit_right)
line.set_y1(londono_line, flondonopen)
line.set_y2(londono_line, flondonopen)
label.set_x(londonh_label, london_limit_right)
label.set_y(londonh_label, flondonhigh)
label.set_text(londonh_label, lhtext)
label.set_x(londonl_label, london_limit_right)
label.set_y(londonl_label, flondonlow)
label.set_text(londonl_label, lltext)
label.set_x(londono_label, london_limit_right)
label.set_y(londono_label, flondonopen)
label.set_text(londono_label, lotext)
if mergebool
f_LevelMerge(pricearray, labelarray, flondonhigh, londonh_label, LondonColor)
f_LevelMerge(pricearray, labelarray, flondonlow, londonl_label, LondonColor)
f_LevelMerge(pricearray, labelarray, flondonopen, londono_label, LondonColor)
//////////////////////////////////////////////////////////////////////////////////
/////////////////////////////////
if is_usrange_enabled
//label.new(bar_index,high)
us_limit_right = get_limit_right(DEFAULT_EXTEND_RIGHT)
if displayStyle == 'Right Anchored'
ustime := get_limit_right(radistance)
ustime
var ush_line = line.new(x1=ustime, x2=us_limit_right, y1=fushigh, y2=fushigh, color=USColor, width=DEFAULT_LINE_WIDTH, xloc=xloc.bar_time, style=linestyles)
var usl_line = line.new(x1=ustime, x2=us_limit_right, y1=fuslow, y2=fuslow, color=USColor, width=DEFAULT_LINE_WIDTH, xloc=xloc.bar_time, style=linestyles)
var uso_line = line.new(x1=ustime, x2=us_limit_right, y1=fusopen, y2=fusopen, color=USColor, width=DEFAULT_LINE_WIDTH, xloc=xloc.bar_time, style=linestyles)
var ush_label = label.new(x=us_limit_right, y=fushigh, text=lhtext, style=DEFAULT_LABEL_STYLE, textcolor=USColor, size=DEFAULT_LABEL_SIZE, xloc=xloc.bar_time)
var usl_label = label.new(x=us_limit_right, y=fuslow, text=lltext, style=DEFAULT_LABEL_STYLE, textcolor=USColor, size=DEFAULT_LABEL_SIZE, xloc=xloc.bar_time)
var uso_label = label.new(x=us_limit_right, y=fusopen, text=lotext, style=DEFAULT_LABEL_STYLE, textcolor=USColor, size=DEFAULT_LABEL_SIZE, xloc=xloc.bar_time)
line.set_x1(ush_line, ustime)
line.set_x2(ush_line, us_limit_right)
line.set_y1(ush_line, fushigh)
line.set_y2(ush_line, fushigh)
line.set_x1(usl_line, ustime)
line.set_x2(usl_line, us_limit_right)
line.set_y1(usl_line, fuslow)
line.set_y2(usl_line, fuslow)
line.set_x1(uso_line, ustime)
line.set_x2(uso_line, us_limit_right)
line.set_y1(uso_line, fusopen)
line.set_y2(uso_line, fusopen)
label.set_x(ush_label, us_limit_right)
label.set_y(ush_label, fushigh)
label.set_text(ush_label, ushtext)
label.set_x(usl_label, us_limit_right)
label.set_y(usl_label, fuslow)
label.set_text(usl_label, usltext)
label.set_x(uso_label, us_limit_right)
label.set_y(uso_label, fusopen)
label.set_text(uso_label, usotext)
if mergebool
f_LevelMerge(pricearray, labelarray, fushigh, ush_label, USColor)
f_LevelMerge(pricearray, labelarray, fuslow, usl_label, USColor)
f_LevelMerge(pricearray, labelarray, fusopen, uso_label, USColor)
/////////////////////////////////
if is_asiarange_enabled
//label.new(bar_index,high)
asia_limit_right = get_limit_right(DEFAULT_EXTEND_RIGHT)
if displayStyle == 'Right Anchored'
asiatime := get_limit_right(radistance)
asiatime
var asiah_line = line.new(x1=asiatime, x2=asia_limit_right, y1=fasiahigh, y2=fasiahigh, color=AsiaColor, width=DEFAULT_LINE_WIDTH, xloc=xloc.bar_time, style=linestyles)
var asial_line = line.new(x1=asiatime, x2=asia_limit_right, y1=fasialow, y2=fasialow, color=AsiaColor, width=DEFAULT_LINE_WIDTH, xloc=xloc.bar_time, style=linestyles)
var asiao_line = line.new(x1=asiatime, x2=asia_limit_right, y1=fasiaopen, y2=fasiaopen, color=AsiaColor, width=DEFAULT_LINE_WIDTH, xloc=xloc.bar_time, style=linestyles)
var asiah_label = label.new(x=asia_limit_right, y=fasiahigh, text=asiahtext, style=DEFAULT_LABEL_STYLE, textcolor=AsiaColor, size=DEFAULT_LABEL_SIZE, xloc=xloc.bar_time)
var asial_label = label.new(x=asia_limit_right, y=fasialow, text=asialtext, style=DEFAULT_LABEL_STYLE, textcolor=AsiaColor, size=DEFAULT_LABEL_SIZE, xloc=xloc.bar_time)
var asiao_label = label.new(x=asia_limit_right, y=fasiaopen, text=asiaotext, style=DEFAULT_LABEL_STYLE, textcolor=AsiaColor, size=DEFAULT_LABEL_SIZE, xloc=xloc.bar_time)
line.set_x1(asiah_line, asiatime)
line.set_x2(asiah_line, asia_limit_right)
line.set_y1(asiah_line, fasiahigh)
line.set_y2(asiah_line, fasiahigh)
line.set_x1(asial_line, asiatime)
line.set_x2(asial_line, asia_limit_right)
line.set_y1(asial_line, fasialow)
line.set_y2(asial_line, fasialow)
line.set_x1(asiao_line, asiatime)
line.set_x2(asiao_line, asia_limit_right)
line.set_y1(asiao_line, fasiaopen)
line.set_y2(asiao_line, fasiaopen)
label.set_x(asiah_label, asia_limit_right)
label.set_y(asiah_label, fasiahigh)
label.set_text(asiah_label, asiahtext)
label.set_x(asial_label, asia_limit_right)
label.set_y(asial_label, fasialow)
label.set_text(asial_label, asialtext)
label.set_x(asiao_label, asia_limit_right)
label.set_y(asiao_label, fasiaopen)
label.set_text(asiao_label, asiaotext)
if mergebool
f_LevelMerge(pricearray, labelarray, fasiahigh, asiah_label, AsiaColor)
f_LevelMerge(pricearray, labelarray, fasialow, asial_label, AsiaColor)
f_LevelMerge(pricearray, labelarray, fasiaopen, asiao_label, AsiaColor)
//////////////////////////////////////////////////////////////////////////////////
//////////////////////////////////////////////////////////////////////////////////
if can_draw_intra
intra_limit_right = get_limit_right(DEFAULT_EXTEND_RIGHT)
if displayStyle == 'Right Anchored'
intra_time := get_limit_right(radistance)
intra_time
var intra_line = line.new(x1=intra_time, x2=intra_limit_right, y1=intra_open, y2=intra_open, color=IntraColor, width=DEFAULT_LINE_WIDTH, xloc=xloc.bar_time, style=linestyles)
var intra_label = label.new(x=intra_limit_right, y=intra_open, text=iotext, style=DEFAULT_LABEL_STYLE, textcolor=IntraColor, size=DEFAULT_LABEL_SIZE, xloc=xloc.bar_time)
line.set_x1(intra_line, intra_time)
line.set_x2(intra_line, intra_limit_right)
line.set_y1(intra_line, intra_open)
line.set_y2(intra_line, intra_open)
label.set_x(intra_label, intra_limit_right)
label.set_y(intra_label, intra_open)
label.set_text(intra_label, iotext)
if mergebool
f_LevelMerge(pricearray, labelarray, intra_open, intra_label, IntraColor)
//////////////////////////////////////////////////////////////////////////////////
//HIGH HIGH HIGH HIGH HIGH HIGH HIGH HIGH HIGH HIGH HIGH HIGH HIGH HIGH HIGH HIGH
if can_draw_intrah
intrah_limit_right = get_limit_right(DEFAULT_EXTEND_RIGHT)
if displayStyle == 'Right Anchored'
intrah_time := get_limit_right(radistance)
intrah_time
var intrah_line = line.new(x1=intrah_time, x2=intrah_limit_right, y1=intrah_open, y2=intrah_open, color=IntraColor, width=DEFAULT_LINE_WIDTH, xloc=xloc.bar_time, style=linestyles)
var intrah_label = label.new(x=intrah_limit_right, y=intrah_open, text=pihtext, style=DEFAULT_LABEL_STYLE, textcolor=IntraColor, size=DEFAULT_LABEL_SIZE, xloc=xloc.bar_time)
line.set_x1(intrah_line, intrah_time)
line.set_x2(intrah_line, intrah_limit_right)
line.set_y1(intrah_line, intrah_open)
line.set_y2(intrah_line, intrah_open)
label.set_x(intrah_label, intrah_limit_right)
label.set_y(intrah_label, intrah_open)
label.set_text(intrah_label, pihtext)
if mergebool
f_LevelMerge(pricearray, labelarray, intrah_open, intrah_label, IntraColor)
//////////////////////////////////////////////////////////////////////////////////
//LOW LOW LOW LOW LOW LOW LOW LOW LOW LOW LOW LOW LOW LOW LOW LOW
if can_draw_intral
intral_limit_right = get_limit_right(DEFAULT_EXTEND_RIGHT)
if displayStyle == 'Right Anchored'
intral_time := get_limit_right(radistance)
intral_time
var intral_line = line.new(x1=intral_time, x2=intral_limit_right, y1=intral_open, y2=intral_open, color=IntraColor, width=DEFAULT_LINE_WIDTH, xloc=xloc.bar_time, style=linestyles)
var intral_label = label.new(x=intral_limit_right, y=intral_open, text=piltext, style=DEFAULT_LABEL_STYLE, textcolor=IntraColor, size=DEFAULT_LABEL_SIZE, xloc=xloc.bar_time)
line.set_x1(intral_line, intral_time)
line.set_x2(intral_line, intral_limit_right)
line.set_y1(intral_line, intral_open)
line.set_y2(intral_line, intral_open)
label.set_x(intral_label, intral_limit_right)
label.set_y(intral_label, intral_open)
label.set_text(intral_label, piltext)
if mergebool
f_LevelMerge(pricearray, labelarray, intral_open, intral_label, IntraColor)
///////////////////////////////////////////////////////////////////////////////
if can_draw_intram
intram_limit_right = get_limit_right(DEFAULT_EXTEND_RIGHT)
intram_time = intrah_time
intram_open = (intral_open + intrah_open) / 2
if displayStyle == 'Right Anchored'
intram_time := get_limit_right(radistance)
intram_time
var intram_line = line.new(x1=intram_time, x2=intram_limit_right, y1=intram_open, y2=intram_open, color=IntraColor, width=DEFAULT_LINE_WIDTH, xloc=xloc.bar_time, style=linestyles)
var intram_label = label.new(x=intram_limit_right, y=intram_open, text=pimtext, style=DEFAULT_LABEL_STYLE, textcolor=IntraColor, size=DEFAULT_LABEL_SIZE, xloc=xloc.bar_time)
line.set_x1(intram_line, intram_time)
line.set_x2(intram_line, intram_limit_right)
line.set_y1(intram_line, intram_open)
line.set_y2(intram_line, intram_open)
label.set_x(intram_label, intram_limit_right)
label.set_y(intram_label, intram_open)
label.set_text(intram_label, pimtext)
if mergebool
f_LevelMerge(pricearray, labelarray, intram_open, intram_label, IntraColor)
////////////////////////////////////////// MONDAY
if is_monday_enabled
monday_limit_right = get_limit_right(DEFAULT_EXTEND_RIGHT)
if displayStyle == 'Right Anchored'
monday_time := get_limit_right(radistance)
monday_time
var monday_line = line.new(x1=monday_time, x2=monday_limit_right, y1=monday_high, y2=monday_high, color=MondayColor, width=DEFAULT_LINE_WIDTH, xloc=xloc.bar_time, style=linestyles)
var monday_label = label.new(x=monday_limit_right, y=monday_high, text=pmonhtext, style=DEFAULT_LABEL_STYLE, textcolor=MondayColor, size=DEFAULT_LABEL_SIZE, xloc=xloc.bar_time)
line.set_x1(monday_line, monday_time)
line.set_x2(monday_line, monday_limit_right)
line.set_y1(monday_line, monday_high)
line.set_y2(monday_line, monday_high)
label.set_x(monday_label, monday_limit_right)
label.set_y(monday_label, monday_high)
label.set_text(monday_label, pmonhtext)
if mergebool
f_LevelMerge(pricearray, labelarray, monday_high, monday_label, MondayColor)
if is_monday_enabled
monday_limit_right = get_limit_right(DEFAULT_EXTEND_RIGHT)
if displayStyle == 'Right Anchored'
monday_time := get_limit_right(radistance)
monday_time
var monday_low_line = line.new(x1=monday_time, x2=monday_limit_right, y1=monday_low, y2=monday_low, color=MondayColor, width=DEFAULT_LINE_WIDTH, xloc=xloc.bar_time, style=linestyles)
var monday_low_label = label.new(x=monday_limit_right, y=monday_low, text=pmonltext, style=DEFAULT_LABEL_STYLE, textcolor=MondayColor, size=DEFAULT_LABEL_SIZE, xloc=xloc.bar_time)
line.set_x1(monday_low_line, monday_time)
line.set_x2(monday_low_line, monday_limit_right)
line.set_y1(monday_low_line, monday_low)
line.set_y2(monday_low_line, monday_low)
label.set_x(monday_low_label, monday_limit_right)
label.set_y(monday_low_label, monday_low)
label.set_text(monday_low_label, pmonltext)
if mergebool
f_LevelMerge(pricearray, labelarray, monday_low, monday_low_label, MondayColor)
if is_monday_mid
mondaym_limit_right = get_limit_right(DEFAULT_EXTEND_RIGHT)
mondaym_open = (monday_high + monday_low) / 2
if displayStyle == 'Right Anchored'
monday_time := get_limit_right(radistance)
monday_time
var mondaym_line = line.new(x1=monday_time, x2=mondaym_limit_right, y1=mondaym_open, y2=mondaym_open, color=MondayColor, width=DEFAULT_LINE_WIDTH, xloc=xloc.bar_time, style=linestyles)
var mondaym_label = label.new(x=mondaym_limit_right, y=mondaym_open, text=pmonmtext, style=DEFAULT_LABEL_STYLE, textcolor=MondayColor, size=DEFAULT_LABEL_SIZE, xloc=xloc.bar_time)
line.set_x1(mondaym_line, monday_time)
line.set_x2(mondaym_line, mondaym_limit_right)
line.set_y1(mondaym_line, mondaym_open)
line.set_y2(mondaym_line, mondaym_open)
label.set_x(mondaym_label, mondaym_limit_right)
label.set_y(mondaym_label, mondaym_open)
label.set_text(mondaym_label, pmonmtext)
if mergebool
f_LevelMerge(pricearray, labelarray, mondaym_open, mondaym_label, MondayColor)
//////////////////////////////////////////////////////////////////////////////////
////////////////////////DAILY OPEN DAILY OPEN DAILY OPEN DAILY OPEN DAILY OPEN DAILY OPEN DAILY OPEN
if is_daily_enabled
daily_limit_right = get_limit_right(DEFAULT_EXTEND_RIGHT)
if displayStyle == 'Right Anchored'
daily_time := get_limit_right(radistance)
daily_time
var daily_line = line.new(x1=daily_time, x2=daily_limit_right, y1=daily_open, y2=daily_open, color=DailyColor, width=DEFAULT_LINE_WIDTH, xloc=xloc.bar_time, style=linestyles)
var daily_label = label.new(x=daily_limit_right, y=daily_open, text=dotext, style=DEFAULT_LABEL_STYLE, textcolor=DailyColor, size=DEFAULT_LABEL_SIZE, xloc=xloc.bar_time)
line.set_x1(daily_line, daily_time)
line.set_x2(daily_line, daily_limit_right)
line.set_y1(daily_line, daily_open)
line.set_y2(daily_line, daily_open)
label.set_x(daily_label, daily_limit_right)
label.set_y(daily_label, daily_open)
label.set_text(daily_label, dotext)
if mergebool
f_LevelMerge(pricearray, labelarray, daily_open, daily_label, DailyColor)
//////////////////////////////////////////////////////////////////////////////////
//////////////////DAILY HIGH DAILY HIGH DAILY HIGH DAILY HIGH DAILY HIGH DAILY HIGH DAILY HIGH
if is_dailyrange_enabled
dailyh_limit_right = get_limit_right(DEFAULT_EXTEND_RIGHT)
if displayStyle == 'Right Anchored'
dailyh_time := get_limit_right(radistance)
dailyh_time
// draw tails before lines for better visual
var dailyh_line = line.new(x1=dailyh_time, x2=dailyh_limit_right, y1=dailyh_open, y2=dailyh_open, color=DailyColor, width=DEFAULT_LINE_WIDTH, xloc=xloc.bar_time, style=linestyles)
var dailyh_label = label.new(x=dailyh_limit_right, y=dailyh_open, text=pdhtext, style=DEFAULT_LABEL_STYLE, textcolor=DailyColor, size=DEFAULT_LABEL_SIZE, xloc=xloc.bar_time)
line.set_x1(dailyh_line, dailyh_time)
line.set_x2(dailyh_line, dailyh_limit_right)
line.set_y1(dailyh_line, dailyh_open)
line.set_y2(dailyh_line, dailyh_open)
label.set_x(dailyh_label, dailyh_limit_right)
label.set_y(dailyh_label, dailyh_open)
label.set_text(dailyh_label, pdhtext)
if mergebool
f_LevelMerge(pricearray, labelarray, dailyh_open, dailyh_label, DailyColor)
//////////////////////////////////////////////////////////////////////////////////
//////////////////DAILY LOW DAILY LOW DAILY LOW DAILY LOW DAILY LOW DAILY LOW DAILY LOW DAILY LOW
if is_dailyrange_enabled
dailyl_limit_right = get_limit_right(DEFAULT_EXTEND_RIGHT)
if displayStyle == 'Right Anchored'
dailyl_time := get_limit_right(radistance)
dailyl_time
var dailyl_line = line.new(x1=dailyl_time, x2=dailyl_limit_right, y1=dailyl_open, y2=dailyl_open, color=DailyColor, width=DEFAULT_LINE_WIDTH, xloc=xloc.bar_time, style=linestyles)
var dailyl_label = label.new(x=dailyl_limit_right, y=dailyl_open, text=pdltext, style=DEFAULT_LABEL_STYLE, textcolor=DailyColor, size=DEFAULT_LABEL_SIZE, xloc=xloc.bar_time)
line.set_x1(dailyl_line, dailyl_time)
line.set_x2(dailyl_line, dailyl_limit_right)
line.set_y1(dailyl_line, dailyl_open)
line.set_y2(dailyl_line, dailyl_open)
label.set_x(dailyl_label, dailyl_limit_right)
label.set_y(dailyl_label, dailyl_open)
label.set_text(dailyl_label, pdltext)
if mergebool
f_LevelMerge(pricearray, labelarray, dailyl_open, dailyl_label, DailyColor)
//////////////////////////////////////////////////////////////////////////////// Daily MID
if is_dailym_enabled
dailym_limit_right = get_limit_right(DEFAULT_EXTEND_RIGHT)
dailym_time = dailyh_time
dailym_open = (dailyl_open + dailyh_open) / 2
if displayStyle == 'Right Anchored'
dailym_time := get_limit_right(radistance)
dailym_time
var dailym_line = line.new(x1=dailym_time, x2=dailym_limit_right, y1=dailym_open, y2=dailym_open, color=DailyColor, width=DEFAULT_LINE_WIDTH, xloc=xloc.bar_time, style=linestyles)
var dailym_label = label.new(x=dailym_limit_right, y=dailym_open, text=pdmtext, style=DEFAULT_LABEL_STYLE, textcolor=DailyColor, size=DEFAULT_LABEL_SIZE, xloc=xloc.bar_time)
line.set_x1(dailym_line, dailym_time)
line.set_x2(dailym_line, dailym_limit_right)
line.set_y1(dailym_line, dailym_open)
line.set_y2(dailym_line, dailym_open)
label.set_x(dailym_label, dailym_limit_right)
label.set_y(dailym_label, dailym_open)
label.set_text(dailym_label, pdmtext)
if mergebool
f_LevelMerge(pricearray, labelarray, dailym_open, dailym_label, DailyColor)
//////////////////////////////////////////////////////////////////////////////////
if is_weekly_enabled
weekly_limit_right = get_limit_right(DEFAULT_EXTEND_RIGHT)
cweekly_time = weekly_time
if displayStyle == 'Right Anchored'
cweekly_time := get_limit_right(radistance)
cweekly_time
var weekly_line = line.new(x1=cweekly_time, x2=weekly_limit_right, y1=weekly_open, y2=weekly_open, color=WeeklyColor, width=DEFAULT_LINE_WIDTH, xloc=xloc.bar_time, style=linestyles)
var weekly_label = label.new(x=weekly_limit_right, y=weekly_open, text=wotext, style=DEFAULT_LABEL_STYLE, textcolor=WeeklyColor, size=DEFAULT_LABEL_SIZE, xloc=xloc.bar_time)
line.set_x1(weekly_line, cweekly_time)
line.set_x2(weekly_line, weekly_limit_right)
line.set_y1(weekly_line, weekly_open)
line.set_y2(weekly_line, weekly_open)
label.set_x(weekly_label, weekly_limit_right)
label.set_y(weekly_label, weekly_open)
label.set_text(weekly_label, wotext)
if mergebool
f_LevelMerge(pricearray, labelarray, weekly_open, weekly_label, WeeklyColor)
// the weekly open can be the daily open too (monday)
// only the weekly will be draw, in these case we update its label
// if is_weekly_open and can_show_daily
// label.set_text(weekly_label, "DO / WO ")
//////////////////////////////////////////////////////////////////////////////////
////////////////////////////////////////////////////////////////////////////////// WEEKLY HIGH WEEKLY HIGH WEEKLY HIGH
if is_weeklyrange_enabled
weeklyh_limit_right = get_limit_right(DEFAULT_EXTEND_RIGHT)
if displayStyle == 'Right Anchored'
weeklyh_time := get_limit_right(radistance)
weeklyh_time
var weeklyh_line = line.new(x1=weeklyh_time, x2=weeklyh_limit_right, y1=weeklyh_open, y2=weeklyh_open, color=WeeklyColor, width=DEFAULT_LINE_WIDTH, xloc=xloc.bar_time, style=linestyles)
var weeklyh_label = label.new(x=weeklyh_limit_right, y=weeklyh_open, text=pwhtext, style=DEFAULT_LABEL_STYLE, textcolor=WeeklyColor, size=DEFAULT_LABEL_SIZE, xloc=xloc.bar_time)
line.set_x1(weeklyh_line, weeklyh_time)
line.set_x2(weeklyh_line, weeklyh_limit_right)
line.set_y1(weeklyh_line, weeklyh_open)
line.set_y2(weeklyh_line, weeklyh_open)
label.set_x(weeklyh_label, weeklyh_limit_right)
label.set_y(weeklyh_label, weeklyh_open)
label.set_text(weeklyh_label, pwhtext)
if mergebool
f_LevelMerge(pricearray, labelarray, weeklyh_open, weeklyh_label, WeeklyColor)
//////////////////////////////////////////////////////////////////////////////////
////////////////////////////////////////////////////////////////////////////////// WEEKLY LOW WEEKLY LOW WEEKLY LOW
if is_weeklyrange_enabled
weeklyl_limit_right = get_limit_right(DEFAULT_EXTEND_RIGHT)
if displayStyle == 'Right Anchored'
weeklyl_time := get_limit_right(radistance)
weeklyl_time
var weeklyl_line = line.new(x1=weeklyl_time, x2=weeklyl_limit_right, y1=weekly_open, y2=weekly_open, color=WeeklyColor, width=DEFAULT_LINE_WIDTH, xloc=xloc.bar_time, style=linestyles)
var weeklyl_label = label.new(x=weeklyl_limit_right, y=weeklyl_open, text=pwltext, style=DEFAULT_LABEL_STYLE, textcolor=WeeklyColor, size=DEFAULT_LABEL_SIZE, xloc=xloc.bar_time)
line.set_x1(weeklyl_line, weeklyl_time)
line.set_x2(weeklyl_line, weeklyl_limit_right)
line.set_y1(weeklyl_line, weeklyl_open)
line.set_y2(weeklyl_line, weeklyl_open)
label.set_x(weeklyl_label, weeklyl_limit_right)
label.set_y(weeklyl_label, weeklyl_open)
label.set_text(weeklyl_label, pwltext)
if mergebool
f_LevelMerge(pricearray, labelarray, weeklyl_open, weeklyl_label, WeeklyColor)
//////////////////////////////////////////////////////////////////////////////////
//////////////////////////////////////////////////////////////////////////////// Weekly MID
if is_weekly_mid
weeklym_limit_right = get_limit_right(DEFAULT_EXTEND_RIGHT)
weeklym_time = weeklyh_time
weeklym_open = (weeklyl_open + weeklyh_open) / 2
if displayStyle == 'Right Anchored'
weeklym_time := get_limit_right(radistance)
weeklym_time
var weeklym_line = line.new(x1=weeklym_time, x2=weeklym_limit_right, y1=weeklym_open, y2=weeklym_open, color=WeeklyColor, width=DEFAULT_LINE_WIDTH, xloc=xloc.bar_time, style=linestyles)
var weeklym_label = label.new(x=weeklym_limit_right, y=weeklym_open, text=pwmtext, style=DEFAULT_LABEL_STYLE, textcolor=WeeklyColor, size=DEFAULT_LABEL_SIZE, xloc=xloc.bar_time)
line.set_x1(weeklym_line, weeklym_time)
line.set_x2(weeklym_line, weeklym_limit_right)
line.set_y1(weeklym_line, weeklym_open)
line.set_y2(weeklym_line, weeklym_open)
label.set_x(weeklym_label, weeklym_limit_right)
label.set_y(weeklym_label, weeklym_open)
label.set_text(weeklym_label, pwmtext)
if mergebool
f_LevelMerge(pricearray, labelarray, weeklym_open, weeklym_label, WeeklyColor)
////////////////////////////////////////////////////////////////////////////////// YEEEAARRLLYY LOW LOW LOW
if is_yearlyrange_enabled
yearlyl_limit_right = get_limit_right(DEFAULT_EXTEND_RIGHT)
if displayStyle == 'Right Anchored'
yearlyl_time := get_limit_right(radistance)
yearlyl_time
var yearlyl_line = line.new(x1=yearlyl_time, x2=yearlyl_limit_right, y1=yearlyl_open, y2=yearlyl_open, color=YearlyColor, width=DEFAULT_LINE_WIDTH, xloc=xloc.bar_time, style=linestyles)
var yearlyl_label = label.new(x=yearlyl_limit_right, y=yearlyl_open, text=cyltext, style=DEFAULT_LABEL_STYLE, textcolor=YearlyColor, size=DEFAULT_LABEL_SIZE, xloc=xloc.bar_time)
line.set_x1(yearlyl_line, yearlyl_time)
line.set_x2(yearlyl_line, yearlyl_limit_right)
line.set_y1(yearlyl_line, yearlyl_open)
line.set_y2(yearlyl_line, yearlyl_open)
label.set_x(yearlyl_label, yearlyl_limit_right)
label.set_y(yearlyl_label, yearlyl_open)
label.set_text(yearlyl_label, cyltext)
if mergebool
f_LevelMerge(pricearray, labelarray, yearlyl_open, yearlyl_label, YearlyColor)
//////////////////////////////////////////////////////////////////////////////////
////////////////////////////////////////////////////////////////////////////////// YEEEAARRLLYY HIGH HIGH HIGH
if is_yearlyrange_enabled
yearlyh_limit_right = get_limit_right(DEFAULT_EXTEND_RIGHT)
if displayStyle == 'Right Anchored'
yearlyh_time := get_limit_right(radistance)
yearlyh_time
var yearlyh_line = line.new(x1=yearlyh_time, x2=yearlyh_limit_right, y1=yearlyh_open, y2=yearlyh_open, color=YearlyColor, width=DEFAULT_LINE_WIDTH, xloc=xloc.bar_time, style=linestyles)
var yearlyh_label = label.new(x=yearlyh_limit_right, y=yearlyh_open, text=cyhtext, style=DEFAULT_LABEL_STYLE, textcolor=YearlyColor, size=DEFAULT_LABEL_SIZE, xloc=xloc.bar_time)
line.set_x1(yearlyh_line, yearlyh_time)
line.set_x2(yearlyh_line, yearlyh_limit_right)
line.set_y1(yearlyh_line, yearlyh_open)
line.set_y2(yearlyh_line, yearlyh_open)
label.set_x(yearlyh_label, yearlyh_limit_right)
label.set_y(yearlyh_label, yearlyh_open)
label.set_text(yearlyh_label, cyhtext)
if mergebool
f_LevelMerge(pricearray, labelarray, yearlyh_open, yearlyh_label, YearlyColor)
//////////////////////////////////////////////////////////////////////////////////
////////////////////////////////////////////////////////////////////////////////// YEEEAARRLLYY OPEN
if is_yearly_enabled
yearly_limit_right = get_limit_right(DEFAULT_EXTEND_RIGHT)
if displayStyle == 'Right Anchored'
yearly_time := get_limit_right(radistance)
yearly_time
var yearly_line = line.new(x1=yearly_time, x2=yearly_limit_right, y1=yearly_open, y2=yearly_open, color=YearlyColor, width=DEFAULT_LINE_WIDTH, xloc=xloc.bar_time, style=linestyles)
var yearly_label = label.new(x=yearly_limit_right, y=yearly_open, text=yotext, style=DEFAULT_LABEL_STYLE, textcolor=YearlyColor, size=DEFAULT_LABEL_SIZE, xloc=xloc.bar_time)
line.set_x1(yearly_line, yearly_time)
line.set_x2(yearly_line, yearly_limit_right)
line.set_y1(yearly_line, yearly_open)
line.set_y2(yearly_line, yearly_open)
label.set_x(yearly_label, yearly_limit_right)
label.set_y(yearly_label, yearly_open)
label.set_text(yearly_label, yotext)
if mergebool
f_LevelMerge(pricearray, labelarray, yearly_open, yearly_label, YearlyColor)
//////////////////////////////////////////////////////////////////////////////////
//////////////////////////////////////////////////////////////////////////////// yearly MID
if is_yearly_mid
yearlym_limit_right = get_limit_right(DEFAULT_EXTEND_RIGHT)
yearlym_time = yearlyh_time
yearlym_open = (yearlyl_open + yearlyh_open) / 2
if displayStyle == 'Right Anchored'
yearlym_time := get_limit_right(radistance)
yearlym_time
var yearlym_line = line.new(x1=yearlym_time, x2=yearlym_limit_right, y1=yearlym_open, y2=yearlym_open, color=YearlyColor, width=DEFAULT_LINE_WIDTH, xloc=xloc.bar_time, style=linestyles)
var yearlym_label = label.new(x=yearlym_limit_right, y=yearlym_open, text=cymtext, style=DEFAULT_LABEL_STYLE, textcolor=YearlyColor, size=DEFAULT_LABEL_SIZE, xloc=xloc.bar_time)
line.set_x1(yearlym_line, yearlym_time)
line.set_x2(yearlym_line, yearlym_limit_right)
line.set_y1(yearlym_line, yearlym_open)
line.set_y2(yearlym_line, yearlym_open)
label.set_x(yearlym_label, yearlym_limit_right)
label.set_y(yearlym_label, yearlym_open)
label.set_text(yearlym_label, cymtext)
if mergebool
f_LevelMerge(pricearray, labelarray, yearlym_open, yearlym_label, YearlyColor)
////////////////////////////////////////////////////////////////////////////////// QUATERLLYYYYY OPEN
if is_quarterly_enabled
quarterly_limit_right = get_limit_right(DEFAULT_EXTEND_RIGHT)
if displayStyle == 'Right Anchored'
quarterly_time := get_limit_right(radistance)
quarterly_time
var quarterly_line = line.new(x1=quarterly_time, x2=quarterly_limit_right, y1=quarterly_open, y2=quarterly_open, color=quarterlyColor, width=DEFAULT_LINE_WIDTH, xloc=xloc.bar_time, style=linestyles)
var quarterly_label = label.new(x=quarterly_limit_right, y=quarterly_open, text=qotext, style=DEFAULT_LABEL_STYLE, textcolor=quarterlyColor, size=DEFAULT_LABEL_SIZE, xloc=xloc.bar_time)
line.set_x1(quarterly_line, quarterly_time)
line.set_x2(quarterly_line, quarterly_limit_right)
line.set_y1(quarterly_line, quarterly_open)
line.set_y2(quarterly_line, quarterly_open)
label.set_x(quarterly_label, quarterly_limit_right)
label.set_y(quarterly_label, quarterly_open)
label.set_text(quarterly_label, qotext)
if mergebool
f_LevelMerge(pricearray, labelarray, quarterly_open, quarterly_label, quarterlyColor)
//////////////////////////////////////////////////////////////////////////////////
////////////////////////////////////////////////////////////////////////////////// QUATERLLYYYYY High
if is_quarterlyrange_enabled
quarterlyh_limit_right = get_limit_right(DEFAULT_EXTEND_RIGHT)
if displayStyle == 'Right Anchored'
quarterlyh_time := get_limit_right(radistance)
quarterlyh_time
var quarterlyh_line = line.new(x1=quarterlyh_time, x2=quarterlyh_limit_right, y1=quarterlyh_open, y2=quarterlyh_open, color=quarterlyColor, width=DEFAULT_LINE_WIDTH, xloc=xloc.bar_time, style=linestyles)
var quarterlyh_label = label.new(x=quarterlyh_limit_right, y=quarterlyh_open, text=pqhtext, style=DEFAULT_LABEL_STYLE, textcolor=quarterlyColor, size=DEFAULT_LABEL_SIZE, xloc=xloc.bar_time)
line.set_x1(quarterlyh_line, quarterlyh_time)
line.set_x2(quarterlyh_line, quarterlyh_limit_right)
line.set_y1(quarterlyh_line, quarterlyh_open)
line.set_y2(quarterlyh_line, quarterlyh_open)
label.set_x(quarterlyh_label, quarterlyh_limit_right)
label.set_y(quarterlyh_label, quarterlyh_open)
label.set_text(quarterlyh_label, pqhtext)
if mergebool
f_LevelMerge(pricearray, labelarray, quarterlyh_open, quarterlyh_label, quarterlyColor)
//////////////////////////////////////////////////////////////////////////////////
////////////////////////////////////////////////////////////////////////////////// QUATERLLYYYYY Low
if is_quarterlyrange_enabled
quarterlyl_limit_right = get_limit_right(DEFAULT_EXTEND_RIGHT)
if displayStyle == 'Right Anchored'
quarterlyl_time := get_limit_right(radistance)
quarterlyl_time
var quarterlyl_line = line.new(x1=quarterlyl_time, x2=quarterlyl_limit_right, y1=quarterlyl_open, y2=quarterlyl_open, color=quarterlyColor, width=DEFAULT_LINE_WIDTH, xloc=xloc.bar_time, style=linestyles)
var quarterlyl_label = label.new(x=quarterlyl_limit_right, y=quarterlyl_open, text=pqltext, style=DEFAULT_LABEL_STYLE, textcolor=quarterlyColor, size=DEFAULT_LABEL_SIZE, xloc=xloc.bar_time)
line.set_x1(quarterlyl_line, quarterlyl_time)
line.set_x2(quarterlyl_line, quarterlyl_limit_right)
line.set_y1(quarterlyl_line, quarterlyl_open)
line.set_y2(quarterlyl_line, quarterlyl_open)
label.set_x(quarterlyl_label, quarterlyl_limit_right)
label.set_y(quarterlyl_label, quarterlyl_open)
label.set_text(quarterlyl_label, pqltext)
if mergebool
f_LevelMerge(pricearray, labelarray, quarterlyl_open, quarterlyl_label, quarterlyColor)
//////////////////////////////////////////////////////////////////////////////////
//////////////////////////////////////////////////////////////////////////////// QUATERLLYYYYY MID
if is_quarterly_mid
quarterlym_limit_right = get_limit_right(DEFAULT_EXTEND_RIGHT)
quarterlym_time = quarterlyh_time
quarterlym_open = (quarterlyl_open + quarterlyh_open) / 2
if displayStyle == 'Right Anchored'
quarterlym_time := get_limit_right(radistance)
quarterlym_time
var quarterlym_line = line.new(x1=quarterlym_time, x2=quarterlym_limit_right, y1=quarterlym_open, y2=quarterlym_open, color=quarterlyColor, width=DEFAULT_LINE_WIDTH, xloc=xloc.bar_time, style=linestyles)
var quarterlym_label = label.new(x=quarterlym_limit_right, y=quarterlym_open, text=pqmtext, style=DEFAULT_LABEL_STYLE, textcolor=quarterlyColor, size=DEFAULT_LABEL_SIZE, xloc=xloc.bar_time)
line.set_x1(quarterlym_line, quarterlym_time)
line.set_x2(quarterlym_line, quarterlym_limit_right)
line.set_y1(quarterlym_line, quarterlym_open)
line.set_y2(quarterlym_line, quarterlym_open)
label.set_x(quarterlym_label, quarterlym_limit_right)
label.set_y(quarterlym_label, quarterlym_open)
label.set_text(quarterlym_label, pqmtext)
if mergebool
f_LevelMerge(pricearray, labelarray, quarterlym_open, quarterlym_label, quarterlyColor)
////////////////////////////////////////////////////////////////////////////////// Monthly LOW LOW LOW
if is_monthlyrange_enabled
monthlyl_limit_right = get_limit_right(DEFAULT_EXTEND_RIGHT)
if displayStyle == 'Right Anchored'
monthlyl_time := get_limit_right(radistance)
monthlyl_time
var monthlyl_line = line.new(x1=monthlyl_time, x2=monthlyl_limit_right, y1=monthlyl_open, y2=monthlyl_open, color=MonthlyColor, width=DEFAULT_LINE_WIDTH, xloc=xloc.bar_time, style=linestyles)
var monthlyl_label = label.new(x=monthlyl_limit_right, y=monthlyl_open, text=pmltext, style=DEFAULT_LABEL_STYLE, textcolor=MonthlyColor, size=DEFAULT_LABEL_SIZE, xloc=xloc.bar_time)
line.set_x1(monthlyl_line, monthlyl_time)
line.set_x2(monthlyl_line, monthlyl_limit_right)
line.set_y1(monthlyl_line, monthlyl_open)
line.set_y2(monthlyl_line, monthlyl_open)
label.set_x(monthlyl_label, monthlyl_limit_right)
label.set_y(monthlyl_label, monthlyl_open)
label.set_text(monthlyl_label, pmltext)
if mergebool
f_LevelMerge(pricearray, labelarray, monthlyl_open, monthlyl_label, MonthlyColor)
// the weekly open can be the daily open too (monday)
// only the weekly will be draw, in these case we update its label
//////////////////////////////////////////////////////////////////////////////////
////////////////////////////////////////////////////////////////////////////////// MONTHLY HIGH HIGH HIGH
if is_monthlyrange_enabled
monthlyh_limit_right = get_limit_right(DEFAULT_EXTEND_RIGHT)
if displayStyle == 'Right Anchored'
monthlyh_time := get_limit_right(radistance)
monthlyh_time
var monthlyh_line = line.new(x1=monthlyh_time, x2=monthlyh_limit_right, y1=monthlyh_open, y2=monthlyh_open, color=MonthlyColor, width=DEFAULT_LINE_WIDTH, xloc=xloc.bar_time, style=linestyles)
var monthlyh_label = label.new(x=monthlyh_limit_right, y=monthlyh_open, text=pmhtext, style=DEFAULT_LABEL_STYLE, textcolor=MonthlyColor, size=DEFAULT_LABEL_SIZE, xloc=xloc.bar_time)
line.set_x1(monthlyh_line, monthlyl_time)
line.set_x2(monthlyh_line, monthlyh_limit_right)
line.set_y1(monthlyh_line, monthlyh_open)
line.set_y2(monthlyh_line, monthlyh_open)
label.set_x(monthlyh_label, monthlyh_limit_right)
label.set_y(monthlyh_label, monthlyh_open)
label.set_text(monthlyh_label, pmhtext)
if mergebool
f_LevelMerge(pricearray, labelarray, monthlyh_open, monthlyh_label, MonthlyColor)
// the weekly open can be the daily open too (monday)
// only the weekly will be draw, in these case we update its label
//////////////////////////////////////////////////////////////////////////////// MONTHLY MID
if is_monthly_mid
monthlym_limit_right = get_limit_right(DEFAULT_EXTEND_RIGHT)
monthlym_time = monthlyh_time
monthlym_open = (monthlyl_open + monthlyh_open) / 2
if displayStyle == 'Right Anchored'
monthlym_time := get_limit_right(radistance)
monthlym_time
var monthlym_line = line.new(x1=monthlym_time, x2=monthlym_limit_right, y1=monthlym_open, y2=monthlym_open, color=MonthlyColor, width=DEFAULT_LINE_WIDTH, xloc=xloc.bar_time, style=linestyles)
var monthlym_label = label.new(x=monthlym_limit_right, y=monthlym_open, text=pmmtext, style=DEFAULT_LABEL_STYLE, textcolor=MonthlyColor, size=DEFAULT_LABEL_SIZE, xloc=xloc.bar_time)
line.set_x1(monthlym_line, monthlym_time)
line.set_x2(monthlym_line, monthlym_limit_right)
line.set_y1(monthlym_line, monthlym_open)
line.set_y2(monthlym_line, monthlym_open)
label.set_x(monthlym_label, monthlym_limit_right)
label.set_y(monthlym_label, monthlym_open)
label.set_text(monthlym_label, pmmtext)
if mergebool
f_LevelMerge(pricearray, labelarray, monthlym_open, monthlym_label, MonthlyColor)
//////////////////////////////////////////////////////////////////////////////////
if is_monthly_enabled
monthly_limit_right = get_limit_right(DEFAULT_EXTEND_RIGHT)
if displayStyle == 'Right Anchored'
monthly_time := get_limit_right(radistance)
monthly_time
var monthlyLine = line.new(x1=monthly_time, x2=monthly_limit_right, y1=monthly_open, y2=monthly_open, color=MonthlyColor, width=DEFAULT_LINE_WIDTH, xloc=xloc.bar_time, style=linestyles)
var monthlyLabel = label.new(x=monthly_limit_right, y=monthly_open, text=motext, style=DEFAULT_LABEL_STYLE, textcolor=MonthlyColor, size=DEFAULT_LABEL_SIZE, xloc=xloc.bar_time)
line.set_x1(monthlyLine, monthly_time)
line.set_x2(monthlyLine, monthly_limit_right)
line.set_y1(monthlyLine, monthly_open)
line.set_y2(monthlyLine, monthly_open)
label.set_x(monthlyLabel, monthly_limit_right)
label.set_y(monthlyLabel, monthly_open)
label.set_text(monthlyLabel, motext)
if mergebool
f_LevelMerge(pricearray, labelarray, monthly_open, monthlyLabel, MonthlyColor)
/////////////////////////////////////////////////////////////////////////////
// the monthly open can be the weekly open (monday 1st) and/or daily open too
// only the monthly will be draw, in these case we update its label
// if is_monthly_open
// if can_show_daily
// label.set_text(monthlyLabel, "DO / MO ")
// if is_weekly_open
// if can_show_weekly
// label.set_text(monthlyLabel, "WO / MO ")
// if can_show_daily and can_show_weekly
// label.set_text(monthlyLabel, "DO / WO / MO ")
// the start of the line is drew from the first week of the month
// if the first day of the weekly candle (monday) is the 2nd of the month
// we fix the start of the line position on the Prev weekly candle
if timeframe.isweekly and dayofweek(monthly_time) != dayofweek.monday
line.set_x1(monthlyLine, monthly_time - (weekly_time - weekly_time ))

ADR % RangesThis indicator is designed to visually represent percentage lines from the open of the day. The % amount is determined by X amount of the last days to create an average...or Average Daily Range (ADR).
1. ADR Percentage Lines: The core function of the script is to apply lines to the chart that represent specific percentage changes from the daily open. It first calculates the average over X amount of days and then displays two lines that are 1/3rd of that average. One line goes above the other line goes below. The other two lines are the full "range" of the average. These lines can act as boundaries or targets to know how an asset has moved recently. *Past performance is not indicative of current or future results.
The calculation for ADR is:
Step 1. Calculate Today's Range = DailyHigh - DailyLow
Step 2. Store this average after the day has completed
Step 3. Sum all day's ranges
Step 4. Divide by total number of days
Step 5. Draw on chart
2. Customizable Inputs: Users have the flexibility to customize the script through various inputs. This includes the option to display lines only for the current trading day (`todayonly`), and to select which lines are displayed. The user can also opt to show a table the displays the total range of previous days and the average range of those previous days.
3. No Secondary Timeframe: The ADR is computed based on whatever timeframe the chart is and does not reference secondary periods. Therefore the script cannot be used on charts greater than daily.
This script is can be used by all traders for any market. The trader might have to adjust the "X" number of days back to compute a historical average. Maybe they only want to know the average over the past week (5 days) or maybe the past month (20 days).

D_H_L_OIndicator Name: D_H_L_O
Primary Function:
This indicator is designed to display buying pressure, selling pressure, and other key metrics derived from the daily candle on a TradingView chart. It helps you analyze market momentum, buying and selling forces, and price spreads.
Features Overview:
Basic Calculations from Daily Candle:
dailyHigh, dailyLow, dailyOpen, dailyClose: Represent the high, low, open, and close prices of the daily candle.
dailySpread: The difference between the high and low prices of the daily candle.
Buying and Selling Pressure:
Buying Pressure (high_open): The difference between the daily high and the open price.
Selling Pressure (low_open): The absolute difference between the daily low and the open price (displayed as a negative value).
deltaVolume: The net difference between buying and selling pressure.
Color and Visuals:
Blue (buyingColor): Indicates buying pressure for green (bullish) days.
Orange (sellingColor): Indicates selling pressure for red (bearish) days.
Displays bars with transparency to distinguish buying and selling forces.
Neutral Reference Line:
A horizontal line at 0 for quick visual comparison of buying and selling forces.
Labels for Key Information:
Displays values of buying pressure, selling pressure, and daily candle spread directly on the chart at corresponding bar positions.
Includes the weekday name (currentWeekday) for additional time context.
Historical Statistics:
Highest and lowest values of buying and selling pressure across the dataset.
Average buying and selling pressure.
Displays statistical summaries (like maximum pressure values) as labels on the last bar of the chart.
Benefits:
Detailed Market Pressure Visualization: Provides a clear view of the forces driving market movement each day.
Historical Context: Helps analyze historical trends in buying and selling pressures over time.
Decision-Making Support: Use pressure metrics to gauge market momentum and assess potential trends.
How to Use:
Copy and paste the script into TradingView (create a new indicator using Pine Script v5).
Add the indicator to your chart on any timeframe to observe daily candle metrics.
Customize colors, transparency, or other parameters to suit your trading style.
This indicator is ideal for traders who want to analyze price momentum and make decisions based on daily market behavior.
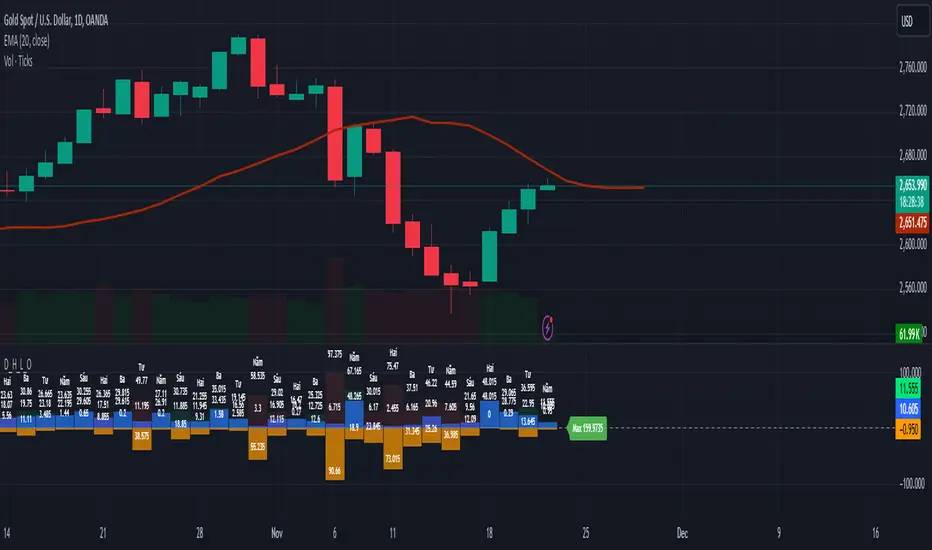
Naveen Prabhu with EMA//@version=6
indicator('Naveen Prabhu with EMA', overlay = true, max_labels_count = 500, max_lines_count = 500, max_boxes_count = 500)
a = input(2, title = 'Key Vaule. \'This changes the sensitivity\'')
c = input(5, title = 'ATR Period')
h = input(false, title = 'Signals from Heikin Ashi Candles')
BULLISH_LEG = 1
BEARISH_LEG = 0
BULLISH = +1
BEARISH = -1
GREEN = #089981
RED = #F23645
BLUE = #2157f3
GRAY = #878b94
MONO_BULLISH = #b2b5be
MONO_BEARISH = #5d606b
HISTORICAL = 'Historical'
PRESENT = 'Present'
COLORED = 'Colored'
MONOCHROME = 'Monochrome'
ALL = 'All'
BOS = 'BOS'
CHOCH = 'CHoCH'
TINY = size.tiny
SMALL = size.small
NORMAL = size.normal
ATR = 'Atr'
RANGE = 'Cumulative Mean Range'
CLOSE = 'Close'
HIGHLOW = 'High/Low'
SOLID = '⎯⎯⎯'
DASHED = '----'
DOTTED = '····'
SMART_GROUP = 'Smart Money Concepts'
INTERNAL_GROUP = 'Real Time Internal Structure'
SWING_GROUP = 'Real Time Swing Structure'
BLOCKS_GROUP = 'Order Blocks'
EQUAL_GROUP = 'EQH/EQL'
GAPS_GROUP = 'Fair Value Gaps'
LEVELS_GROUP = 'Highs & Lows MTF'
ZONES_GROUP = 'Premium & Discount Zones'
modeTooltip = 'Allows to display historical Structure or only the recent ones'
styleTooltip = 'Indicator color theme'
showTrendTooltip = 'Display additional candles with a color reflecting the current trend detected by structure'
showInternalsTooltip = 'Display internal market structure'
internalFilterConfluenceTooltip = 'Filter non significant internal structure breakouts'
showStructureTooltip = 'Display swing market Structure'
showSwingsTooltip = 'Display swing point as labels on the chart'
showHighLowSwingsTooltip = 'Highlight most recent strong and weak high/low points on the chart'
showInternalOrderBlocksTooltip = 'Display internal order blocks on the chart\n\nNumber of internal order blocks to display on the chart'
showSwingOrderBlocksTooltip = 'Display swing order blocks on the chart\n\nNumber of internal swing blocks to display on the chart'
orderBlockFilterTooltip = 'Method used to filter out volatile order blocks \n\nIt is recommended to use the cumulative mean range method when a low amount of data is available'
orderBlockMitigationTooltip = 'Select what values to use for order block mitigation'
showEqualHighsLowsTooltip = 'Display equal highs and equal lows on the chart'
equalHighsLowsLengthTooltip = 'Number of bars used to confirm equal highs and equal lows'
equalHighsLowsThresholdTooltip = 'Sensitivity threshold in a range (0, 1) used for the detection of equal highs & lows\n\nLower values will return fewer but more pertinent results'
showFairValueGapsTooltip = 'Display fair values gaps on the chart'
fairValueGapsThresholdTooltip = 'Filter out non significant fair value gaps'
fairValueGapsTimeframeTooltip = 'Fair value gaps timeframe'
fairValueGapsExtendTooltip = 'Determine how many bars to extend the Fair Value Gap boxes on chart'
showPremiumDiscountZonesTooltip = 'Display premium, discount, and equilibrium zones on chart'
modeInput = input.string( HISTORICAL, 'Mode', group = SMART_GROUP, tooltip = modeTooltip, options = )
styleInput = input.string( COLORED, 'Style', group = SMART_GROUP, tooltip = styleTooltip,options = )
showTrendInput = input( false, 'Color Candles', group = SMART_GROUP, tooltip = showTrendTooltip)
showInternalsInput = input( false, 'Show Internal Structure', group = INTERNAL_GROUP, tooltip = showInternalsTooltip)
showInternalBullInput = input.string( ALL, 'Bullish Structure', group = INTERNAL_GROUP, inline = 'ibull', options = )
internalBullColorInput = input( GREEN, '', group = INTERNAL_GROUP, inline = 'ibull')
showInternalBearInput = input.string( ALL, 'Bearish Structure' , group = INTERNAL_GROUP, inline = 'ibear', options = )
internalBearColorInput = input( RED, '', group = INTERNAL_GROUP, inline = 'ibear')
internalFilterConfluenceInput = input( false, 'Confluence Filter', group = INTERNAL_GROUP, tooltip = internalFilterConfluenceTooltip)
internalStructureSize = input.string( TINY, 'Internal Label Size', group = INTERNAL_GROUP, options = )
showStructureInput = input( false, 'Show Swing Structure', group = SWING_GROUP, tooltip = showStructureTooltip)
showSwingBullInput = input.string( ALL, 'Bullish Structure', group = SWING_GROUP, inline = 'bull', options = )
swingBullColorInput = input( GREEN, '', group = SWING_GROUP, inline = 'bull')
showSwingBearInput = input.string( ALL, 'Bearish Structure', group = SWING_GROUP, inline = 'bear', options = )
swingBearColorInput = input( RED, '', group = SWING_GROUP, inline = 'bear')
swingStructureSize = input.string( SMALL, 'Swing Label Size', group = SWING_GROUP, options = )
showSwingsInput = input( false, 'Show Swings Points', group = SWING_GROUP, tooltip = showSwingsTooltip,inline = 'swings')
swingsLengthInput = input.int( 50, '', group = SWING_GROUP, minval = 10, inline = 'swings')
showHighLowSwingsInput = input( false, 'Show Strong/Weak High/Low',group = SWING_GROUP, tooltip = showHighLowSwingsTooltip)
showInternalOrderBlocksInput = input( true, 'Internal Order Blocks' , group = BLOCKS_GROUP, tooltip = showInternalOrderBlocksTooltip, inline = 'iob')
internalOrderBlocksSizeInput = input.int( 5, '', group = BLOCKS_GROUP, minval = 1, maxval = 20, inline = 'iob')
showSwingOrderBlocksInput = input( true, 'Swing Order Blocks', group = BLOCKS_GROUP, tooltip = showSwingOrderBlocksTooltip, inline = 'ob')
swingOrderBlocksSizeInput = input.int( 5, '', group = BLOCKS_GROUP, minval = 1, maxval = 20, inline = 'ob')
orderBlockFilterInput = input.string( 'Atr', 'Order Block Filter', group = BLOCKS_GROUP, tooltip = orderBlockFilterTooltip, options = )
orderBlockMitigationInput = input.string( HIGHLOW, 'Order Block Mitigation', group = BLOCKS_GROUP, tooltip = orderBlockMitigationTooltip, options = )
internalBullishOrderBlockColor = input.color(color.new(GREEN, 80), 'Internal Bullish OB', group = BLOCKS_GROUP)
internalBearishOrderBlockColor = input.color(color.new(#f77c80, 80), 'Internal Bearish OB', group = BLOCKS_GROUP)
swingBullishOrderBlockColor = input.color(color.new(GREEN, 80), 'Bullish OB', group = BLOCKS_GROUP)
swingBearishOrderBlockColor = input.color(color.new(#b22833, 80), 'Bearish OB', group = BLOCKS_GROUP)
showEqualHighsLowsInput = input( false, 'Equal High/Low', group = EQUAL_GROUP, tooltip = showEqualHighsLowsTooltip)
equalHighsLowsLengthInput = input.int( 3, 'Bars Confirmation', group = EQUAL_GROUP, tooltip = equalHighsLowsLengthTooltip, minval = 1)
equalHighsLowsThresholdInput = input.float( 0.1, 'Threshold', group = EQUAL_GROUP, tooltip = equalHighsLowsThresholdTooltip, minval = 0, maxval = 0.5, step = 0.1)
equalHighsLowsSizeInput = input.string( TINY, 'Label Size', group = EQUAL_GROUP, options = )
showFairValueGapsInput = input( false, 'Fair Value Gaps', group = GAPS_GROUP, tooltip = showFairValueGapsTooltip)
fairValueGapsThresholdInput = input( true, 'Auto Threshold', group = GAPS_GROUP, tooltip = fairValueGapsThresholdTooltip)
fairValueGapsTimeframeInput = input.timeframe('', 'Timeframe', group = GAPS_GROUP, tooltip = fairValueGapsTimeframeTooltip)
fairValueGapsBullColorInput = input.color(color.new(#00ff68, 70), 'Bullish FVG' , group = GAPS_GROUP)
fairValueGapsBearColorInput = input.color(color.new(#ff0008, 70), 'Bearish FVG' , group = GAPS_GROUP)
fairValueGapsExtendInput = input.int( 1, 'Extend FVG', group = GAPS_GROUP, tooltip = fairValueGapsExtendTooltip, minval = 0)
showDailyLevelsInput = input( false, 'Daily', group = LEVELS_GROUP, inline = 'daily')
dailyLevelsStyleInput = input.string( SOLID, '', group = LEVELS_GROUP, inline = 'daily', options = )
dailyLevelsColorInput = input( BLUE, '', group = LEVELS_GROUP, inline = 'daily')
showWeeklyLevelsInput = input( false, 'Weekly', group = LEVELS_GROUP, inline = 'weekly')
weeklyLevelsStyleInput = input.string( SOLID, '', group = LEVELS_GROUP, inline = 'weekly', options = )
weeklyLevelsColorInput = input( BLUE, '', group = LEVELS_GROUP, inline = 'weekly')
showMonthlyLevelsInput = input( false, 'Monthly', group = LEVELS_GROUP, inline = 'monthly')
monthlyLevelsStyleInput = input.string( SOLID, '', group = LEVELS_GROUP, inline = 'monthly', options = )
monthlyLevelsColorInput = input( BLUE, '', group = LEVELS_GROUP, inline = 'monthly')
showPremiumDiscountZonesInput = input( false, 'Premium/Discount Zones', group = ZONES_GROUP , tooltip = showPremiumDiscountZonesTooltip)
premiumZoneColorInput = input.color( RED, 'Premium Zone', group = ZONES_GROUP)
equilibriumZoneColorInput = input.color( GRAY, 'Equilibrium Zone', group = ZONES_GROUP)
discountZoneColorInput = input.color( GREEN, 'Discount Zone', group = ZONES_GROUP)
type alerts
bool internalBullishBOS = false
bool internalBearishBOS = false
bool internalBullishCHoCH = false
bool internalBearishCHoCH = false
bool swingBullishBOS = false
bool swingBearishBOS = false
bool swingBullishCHoCH = false
bool swingBearishCHoCH = false
bool internalBullishOrderBlock = false
bool internalBearishOrderBlock = false
bool swingBullishOrderBlock = false
bool swingBearishOrderBlock = false
bool equalHighs = false
bool equalLows = false
bool bullishFairValueGap = false
bool bearishFairValueGap = false
type trailingExtremes
float top
float bottom
int barTime
int barIndex
int lastTopTime
int lastBottomTime
type fairValueGap
float top
float bottom
int bias
box topBox
box bottomBox
type trend
int bias
type equalDisplay
line l_ine = na
label l_abel = na
type pivot
float currentLevel
float lastLevel
bool crossed
int barTime = time
int barIndex = bar_index
type orderBlock
float barHigh
float barLow
int barTime
int bias
// @variable current swing pivot high
var pivot swingHigh = pivot.new(na,na,false)
// @variable current swing pivot low
var pivot swingLow = pivot.new(na,na,false)
// @variable current internal pivot high
var pivot internalHigh = pivot.new(na,na,false)
// @variable current internal pivot low
var pivot internalLow = pivot.new(na,na,false)
// @variable current equal high pivot
var pivot equalHigh = pivot.new(na,na,false)
// @variable current equal low pivot
var pivot equalLow = pivot.new(na,na,false)
// @variable swing trend bias
var trend swingTrend = trend.new(0)
// @variable internal trend bias
var trend internalTrend = trend.new(0)
// @variable equal high display
var equalDisplay equalHighDisplay = equalDisplay.new()
// @variable equal low display
var equalDisplay equalLowDisplay = equalDisplay.new()
// @variable storage for fairValueGap UDTs
var array fairValueGaps = array.new()
// @variable storage for parsed highs
var array parsedHighs = array.new()
// @variable storage for parsed lows
var array parsedLows = array.new()
// @variable storage for raw highs
var array highs = array.new()
// @variable storage for raw lows
var array lows = array.new()
// @variable storage for bar time values
var array times = array.new()
// @variable last trailing swing high and low
var trailingExtremes trailing = trailingExtremes.new()
// @variable storage for orderBlock UDTs (swing order blocks)
var array swingOrderBlocks = array.new()
// @variable storage for orderBlock UDTs (internal order blocks)
var array internalOrderBlocks = array.new()
// @variable storage for swing order blocks boxes
var array swingOrderBlocksBoxes = array.new()
// @variable storage for internal order blocks boxes
var array internalOrderBlocksBoxes = array.new()
// @variable color for swing bullish structures
var swingBullishColor = styleInput == MONOCHROME ? MONO_BULLISH : swingBullColorInput
// @variable color for swing bearish structures
var swingBearishColor = styleInput == MONOCHROME ? MONO_BEARISH : swingBearColorInput
// @variable color for bullish fair value gaps
var fairValueGapBullishColor = styleInput == MONOCHROME ? color.new(MONO_BULLISH,70) : fairValueGapsBullColorInput
// @variable color for bearish fair value gaps
var fairValueGapBearishColor = styleInput == MONOCHROME ? color.new(MONO_BEARISH,70) : fairValueGapsBearColorInput
// @variable color for premium zone
var premiumZoneColor = styleInput == MONOCHROME ? MONO_BEARISH : premiumZoneColorInput
// @variable color for discount zone
var discountZoneColor = styleInput == MONOCHROME ? MONO_BULLISH : discountZoneColorInput
// @variable bar index on current script iteration
varip int currentBarIndex = bar_index
// @variable bar index on last script iteration
varip int lastBarIndex = bar_index
// @variable alerts in current bar
alerts currentAlerts = alerts.new()
// @variable time at start of chart
var initialTime = time
// we create the needed boxes for displaying order blocks at the first execution
if barstate.isfirst
if showSwingOrderBlocksInput
for index = 1 to swingOrderBlocksSizeInput
swingOrderBlocksBoxes.push(box.new(na,na,na,na,xloc = xloc.bar_time,extend = extend.right))
if showInternalOrderBlocksInput
for index = 1 to internalOrderBlocksSizeInput
internalOrderBlocksBoxes.push(box.new(na,na,na,na,xloc = xloc.bar_time,extend = extend.right))
// @variable source to use in bearish order blocks mitigation
bearishOrderBlockMitigationSource = orderBlockMitigationInput == CLOSE ? close : high
// @variable source to use in bullish order blocks mitigation
bullishOrderBlockMitigationSource = orderBlockMitigationInput == CLOSE ? close : low
// @variable default volatility measure
atrMeasure = ta.atr(200)
// @variable parsed volatility measure by user settings
volatilityMeasure = orderBlockFilterInput == ATR ? atrMeasure : ta.cum(ta.tr)/bar_index
// @variable true if current bar is a high volatility bar
highVolatilityBar = (high - low) >= (2 * volatilityMeasure)
// @variable parsed high
parsedHigh = highVolatilityBar ? low : high
// @variable parsed low
parsedLow = highVolatilityBar ? high : low
// we store current values into the arrays at each bar
parsedHighs.push(parsedHigh)
parsedLows.push(parsedLow)
highs.push(high)
lows.push(low)
times.push(time)
leg(int size) =>
var leg = 0
newLegHigh = high > ta.highest( size)
newLegLow = low < ta.lowest( size)
if newLegHigh
leg := BEARISH_LEG
else if newLegLow
leg := BULLISH_LEG
leg
startOfNewLeg(int leg) => ta.change(leg) != 0
startOfBearishLeg(int leg) => ta.change(leg) == -1
startOfBullishLeg(int leg) => ta.change(leg) == +1
drawLabel(int labelTime, float labelPrice, string tag, color labelColor, string labelStyle) =>
var label l_abel = na
if modeInput == PRESENT
l_abel.delete()
l_abel := label.new(chart.point.new(labelTime,na,labelPrice),tag,xloc.bar_time,color=color(na),textcolor=labelColor,style = labelStyle,size = size.small)
drawEqualHighLow(pivot p_ivot, float level, int size, bool equalHigh) =>
equalDisplay e_qualDisplay = equalHigh ? equalHighDisplay : equalLowDisplay
string tag = 'EQL'
color equalColor = swingBullishColor
string labelStyle = label.style_label_up
if equalHigh
tag := 'EQH'
equalColor := swingBearishColor
labelStyle := label.style_label_down
if modeInput == PRESENT
line.delete( e_qualDisplay.l_ine)
label.delete( e_qualDisplay.l_abel)
e_qualDisplay.l_ine := line.new(chart.point.new(p_ivot.barTime,na,p_ivot.currentLevel), chart.point.new(time ,na,level), xloc = xloc.bar_time, color = equalColor, style = line.style_dotted)
labelPosition = math.round(0.5*(p_ivot.barIndex + bar_index - size))
e_qualDisplay.l_abel := label.new(chart.point.new(na,labelPosition,level), tag, xloc.bar_index, color = color(na), textcolor = equalColor, style = labelStyle, size = equalHighsLowsSizeInput)
getCurrentStructure(int size,bool equalHighLow = false, bool internal = false) =>
currentLeg = leg(size)
newPivot = startOfNewLeg(currentLeg)
pivotLow = startOfBullishLeg(currentLeg)
pivotHigh = startOfBearishLeg(currentLeg)
if newPivot
if pivotLow
pivot p_ivot = equalHighLow ? equalLow : internal ? internalLow : swingLow
if equalHighLow and math.abs(p_ivot.currentLevel - low ) < equalHighsLowsThresholdInput * atrMeasure
drawEqualHighLow(p_ivot, low , size, false)
p_ivot.lastLevel := p_ivot.currentLevel
p_ivot.currentLevel := low
p_ivot.crossed := false
p_ivot.barTime := time
p_ivot.barIndex := bar_index
if not equalHighLow and not internal
trailing.bottom := p_ivot.currentLevel
trailing.barTime := p_ivot.barTime
trailing.barIndex := p_ivot.barIndex
trailing.lastBottomTime := p_ivot.barTime
if showSwingsInput and not internal and not equalHighLow
drawLabel(time , p_ivot.currentLevel, p_ivot.currentLevel < p_ivot.lastLevel ? 'LL' : 'HL', swingBullishColor, label.style_label_up)
else
pivot p_ivot = equalHighLow ? equalHigh : internal ? internalHigh : swingHigh
if equalHighLow and math.abs(p_ivot.currentLevel - high ) < equalHighsLowsThresholdInput * atrMeasure
drawEqualHighLow(p_ivot,high ,size,true)
p_ivot.lastLevel := p_ivot.currentLevel
p_ivot.currentLevel := high
p_ivot.crossed := false
p_ivot.barTime := time
p_ivot.barIndex := bar_index
if not equalHighLow and not internal
trailing.top := p_ivot.currentLevel
trailing.barTime := p_ivot.barTime
trailing.barIndex := p_ivot.barIndex
trailing.lastTopTime := p_ivot.barTime
if showSwingsInput and not internal and not equalHighLow
drawLabel(time , p_ivot.currentLevel, p_ivot.currentLevel > p_ivot.lastLevel ? 'HH' : 'LH', swingBearishColor, label.style_label_down)
drawStructure(pivot p_ivot, string tag, color structureColor, string lineStyle, string labelStyle, string labelSize) =>
var line l_ine = line.new(na,na,na,na,xloc = xloc.bar_time)
var label l_abel = label.new(na,na)
if modeInput == PRESENT
l_ine.delete()
l_abel.delete()
l_ine := line.new(chart.point.new(p_ivot.barTime,na,p_ivot.currentLevel), chart.point.new(time,na,p_ivot.currentLevel), xloc.bar_time, color=structureColor, style=lineStyle)
l_abel := label.new(chart.point.new(na,math.round(0.5*(p_ivot.barIndex+bar_index)),p_ivot.currentLevel), tag, xloc.bar_index, color=color(na), textcolor=structureColor, style=labelStyle, size = labelSize)
deleteOrderBlocks(bool internal = false) =>
array orderBlocks = internal ? internalOrderBlocks : swingOrderBlocks
for in orderBlocks
bool crossedOderBlock = false
if bearishOrderBlockMitigationSource > eachOrderBlock.barHigh and eachOrderBlock.bias == BEARISH
crossedOderBlock := true
if internal
currentAlerts.internalBearishOrderBlock := true
else
currentAlerts.swingBearishOrderBlock := true
else if bullishOrderBlockMitigationSource < eachOrderBlock.barLow and eachOrderBlock.bias == BULLISH
crossedOderBlock := true
if internal
currentAlerts.internalBullishOrderBlock := true
else
currentAlerts.swingBullishOrderBlock := true
if crossedOderBlock
orderBlocks.remove(index)
storeOrdeBlock(pivot p_ivot,bool internal = false,int bias) =>
if (not internal and showSwingOrderBlocksInput) or (internal and showInternalOrderBlocksInput)
array a_rray = na
int parsedIndex = na
if bias == BEARISH
a_rray := parsedHighs.slice(p_ivot.barIndex,bar_index)
parsedIndex := p_ivot.barIndex + a_rray.indexof(a_rray.max())
else
a_rray := parsedLows.slice(p_ivot.barIndex,bar_index)
parsedIndex := p_ivot.barIndex + a_rray.indexof(a_rray.min())
orderBlock o_rderBlock = orderBlock.new(parsedHighs.get(parsedIndex), parsedLows.get(parsedIndex), times.get(parsedIndex),bias)
array orderBlocks = internal ? internalOrderBlocks : swingOrderBlocks
if orderBlocks.size() >= 100
orderBlocks.pop()
orderBlocks.unshift(o_rderBlock)
drawOrderBlocks(bool internal = false) =>
array orderBlocks = internal ? internalOrderBlocks : swingOrderBlocks
orderBlocksSize = orderBlocks.size()
if orderBlocksSize > 0
maxOrderBlocks = internal ? internalOrderBlocksSizeInput : swingOrderBlocksSizeInput
array parsedOrdeBlocks = orderBlocks.slice(0, math.min(maxOrderBlocks,orderBlocksSize))
array b_oxes = internal ? internalOrderBlocksBoxes : swingOrderBlocksBoxes
for in parsedOrdeBlocks
orderBlockColor = styleInput == MONOCHROME ? (eachOrderBlock.bias == BEARISH ? color.new(MONO_BEARISH,80) : color.new(MONO_BULLISH,80)) : internal ? (eachOrderBlock.bias == BEARISH ? internalBearishOrderBlockColor : internalBullishOrderBlockColor) : (eachOrderBlock.bias == BEARISH ? swingBearishOrderBlockColor : swingBullishOrderBlockColor)
box b_ox = b_oxes.get(index)
b_ox.set_top_left_point( chart.point.new(eachOrderBlock.barTime,na,eachOrderBlock.barHigh))
b_ox.set_bottom_right_point(chart.point.new(last_bar_time,na,eachOrderBlock.barLow))
b_ox.set_border_color( internal ? na : orderBlockColor)
b_ox.set_bgcolor( orderBlockColor)
displayStructure(bool internal = false) =>
var bullishBar = true
var bearishBar = true
if internalFilterConfluenceInput
bullishBar := high - math.max(close, open) > math.min(close, open - low)
bearishBar := high - math.max(close, open) < math.min(close, open - low)
pivot p_ivot = internal ? internalHigh : swingHigh
trend t_rend = internal ? internalTrend : swingTrend
lineStyle = internal ? line.style_dashed : line.style_solid
labelSize = internal ? internalStructureSize : swingStructureSize
extraCondition = internal ? internalHigh.currentLevel != swingHigh.currentLevel and bullishBar : true
bullishColor = styleInput == MONOCHROME ? MONO_BULLISH : internal ? internalBullColorInput : swingBullColorInput
if ta.crossover(close,p_ivot.currentLevel) and not p_ivot.crossed and extraCondition
string tag = t_rend.bias == BEARISH ? CHOCH : BOS
if internal
currentAlerts.internalBullishCHoCH := tag == CHOCH
currentAlerts.internalBullishBOS := tag == BOS
else
currentAlerts.swingBullishCHoCH := tag == CHOCH
currentAlerts.swingBullishBOS := tag == BOS
p_ivot.crossed := true
t_rend.bias := BULLISH
displayCondition = internal ? showInternalsInput and (showInternalBullInput == ALL or (showInternalBullInput == BOS and tag != CHOCH) or (showInternalBullInput == CHOCH and tag == CHOCH)) : showStructureInput and (showSwingBullInput == ALL or (showSwingBullInput == BOS and tag != CHOCH) or (showSwingBullInput == CHOCH and tag == CHOCH))
if displayCondition
drawStructure(p_ivot,tag,bullishColor,lineStyle,label.style_label_down,labelSize)
if (internal and showInternalOrderBlocksInput) or (not internal and showSwingOrderBlocksInput)
storeOrdeBlock(p_ivot,internal,BULLISH)
p_ivot := internal ? internalLow : swingLow
extraCondition := internal ? internalLow.currentLevel != swingLow.currentLevel and bearishBar : true
bearishColor = styleInput == MONOCHROME ? MONO_BEARISH : internal ? internalBearColorInput : swingBearColorInput
if ta.crossunder(close,p_ivot.currentLevel) and not p_ivot.crossed and extraCondition
string tag = t_rend.bias == BULLISH ? CHOCH : BOS
if internal
currentAlerts.internalBearishCHoCH := tag == CHOCH
currentAlerts.internalBearishBOS := tag == BOS
else
currentAlerts.swingBearishCHoCH := tag == CHOCH
currentAlerts.swingBearishBOS := tag == BOS
p_ivot.crossed := true
t_rend.bias := BEARISH
displayCondition = internal ? showInternalsInput and (showInternalBearInput == ALL or (showInternalBearInput == BOS and tag != CHOCH) or (showInternalBearInput == CHOCH and tag == CHOCH)) : showStructureInput and (showSwingBearInput == ALL or (showSwingBearInput == BOS and tag != CHOCH) or (showSwingBearInput == CHOCH and tag == CHOCH))
if displayCondition
drawStructure(p_ivot,tag,bearishColor,lineStyle,label.style_label_up,labelSize)
if (internal and showInternalOrderBlocksInput) or (not internal and showSwingOrderBlocksInput)
storeOrdeBlock(p_ivot,internal,BEARISH)
fairValueGapBox(leftTime,rightTime,topPrice,bottomPrice,boxColor) => box.new(chart.point.new(leftTime,na,topPrice),chart.point.new(rightTime + fairValueGapsExtendInput * (time-time ),na,bottomPrice), xloc=xloc.bar_time, border_color = boxColor, bgcolor = boxColor)
deleteFairValueGaps() =>
for in fairValueGaps
if (low < eachFairValueGap.bottom and eachFairValueGap.bias == BULLISH) or (high > eachFairValueGap.top and eachFairValueGap.bias == BEARISH)
eachFairValueGap.topBox.delete()
eachFairValueGap.bottomBox.delete()
fairValueGaps.remove(index)
// @function draw fair value gaps
// @returns fairValueGap ID
drawFairValueGaps() =>
= request.security(syminfo.tickerid, fairValueGapsTimeframeInput, [close , open , time , high , low , time , high , low ],lookahead = barmerge.lookahead_on)
barDeltaPercent = (lastClose - lastOpen) / (lastOpen * 100)
newTimeframe = timeframe.change(fairValueGapsTimeframeInput)
threshold = fairValueGapsThresholdInput ? ta.cum(math.abs(newTimeframe ? barDeltaPercent : 0)) / bar_index * 2 : 0
bullishFairValueGap = currentLow > last2High and lastClose > last2High and barDeltaPercent > threshold and newTimeframe
bearishFairValueGap = currentHigh < last2Low and lastClose < last2Low and -barDeltaPercent > threshold and newTimeframe
if bullishFairValueGap
currentAlerts.bullishFairValueGap := true
fairValueGaps.unshift(fairValueGap.new(currentLow,last2High,BULLISH,fairValueGapBox(lastTime,currentTime,currentLow,math.avg(currentLow,last2High),fairValueGapBullishColor),fairValueGapBox(lastTime,currentTime,math.avg(currentLow,last2High),last2High,fairValueGapBullishColor)))
if bearishFairValueGap
currentAlerts.bearishFairValueGap := true
fairValueGaps.unshift(fairValueGap.new(currentHigh,last2Low,BEARISH,fairValueGapBox(lastTime,currentTime,currentHigh,math.avg(currentHigh,last2Low),fairValueGapBearishColor),fairValueGapBox(lastTime,currentTime,math.avg(currentHigh,last2Low),last2Low,fairValueGapBearishColor)))
getStyle(string style) =>
switch style
SOLID => line.style_solid
DASHED => line.style_dashed
DOTTED => line.style_dotted
drawLevels(string timeframe, bool sameTimeframe, string style, color levelColor) =>
= request.security(syminfo.tickerid, timeframe, [high , low , time , time],lookahead = barmerge.lookahead_on)
float parsedTop = sameTimeframe ? high : topLevel
float parsedBottom = sameTimeframe ? low : bottomLevel
int parsedLeftTime = sameTimeframe ? time : leftTime
int parsedRightTime = sameTimeframe ? time : rightTime
int parsedTopTime = time
int parsedBottomTime = time
if not sameTimeframe
int leftIndex = times.binary_search_rightmost(parsedLeftTime)
int rightIndex = times.binary_search_rightmost(parsedRightTime)
array timeArray = times.slice(leftIndex,rightIndex)
array topArray = highs.slice(leftIndex,rightIndex)
array bottomArray = lows.slice(leftIndex,rightIndex)
parsedTopTime := timeArray.size() > 0 ? timeArray.get(topArray.indexof(topArray.max())) : initialTime
parsedBottomTime := timeArray.size() > 0 ? timeArray.get(bottomArray.indexof(bottomArray.min())) : initialTime
var line topLine = line.new(na, na, na, na, xloc = xloc.bar_time, color = levelColor, style = getStyle(style))
var line bottomLine = line.new(na, na, na, na, xloc = xloc.bar_time, color = levelColor, style = getStyle(style))
var label topLabel = label.new(na, na, xloc = xloc.bar_time, text = str.format('P{0}H',timeframe), color=color(na), textcolor = levelColor, size = size.small, style = label.style_label_left)
var label bottomLabel = label.new(na, na, xloc = xloc.bar_time, text = str.format('P{0}L',timeframe), color=color(na), textcolor = levelColor, size = size.small, style = label.style_label_left)
topLine.set_first_point( chart.point.new(parsedTopTime,na,parsedTop))
topLine.set_second_point( chart.point.new(last_bar_time + 20 * (time-time ),na,parsedTop))
topLabel.set_point( chart.point.new(last_bar_time + 20 * (time-time ),na,parsedTop))
bottomLine.set_first_point( chart.point.new(parsedBottomTime,na,parsedBottom))
bottomLine.set_second_point(chart.point.new(last_bar_time + 20 * (time-time ),na,parsedBottom))
bottomLabel.set_point( chart.point.new(last_bar_time + 20 * (time-time ),na,parsedBottom))
higherTimeframe(string timeframe) => timeframe.in_seconds() > timeframe.in_seconds(timeframe)
updateTrailingExtremes() =>
trailing.top := math.max(high,trailing.top)
trailing.lastTopTime := trailing.top == high ? time : trailing.lastTopTime
trailing.bottom := math.min(low,trailing.bottom)
trailing.lastBottomTime := trailing.bottom == low ? time : trailing.lastBottomTime
drawHighLowSwings() =>
var line topLine = line.new(na, na, na, na, color = swingBearishColor, xloc = xloc.bar_time)
var line bottomLine = line.new(na, na, na, na, color = swingBullishColor, xloc = xloc.bar_time)
var label topLabel = label.new(na, na, color=color(na), textcolor = swingBearishColor, xloc = xloc.bar_time, style = label.style_label_down, size = size.tiny)
var label bottomLabel = label.new(na, na, color=color(na), textcolor = swingBullishColor, xloc = xloc.bar_time, style = label.style_label_up, size = size.tiny)
rightTimeBar = last_bar_time + 20 * (time - time )
topLine.set_first_point( chart.point.new(trailing.lastTopTime, na, trailing.top))
topLine.set_second_point( chart.point.new(rightTimeBar, na, trailing.top))
topLabel.set_point( chart.point.new(rightTimeBar, na, trailing.top))
topLabel.set_text( swingTrend.bias == BEARISH ? 'Strong High' : 'Weak High')
bottomLine.set_first_point( chart.point.new(trailing.lastBottomTime, na, trailing.bottom))
bottomLine.set_second_point(chart.point.new(rightTimeBar, na, trailing.bottom))
bottomLabel.set_point( chart.point.new(rightTimeBar, na, trailing.bottom))
bottomLabel.set_text( swingTrend.bias == BULLISH ? 'Strong Low' : 'Weak Low')
drawZone(float labelLevel, int labelIndex, float top, float bottom, string tag, color zoneColor, string style) =>
var label l_abel = label.new(na,na,text = tag, color=color(na),textcolor = zoneColor, style = style, size = size.small)
var box b_ox = box.new(na,na,na,na,bgcolor = color.new(zoneColor,80),border_color = color(na), xloc = xloc.bar_time)
b_ox.set_top_left_point( chart.point.new(trailing.barTime,na,top))
b_ox.set_bottom_right_point(chart.point.new(last_bar_time,na,bottom))
l_abel.set_point( chart.point.new(na,labelIndex,labelLevel))
// @function draw premium/discount zones
// @returns void
drawPremiumDiscountZones() =>
drawZone(trailing.top, math.round(0.5*(trailing.barIndex + last_bar_index)), trailing.top, 0.95*trailing.top + 0.05*trailing.bottom, 'Premium', premiumZoneColor, label.style_label_down)
equilibriumLevel = math.avg(trailing.top, trailing.bottom)
drawZone(equilibriumLevel, last_bar_index, 0.525*trailing.top + 0.475*trailing.bottom, 0.525*trailing.bottom + 0.475*trailing.top, 'Equilibrium', equilibriumZoneColorInput, label.style_label_left)
drawZone(trailing.bottom, math.round(0.5*(trailing.barIndex + last_bar_index)), 0.95*trailing.bottom + 0.05*trailing.top, trailing.bottom, 'Discount', discountZoneColor, label.style_label_up)
parsedOpen = showTrendInput ? open : na
candleColor = internalTrend.bias == BULLISH ? swingBullishColor : swingBearishColor
plotcandle(parsedOpen,high,low,close,color = candleColor, wickcolor = candleColor, bordercolor = candleColor)
if showHighLowSwingsInput or showPremiumDiscountZonesInput
updateTrailingExtremes()
if showHighLowSwingsInput
drawHighLowSwings()
if showPremiumDiscountZonesInput
drawPremiumDiscountZones()
if showFairValueGapsInput
deleteFairValueGaps()
getCurrentStructure(swingsLengthInput,false)
getCurrentStructure(5,false,true)
if showEqualHighsLowsInput
getCurrentStructure(equalHighsLowsLengthInput,true)
if showInternalsInput or showInternalOrderBlocksInput or showTrendInput
displayStructure(true)
if showStructureInput or showSwingOrderBlocksInput or showHighLowSwingsInput
displayStructure()
if showInternalOrderBlocksInput
deleteOrderBlocks(true)
if showSwingOrderBlocksInput
deleteOrderBlocks()
if showFairValueGapsInput
drawFairValueGaps()
if barstate.islastconfirmedhistory or barstate.islast
if showInternalOrderBlocksInput
drawOrderBlocks(true)
if showSwingOrderBlocksInput
drawOrderBlocks()
lastBarIndex := currentBarIndex
currentBarIndex := bar_index
newBar = currentBarIndex != lastBarIndex
if barstate.islastconfirmedhistory or (barstate.isrealtime and newBar)
if showDailyLevelsInput and not higherTimeframe('D')
drawLevels('D',timeframe.isdaily,dailyLevelsStyleInput,dailyLevelsColorInput)
if showWeeklyLevelsInput and not higherTimeframe('W')
drawLevels('W',timeframe.isweekly,weeklyLevelsStyleInput,weeklyLevelsColorInput)
if showMonthlyLevelsInput and not higherTimeframe('M')
drawLevels('M',timeframe.ismonthly,monthlyLevelsStyleInput,monthlyLevelsColorInput)
xATR = ta.atr(c)
nLoss = a * xATR
src = h ? request.security(ticker.heikinashi(syminfo.tickerid), timeframe.period, close, lookahead = barmerge.lookahead_off) : close
xATRTrailingStop = 0.0
iff_1 = src > nz(xATRTrailingStop , 0) ? src - nLoss : src + nLoss
iff_2 = src < nz(xATRTrailingStop , 0) and src < nz(xATRTrailingStop , 0) ? math.min(nz(xATRTrailingStop ), src + nLoss) : iff_1
xATRTrailingStop := src > nz(xATRTrailingStop , 0) and src > nz(xATRTrailingStop , 0) ? math.max(nz(xATRTrailingStop ), src - nLoss) : iff_2
pos = 0
iff_3 = src > nz(xATRTrailingStop , 0) and src < nz(xATRTrailingStop , 0) ? -1 : nz(pos , 0)
pos := src < nz(xATRTrailingStop , 0) and src > nz(xATRTrailingStop , 0) ? 1 : iff_3
xcolor = pos == -1 ? color.red : pos == 1 ? color.green : color.blue
ema = ta.ema(src, 1)
above = ta.crossover(ema, xATRTrailingStop)
below = ta.crossover(xATRTrailingStop, ema)
buy = src > xATRTrailingStop and above
sell = src < xATRTrailingStop and below
barbuy = src > xATRTrailingStop
barsell = src < xATRTrailingStop
//---------------------------------------------------------------------------------------------------------------------}
//ALERTS
//---------------------------------------------------------------------------------------------------------------------{
alertcondition(currentAlerts.internalBullishBOS, 'Internal Bullish BOS', 'Internal Bullish BOS formed')
alertcondition(currentAlerts.internalBullishCHoCH, 'Internal Bullish CHoCH', 'Internal Bullish CHoCH formed')
alertcondition(currentAlerts.internalBearishBOS, 'Internal Bearish BOS', 'Internal Bearish BOS formed')
alertcondition(currentAlerts.internalBearishCHoCH, 'Internal Bearish CHoCH', 'Internal Bearish CHoCH formed')
alertcondition(currentAlerts.swingBullishBOS, 'Bullish BOS', 'Internal Bullish BOS formed')
alertcondition(currentAlerts.swingBullishCHoCH, 'Bullish CHoCH', 'Internal Bullish CHoCH formed')
alertcondition(currentAlerts.swingBearishBOS, 'Bearish BOS', 'Bearish BOS formed')
alertcondition(currentAlerts.swingBearishCHoCH, 'Bearish CHoCH', 'Bearish CHoCH formed')
alertcondition(currentAlerts.internalBullishOrderBlock, 'Bullish Internal OB Breakout', 'Price broke bullish internal OB')
alertcondition(currentAlerts.internalBearishOrderBlock, 'Bearish Internal OB Breakout', 'Price broke bearish internal OB')
alertcondition(currentAlerts.swingBullishOrderBlock, 'Bullish Swing OB Breakout', 'Price broke bullish swing OB')
alertcondition(currentAlerts.swingBearishOrderBlock, 'Bearish Swing OB Breakout', 'Price broke bearish swing OB')
alertcondition(currentAlerts.equalHighs, 'Equal Highs', 'Equal highs detected')
alertcondition(currentAlerts.equalLows, 'Equal Lows', 'Equal lows detected')
alertcondition(currentAlerts.bullishFairValueGap, 'Bullish FVG', 'Bullish FVG formed')
alertcondition(currentAlerts.bearishFairValueGap, 'Bearish FVG', 'Bearish FVG formed')
alertcondition(buy, 'UT Long', 'UT Long')
alertcondition(sell, 'UT Short', 'UT Short')
plotshape(buy, title = 'Buy', text = 'Buy', style = shape.labelup, location = location.belowbar, color = color.new(color.green, 0), textcolor = color.new(color.white, 0), size = size.tiny)
plotshape(sell, title = 'Sell', text = 'Sell', style = shape.labeldown, location = location.abovebar, color = color.new(color.red, 0), textcolor = color.new(color.white, 0), size = size.tiny)
//--------------------------------------------------------------------------------------
// EMA ADDITIONS (Editable)
//--------------------------------------------------------------------------------------
ema5Len = input.int(5, "5 EMA Length", minval = 1)
ema9Len = input.int(9, "9 EMA Length", minval = 1)
ema5 = ta.ema(src, ema5Len)
ema9 = ta.ema(src, ema9Len)
plot(ema5, "EMA 5", color = color.red, linewidth = 2)
plot(ema9, "EMA 9", color = color.blue, linewidth = 2)
barcolor(barbuy ? color.green : na)
barcolor(barsell ? color.red : na)