SMC ICT – Simplified Daily Trend & Reversal AnalyzerThis Pine Script provides a simplified approach to analyzing daily trends and potential reversals using concepts inspired by Smart Money Concepts (SMC) and ICT (Inner Circle Trader).
What It Does:
• Detects daily uptrend and downtrend conditions by comparing the current daily high/low to the previous day’s values.
• Highlights potential bullish or bearish reversal zones when price behavior suggests a shift in sentiment.
• Automatically draws dashed lines for the previous day's high and low.
• Labels these high/low levels for quick visual reference.
How to Use:
Apply this indicator to any timeframe chart. Use the plotted trend markers to assess daily direction and potential reversal signals. The dashed lines (previous high/low) can be used as reference points for liquidity zones or break/retest entries.
User Interface:
The indicator displays labels and shapes in English. This script is intended for educational and trading workflow enhancement purposes.
Note:
This is an open-source tool designed for clarity and basic SMC/ICT application. It is best used in combination with other confluences like FVGs, order blocks, and liquidity sweeps.
"daily" için komut dosyalarını ara

10 Monday's 1H Avg Range + 30-Day Daily RangeWhat This Script Does
This indicator is designed for traders who want to monitor volatility and range behavior at the start of the trading week . It focuses specifically on the first four 15-minute candles of each Monday and tracks their combined high-low range over time.
How It Works
Monday 1H Range Detection:
Each week, it automatically detects and highlights the first 4 candles of Monday on a 15-minute chart (1 hour total). It calculates the range between the highest high and lowest low of these candles.
10-Week Average of Monday 1H Ranges:
It stores and averages the last 10 such ranges, displaying this average in a table for weekly comparison.
30-Day Daily Range Average:
Separately, it calculates the average daily range (high – low) of the last 30 daily candles. This value helps put the Monday 1H range into broader context and can guide Stop Loss or TP planning.
Dynamic Labeling & Visual Highlights:
The script visually highlights the first 4 candles of Monday and places a label showing the pip range once the 4 candles have completed. It also updates a small table with the two averages described above.
How to Use It
Use it on the 15-minute timeframe to activate the Monday 1H logic.
Compare the current week’s Monday range to the 10-week average to see if volatility is increasing or decreasing.
Use the 30-day daily range to determine if the Monday opening movement is unusually large or small.
Consider adjusting trade entries, stops, or targets if the Monday range is disproportionately large compared to recent historical behavior.
What Makes It Original?
This is not a typical volatility indicator like ATR or standard deviation. Instead, it’s a purpose-built tool combining:
Time-specific behavior (first hour of the week),
Historical contextualization (10-week average tracking),
A dual-timeframe analysis (15-min + daily),
A user-friendly table and visual interface.
This script helps intraday or swing traders spot abnormal volatility early in the week and adjust their strategies accordingly—especially in fast-moving Forex or Index markets.

The Daily Profiler v2.0This indicator serves as a multi-faceted analysis tool for TradingView, geared towards day traders who need context based on daily cycles and key price levels, especially in markets like futures that follow the NY trading schedule (18:00 ET daily reset).
Core Functionality Breakdown:
Session & Opening Range Analysis:
It defines and visually demarcates four key trading sessions: Asia (ASN: 1800-0230), London (LDN: 0230-0730), NY1 (0730-1130), and NY2 (1130-1615), using the "America/New_York" timezone.
For each session, it identifies an "Opening Range" (OR) period (e.g., 1800-1930 for ASN).
Users can opt to display background boxes for the full sessions and/or the OR periods.
It plots horizontal lines marking the High and Low reached during each session and OR period.
Crucially, it calculates the midpoint of each Opening Range (the "O/U" or Over/Under line) and tracks whether subsequent price action "breaks" this level, updating line styles and status information accordingly.
Key Price Level Plotting:
Previous Day Context: Plots the High (PDH), Low (PDL), and Midpoint (PDM) of the previous trading day, providing immediate reference points.
Daily Anchor Points: Draws lines for the Globex Open (18:00 ET start), the previous day's Settlement price, and the Midnight Open (00:00 ET), offering insight into key daily cycle starting points.
P12 Session (18:00-06:00): Tracks this overnight period and, after 06:00 ET, projects extended lines for its High, Low, and Midpoint.
High/Low of Day (HOD/LOD) Features:
Actual Tracking: Identifies and marks the actual HOD and LOD achieved during the main trading day (18:00-16:15 window) with labels showing the price, time occurred, and percentage move from the open.
User Projections: Allows users to configure multiple sets of potential HOD/LOD target zones (categorized as Long/True, Long/False, Short/True, Short/False). These are defined by specific time windows and percentage ranges from the daily open, displayed as colored projection boxes.
Statistical Projections:
ADR/MDR: Calculates the Average Daily Range (ADR) or Median Daily Range (MDR) over a user-set lookback period. It then plots projected High/Low levels for the current day based on adding/subtracting half this range value from the daily open price.
ASN OR Standard Deviations: Uses the range of the Asian session's OR to calculate and plot standard deviation levels (+/- 1.0, 2.5, 5.0, 8.0). These lines appear after the ASN OR concludes and change appearance if price crosses them.
09:30 NY Open Focus:
Provides specific analysis for the 09:30 ET 1-minute candle, often significant for US equity index futures.
Draws a box around this candle's range, optionally recoloring the bar, and draws internal percentage levels (25/50/75%) and minor offset lines for the subsequent 15 minutes.
Informational Tables:
Model Table: Summarizes the OR breakout dynamics for each session, indicating the initial break direction (Long/Short), whether the session maintained that direction without breaking the opposite side (True/False), and whether the OR midpoint was later broken (Broken/None).
Distribution Table: Presents range and percentage statistics for each session (and the 0930-1000 window). It shows the current day's values alongside historical Average or Median values, which can be filtered by day of the week or shown as a weekly total.
Customization & Management:
Offers extensive inputs to toggle nearly every visual element and feature.
Allows detailed customization of colors, line styles/widths, label content/size, and table appearance/position.
Incorporates logic to clean up drawings from the previous day at the 18:00 ET reset, ensuring chart clarity.

BTC Daily DCA CalculatorThe BTC Daily DCA Calculator is an indicator that calculates how much Bitcoin (BTC) you would own today by investing a fixed dollar amount daily (Dollar-Cost Averaging) over a user-defined period. Simply input your start date, end date, and daily investment amount, and the indicator will display a table on the last candle showing your total BTC, total invested, portfolio value, and unrealized yield (in USD and percentage).
Features
Customizable Inputs: Set the start date, end date, and daily dollar amount to simulate your DCA strategy.
Results Table: Displays on the last candle (top-right of the chart) with:
Total BTC: The accumulated Bitcoin from daily purchases.
Total Invested ($): The total dollars invested.
Portfolio Value ($): The current value of your BTC holdings.
Unrealized Yield ($): Your profit/loss in USD.
Unrealized Yield (%): Your profit/loss as a percentage.
Visual Markers: Green triangles below the chart mark each daily investment.
Overlay on Chart: The table and markers appear directly on the BTCUSD price chart for easy reference.
Daily Timeframe: Designed for Daily (1D) charts to ensure accurate calculations.
How to Use
Add the Indicator: Apply the indicator to a BTCUSD chart (e.g., Coinbase:BTCUSD, Binance:BTCUSDT).
Set Daily Timeframe: Ensure your chart is on the Daily (1D) timeframe, or the script will display an error.
Configure Inputs: Open the indicator’s Settings > Inputs tab and set:
Start Date: When to begin the DCA strategy (e.g., 2024-01-01).
End Date: When to end the strategy (e.g., 2025-04-27 or earlier).
Daily Investment ($): The fixed dollar amount to invest daily (e.g., $100).
View Results: Scroll to the last candle in your date range to see the results table in the top-right corner of the chart. Green triangles below the bars indicate investment days.
Settings
Start Date: Choose the start date for your DCA strategy (default: 2024-01-01).
End Date: Choose the end date (default: 2025-04-27). Must be after the start date and within available chart data.
Daily Investment ($): Set the daily investment amount (default: $100). Minimum is $0.01.
Notes
Timeframe: The indicator requires a Daily (1D) chart. Other timeframes will trigger an error.
Data: Ensure your BTCUSD chart has historical data for the selected date range. Use reliable pairs like Coinbase:BTCUSD or Binance:BTCUSDT.
Limitations: Does not account for trading fees or slippage. Future dates (beyond the current date) will not display results.
Performance: Works best with historical data. Free TradingView accounts may have limited historical data; consider premium for longer ranges.

Key Levels (4H and Daily)Key Levels (4H and Daily)
This indicator highlights important key price levels derived from the 4-hour (4H) and daily (D) timeframes, providing traders with critical support and resistance areas. The levels are calculated using the highest highs and lowest lows over a customizable lookback period, offering a dynamic view of significant price points that could influence market movement.
Key Features:
Key Levels for 4H and Daily Timeframes:
The indicator calculates and displays the highest high and lowest low over a user-defined period for both the 4-hour and daily timeframes. This helps traders identify key support and resistance levels that could dictate the market's behavior.
Customizable Lookback Period:
Traders can adjust the lookback period (in days) for both the 4-hour and daily timeframes to reflect different market conditions. This flexibility ensures the levels are tailored to your preferred trading style and market conditions.
Horizontal Lines:
The indicator plots horizontal lines at the high and low levels for both timeframes. These levels serve as dynamic support and resistance areas and help traders monitor price action near these critical points.
Real-Time Updates:
The lines adjust automatically with each new bar, providing up-to-date key levels based on the most recent price action and trading session.
Alert Conditions:
Alerts are built-in to notify traders when the price breaks above or below these key levels. Traders can set up notifications to stay informed when significant market moves occur.
How to Use:
Support and Resistance: Use the levels as potential support and resistance areas where price could reverse. Price often reacts at these levels, providing potential trading opportunities.
Breakouts: Pay attention to breakouts above the high or below the low of these levels. A break above the 4H or daily high could indicate bullish momentum, while a break below could signal bearish trends.
Trend Confirmation: Combine these levels with other technical analysis tools to confirm the overall market trend and enhance your trading strategy.
Perfect for:
Day Traders: Use the 4-hour levels for intraday trading setups, such as potential reversals or breakouts.
Swing Traders: The daily levels provide longer-term insights, helping to identify key zones where price might pause, reverse, or break out.
Market Context: Ideal for those who want to contextualize their trades within broader timeframes, helping to understand the market’s structure at multiple time scales.
This description conveys the utility and functionality of the indicator, focusing on how it helps traders identify and monitor key levels that influence market action.
Midnight (Daily) OpenMidnight (Daily) Open v1.0
Overview
Plots a real‑time horizontal line at the U.S. session “midnight” open (i.e. the daily candle’s open price) on any intraday chart. Optionally displays a label with the exact price, making it easy to see how price reacts to the session open.
Key Benefits
Immediate Context: See at a glance where today’s session began, helping identify support/resistance.
Consistent Reference: Works on any symbol or intraday timeframe.
Customizable Styling: Tweak colors, line thickness, and label appearance to match your chart theme.
Features
Retrieves the daily open via request.security() (Pine v6).
Draws or updates a single horizontal line that extends into the future.
Optional price label on the last bar, with user‑defined text and background colors.
Zero repainting—always shows the true daily open.

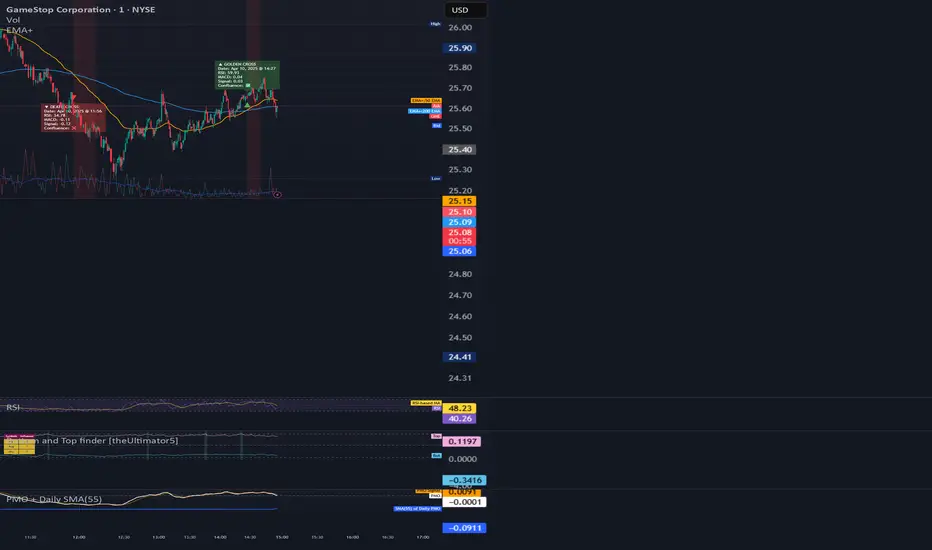
PMO + Daily SMA(55)PMO + Daily SMA(55)
This script plots the Price Momentum Oscillator (PMO) using the classic DecisionPoint methodology, along with its signal line and the 55-period Simple Moving Average (SMA) of the daily PMO.
PMO is a smoothed momentum indicator that measures the rate of change and helps identify trend direction and strength. The signal line is an EMA of the PMO, commonly used for crossover signals.
The 55-period SMA of the daily PMO is added as a longer-term trend filter. It remains based on daily data, even when applied to intraday charts, making it useful for aligning lower timeframe trades with higher timeframe momentum.
Ideal for swing and position traders looking to combine short-term momentum with broader trend context.
Custom Daily % Levels Table📘 Indicator Description
"Custom Daily % Levels – table" is a dynamic and customizable tool designed to help traders visualize daily percentage-based price ranges and key metrics in a compact, table-style format.
🧩 Key Features:
📐 Custom Percent Levels: Automatically calculates upper and lower price levels based on a user-defined base percentage and number of levels, relative to the previous daily close.
🟢🔴 Color Gradient Highlighting: Positive levels are shown with a green gradient, negative levels with red, and the level labels with a neutral tone for easy reference.
📊 Live Asset Info: Displays the current symbol, percentage change from the previous daily close, and 14-period RSI, all color-coded for quick interpretation.
⚙️ Header Control: Toggle the visibility of the main info headers and level headers independently.
📌 Position Customization: Choose where the table appears on your chart (top/bottom, left/right, center).
📈 Clean Layout: Makes it easy to visually track price movement relative to daily expected ranges.
This indicator is especially useful for intraday traders, scalpers, or anyone needing a clear visual of short-term price expansion and contraction based on predefined volatility zones.

Breakoutprop Daily Reset# Breakoutprop Daily Reset
This indicator helps Breakoutprop prop firm traders visualize daily reset times on their charts with precision. The indicator draws a vertical line at the exact reset time, making it easy to track when your daily profit/loss calculations will reset.
## What is this indicator for?
Breakoutprop and many other prop firms use a daily reset system where your trading metrics (like maximum drawdown) reset at a specific time each day. This indicator:
- Shows the exact daily reset time with a vertical line on your chart
- Helps you plan your trades around reset times
- Provides clear visual reference for when your daily trading metrics will reset
## Main Features
- **Daily Reset Visualization**: Clear vertical line showing when your daily metrics will reset
- **UTC Time Display**: Time label showing the exact reset time in UTC
- **Customizable Appearance**: Adjust colors, line styles, and transparency to match your chart setup
- **Advanced Customization**: Fully adjustable label positioning, sizes, and color settings
- **Additional Price Line**: Optional feature to mark significant price levels if needed (disabled by default)
## How to Use
### Basic Setup
1. Add the indicator to your chart
2. Set the reset hour and minute to match your Breakoutprop account's daily reset time (default is 00:30 UTC)
3. The indicator will automatically show a vertical line at the next reset time
### Appearance Customization
- Modify colors, line width, and style in the "Appearance Settings" group
- Adjust label settings in the "Label Settings" group
- Use "Compact Mode" to show only the time without additional text
### Additional Features (Optional)
- The indicator includes an optional price line feature that can be enabled if needed
- This is disabled by default but can be activated in the "Price Line Settings" section
## Tips for Breakoutprop Traders
- Set this indicator to match your account's specific reset time (check your Breakoutprop dashboard)
- Use the "Extend Lines" option to see the reset time projected across your entire chart
- Customize the label appearance and position to avoid overlapping with price action
- For night traders, the indicator automatically calculates the next reset time
This indicator is specifically designed for Breakoutprop traders but works with any prop firm that uses daily reset times for tracking trading performance.

Average Daily Range ProjectionsCreates a trailing high and low projection based on the Average Daily Range.
Track the Session High and Low to determine the Daily Range.
Average the Daily Range by a fixed Period to create an Average Daily Range .
Track the Prior Daily Range .
Track the Current Daily Range .
Track the % of Range completion relative to the CDR & ADR(P).
From the Session Low, project an Average Daily Range High by adding the ADR.
From the Session High, project an Average Daily Range Low by subtracting the ADR.
When %R reaches 100% or greater, the ADR HI & LO will lock, showing the range break out or break down. As the Session High and Low create the Daily Range, observe the reaction of price as it reaches the limit of the expected daily range.
On strongly trending days, CDR is likely greater than PDR and ADR(P). Price can break away.
On ranging days, %R may fail to reach 100% and CDR may be lesser than PDR and ADR(P). Price can bounce around within the bounds of ADR HI & LO.

New Daily Low with Offset Alert FeatureThis indicator plots the current day’s low as a horizontal line on your chart and provides an optional offset line above it. It’s designed for traders who want to monitor when price is near or breaking below the daily low. You can set alerts based on the built-in alert conditions to be notified whenever the market approaches or crosses below these key levels.
How to Use With Alerts:
1. Add the indicator to your chart and choose a timeframe (e.g., 15 minutes).
2. In the script inputs, enable or adjust the daily low line and any offset percentage if desired.
3. Open the “Alerts” menu in TradingView and select the corresponding alert condition:
• Cross Below Daily Low to detect when price dips below the day’s low.
• Cross Below Daily Low + Offset if you prefer a small cushion above the actual low.
4. Configure the alert’s frequency and notifications to stay updated on potential breakdowns.
This setup helps you catch new lows or near-breakdowns quickly, making it useful for both intraday traders and swing traders watching key support levels.
Overlay Daily Candle [odnac]This script is designed to visually overlay the daily candle on various timeframes, allowing traders to quickly assess the shape of the daily candle, its high and low points, and the relationship between the open and close prices.
Additionally, it helps to intuitively identify upward and downward movements by using color-coded bullish and bearish candles.
Key Features
Candle Color Indication: Bullish candles are shown in green, while bearish candles are shown in red.
Candle Body Box: The box represents the body of the daily candle, based on the open and close prices.
Candle Wick: The wicks of the daily candle are drawn to represent the high and low prices.
Date Change Detection: When a new date begins, the previous data is reset, and new boxes and lines are drawn according to the updated date.
How to Use
You can adjust the script’s options to customize the color of bullish and bearish candles, as well as the transparency of the boxes, to suit your personal style.

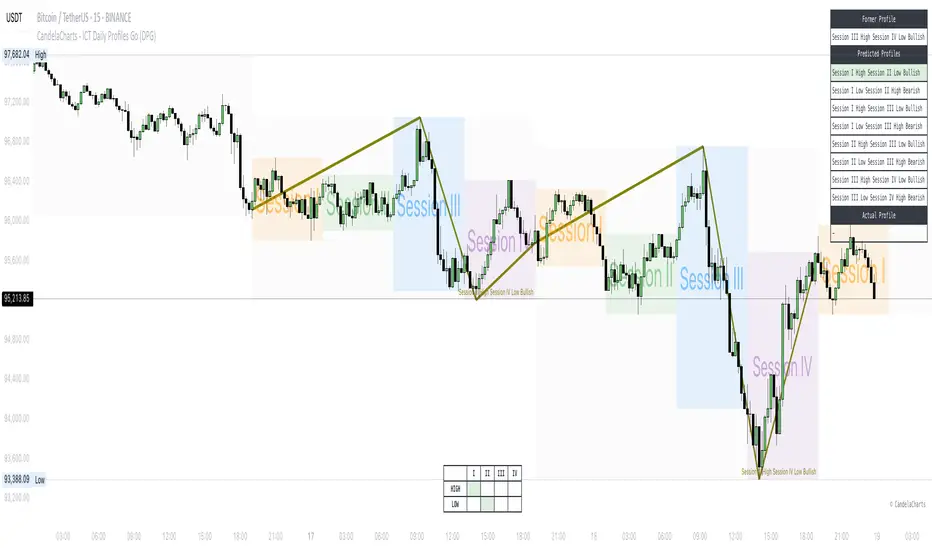
CandelaCharts - ICT Daily Profiles Go (DPG)📝 Overview
The ICT Daily Profiles by CandelaCharts, inspired by ICT teachings, offer a pattern-driven approach to trading by identifying and analyzing the key highs and lows of intraday sessions.
This toolkit automatically highlights these ICT Daily Profiles on your charts, allowing traders to efficiently identify critical zones for analysis and informed decision-making.
Whether you're an experienced trader or just starting out, ICT Daily Profiles deliver actionable frameworks to deepen your understanding of price behavior and enhance your intraday trading performance.
📦 Features
The ICT Daily Profiles toolkit provides a robust suite of features tailored to improve trading accuracy and support informed decision-making. Its key highlights include:
Daily Profiles
Advanced Styling
Scanner
The indicator supports the following profiles:
Session I High Session II Low Bearish
Session I High Session III Low Bearish
Session II High Session III Low Bearish
Session III High Session IV Low Bearish
Session I Low Session II High Bullish
Session I Low Session III High Bullish
Session II Low Session III High Bullish
Session III Low Session IV High Bullish
⚙️ Settings
Sessions: Controls how many sessions you want to see.
History: Controls how many profiles are displayed on the chart.
Timeframe Limit: Sets the timeframe up to which profiles will be drawn.
Show OHLC Lines: Display the lines for OHLC.
Show Profile Line: Display the Daily Profile line.
Use NY Midnight Open: Controls from where a profile will start detection.
Open: Style for Open line.
High: Style for High line.
Low: Style for Low line.
Midline: Style for Profile Midline.
Label: Controls the position of the Daily Profile name.
Scanner: Display the Scanner
⚡️ Showcase
ICT (Inner Circle Trader) daily profile templates are analytical models that classify and outline common price action patterns observed throughout a trading day.
ICT Daily Profiles
Scanner
📒 Usage
The ICT Daily Profiles indicator aims to give traders a clear and actionable view of the Daily Previous, Current, and Future Profiles. This enables them to analyze market structure, predict price movements, and align their trading strategies with higher time-frame trends.
Load the indicator on the chart
Enable Scanner
See the Predicted Profiles list
Predicted Profiles represent all potential scenarios for the current day, generated by a profile detection algorithm.
By visualizing potential outcomes through Predicted Profiles, the ICT Daily Profiles indicator provides traders with a strategic edge, allowing them to remain flexible, prepared, and aligned with the most probable market movements.
🚨 Alerts
The indicator does not provide any alerts!
🔹 Notes
ICT Daily Profiles
pbs.twimg.com
⚠️ Disclaimer
Trading involves significant risk, and many participants may incur losses. The content on this site is not intended as financial advice and should not be interpreted as such. Decisions to buy, sell, hold, or trade securities, commodities, or other financial instruments carry inherent risks and are best made with guidance from qualified financial professionals. Past performance is not indicative of future results.
Drawdown from 22-Day High (Daily Anchored)This Pine Script indicator, titled "Drawdown from 22-Day High (Daily Anchored)," is designed to plot various drawdown levels from the highest high over the past 22 days. This helps traders visualize the performance and potential risk of the security in terms of its recent high points.
Key Features:
Daily High Data:
Fetches daily high prices using the request.security function with a daily timeframe.
Highest High Calculation:
Calculates the highest high over the last 22 days using daily data. This represents the highest price the security has reached in this period.
Drawdown Levels:
Computes various drawdown levels from the highest high:
2% Drawdown
5% Drawdown
10% Drawdown
15% Drawdown
25% Drawdown
45% Drawdown
50% Drawdown
Dynamic Line Coloring:
The color of the 2% drawdown line changes dynamically based on the current closing price:
Green (#02ff0b) if the close is above the 2% drawdown level.
Red (#ff0000) if the close is below the 2% drawdown level.
Plotting Drawdown Levels:
Plots each drawdown level on the chart with specific colors and line widths for easy visual distinction:
2% Drawdown: Green or Red, depending on the closing price.
5% Drawdown: Orange.
10% Drawdown: Blue.
15% Drawdown: Maroon.
25% Drawdown: Purple.
45% Drawdown: Yellow.
50% Drawdown: Black.
Labels for Drawdown Levels:
Adds labels at the end of each drawdown line to indicate the percentage drawdown:
Labels display "2% WVF," "5% WVF," "10% WVF," "15% WVF," "25% WVF," "45% WVF," and "50% WVF" respectively.
The labels are positioned dynamically at the latest bar index to ensure they are always visible.
Explanation of Williams VIX Fix (WVF)
The Williams VIX Fix (WVF) is a volatility indicator designed to replicate the behavior of the VIX (Volatility Index) using price data instead of options prices. It helps traders identify market bottoms and volatility spikes.
Key Aspects of WVF:
Calculation:
The WVF measures the highest high over a specified period (typically 22 days) and compares it to the current closing price.
It is calculated as:
WVF
=
highest high over period
−
current close
highest high over period
×
100
This formula provides a percentage measure of how far the price has fallen from its recent high.
Interpretation:
High WVF Values: Indicate increased volatility and potential market bottoms, suggesting oversold conditions.
Low WVF Values: Suggest lower volatility and potentially overbought conditions.
Usage:
WVF can be used in conjunction with other indicators (e.g., moving averages, RSI) to confirm signals.
It is particularly useful for identifying periods of significant price declines and potential reversals.
In the script, the WVF concept is incorporated into the drawdown levels, providing a visual representation of how far the price has fallen from its 22-day high.
Example Use Cases:
Risk Management: Quickly identify significant drawdown levels to assess the risk of current positions.
Volatility Monitoring: Use the WVF-based drawdown levels to gauge market volatility.
Support Levels: Utilize drawdown levels as potential support levels where price might find buying interest.
This script offers traders and analysts an efficient way to visualize and track important drawdown levels from recent highs, helping in better risk management and decision-making. The dynamic color and label features enhance the readability and usability of the indicator.

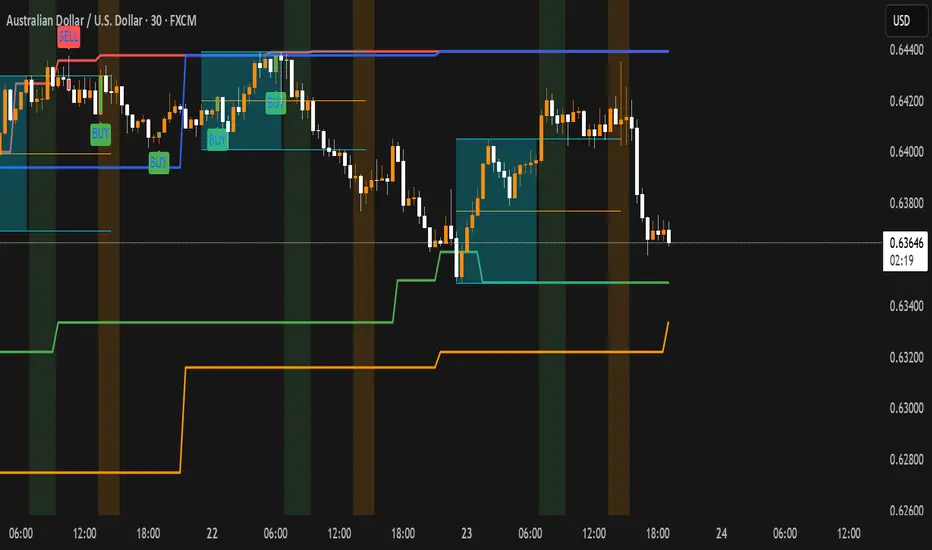
Dynamic Customizable 50% Line & Daily High/Low + True Day OpenA Unique Indicator for Precise Market-Level Analysis
This indicator is a fully integrated solution that automates complex market-level calculations and visualizations, offering traders a tool that goes beyond the functionality of existing open-source alternatives. By seamlessly combining several trading concepts into a single script, it delivers efficiency, accuracy, and customization that cater to both novice and professional traders.
Key Features: A Breakdown of What Makes It Unique
1. Adaptive Daily Highs and Lows
Automatically detects and plots daily high and low levels based on the selected time frame, dynamically updating in real time.
Features session-based adjustments, allowing traders to focus on levels that matter for specific trading sessions (e.g., London, New York).
Fully customizable styling, visibility, and alerts tailored to each trader’s preferences.
How It Works:
The indicator calculates daily high and low levels directly from price data, integrating session-specific time offsets to account for global trading hours. These levels provide traders with clear visual markers for key liquidity zones.
2. Automated ICT 50% Range Line
A pioneering implementation of ICT’s mid-range concept, this feature dynamically calculates and displays the midpoint of the daily range.
Offers traders a visual guide to identify premium and discount zones, aiding in determining market bias and potential trade setups.
How It Works:
The script calculates the range between the day’s high and low, dividing it by two to generate the midline. This line updates in real-time, ensuring that traders always see the most current premium and discount levels as price action evolves.
3. Dynamic Market Open Levels
Plots session opens (e.g., Asia, London, New York) and the True Day Open to provide actionable reference points for intra-day trading strategies.
Enhances precision in identifying liquidity shifts and aligning trades with institutional price movements.
How It Works:
The indicator uses predefined session times to calculate and display the opening levels for key trading sessions. It dynamically adjusts for time zones, ensuring accuracy regardless of the trader’s location.
4. Custom Watermark for Enhanced Visualization
Includes an optional watermark feature that allows users to display custom text on their charts.
Ideal for personalization, branding, or highlighting session notes without disrupting the clarity of the chart.
Why This Indicator Stands Out
First-to-Market Automation:
While the ICT 50% range line is a widely recognized concept, this is the first script to automate its calculation, combining it with other pivotal trading levels in a single tool.
All-in-One Functionality:
Unlike open-source alternatives that focus on individual features, this script integrates daily highs/lows, mid-range levels, session opens, and customizable watermarks into one cohesive system. The consolidation reduces the need for multiple indicators and ensures a clean, efficient chart setup.
Dynamic Customization:
Every feature can be adjusted to align with a trader’s strategy, time zone, or aesthetic preferences. This level of adaptability is unmatched in existing tools.
Proprietary Logic:
The indicator’s underlying calculations are built from scratch, leveraging advanced programming techniques to ensure accuracy and reliability. These proprietary methods differentiate it from similar open-source scripts.
How to Use This Indicator
Apply the Indicator:
Add it to your TradingView chart from the library.
Configure Settings:
Use the intuitive settings panel to adjust plotted levels, colors, styles, and visibility. Tailor the indicator to your trading strategy.
Incorporate into Analysis:
Combine the plotted levels with your preferred trading approach to identify liquidity zones, establish market bias, and pinpoint potential reversals or entries.
Stay Focused:
With all key levels automated and updated in real time, traders can focus on execution rather than manual plotting.
Originality and Justification for Closed Source
This script is closed-source due to its unique combination of features and proprietary logic that automates complex trading concepts like the ICT 50% range line and session-specific levels. Open-source alternatives lack this level of integration and customization, making this indicator a valuable and original contribution to the TradingView ecosystem.
What Sets It Apart from Open-Source Scripts?
Unlike open-source tools, this indicator doesn’t just replicate individual features—it enhances and integrates them into a seamless, all-in-one solution that offers traders a more efficient and effective way to analyze the market.

OHLC/4 Daily vs Quarterly CrossOHLC/4 Daily vs Quarterly Cross
The "OHLC/4 Daily vs Quarterly Cross" indicator is a powerful tool designed to provide traders with insights into trend alignment and potential market turning points. By calculating the average of the open, high, low, and close prices (OHLC/4), this script compares the daily average price action with the quarterly average to identify significant crossover events.
This indicator features two distinct lines: the Daily OHLC/4 and the Quarterly OHLC/4, each plotted in different colors for easy differentiation. A crossover occurs when the daily OHLC/4 moves above the quarterly average, potentially signaling bullish momentum or a shift in market direction. Conversely, a crossunder marks the daily OHLC/4 moving below the quarterly level, indicating potential bearish sentiment or a reversal.
With real-time plotting and built-in alert conditions, this script enables traders to stay ahead of critical market movements by setting automated notifications for crossover events. Whether you're seeking to confirm trends or identify new opportunities, the "OHLC/4 Daily vs Quarterly Cross" delivers clarity and actionable insights for more informed decision-making.

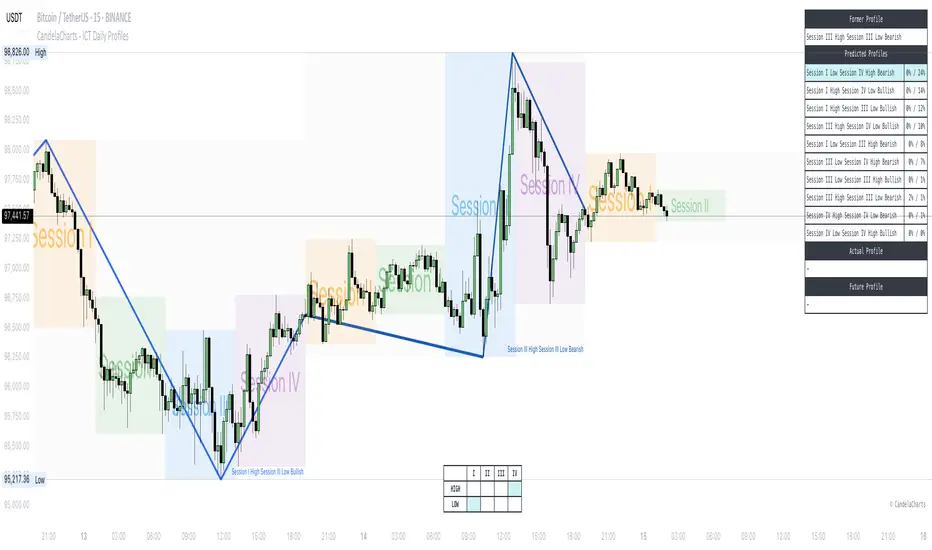
CandelaCharts - ICT Daily Profiles📝 Overview
The ICT Daily Profiles by CandelaCharts rooted in the ICT teachings represent a pattern-based approach to trading that focuses on identifying and analyzing the key highs and lows of various intraday trading sessions.
The toolkit automatically detects and marks these ICT Daily Profiles on the chart, enabling traders to quickly pinpoint critical zones for analysis and decision-making.
Whether you are a seasoned professional or a developing trader, ICT Daily Profiles provides actionable frameworks to enhance your understanding of price dynamics and improve your intraday trading performance.
📦 Features
The ICT Daily Profiles toolkit offers a comprehensive set of features designed to enhance trading precision and decision-making. Key features include:
Daily Profiles
Advanced Styling
Scanner
The indicator supports the following profiles:
Session I High Session II Low Bearish
Session I High Session III Low Bearish
Session I High Session IV Low Bearish
Session II High Session III Low Bearish
Session II High Session IV Low Bearish
Session III High Session IV Low Bearish
Session I Low Session II High Bullish
Session I Low Session III High Bullish
Session I Low Session IV High Bullish
Session II Low Session III High Bullish
Session II Low Session IV High Bullish
Session III Low Session IV High Bullish
Session I High Session I Low Bearish
Session I Low Session I High Bearish
Session II High Session II Low Bearish
Session II Low Session II High Bearish
Session III High Session III Low Bearish
Session III Low Session III High Bearish
Session IV High Session IV Low Bearish
Session IV Low Session IV High Bearish
⚙️ Settings
Sessions: Controls how many sessions you want to see.
History: Controls how many profiles are displayed on the chart.
Timeframe Limit: Sets the timeframe up to which profiles will be drawn.
Show OHLC Lines: Display the lines for OHLC.
Show Profile Line: Display the Daily Profile line.
Use NY Midnight Open: Controls from where a profile will start detection.
Open: Style for Open line.
High: Style for High line.
Low: Style for Low line.
Midline: Style for Profile Midline.
Label: Controls the position of the Daily Profile name.
Scanner: Display the Scanner
⚡️ Showcase
ICT (Inner Circle Trader) daily profile templates are analytical frameworks that categorize and describe typical patterns of price action observed during a trading day.
ICT Daily Profiles
Scanner
📒 Usage
The ICT Daily Profiles indicator aims to give traders a clear and actionable view of the Daily Previous, Current, and Future Profiles. This enables them to analyze market structure, predict price movements, and align their trading strategies with higher time-frame trends.
Load the indicator on the chart
Enable Scanner
See the Predicted Profiles list
Predicted Profiles represent all potential scenarios for the current day, generated by a profile detection algorithm.
By visualizing potential outcomes through Predicted Profiles, the ICT Daily Profiles indicator provides traders with a strategic edge, allowing them to remain flexible, prepared, and aligned with the most probable market movements.
🚨 Alerts
The indicator does not provide any alerts!
🔹 Notes
ICT Daily Profiles
pbs.twimg.com
⚠️ Disclaimer
These tools are exclusively available on the TradingView platform.
Our charting tools are intended solely for informational and educational purposes and should not be regarded as financial, investment, or trading advice. They are not designed to predict market movements or offer specific recommendations. Users should be aware that past performance is not indicative of future results and should not rely on these tools for financial decisions. By using these charting tools, the purchaser agrees that the seller and creator hold no responsibility for any decisions made based on information provided by the tools. The purchaser assumes full responsibility and liability for any actions taken and their consequences, including potential financial losses or investment outcomes that may result from the use of these products.
By purchasing, the customer acknowledges and accepts that neither the seller nor the creator is liable for any undesired outcomes stemming from the development, sale, or use of these products. Additionally, the purchaser agrees to indemnify the seller from any liability. If invited through the Friends and Family Program, the purchaser understands that any provided discount code applies only to the initial purchase of Candela's subscription. The purchaser is responsible for canceling or requesting cancellation of their subscription if they choose not to continue at the full retail price. In the event the purchaser no longer wishes to use the products, they must unsubscribe from the membership service, if applicable.
We do not offer reimbursements, refunds, or chargebacks. Once these Terms are accepted at the time of purchase, no reimbursements, refunds, or chargebacks will be issued under any circumstances.
By continuing to use these charting tools, the user confirms their understanding and acceptance of these Terms as outlined in this disclaimer.
ICT Digital open Daily DividersDescription for "ICT Digital Open Daily Dividers" TradingView Indicator
Overview
The "ICT Digital Open Daily Dividers" is a versatile and comprehensive TradingView Pine Script indicator designed for traders who utilize Institutional Order Flow methodologies, particularly in ICT (Inner Circle Trader) trading. This indicator provides a structured visual framework to assist traders in identifying key daily market sessions, critical opening prices, and distinguishing different trading days, especially focusing on the Sunday open, which is a crucial element in the ICT trading strategy.
Core Functionalities
Daily Vertical Lines: The script plots vertical lines at the start of each trading day, which helps to demarcate daily trading sessions. These lines are customizable, allowing traders to choose their color, style (solid, dashed, or dotted), and width. This feature helps in visually segmenting each trading day, making it easier to analyze daily price action patterns.
Sunday Open Differentiation: Unlike many other daily divider indicators, this script uniquely provides the option to highlight the Sunday open at 6 PM EST with distinct lines. This feature is especially valuable for ICT traders who consider the Sunday open as a critical reference point for weekly analysis. The color, style, and width of the Sunday open lines can be set separately, providing a clear visual distinction from regular weekday separators.
12 AM Open Toggle: For markets that are influenced by midnight opens, the indicator includes an option to shift the daily open line to 12 AM instead of the default 6 PM. This flexibility allows traders to adapt the indicator to different market dynamics or trading strategies.
Timezone Customization: The indicator allows traders to set the timezone for the open lines, ensuring that the vertical lines align accurately with the trader’s specific market hours, whether they follow New York time or any other timezone.
Session Time Filters: The script can hide or show specific trading session markers, such as the New York session open and close, which are pivotal for ICT traders. These markers help in focusing on the most active and liquid trading times.
Customizable Style Settings: The script includes comprehensive styling options for the plotted lines and session markers, allowing traders to personalize their charts to suit their visual preferences and improve clarity.
Day of the Week Labels: The indicator can plot labels for each day of the week, providing a quick reference to the day’s price action. This feature is particularly useful in reviewing weekly trading patterns and performance.
Use in ICT Trading
In ICT trading, the concept of the "open" is fundamental. The "ICT Digital Open Daily Dividers" indicator serves multiple purposes:
Market Structure Identification: By clearly marking daily opens, traders can easily identify market structure changes such as breakouts, retracements, or consolidations around these key levels.
Reference Points: The Sunday open is often a key level in ICT analysis, serving as a benchmark for assessing market direction for the upcoming week. This indicator’s ability to plot Sunday opens separately makes it uniquely suited for ICT strategies.
Time-based Analysis: ICT methodology often involves analyzing the market at specific times of the day. This indicator supports such analysis by marking significant session opens and closes.
Uniqueness and Advantages
The "ICT Digital Open Daily Dividers" stands out from other similar indicators due to its specialized features:
Sunday Open Highlighting: Few indicators offer the capability to specifically mark the Sunday open with distinct styling options.
Flexibility in Time Adjustments: With options to adjust the open time to either 6 PM or 12 AM, this indicator caters to a broader range of trading strategies and market conditions.
Enhanced Visualization: The wide range of customization options ensures that traders can tailor the indicator to their specific needs, enhancing the usability and visual clarity of their charts.
Compliance with TradingView's Pine Script Community Guidelines
The description adheres to TradingView's guidelines by being comprehensive, clear, and informative. It highlights the utility of the script, its unique features, and its application in trading strategies without making exaggerated claims about performance or profitability. The detailed customization options and unique functionalities are emphasized to differentiate this script from other standard daily divider indicators.

Multi-ticker Daily Pivot AlertDescription:
The Big Tech Daily Pivot Alert is a powerful TradingView indicator designed to monitor daily pivot points for major tech and market-leading tickers. It provides real-time alerts when prices approach their daily pivot levels, helping traders identify potential trading opportunities during the U.S. market hours.
Key Features:
Multi-Ticker Monitoring: Tracks the daily pivot points for top tech and market tickers, including NVDA, TSLA, AMZN, NFLX, SPY, QQQ, GOOGL, MSFT, META, and AAPL.
Daily Pivot Calculations: Uses yesterday's high, low, and close prices to calculate the pivot point for each ticker.
Real-Time Alerts: Sends instant alerts when the open, high, low, or current price is near the pivot point (within 0.25% tolerance).
Time-Sensitive Alerts: Operates exclusively during U.S. market hours (6:00 AM to 1:00 PM PST) on weekdays (Monday to Friday).
Customizable Alert Format: Alerts are sent as JSON payloads for seamless integration with platforms like Discord or other webhook-supported systems.
How It Works:
The indicator calculates the daily pivot point for each ticker using the formula:
Pivot Point = (High + Low + Close) / 3
It continuously monitors the open, high, low, and current prices of each ticker on a 1-minute timeframe.
If any value approaches the pivot point within a configurable threshold (default: 0.25%), it triggers an alert with detailed information for all tickers meeting the criteria.
Who Should Use It:
Day Traders: Spot potential price reversal or breakout levels based on pivot point testing.
Swing Traders: Identify key levels of support and resistance to inform trading decisions.
Tech and Market Enthusiasts: Stay updated on critical price levels for major tech and market tickers.
Instructions:
Add the indicator to your chart.
Configure your webhook endpoint to receive alerts (e.g., Discord or Slack).
Monitor alerts for actionable opportunities when prices test pivot points.

Multi-Timeframe Liquidity LevelsMulti-Timeframe Liquidity Levels – Overview
The Multi-Timeframe Liquidity Levels indicator automatically displays significant highs and lows from various timeframes (Daily, Weekly, Monthly, and Quarterly) on your current chart. This allows traders to quickly identify potential support and resistance zones without frequently switching between different timeframe charts. Additionally, the script offers extra lines for special reference points (e.g., the “Midnight” midpoint of the current day and the previous day’s open/close) to highlight potential liquidity zones even more clearly.
1. Core Idea and Benefits
Time-Saving: Instead of manually reviewing charts in different timeframes, the indicator fetches relevant high/low levels automatically and shows them on your active timeframe.
Clear Layout: Traders instantly see where the Daily, Weekly, Monthly, and Quarterly highs and lows lie—areas often associated with institutional orders or liquidity hunts.
Customizable: You can tailor the color scheme, line style (Solid, Dashed, Dotted), and line width, ensuring the displayed levels fit your personal charting style.
2. How It Works
Multi-Timeframe High/Low
For each timeframe (Day, Week, Month, Quarter), the indicator references the previous candle’s high and low (high , low ).
Using request.security(...), these values are plotted on the chart you’re currently viewing.
Flexible Display
You can individually enable or disable the Daily, Weekly, Monthly, and Quarterly lines, depending on which levels are most relevant to your trading.
With Line Style (Solid, Dashed, Dotted) and Line Width, you can easily emphasize certain lines you consider more important.
Additional Lines
“Midnight” Line: A theoretical midpoint between today’s high and low, which can be useful for gauging daily pivot areas.
Previous Day’s Open/Close: Many traders track these reference points to anticipate market reactions. You can show or hide these lines as desired.
Automatic Line Removal & Creation
When a particular timeframe (e.g., “Show Monthly Levels”) is disabled, the script automatically removes the existing monthly lines.
Enabling it again recreates those lines without hassle.
3. Usage and Interpretation
Identifying Support and Resistance
Highs and lows from higher timeframes are often key zones for entries, exits, or major market reactions.
A Daily level may be crucial for short-term traders, whereas Monthly or Quarterly levels can indicate long-term liquidity areas.
Spotting Market Shifts
If price decisively moves above a Higher-Timeframe line, it could signal strong momentum.
Conversely, a failed breakout (where price quickly returns under or above a level) might warn of a potential reversal.
Extra Lines as Filters
The “Midnight” Line helps visualize a rough central price for the current day, aiding in intraday directional bias.
Previous Day’s Open/Close: Common reference points for day traders, where swift approaches and rejections can indicate potential entries or partial take-profit zones.
4. Practical Tips
Use Color-Coding Wisely: Assign distinct colors (e.g., Blue for Daily, Green for Weekly, Orange for Monthly, Purple for Quarterly) so you can easily discern which timeframe you’re looking at.
Toggle On/Off As Needed: Day traders might focus on Daily and Weekly, while long-term traders may pay closer attention to Monthly and Quarterly.
Combine with Price Action: Lines alone don’t constitute a trading strategy. Use them alongside candlestick patterns, volume analysis, or other indicators for a more complete market perspective.
5. Important Notes & Recommendations
Not Financial Advice: This indicator simply reflects historical high/low data across multiple timeframes and does not constitute a buy or sell recommendation.
Trader Responsibility: Observe how the market actually behaves around these lines and adapt your risk management accordingly.

2024 - Median High-Low % Change - Monthly, Weekly, DailyDescription:
This indicator provides a statistical overview of Bitcoin's volatility by displaying the median high-to-low percentage changes for monthly, weekly, and daily timeframes. It allows traders to visualize typical price fluctuations within each period, supporting range and volatility-based trading strategies.
How It Works:
Calculation of High-Low % Change: For each selected timeframe (monthly, weekly, and daily), the script calculates the percentage change from the high to the low price within the period.
Median Calculation: The median of these high-to-low changes is determined for each timeframe, offering a robust central measure that minimizes the impact of extreme price swings.
Table Display: At the end of the chart, the script displays a table in the top-right corner with the median values for each selected timeframe. This table is updated dynamically to show the latest data.
Usage Notes:
This script includes input options to toggle the visibility of each timeframe (monthly, weekly, and daily) in the table.
Designed to be used with Bitcoin on daily and higher timeframes for accurate statistical insights.
Ideal for traders looking to understand Bitcoin's typical volatility and adjust their strategies accordingly.
This indicator does not provide specific buy or sell signals but serves as an analytical tool for understanding volatility patterns.

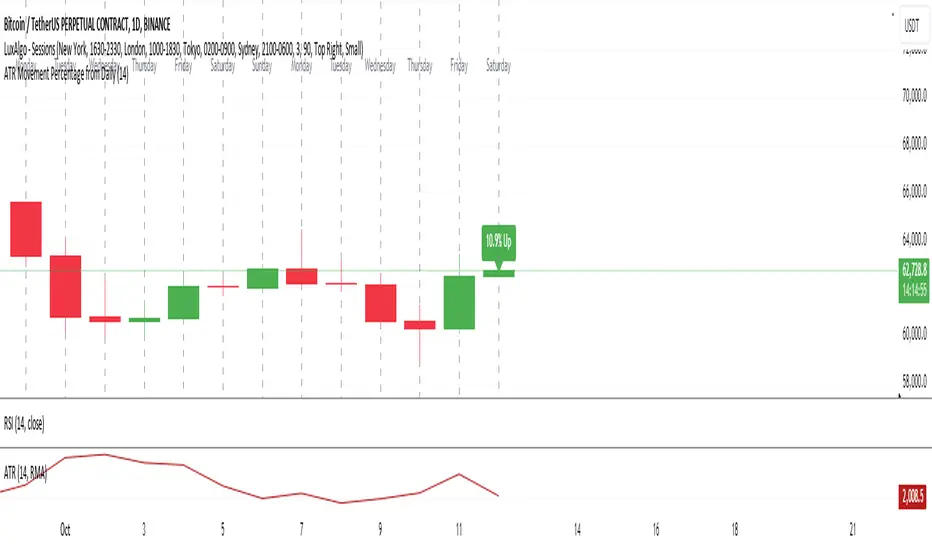
ATR Movement Percentage from Daily (Bal)Script Description: ATR Movement Percentage from Daily
The script titled "ATR Movement Percentage from Daily" is designed to help traders analyze the price movement of an asset in relation to its daily volatility, as represented by the Average True Range (ATR). Here's a breakdown of how the script works:
Key Features of the Script:
ATR Calculation:
The script allows the user to input the length of the ATR calculation (default is 14 periods).
It retrieves the daily ATR value using the request.security function, ensuring that the ATR is based on the daily timeframe, regardless of the current chart's timeframe.
Price Movement Calculation:
It calculates the opening price of the current day using request.security to ensure it is aligned with the daily timeframe.
It retrieves the current closing price and computes the price change from the opening price.
Movement Percentage:
The percentage of price movement relative to the daily ATR is calculated. This value helps traders understand how significant the current price movement is compared to the expected volatility for the day.
Direction of Movement:
The script determines the direction of the price movement (upward or downward) based on whether the price change is positive or negative.
Dynamic Label Display:
A label is created and updated to show the movement percentage and direction on the chart.
If the price movement is upward, the label is displayed in green; if downward, it is shown in red.
The label position updates with each new bar, keeping it relevant to the current price action.
Plotting Daily ATR:
The daily ATR value is plotted on the chart as a blue line, providing a visual reference for traders to see the volatility levels in relation to price movements.
Conclusion:
This script is particularly useful for traders who want to assess market conditions based on volatility. By understanding how much the price has moved in relation to the daily ATR, traders can make informed decisions about entry and exit points, and adjust their risk management strategies accordingly. The dynamic labeling feature enhances the usability of the script, allowing for quick visual assessments of market behavior.
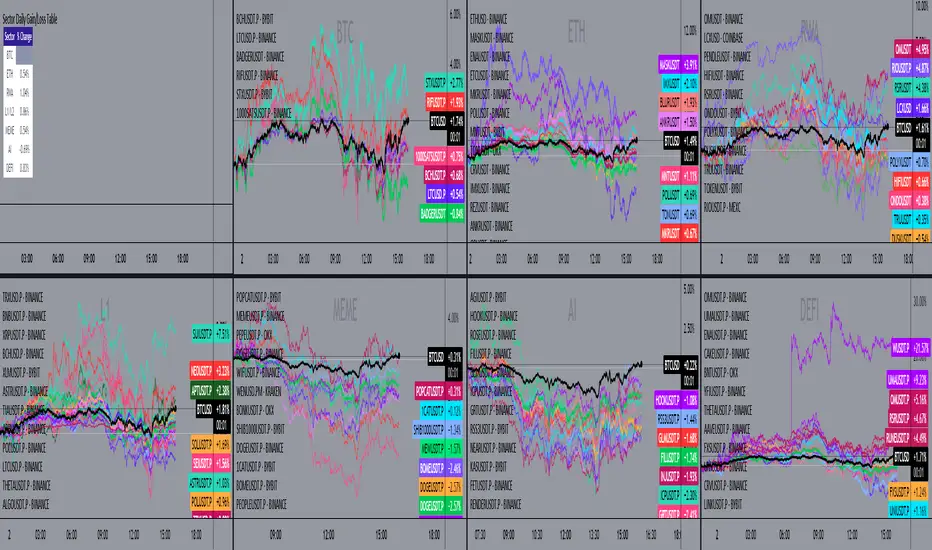
Sector Daily Gain/Loss TableOverview: The "Sector Daily Gain/Loss Table" is a custom TradingView indicator designed to display the daily percentage changes in selected cryptocurrency sectors. This indicator provides a comprehensive view of the performance of various cryptocurrencies organized into specific sectors, helping traders and analysts to make informed decisions based on sector performance.
Key Features:
Dynamic Data Retrieval: The indicator retrieves daily closing prices for multiple cryptocurrencies across different exchanges (Binance and Bybit) using the request.security function. This allows users to monitor real-time price movements.
Sectors Covered:
BTC Sector: Includes Bitcoin (BTC).
ETH Sector: Includes Ethereum (ETH).
RWA Sector: Comprises various assets such as OM, ONDO, POLYX, SNX, PENDLE, and HIFI.
L1/L2 Sector: Features major Layer 1 and Layer 2 solutions including ETH, BNB, SOL, XRP, TON, ADA, AVAX, DOT, SUI, APT, ICP, POL, and more.
MEME Sector: Showcases popular meme coins like DOGE, SHIB, PEPE, WIF, BONK, FLOKI, ORDI, BOME, and NEIRO, along with MEW and POPCAT from Bybit.
AI Sector: Highlights AI-related tokens such as TAO, FET, GRT, THETA, WLD, and TURBO.
DEFI Sector: Displays decentralized finance projects including UNI, AAVE, INJ, RUNE, MKR, JUP, LDO, PENDLE, CAKE, LUNA, RAY, OSMO, KAVA, and RSR.
Average Gain/Loss Calculations: For each sector, the indicator calculates the average percentage change in price based on the included cryptocurrencies, offering insights into sector-wide performance trends.
Table Display: The performance metrics are presented in a clean and organized table format on the TradingView chart, providing easy access to vital information for traders.
User-Friendly Design: The table is designed to be visually appealing and informative, with color coding and clear labeling for each sector and its corresponding percentage change.
Usage: Traders can utilize this indicator to quickly assess the performance of various cryptocurrency sectors and make informed trading decisions based on the daily changes in sector performance.