"daily" için komut dosyalarını ara

Daily Auto Fibonacci ToolCalculates Fibonacci retracements based on daily highs/lows, and further beyond that if specified. The main difference between this and other auto Fibbing tools is ease of visibility.
Options:
Take highs/lows from a few days back or take highs/lows from each daily candle
Hide retracements before today
Show labels for each retracement level
Hide/Show retracement levels
Change colors quickly and uniformly (in script)
Retracements used:
-0.382 / 0 / 0.236 / 0.382 / 0.5 / 0.618 / 0.786 / 1 / 1.272

Daily Moving Averages (EMA)Adds Four configurable Daily Exponential Averages to a chart. Daily MA are generally good sources of support and resistance, and being able to see them in shorter timeframes can be useful


Daily ATR LinesThis script plots the daily Average True Range lines low and high for each day. Even when using a lower interval it will continue to plot daily lines.
Some traders find this helpful for day trading and consider these as Support and Resistance. For me I use it to see the reasonable move within a day so I can sell options against, I don't necesarily consider them S/R.
For more information on ATR click here.
www.investopedia.com

Daily, Hourly and 5 min EMA (13)Simple 13 day EMA of daily, hourly and 5 min on a single indicator chart.
Red = Daily
Green = Hourly
Blue = 5 min


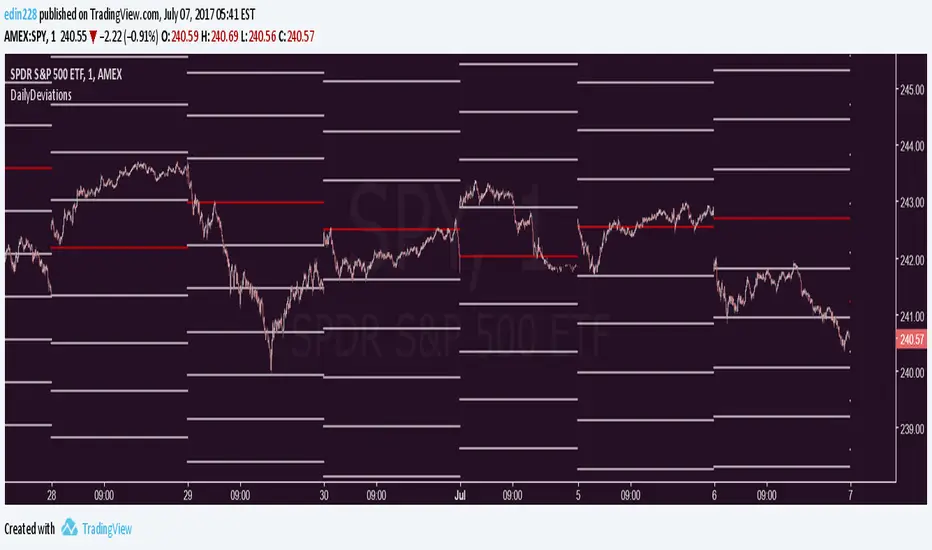
Daily Deviations Version 3Version 3 of Daily Deviations
Combines Lazy and Self Input version
HOW TO USE:
Select volatility index related to ticker. (Ex. Using SPY? Select VIX. Using QQQ? Select VXN. etc)
OR
Uncheck other volatility options and select "Use Custom Volatility" and input your own volatility.
Default setting is to use the previous close price as the "0 Level".
OR
Uncheck "Use Close Price" to enable a synthetic settlement price that is made by using the average of the daily open and close.
OR
Uncheck "Use Close Price" and select "Use Custom Settlement" and input your own settlement price.
Mess around and find the settings that you like the most.
Credits to /u/Living_Granger and /u/UberBotMan for the formulas and idea.

Pivots Daily Weekly Monthly YearlyDaily, Weekly, Monthly and yearly pivot lines
Just the pivot lines without the support and resistance lines


Daily ATR%If You are using a percentage of the Daily Average True Range in determining your stop placement,
this quick indicator is for You.
excerpt from investopedia.com/articles/trading/06/stopplacement.asp
ATR % Stop Method
The ATR% stop method can be used by any type of trader because the width of the stop is determined by the percentage of average true range (ATR). ATR is a measure of volatility over a specified period of time. The most common length is 14, which is also a common length for oscillators such as the relative strength index (RSI) and stochastics. A higher ATR indicates a more volatile market, while a lower ATR indicates a less volatile market. By using a certain percentage of ATR, you ensure that your stop is dynamic and changes appropriately with market conditions.
For example, for the first four months of 2006, the GBP/USD average daily range was around 110 to 140 pips. A day trader may want to use a 10% ATR stop - meaning that the stop is placed 10% x ATR pips from the entry price.In this instance, the stop would be anywhere from 11 to 14 pips from your entry price. A swing trader might use 50% or 100% of ATR as a stop. In May and June of 2006, daily ATR was anywhere from 150 to 180 pips. As such, the day trader with the 10% stop would have stops from entry of 15 to 18 pips while the swing trader with 50% stops would have stops of 75 to 90 pips from entry.

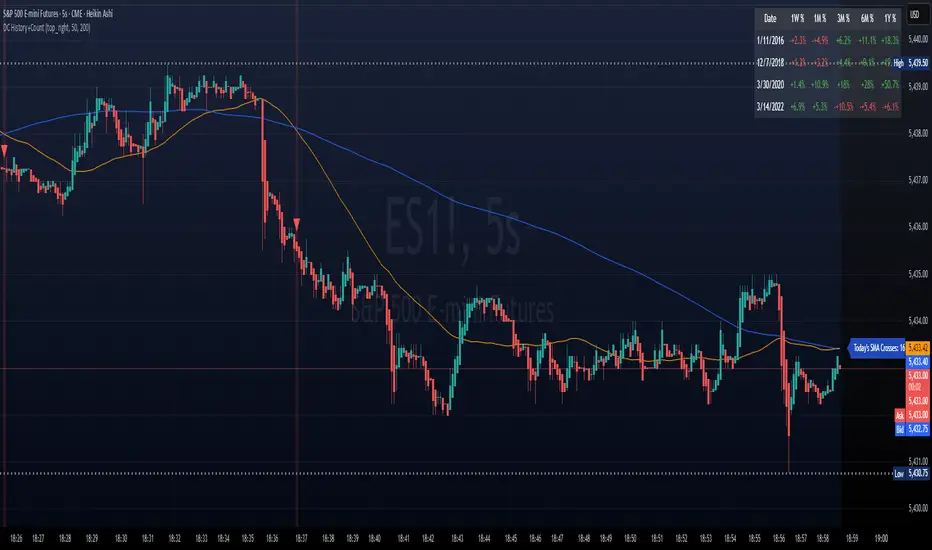
DC History & Daily Cross CountOkay, here is a technical document for the Pine Script indicator we developed. This can be used as a guide or description when publishing the script on TradingView or elsewhere.
Technical Document: SMA Cross Signals & Static DC History (Death Cross)
Version: 1.0
Date: April 14, 2025
Indicator Name: Specific Static DC History + Live Signals
Pine Script Version: 5
1. Overview
This TradingView indicator is designed to provide traders with visual signals for Simple Moving Average (SMA) crossovers, specifically focusing on the "Death Cross", while also presenting relevant historical context via a static data table and a real-time daily cross counter.
It combines several features:
Plotting of a fast and a slow Simple Moving Average (SMA).
Visual identification and marking of "Death Cross" events (Fast SMA crossing below Slow SMA) directly on the price chart.
A customizable table displaying static, pre-defined historical performance data of the S&P 500 following specific Death Crosses that occurred between 2016 and 2022.
An optional label that counts the total number of SMA crosses (both Golden Crosses and Death Crosses) occurring during the current trading day/session, including extended hours if enabled by the user on their chart.
2. Features
Customizable SMA Lengths: User-defined periods for both the Fast (default 50) and Slow (default 200) SMAs.
Death Cross Signals: Clear visual markers (red triangles above the bar and optional background shading) when the Fast SMA closes below the Slow SMA.
Optional SMA Plotting: Ability to show or hide the SMA lines themselves.
Static Historical Performance Table: Displays fixed historical return data (1 Week, 1 Month, 3 Months, 6 Months, 1 Year) following specific S&P 500 Death Crosses that occurred on 1/11/2016, 12/7/2018, 3/30/2020, and 3/14/2022. Note: This data is static and does not change based on the current chart.
Customizable Table Position: User can select the on-screen corner for the data table.
Daily SMA Cross Counter: Optionally displays a label showing the cumulative number of times the Fast SMA has crossed above (Golden Cross) or below (Death Cross) the Slow SMA during the current trading day/session.
Extended Hours Compatibility: The Daily Cross Counter includes crosses from pre-market and after-hours sessions if the user has "Extended Trading Hours" enabled on their TradingView chart settings.
3. Technical Explanation
SMA Calculation: The script uses the built-in ta.sma(source, length) function, calculating the Simple Moving Average based on the close price of each bar for the user-defined fastLen and slowLen.
Death Cross Detection: A Death Cross is detected using ta.crossunder(fastMA, slowMA). This function returns true on the first bar where the value of fastMA is less than the value of slowMA, after previously being greater than or equal to it. The comparison is based on the calculated SMA values at the close of each bar.
Golden Cross Detection: Similarly, ta.crossover(fastMA, slowMA) is used to detect Golden Crosses for the daily counter.
Visual Signals: The plotshape() function draws a red triangle above the bar where deathCross is true. The bgcolor() function applies a transparent red background to the bar where deathCross is true.
Static Table Data: The historical performance data for the 4 specified dates (Jan 2016 - Mar 2022) is hardcoded into array variables within the script. This data was derived from a prior analysis (based on the initially provided image, source likely Dow Jones Market Data or similar) and is not calculated dynamically from the chart. The script iterates through these arrays and populates a table object on the last bar.
Daily Cross Counter:
A var int dailyCrossCount variable holds the count, ensuring persistence across bars within a day.
ta.change(time("D")) detects the start of a new daily session based on the chart's symbol and session settings. When true, the dailyCrossCount is reset to 0.
On each bar, if either deathCross or goldenCross is true, the dailyCrossCount is incremented.
A label object displays the dailyCrossCount and is updated on the last bar (barstate.islast).
Extended Hours Inclusion: The script inherently uses the data series provided by the chart. If the chart is configured to include Extended Trading Hours (ETH), the close prices used for SMA calculations will reflect ETH data, and crosses occurring during ETH will be detected and counted.
4. Settings (Inputs)
Show Static Data Table (2016-2022) (Checkbox): Toggles the visibility of the table containing the fixed historical performance data. (Default: On)
Table Position (Dropdown): Selects the corner or side of the chart where the static data table will be displayed. (Default: top_right)
Plot 50/200 SMAs (Checkbox): Toggles the visibility of the Fast and Slow SMA lines on the chart. (Default: On)
Fast MA Length (Integer Input): Sets the lookback period for the Fast Simple Moving Average. (Default: 50)
Slow MA Length (Integer Input): Sets the lookback period for the Slow Simple Moving Average. (Default: 200)
Show Daily Cross Count (Checkbox): Toggles the visibility of the label displaying the number of SMA crosses detected during the current day's session. (Default: On)
5. How to Use / Interpretation
Apply the indicator to your desired chart (e.g., SPY, QQQ, /ES).
Use the plotted SMA lines (if enabled) and the red triangle/background signals to identify potential trend changes indicated by Death Crosses based on your chosen MA lengths. Remember that these are lagging indicators.
Refer to the static data table for historical context only. It shows how the S&P 500 performed following specific Death Crosses between 2016 and 2022. This data is fixed and does not predict future performance.
Use the "Today's SMA Crosses" label (if enabled) to gauge the frequency of interaction between the chosen SMAs during the current session. A higher number might indicate choppier conditions or potential shifts on the chart's timeframe.
Important: For the Daily Cross Counter to reflect pre-market/after-hours activity, ensure "Extended Trading Hours" (ETH) is enabled in your TradingView chart settings.
Be aware that the number of crosses detected by the script (based on bar closes) may differ from visual interpretations of lines touching intraday, especially on lower timeframes.
6. Limitations
Static Table Data: The performance data in the table is fixed to the 4 provided historical instances (2016-2022) and is not calculated dynamically or updated. It serves only as a historical reference point.
Lagging Indicators: Moving Averages and their crosses are lagging indicators and may not signal trend changes precisely at tops or bottoms.
Cross Calculation: Crosses are based on the closing price of each bar. Intraday price movements briefly piercing an SMA may not register as a confirmed cross.
Daily Counter Definition: The definition of "Today" depends on the chart's session timing, which might not align perfectly with a calendar day.
Whipsaws: On lower timeframes or during volatile periods, MA crosses can generate frequent signals (whipsaws) which may be less reliable.
7. Disclaimer
This indicator is provided for informational and educational purposes only. It does not constitute financial advice or a recommendation to buy or sell any security. Trading involves significant risk, and past performance (including the historical data presented in the table) is not indicative of future results. Always conduct your own thorough research and consult with a qualified financial advisor before making any trading decisions.
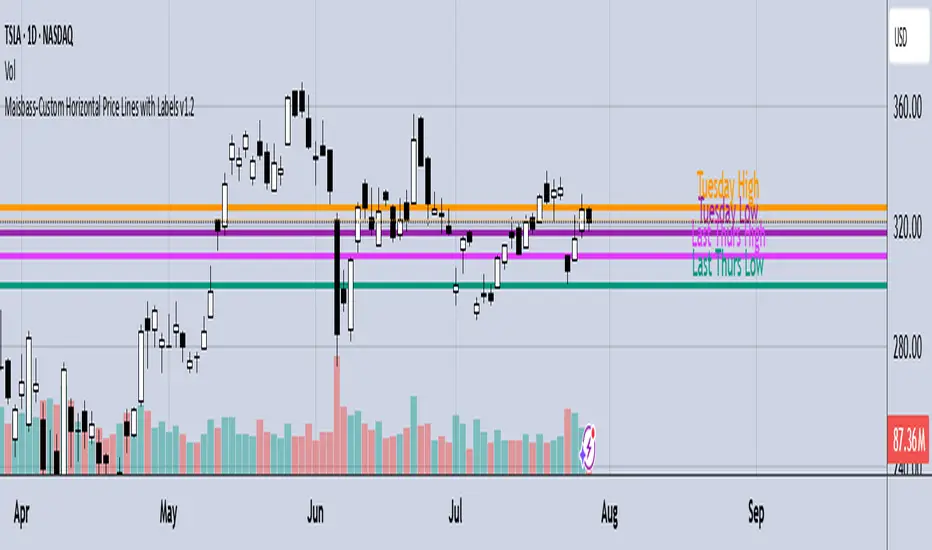
Maisbass-Custom Horizontal Price Lines with Labels v1.2Beta. I'm a noob at this.
This script will allow you to manually input price and create a horizontal line with text. It was created primarily for manually entering price of daily high and daily low over a two week period. However you do have the ability to edit the text plotted from the input tab, change color and style of horizontal lines, text size and position, etc. if you input price on the style tab, text won't be plotted, just the line. It's important if you want the text showing as well, you must use the input tab to do so. I plan on correcting this in the future.
Nick_OS RangesUNDERSTANDING THE SCRIPT:
TIMEFRAME RESOLUTION:
* You have the option to choose Daily , Weekly , or Monthly
LOOKBACK WINDOW:
* This number represents how far back you want the data to pull from
- Example: "250" would represent the past 250 Days, Weeks, or Months depending on what is selected in the Timeframe Resolution
RANGE 1 nth (Gray lines):
* This number represents the range of the nth biggest day, week, or month in the Lookback Window
- Example: "30" would represent the range of the 30th biggest day in the past 250 days. (If the Lookback Window is "250")
RANGE 2 nth (Blue lines):
* This number represents the range of the nth biggest day, week, or month in the Lookback Window
- Example: "10" would represent the range of the 10th biggest day in the past 250 days. (If the Lookback Window is "250")
RANGE 3 nth (Pink lines):
* This number represents the range of the nth biggest day, week, or month in the Lookback Window
- Example: "3" would represent the range of the 3rd biggest day in the past 250 days. (If the Lookback Window is "250")
YELLOW LINES:
* The yellow lines are the average percentage move of the inputted number in the Lookback Window
SUGGESTED INPUTS:
FOR DAILY:
Lookback Window: 250
Range 1 nth: 30
Range 2 nth: 10
Range 3 nth: 3
FOR WEEKLY:
Lookback Window: 50
Range 1 nth: 10
Range 2 nth: 5
Range 3 nth: 2
FOR MONTHLY:
Lookback Window: 12
Range 1 nth: 3
Range 2 nth: 2
Range 3 nth: 1
TIMEFRAMES TO USE (If You Have TradingView Premium):
Daily: 5 minute timeframe and higher (15 minute timeframe and higher for Futures)
Weekly: 15 minute timeframe and higher
Monthly: Daily timeframe and higher (Monthly still has issues)
TIMEFRAMES TO USE (If You DO NOT Have TradingView Premium):
Daily: 15 minute timeframe and higher
Weekly: 30 minute timeframe and higher
Monthly: Daily timeframe and higher (Monthly still has issues)
IMPORTANT RELATED NOTE:
If you decide to use a higher Lookback Window, the ranges might be off and the timeframes listed above might not apply
ISSUES THAT MIGHT BE RESOLVED IN THE FUTURE
1. If it is a shortened week (No Monday or Friday), then the Weekly Ranges will show the same ranges as last week
2. Monthly ranges will change based on any timeframe used

Lepelle's Key LevelsCredit to original code goes to paaax and NSDT. Modified to include premarket H/L levels and to show only daily levels. Indicator includes Close levels.
-US Premarket High and Low Levels
-Daily OHL Levels (No close included)
-Yesterday and Previous day OHLC level
-Labels and ability to modify user preferences (color, line)

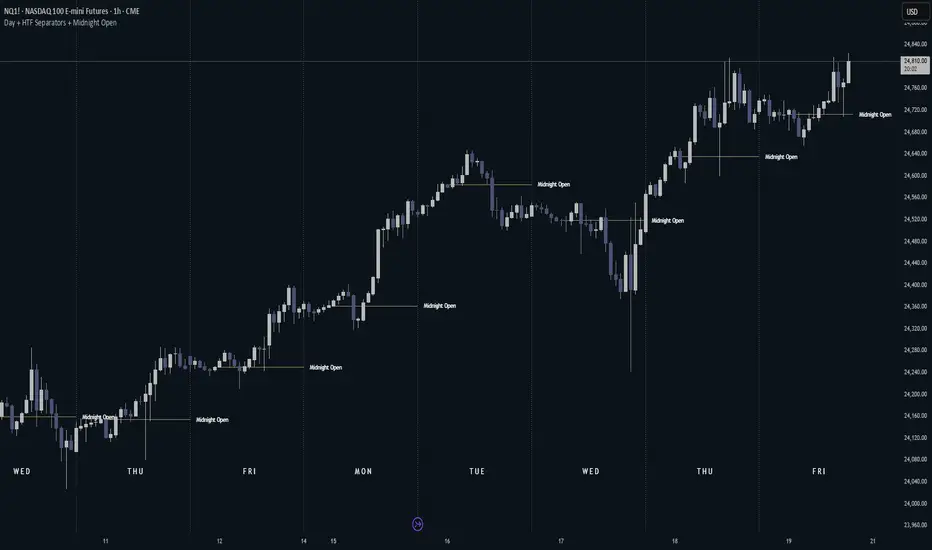
Day + HTF Separators + Midnight OpenOverview
The Day + HTF Separators + Midnight Open indicator is a versatile and easy-to-use tool for traders who want to track key price levels and time-based market events. It draws vertical lines to mark the start of each day, 4-hour period, and 1-hour period, adds labels to show the day of the week, and plots a horizontal line at a customizable hourly open price (defaulting to midnight, referred to as the "Time-Designated Open" or TDO). This indicator is perfect for day traders, swing traders, and anyone analyzing price action in Futures, forex, cryptocurrencies, or other markets on TradingView.
Designed for intraday charts (e.g., 1-minute, 5-minute, or 1-hour), this indicator offers extensive customization options, letting you toggle features, change colors, adjust line styles, and position labels. It’s built to be lightweight, ensuring smooth performance even on charts with lots of historical data.
Key Features
1. Daily Separators
What It Does: Draws a vertical line at the start of each new trading day to help you see daily boundaries clearly.
How It Works:
Places a vertical line at the beginning of each day, spanning the full price range of the opening moment.
Lines extend across the chart, making it easy to spot daily transitions.
Keeps up to 300 past daily lines visible, automatically managing older ones to stay within TradingView’s limits.
Customization:
Show/Hide: Always shown on intraday charts but tied to the "Show Days of Week Labels" setting for consistency.
Color: Choose any color (default: a medium gray).
Style: Pick Solid, Dashed, or Dotted lines (default: Dotted).
Why Use It: Helps you track daily price ranges, identify daily open/close levels, and plan trades around daily market cycles.
2. Day of the Week Labels
What It Does: Displays the day of the week (e.g., "MON" for Monday) at a specific hour each day, making it easy to know which day you’re analyzing.
How It Works:
Shows labels like "MON", "TUE", "WED", "THU", "FRI", "SAT", or "SUN" at the bottom of the chart.
Labels appear at a user-chosen hour (default: 5:00 AM) each day.
Only works on intraday charts (e.g., 5-minute or 1-hour).
Customization:
Show/Hide: Turn on/off with "Show Days of Week Labels" (default: on).
Color: Set the label text color (default: dark gray).
Hour: Choose any hour from 0:00 to 23:00 for label placement (default: 5:00 AM).
Why Use It: Great for traders who need to track specific days for events like economic releases or to spot weekly patterns in price action.
3. 4-Hour Separators
What It Does: Marks the start of each 4-hour period with a vertical line, ideal for aligning with higher timeframe trends.
How It Works:
Draws vertical lines every 4 hours, covering the price range of the starting moment.
Lines extend across the chart for clear visibility.
Stores up to 100 past 4-hour lines, reusing older ones for efficiency.
Customization:
Show/Hide: Enable/disable with "Show 4H Separator" (default: off).
Color: Choose any color (default: gray, slightly transparent).
Style: Select Solid, Dashed, or Dotted lines (default: Dotted).
Why Use It: Perfect for swing traders or those combining intraday trading with 4-hour chart analysis, such as identifying key support or resistance levels.
4. 1-Hour Separators
What It Does: Draws vertical lines to mark the start of each hour, helping short-term traders track hourly price movements.
How It Works:
Places a vertical line at the start of each hour, spanning the price range.
Lines extend across the chart and support up to 100 historical lines.
Customization:
Show/Hide: Enable/disable with "Show 1H Separator" (default: off).
Color: Pick any color (default: a light gray, slightly transparent).
Style: Choose Solid, Dashed, or Dotted lines (default: Dotted).
Why Use It: Ideal for scalpers or day traders focusing on hourly trends, session changes, or short-term price action.
5. Time-Designated Open (TDO) Lines
What It Does: Plots a horizontal line at the opening price of a chosen hour (default: midnight, 00:00) each day, with an optional label to mark the price level, helping you track key price points across multiple days.
How It Works:
Draws a horizontal line at the open price of the selected hour (e.g., midnight) in your chosen timezone (default: New York time).
Lines start at the chosen hour and extend to the current moment on the chart (or a few bars beyond, based on settings) or until 5:00 PM New York time (market close for Futures).
Supports up to 100 past TDO lines, keeping historical opens visible for comparison.
Adds a label (e.g., "TDO") at the end or start of the line, which is invisible by default due to full transparency.
Lines and labels only appear if both the main toggle and TDO-specific toggle are enabled.
Customization:
Show/Hide Line and Label: Turn on/off with "Enable Candle Open Line/Label" and the TDO-specific toggle (both default: on).
Show/Hide Label: Enable/disable the label separately with "Enable Candle Open Label" (default: on).
Hour: Select any hour from 00:00 to 23:00 (default: 00:00).
Label Text: Customize the label name (default: "TDO").
Line Color: Choose any color (default: light cyan).
Line Style: Pick Solid, Dashed, or Dotted (default: Solid).
Label Text Color: Set the label text color (default: gray, fully transparent).
Label Background Color: Choose the label background color (default: black).
Label Transparency: Adjust transparency for both label text and background (default: fully transparent, invisible).
Label Size: Select Tiny, Small, Normal, or Large (default: Small).
Label Position: Place the label at the right or left of the line with "Stick Label to Right" (default: right) and adjust spacing with "Label Padding" (default: 1 bar).
Line Length: Shorten the left side with "Enable Left-Side Trimming" (default: off) and set the trim length with "Left Trim Bars" (default: 8 bars). Extend the right side with "Line Padding" (default: 2 bars).
Timezone: Choose from New York, UTC, London, Paris, Tokyo, Shanghai, Singapore, or Sydney (default: New York).
Max History: Set how many past TDO lines to show (default: 100).
Multi-Day Plotting:
Plots a TDO line for the chosen hour (e.g., 00:00) each day, based on historical data.
Each line starts at the open price of that hour and extends to the current moment or 5:00 PM New York time (for Futures).
Past TDO lines stay visible, letting you compare daily open prices over time (up to 100 days, adjustable).
How to Use
Add to Your Chart:
Add the indicator to an intraday chart (e.g., 1-minute, 5-minute, or 1-hour) for any market (Futures, forex, crypto, etc.).
It works best on intraday timeframes to show all features.
Customize Settings:
Open the settings panel in TradingView.
Turn on/off features like daily separators, DOW labels, 1-hour/4-hour separators, or TDO lines.
Adjust colors, line styles, and label positions to fit your chart’s look.
Set the TDO hour (e.g., 00:00 for midnight or 03:00 for London open) and timezone to match your market.
Make TDO labels visible by reducing "Label Transparency" or changing "Label Text Color" to an opaque color.
Analyze the Chart:
Use daily separators to spot daily price ranges and key levels.
Check DOW labels to track specific days for trading events or weekly trends.
Use 1-hour/4-hour separators to align with short-term or higher timeframe strategies.
Monitor TDO lines to identify key opening price levels across days, useful for support/resistance or breakout trading.
Test and Adjust:
Toggle the main TDO switch or specific TDO toggle to hide/show the TDO line.
Reduce "Label Transparency" to 0 or change "Label Text Color" to make TDO labels visible.
Performance: The indicator is optimized to handle up to 300 daily lines, 100 4-hour lines, 100 1-hour lines, and 100 TDO lines, ensuring it runs smoothly on long charts.
Markets: Best for intraday charts. The 5:00 PM New York close is designed for futures; switch to UTC for forex or crypto.
Labels: TDO labels are invisible by default (fully transparent). Adjust "Label Transparency" or "Label Text Color" to make them visible.
Time Context: As of September 17, 2025, 6:08 PM EDT, TDO lines on stock charts stop updating at 5:00 PM New York time. Use historical data or change the timezone for continuous markets.
Limitations
Only works on intraday charts (e.g., 1-minute to 1-hour).
TDO lines stop at 5:00 PM New York time for Futures; adjust the timezone for 24/7 markets.
TDO labels are hidden by default (fully transparent); change transparency or color to see them.
Limited to 500 total lines and labels due to TradingView’s restrictions, managed automatically.
Feedback
If something isn’t working (e.g., missing lines or labels), please share:
The market and timeframe (e.g., EUR/USD, 5-minute).
Your settings (e.g., TDO hour, timezone, transparency).
A description or screenshot of the issue. This indicator is designed to make your trading easier with clear visuals for time-based analysis. Happy trading!
VX DailyCycle PD Table (Levang)**Futures trading dependent**
QT Theory dependent (Daye) --> VX Theory DailyCycle with 3 ranges using detailing extreme premium range to mean range to extreme discount range *ONLY* 15min timeframe that start at 7:30am every trading day. This data table compares 3 triads (default qt triads as inputs) detailing what range each asset is currently in.
**continuous contracts are default as inputs but monthly contracts works best.**
Overview
This indicator creates a dynamic table showing the current market position of multiple assets across three major market segments: Equity Index futures, Currency futures, and Bond futures. Each asset's position is analyzed using VX Daily Cycle levels and displayed with intuitive color-coding and symbols.
Assets Tracked
Equity Triad: ES1!, NQ1!, YM1!
Currency Triad: DXY (Capital.com), 6E1!, 6B1!
Bond Triad: ZB1!, TN1!, ZF1!
Visual Interpretation
The table uses three main colors to indicate market positioning:
Green: Asset is trading at a discount
Yellow: Asset is trading in the mean range
Red: Asset is trading at a premium
Symbols (▲▲, ▲, △, ▽, ▼, ▼▼) provide additional detail about position within each range:
Double symbols (▲▲, ▼▼): Extreme levels
Solid symbols (▲, ▼): Strong moves
Hollow symbols (△, ▽): Moderate moves
Updates
The table updates every 15 minutes
Works on all timeframes while maintaining consistency
Position calculations are based on recent price action
Usage
This indicator is particularly useful for:
Cross-market analysis
Identifying relative value opportunities
Multi-timeframe market analysis
Understanding market correlations
Spotting potential reversals or continuations
Note
The indicator requires access to all listed symbols for full functionality. Some brokers may not provide access to all market
Legend:
VX Levels Color and Symbol Cheat Sheet
Upper Extension Range (Red)
▲▲ : (Extreme Premium)
▲ : (High Premium)
△ : (Moderate Premium)
Mean Range (Yellow)
△ : (Upper Mean)
▽ : (Lower Mean)
Lower Extension Range (Green)
▽ : (Moderate Discount)
▼ : (High Discount)
▼▼ : (Extreme Discount)

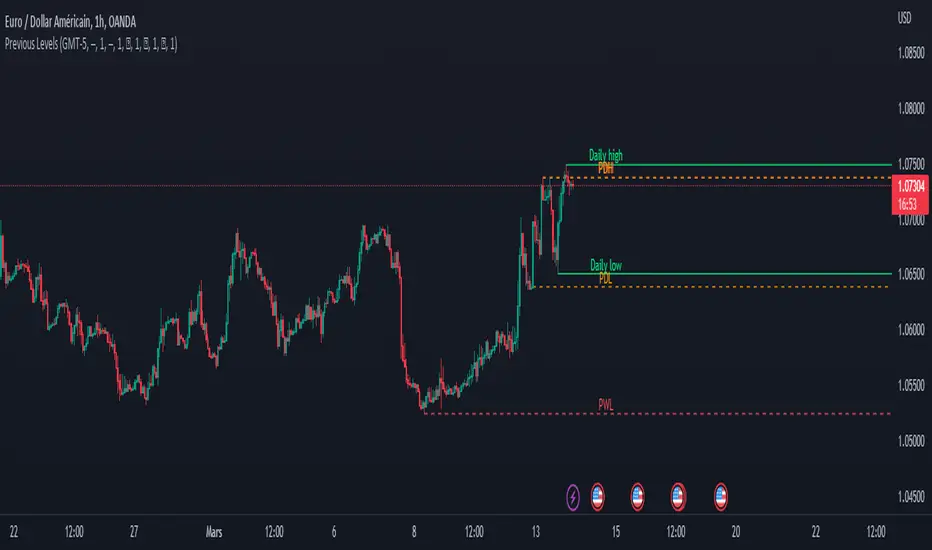
Previous Levels With Custom TimeZoneThe Previous Levels With Custom TimeZone indicator shows to users specifics price area which can be liquidity to take.
Users can determine the desired time zone to retrieve the correct daily, weekly and monthly values.
Several price area are shown with with indicator which are :
Daily Open Price
Daily Low Price
Daily High Price
Previous Daily Low Price
Previous Daily High Price
Previous Weekly Low Price
Previous Weekly High Price
Previous Monthly Low Price
Previous Monthly High Price
All price area are configurable to let user have specific color or line style for each area.
Here's some example :
Daily Open / High / Low
Previous Daily High / Low
Previous Weekly High / Low
Previous Monthly High / Low
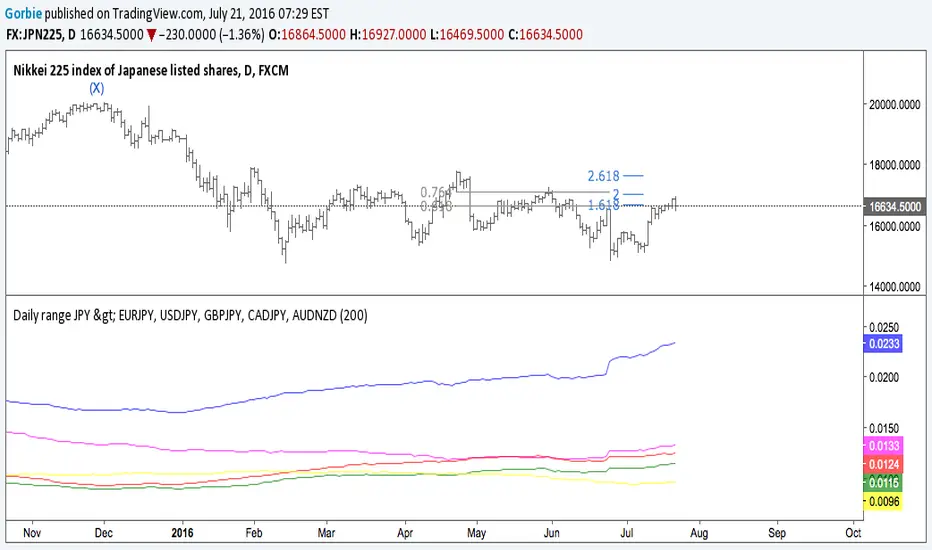
MTF previous high and low quarter levelsDescription
An experimental script that prints quarter levels of the previous timeframe's high and low to the current timeframe. The idea is quite simple and is basically the Fibonacci pivoted on the previous high and low with quarter level settings (0,0.25,0.5,0.75,1 etc). The default setting is the previous daily high and low but can be customized on user discretion.
New quarter levels are printed after the close of the previous timeframe and open of the new timeframe (user's timeframe setting)
How To Use
Levels should not be used blindly. Levels can be used as confluence when aligned with high probability supply and demand zones, support, resistance, order blocks, and so on.
Credit to @HeWhoMustNotBeNamed for the Previous High/Low MTF indicator code and @mrbirman for the idea to put this together.

RVOL Relative Volume - IntradayHello All,
Relative Volume is one of the most important indicators and Traders should check it while trading/analyzing. it is used to identify whether the volume flows are increasing or decreasing. Relative volume measures current volume in relation to the “usual” volume for this time of the day. What is considered “usual"? For that, we have to use a historical baseline known as the average daily volume. That means how much volume a security does on a daily basis over a defined period. (This scripts runs on the time frames greater or equal 1 minute and less than 1 day)
The common definition for real-time relative volume is: Current volume for this time of day / Average volume for this time of day. It does not mean taking the volume (for example) from 10:30 am to 10:45 am and comparing it to what it does from 10:30 am to 10:45 am every day. What it truly means is to compare cumulative volumes. Therefore, this is the precise definition of real-time relative volume:
Current cumulative volume up to this time of day / Average cumulative volume up to this time of day
What should we understand while checking RVOL;
- Relative volume tell us if volume flows are increasing or decreasing
- A high relative volume tells us that there is increased trading activity in a security today
- Increased volume flows often accompany higher volatility i.e. a significant price move
Let see an example:
P.S. if you want to get more info about RVOL/Relative Volume then you can search it on the net. While developing the script this was used as reference, you can also check it for more info.
Enjoy!
