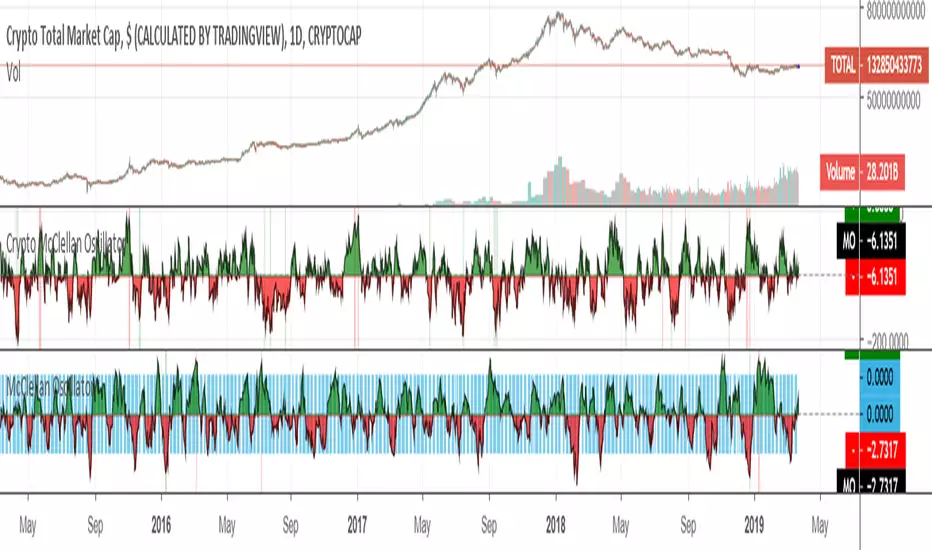
Crypto McClellan OscillatorMcClellan Oscillator for cryptocurrency, taking into account only the top 40 cryptos.
Original code was by LazyBear.
"crypto" için komut dosyalarını ara
Crypto RSI AdvancedThe Crypto RSI Advanced Indicator: A Multi-Dimensional Market Assessment Tool
This document outlines the unique features, functionality, implementation, and theoretical foundation of the "Crypto RSI Advanced" indicator. It is designed to be far more than a simple oscillator; it is a comprehensive analytical suite that enhances the classic Relative Strength Index (RSI) by incorporating trend-filtered signals, visual context, and real-time market state diagnostics.
Core Originality & Unique Value Proposition
The primary innovation of this script lies in its multi-layered, context-aware approach to momentum analysis. While traditional RSI indicators often generate signals based solely on crossing static levels (like 30/70), leading to false signals in strong trends, this script synthesizes four critical dimensions of information:
Momentum Value: The raw RSI reading.
Momentum Trend: The direction of the RSI itself, determined by its short-term trajectory.
Zone Persistence: Whether the RSI is coming from an overbought/oversold condition, adding conviction to breakouts.
Integrated Signal Confirmation: The use of a smoothed signal line (EMA of RSI) for additional validation.
This synthesis transforms the RSI from a standalone oscillator into a cohesive trading system framework that helps distinguish between potential reversal points and mere pauses within a strong trend.
What It Does & How It Achieves It
The indicator performs several interconnected functions, presented in a single pane below the price chart:
Enhanced RSI & Signal Line Plotting:
It calculates the standard RSI based on a user-defined source and length.
It plots a smoothed Signal Line (an EMA applied to the RSI values), which acts as a dynamic filter. Crosses between the RSI and this signal line can provide earlier or more refined entry clues than static level crosses alone.
Dynamic Visual Context and Alerts:
Colored Background Bands: The plot area is dynamically shaded to visually telegraph the market state at a glance: blue for oversold, orange for overbought, and white for the neutral zone.
Conditional RSI Line Coloring: The RSI line itself changes color based on its zone and position relative to the 50 mid-line, providing instant visual feedback on momentum strength and bias.
Multi-Tiered Signal Detection: The script identifies four distinct signal types:
Buy/Sell Signal: Triggered when the RSI crosses back inside the oversold/overbought band from an extreme. This aims to catch early reversals as momentum exits an extreme state.
Strong Buy/Strong Sell Signal: A higher-conviction signal triggered when the RSI crosses the oversold/overbought level from within the extreme zone. This suggests a more powerful shift in momentum as the market exits a deeply overextended condition.
Integrated Market Intelligence Panel:
A key original feature is the fixed information table in the top-right corner. This panel synthesizes all calculations into a concise, actionable snapshot for the latest bar, including:
Current precise RSI value.
Market State (e.g., Overbought, Bullish Bias, Neutral).
RSI Trend (Rising, Falling, Consolidating), assessing the oscillator's own momentum.
Active Signal Status (e.g., "Strong Buy", "No Signal").
Zone Intensity (e.g., "Extreme Overbought", "Normal").
Clear Level Annotation:
On the final bar, it draws labeled markers at the key levels (Oversold, Mid, Overbought) for a clean and permanent reference on the chart.
How to Use It
Application: This tool is designed for momentum confirmation, divergence spotting, and identifying potential reversal zones within a broader trend context. It is particularly useful for swing traders and position traders looking for higher-probability entry points, rather than for pure, high-frequency scalping.
Usage Guidelines:
Parameter Setup: Adjust the core RSI Length and Signal Length to match the volatility of your asset and trading timeframe. The default (14, 9) offers a balanced approach.
Signal Hierarchy: Prioritize "Strong" signals over regular signals, as they carry the added context of a zone breakout. A "Strong Buy" signal appearing in an overall uptrend on the higher timeframe presents a high-conviction scenario.
Synthesize Information: Do not trade on signals alone. Use the Information Panel for context. For example, a "Buy Signal" occurring while the panel shows "Market State: Oversold" and "RSI Trend: Rising" offers a congruent, multi-factor setup.
Visual Context: Use the colored bands and line colors for quick assessment. A blue (bullish) RSI line forming in the blue (oversold) shaded area provides immediate visual congruence for a potential long setup.
Confirmation: As with any oscillator, use this tool in conjunction with price action analysis (support/resistance, chart patterns) and other non-correlated indicators (e.g., a trend-following indicator like a moving average) to filter trades and avoid whipsaws in ranging markets.
Underlying Computational Philosophy
The script's logic is built upon the principle of "Contextual Momentum Analysis." The core premise is that the absolute value of the RSI is less important than its behavior relative to its recent state and trajectory.
Trend-Filtered Momentum: By analyzing the RSI's own trend (rsi_trend_up/down), the script introduces a crucial filter. A sell signal occurring while the RSI's internal trend is still rising may be less reliable, warning of a potential false signal.
Zone-Based Conviction: The distinction between a regular and a "Strong" signal is philosophically significant. It applies the concept of "impulse from an extreme." A reversal signal that originates from deep inside an extreme zone is considered to have more kinetic energy (conviction) than one that forms near the boundary.
Synthesis Over Isolation: The script deliberately avoids providing a single "answer." Instead, it presents multiple, simultaneous data points (value, trend, zone, signal line interaction, historical state) and presents them together in the information panel. This empowers the trader to make a reasoned decision based on a confluence of factors, mimicking the analytical process of a seasoned chartist.
In essence, this indicator automates and visualizes a sophisticated, multi-step analytical process that a trader would otherwise have to perform manually, thereby enhancing speed, consistency, and depth of market analysis.

Crypto MACD SignalsUnlocking Enhanced Market Insights: A Next-Generation MACD Indicator for Cryptocurrency Trading
Introduction: Beyond Traditional MACD
In the vast landscape of technical analysis tools, the Moving Average Convergence Divergence (MACD) stands as one of the most ubiquitous and trusted momentum indicators. However, its classic formulation often leaves traders sifting through frequent crossovers, struggling to distinguish high-probability signals from market noise, especially in the volatile cryptocurrency markets. This script represents a significant evolution of the classic MACD, transforming it from a standalone oscillator into a comprehensive, multi-layered signal detection system. Its core originality lies not in reinventing the MACD calculation, but in augmenting it with proprietary filtering mechanisms, quantitative signal scoring, and visual prioritization to enhance decision clarity and timing.
Core Functionality: What It Does and How It Achieves It
This indicator, titled "Crypto MACD Signals," is a dedicated, non-overlay oscillator built for clarity and actionability. It performs three primary functions simultaneously:
Enhanced MACD Visualization: It plots the traditional MACD line, Signal line, and Histogram with a refined color scheme. The histogram is dynamically colored (blue for bullish, orange for bearish) but introduces a key innovation: the identification of "Huge" or "Anomalous" Bars. A bar is highlighted in bright white when its size exceeds twice the 20-bar Simple Moving Average of the absolute histogram values. This instantly draws attention to moments of exceptional momentum surge or capitulation, which often precede significant trend accelerations or reversals.
Context-Aware Signal Generation: Instead of marking every MACD line crossover, the script applies a crucial logical filter. It only plots a "BUY" signal (green upward triangle) when a bullish crossover occurs while the histogram is below the zero line. Conversely, a "SELL" signal (red downward triangle) is plotted only when a bearish crossover occurs while the histogram is above the zero line. This filter ensures signals are generated in the context of a potential trend reversal from an oversold or overbought state, rather than during the middle of a strong trend, dramatically increasing the signal's statistical edge. This aligns with a classic "Oscillator Reversal from Extremes" methodology within trend-following systems.
Real-Time Performance Dashboard: A fixed table in the top-right corner serves as a live statistical dashboard. It tracks and displays the total count of:
Generated Buy Signals
Generated Sell Signals
Total "Huge" Histogram Bars (both bullish and bearish)
This provides traders with an at-a-glance understanding of recent market activity—whether it has been signal-rich or quiet, and the frequency of high-momentum events—aiding in assessing the current market regime (e.g., trending vs. consolidating).
Implementation and Practical Usage
The indicator is designed for tactical swing trading and momentum-based intraday positioning in crypto assets. Its primary use case is for identifying "Pullback Entries within a Trend" and "Early Trend Reversal Confirmations."
For Trend-Following: A trader in an established uptrend would wait for a pullback that drives the MACD histogram negative. A subsequent bullish crossover that triggers a "BUY" signal, especially if accompanied by a "Huge" bullish histogram bar, offers a high-confidence entry point to re-join the trend.
For Counter-Trend/Reversal Scenarios (Scalping): The script is highly effective for a specific scalping technique: "Fading Extreme Momentum Exhaustion." A cluster of "Huge" bearish bars followed by a diminishing histogram and a bullish crossover signal can indicate selling exhaustion, presenting a short-term long scalp opportunity. The inverse applies for short scalps. The labels ("🔥") and arrows provide clear visual cues for these setups directly on the chart.
Workflow: Traders are advised to first observe the statistical table to gauge recent activity. Then, they should look for convergence between a filtered arrow signal (BUY/SELL) and the appearance of a "Huge" bar or a cluster of them. This multi-factor confirmation is the cornerstone of the strategy.
Underlying Philosophy and Calculation Logic
The script's intelligence is built on a layered philosophy of "Momentum Quantification and Contextual Validation."
Dynamic Thresholding for Anomalies: The "Huge Bar" detection does not use a fixed threshold. By comparing the current histogram value to a recent average of absolute momentum (ta.sma(math.abs(hist_line), 20)), it creates an adaptive, market-responsive benchmark. A bar that is 200% larger than recent average momentum is statistically anomalous, suggesting institutional-sized order flow or a major shift in sentiment. This is a direct application of statistical volatility band principles to momentum, not price.
Signal Filtering for Phase Alignment: The conditional logic for plotting arrows (bullish_cross and hist_line < 0) ensures the MACD crossover signal is aligned with the correct momentum phase of the market cycle. A buy signal is only valid if momentum (histogram) is coming from a "recharging" or bearish area (below zero), not when it's already extended above zero. This prevents buying at a peak and selling at a trough, which is a common pitfall of the raw indicator. This embodies the trading axiom: "Trade the turn, not the continuation."
Quantitative Self-Awareness: The integrated counter and dashboard represent a meta-analysis layer. It allows the tool to provide feedback on its own performance density. A market generating many signals might be choppy and range-bound, while a market with few signals but several "Huge Bars" might be in a strong, steady trend. This helps the trader select the appropriate strategy (trend riding vs. reversal scalping) for the current environment.
In essence, this script synthesizes several respected trading concepts: the core trend/momentum logic of MACD, the anomaly detection common to volatility-based indicators like Keltner Channels, and the signal-verification philosophy of multi-indicator systems—all packaged into a single, coherent, and visually intuitive tool specifically tuned for the unique amplitude and speed of cryptocurrency markets.

Crypto Session Range 📄 INDICATOR DESCRIPTION (ENGLISH)
Crypto Session Range (Custom Timezone) is a lightweight and accurate session-based indicator designed specifically for cryptocurrency markets (24/7).
This indicator allows traders to define custom trading time windows using any global timezone, solving common issues found in traditional session indicators that are built for stock markets.
🔹 Key Features
Custom timezone support (e.g. America/Puerto_Rico, America/New_York, UTC)
Up to 3 configurable trading sessions
Visual background highlighting during active sessions
Automatic High & Low range tracking for each session
Optional range extension after the session ends
Works on all crypto pairs and timeframes
🔹 Who Is This For?
Crypto traders who want precise session control
Day traders, scalpers, and session-based strategies
Traders who operate during specific market windows (London / NY / custom)
🔹 Notes
This indicator is not restricted to exchange trading hours and is fully compatible with 24/7 markets like crypto, unlike many default session tools.

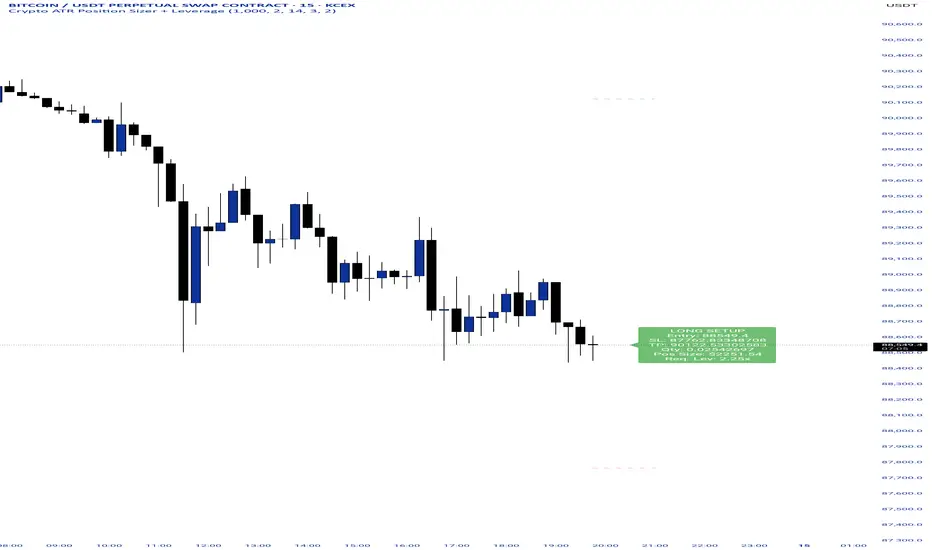
Crypto ATR Position Sizer + LeverageThis indicator is a "heads-up display" for crypto traders who need real time risk management without manually calculating position sizes. It uses Average True Range (ATR) to dynamically place Stop Losses based on current market volatility and automatically calculates the exact position size needed to respect your risk percentage.
Key Features:
Dynamic Risk Management: Stop Loss and Take Profit levels adjust automatically based on market volatility (ATR).
Auto-Position Sizing: Calculates the exact Quantity (in coins) and Position Value (in $) to ensure you never risk more than your defined percentage (e.g., 1% or 2%).
Leverage Calculator: Instantly sees the "Required Leverage" needed to execute the trade size relative to your account balance.
Crypto Precision: Displays up to 8 decimal places, making it compatible with both Bitcoin and low-sat altcoins.
Toggable Direction: Switch between Long and Short biases instantly via the settings menu.
How to Use:
Add the indicator to your chart.
Open Settings and input your Account Balance and Risk %.
Choose your direction (Long or Short) using the checkboxes.
The label will display your Entry, SL, TP, Coin Quantity, and Required Leverage in real-time.
Crypto Leverage Index(OI Norm. + FR)Crypto Leverage Index (OI Z-Score + Funding Rate Signals)
(A tool for detecting speculative extremes and leverage load in crypto derivatives markets.)
Hello, fellow traders around the globe!
In today's crypto futures market, often perceived as a 'playground for large players' (whales/smart money), catching extreme leverage behavior is crucial for survival. I wanted to come up with an indicator to quickly identify such market extremes by focusing on the two most potent indicators of leveraged action: Open Interest (OI) and Funding Rate (FR). The goal is to ride on the shoulders of the market movers by anticipating their next liquidity-driven actions. hope this helps.
❗ IMPORTANT NOTE: This indicator works exclusively on Perpetual Futures or Swap Charts that provide Open Interest (OI) data.
⚪ Overview
This indicator provides a standardized view of speculative activity by calculating the Open Interest (OI) Z-Score . This score reveals when the current level of open leverage is abnormally high (premium) or low (discount) relative to its historical mean and volatility. The index is also augmented with Extreme Funding Rate Signals , which plot simple White Dots on the chart when derivative positioning (long or short bias) reaches an unsustainable, overheated level. The combination of OI volume and positioning bias offers a good method to identify potential market reversal zones driven by leverage liquidation risks (short/long squeezes).
⚪ Score Components
Open Interest Z-Score (Leverage Load)
The primary component standardizes the Open Interest value over a defined lookback `Period` (default 50). This calculation reveals the statistical deviation of current leverage from the norm.
OI Z-Score = (OI - Mean(OI)) / StDev(OI)
Funding Rate (Positioning Bias)
Calculates the approximate funding rate using a TWAP (Time-Weighted Average Price) of the Perpetual Futures Premium, combined with the standard 0.01% Interest Rate.
⚪ Extreme Condition Detection
OI Z-Score Extremes
* Premium Zone (Red Fill) : OI Z-Score is above the user-defined `Threshold` (default 2.0). Indicates high/overstretched leverage.
* Discount Zone (Green Fill) : OI Z-Score is below the user-defined negative threshold (default -2.0). Indicates low/unwinded leverage.
Funding Rate Extreme Signals (White Dots)
These appear as small White Dots ( · ) plotted at fixed levels within the indicator pane. The position indicates the bias:
* Top Dot (Excessive Longs) : Triggered when Funding Rate is greater than Abnormal Funding Rate Threshold (e.g. 0.03%). Indicates excessive Long positioning/greed and potential for a short-term reversal (Long Squeeze risk). The dot is plotted at the positive `FR Signal Plot Level`.
* Bottom Dot (Excessive Shorts) : Triggered when Funding Rate is lower than -Abnormal Funding Rate Threshold(e.g. -0.03%). Indicates excessive Short positioning/fear and potential for a short-term reversal (Short Squeeze risk). The dot is plotted at the negative `FR Signal Plot Level`.
⚪ Leverage Case Scenarios (Price, OI Dynamics & Context)
The OI Z-Score reflects the premium/discount state of *leverage* (Open Interest) , not the price. The price may not be in a premium or discount area simply because the OI is. OI only indicates the volume of outstanding futures positions. You must observe price action and candlestick patterns alongside the OI movements to determine the true contextual hint. Understanding the relationship between price and Open Interest (OI) change is key to interpreting market movements. The cases listed below represent the most common and thinkable patterns, but do not exhaust all possible market behaviors.
1. Long Build-Up (Price ▲, OI ▲): New long positions enter, confirming the rising trend.
2. Short Build-Up (Price ▼, OI ▲): New short positions enter, confirming the falling trend. Due to the inherently long-biased nature of the crypto market, this scenario is less frequently observed than Long Build-Up.
3. Long Covering/liquidation (Price ▼, OI ▼): Existing longs are closed/liquidated. This activity usually results from Panic Selling or forced long liquidation.
4. Short Covering (Price ▲, OI ▼): Existing shorts are forced to close (Short Squeeze).
5. Long Trap (Price ▲, OI ▲ or ▼): Price rises, but OI suggests new positioning that might be trapping longs. Bearish candle pattern can be often shown with the sweep.
6. Short Trap (Price ▼, OI ▲ or ▼): Warning Sign - Price falls, but OI suggests new positioning that might be trapping shorts.
⚪ Key Input Parameters
OI Z-Score
* Period (Default: 50)
Determines how many recent bars are used to calculate the rolling mean and volatility (standard deviation) of the Open Interest data.
* Z-Score Threshold (Default: 2.0)
The critical level that the OI Z-Score must cross to be considered 'extreme' (overstretched leverage).
Funding Rate
* Abnormal FR Threshold (Default: 0.03)
The absolute percentage value (e.g., 0.03%) that the Funding Rate must exceed or fall below to trigger an extreme signal dot.
* FR Signal Plot Level (Default: 4.0)
Sets the fixed vertical position (Y-level) on the Z-Score chart where the Funding Rate signal dots will appear. (e.g., 4.0 plots the dot at the Z-Score +-4.0 level).
Disclaimer
This script is for educational and informational purposes only and does not constitute financial advice or investment recommendations. Trading cryptocurrencies involves significant risk and you are solely responsible for your own investment decisions, based on your financial situation, objectives, and risk tolerance. The author assumes no liability for losses arising from the use of this indicator.

Crypto Mean Reversion System (Pullback & Bounce)Mean Reversion Theory
The indicator operates on the principle that extreme price movements in crypto markets tend to revert toward their mean over time.
Consider this a valuable aid for your dollar-cost averaging strategy, effectively identifying periods ripe for accumulating or divesting from the market.
Research shows that:
Short-term momentum often persists briefly after surges, but extreme moves trigger mean reversion
Sharp drops exhibit strong bounce patterns, especially after capitulation events
Longer timeframes (7-day) show stronger mean reversion tendencies than shorter ones (1-day)
Timeframe Analysis
1-Day Timeframe
Pullback probabilities: 45-85% depending on surge magnitude
Bounce probabilities: 55-95% depending on drop severity
Captures immediate overextension and panic selling
More volatile but faster signal generation
7-Day Timeframe
Pullback probabilities: 50-90% (higher confidence)
Bounce probabilities: 50-90% (slightly moderated)
Filters out noise and identifies sustained trends
Stronger mean reversion signals due to extended moves
Probability Tiers
Pullback Risk (After Surges)
Moderate (45-60%): 5-10% surge → Expected -3% to -12% pullback
High (55-70%): 10-15% surge → Expected -5% to -18% pullback
Very High (65-80%): 15-25% surge → Expected -10% to -25% pullback
Extreme (75-90%): 25%+ surge → Expected -15% to -40% pullback
Bounce Probability (After Drops)
Moderate (55-65%): -5% to -10% drop → Expected +3% to +10% bounce
High (65-75%): -10% to -15% drop → Expected +6% to +18% bounce
Very High (75-85%): -15% to -25% drop → Expected +10% to +30% bounce
Extreme (85-95%): -25%+ drop → Expected +18% to +45% bounce
The probability ranges are derived from:
Crypto volatility patterns: Higher volatility than traditional assets creates stronger mean reversion
Behavioral finance: Extreme moves trigger emotional trading (FOMO/panic) that reverses
Historical backtesting: Probability estimates based on typical reversion patterns in crypto markets
Timeframe correlation: Longer timeframes show increased reversion probability due to reduced noise
Key Features
Dual-direction signals: Identifies both overbought (pullback) and oversold (bounce) conditions
Multi-timeframe confirmation: 1D and 7D analysis for different trading styles
Customizable thresholds: Adjust sensitivity based on asset volatility
Visual alerts: Color-coded labels and table for quick assessment
Risk categorization: Clear severity levels for position sizing

Crypto ETFs AUM📘 Description: BTC ETFs AUM Tracker
This indicator tracks the Assets Under Management (AUM) and daily inflows/outflows of the main U.S.-listed Bitcoin ETFs, allowing you to visualize institutional capital movement into Bitcoin products over time. It helps traders correlate institutional capital movement with Bitcoin price behavior.
🧩 Overview
The script adds up the daily AUM changes from selected Bitcoin ETFs to estimate the total net inflow/outflow of capital into spot BTC funds. It also accumulates those flows over time to display the total aggregated AUM balance, giving you a clearer sense of market direction and institutional sentiment. Two display modes are available: Balance view: plots the cumulative sum of net inflows (total ETF AUM). Inflows view: shows daily inflows (green) and outflows (red) as histogram columns, together with a smoothed moving average line.
⚙️ Inputs
Explained Base Settings Base Multiplier (base_multi) – Scaling factor applied to all AUM values. Leave at 1 for USD units, or adjust to display values in millions (1e6) or billions (1e9). Smoothing (c_smoothing) – Period length for the simple moving average used to calculate the smoothed mean inflow/outflow line. Show Balance (showBalance) – When enabled, displays the total cumulative AUM balance (sum of all net inflows over time). Show Inflows (showInflows) – When enabled, displays the daily inflows/outflows as colored columns. ETF Selection You can toggle which ETFs are included in the calculation:
BIT (BlackRock)
GBTC (Grayscale)
FBTC (Fidelity)
ARKB (ARK/21Shares)
BITB (Bitwise)
EZBC (Franklin Templeton)
BTCW (WisdomTree)
BTCO (Invesco Galaxy)
BRRR (Valkyrie)
HODL (VanEck)
Each switch determines whether the ETF’s AUM and daily flow data are included in the total calculation.
📊 Displayed Values Green Columns → Positive daily net inflows (AUM increased). Red Columns → Negative daily net outflows (AUM decreased). Orange Line → Smoothed moving average of net flows, used to identify persistent inflow/outflow trends. Blue Line (if enabled) → Total cumulative AUM balance (sum of all historical flows).
💡 Usage Notes Works best on daily timeframe, since ETF data is typically updated once per trading day. Not all ETFs have identical data history; missing data points are automatically skipped. The indicator doesn’t represent official fund NAV or guarantee data accuracy — it visualizes TradingView’s public financial feed. You can combine this tool with price action or on-chain metrics to analyze institutional Bitcoin flows.
Note: Some ETF data may not be available to all users depending on their TradingView data subscription or market access. Missing values are automatically skipped.
🧠 Disclaimer This script is for educational and analytical purposes only. It is not financial advice, and no investment decisions should be based solely on this indicator. Data accuracy depends on TradingView’s financial data sources and exchange reporting frequency.

Crypto Exchange PremiumDescription: Crypto Exchange Premium
The Crypto Exchange Premium indicator is designed to quantify and visualize price disparities between different types of crypto markets — specifically between spot and perpetual futures markets, or between any two customizable sources of price data. By consolidating live data from multiple major exchanges, it creates a unified, cross-market measure of premium (or discount), helping traders identify institutional activity (i. e. by comparing exchanges with high institutional activity against others), arbitrage opportunities, and shifts in market sentiment before they become visible in price action alone.
Concept and Purpose
In cryptocurrency markets, price divergence between spot and perpetual pairs reflects the real-time interaction of demand and liquidity across market segments.
When perpetual prices trade above spot, it implies aggressive long positioning or bullish leverage (positive funding expectations).
Conversely, when spot trades above perps, it may reflect net selling pressure in futures or strong spot accumulation.
Unlike most tools that rely on funding rates or open interest alone, this indicator measures the actual traded price spread dynamically across exchanges. This allows traders to visualize the “premium curve” of the crypto market in a clear, data-driven format.
How It Works
The indicator aggregates real-time prices from a wide selection of exchanges, normalizes them into groups, and computes the difference (“premium”) between two chosen reference markets.
1. Exchange Aggregation:
Users can toggle individual exchanges for both spot and perpetual aggregation groups.
The script automatically calculates group averages by dividing the sum of all enabled exchange prices by the number of valid feeds.
Non-USD exchanges (e.g., KRW pairs on Upbit or Bithumb) are automatically converted into USD using live FX data (USDKRW) for accurate normalization.
2. Flexible Comparison Logic:
Each leg of the comparison (First vs. Second Source) can be chosen as one of:
Local chart symbol
Custom symbol
Aggregated Spot group
Aggregated Perpetual group
This allows users to compare, for example:
Binance Spot vs. Global Perp Average
Coinbase Spot vs. Binance Perp
BTCUSD vs. BTCUSDT.P (or any cross-exchange combination)
3. Premium Calculation:
The final value is computed as:
Premium = First Source Price − Second Source Price
and is plotted as a histogram (positive = green, negative = red). This visual instantly shows whether the first source trades at a premium or discount relative to the second.
How to Use
Select Data Sources:
Configure the “First Symbol” and “Second Symbol” in the settings. For most use cases:
First Symbol → Perps (Aggregated)
Second Symbol → Spot (Aggregated)
Adjust Exchange Selection:
Enable or disable individual exchanges to fine-tune your data set. For instance, disabling Korean exchanges filters out regional FX distortions.
Originality and Value
While many exchange difference or “premium indicators” track one or two exchanges, this script introduces multi-exchange aggregation, cross-market normalization, and user-configurable pairing, resulting in a more holistic and accurate reflection of market structure.
It bridges a gap between macro market breadth and microstructural price dynamics, empowering traders to:
Detect arbitrage inefficiencies between spot and perps.
Track regional price dislocations (USD vs. KRW).
Gauge the intensity of speculative leverage over time.
Anticipate funding rate shifts and liquidation clusters before they happen.

Crypto Perp Calc v1Advanced Perpetual Position Calculator for TradingView
Description
A comprehensive position sizing and risk management tool designed specifically for perpetual futures trading. This indicator eliminates the confusion of calculating leveraged positions by providing real-time position metrics directly on your chart.
Key Features:
Interactive Price Selection: Click directly on chart to set entry, stop loss, and take profit levels
Accurate Lot Size Calculation: Instantly calculates the exact position size needed for your margin and leverage
Multiple Entry Support: DCA into positions with up to 3 entry points with customizable allocation
Multiple Take Profit Levels: Scale out of positions with up to 3 TP targets
Comprehensive Risk Metrics: Shows dollar P&L, account risk percentage, and liquidation price
Visual Risk/Reward: Color-coded boxes and lines display your trade setup clearly
Real-time Info Table: All critical position data in one organized panel
Perfect for traders using perpetual futures who need precise position sizing with leverage.
---------
How to Use
Quick Start (3 Clicks)
1. Add the indicator to your chart
2. Click three times when prompted:
First click: Set your entry price
Second click: Set your stop loss
Third click: Set your take profit
3. Read the TOTAL LOTS value from the info table (highlighted in yellow)
4. Use this lot size in your exchange when placing the trade
Detailed Setup
Step 1: Configure Your Account
Enter your account balance (total USDT in account)
Set your margin amount (how much USDT to risk on this trade)
Choose your leverage (1x to 125x)
Select Long or Short position
Step 2: Set Price Levels
Main levels use interactive clicking (Entry, SL, TP)
For multiple entries or TPs, use the settings panel to manually input prices and percentages
Step 3: Read the Results
The info table shows:
TOTAL LOTS - The position size to enter on your exchange
Margin Used - Your actual capital at risk
Notional - Total position value (margin × leverage)
Max Risk - Dollar amount you'll lose at stop loss
Total Profit - Dollar amount you'll gain at take profit
R:R Ratio - Risk to reward ratio
Account Risk - Percentage of account at risk
Liquidation - Price where position gets liquidated
Step 4: Advanced Features (Optional)
Multiple Entries (DCA):
Enable "Use Multiple Entries"
Set up to 3 entry prices
Allocate percentage for each (must total 100%)
See individual lot sizes for each entry
Multiple Take Profits:
Enable "Use Multiple TPs"
Set up to 3 TP levels
Allocate percentage to close at each level (must total 100%)
View profit at each target
Visual Elements
Blue lines/labels: Entry points
Red lines/labels: Stop loss
Green lines/labels: Take profit targets
Colored boxes: Visual risk (red) and reward (green) zones
Info table: Can be positioned anywhere on screen
Alerts
Set price alerts for:
Entry zones reached
Stop loss approached
Take profit levels hit
Works with TradingView's alert system
Tips for Best Results
Always verify the lot size matches your intended risk
Check the liquidation price stays far from your stop loss
Monitor the account risk percentage (recommended: keep under 2-3%)
Use the warning indicators if risk exceeds margin
For quick trades, use single entry/TP; for complex strategies, use multiple levels
Example Workflow
Find your trade setup using your analysis
Add this indicator and click to set levels
Check risk metrics in the table
Copy the TOTAL LOTS value
Enter this exact position size on your exchange
Set alerts for key levels if desired
This tool bridges the gap between TradingView charting and exchange execution, ensuring your position sizing is always accurate when trading with leverage.
Disclaimer, this was coded with help of AI, double check calculations if they are off.

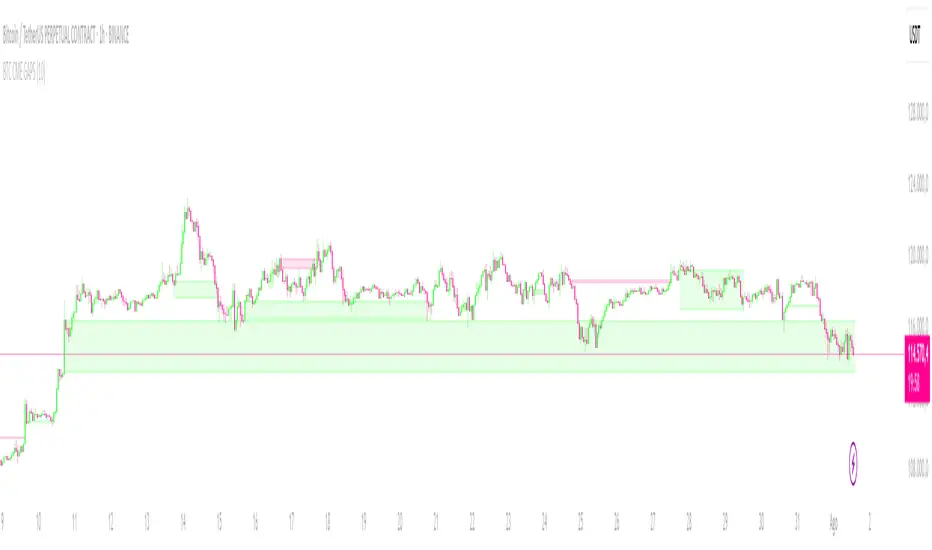
CRYPTO CME GAPS- Can be used in any crypto symbol of any exchange, (not necessarily the CME exchange)
- Displays the CME gaps with the colors green or red depending on the sentiment of the gap
- Extends the gaps displayed until they are filled.
- In the end of the code there are the boolean values 'filled_bull' and 'filled_bear' that can be used to create a strategy script.
Crypto Breadth | AlphaNatt\ Crypto Breadth | AlphaNatt\
A dynamic, visually modern market breadth indicator designed to track the strength of the top 40 cryptocurrencies by measuring how many are trading above their respective 50-day moving averages. Built with precision, branding consistency, and UI enhancements for fast interpretation.
\ 📊 What This Script Does\
* Aggregates the performance of \ 40 major cryptocurrencies\ on Binance
* Calculates a \ breadth score (0.00–1.00)\ based on how many tokens are above their moving averages
* Smooths the breadth with optional averaging
* Displays the result as a \ dynamic, color-coded line\ with aesthetic glow and gradient fill
* Provides automatic \ background zones\ for extreme bullish/bearish conditions
* Includes \ alerts\ for key threshold crossovers
* Highlights current values in an \ information panel\
\ 🧠 How It Works\
* Pulls real-time `close` prices for 40 coins (e.g., XRP, BNB, SOL, DOGE, PEPE, RENDER, etc.)
* Compares each coin's price to its 50-day SMA (adjustable)
* Assigns a binary score:
• 1 if the coin is above its MA
• 0 if it’s below
* Aggregates all results and divides by 40 to produce a normalized \ breadth percentage\
\ 🎨 Visual Design Features\
* Smooth blue-to-pink \ color gradient\ matching the AlphaNatt brand
* Soft \ glow effects\ on the main line for enhanced legibility
* Beautiful \ multi-stop fill gradient\ with 16 transition zones
* Optional \ background shading\ when extreme sentiment is detected:
• Bullish zone if breadth > 80%
• Bearish zone if breadth < 20%
\ ⚙️ User Inputs\
* \ Moving Average Length\ – Number of periods to calculate each coin’s SMA
* \ Smoothing Length\ – Smooths the final breadth value
* \ Show Background Zones\ – Toggle extreme sentiment overlays
* \ Show Gradient Fill\ – Toggle the modern multicolor area fill
\ 🛠️ Utility Table (Top Right)\
* Displays live breadth percentage
* Shows how many coins (e.g., 27/40) are currently above their MA
\ 🔔 Alerts Included\
* \ Breadth crosses above 50%\ → Bullish signal
* \ Breadth crosses below 50%\ → Bearish signal
* \ Breadth > 80%\ → Strong bullish trend
* \ Breadth < 20%\ → Strong bearish trend
\ 📈 Best Used For\
* Gauging overall market strength or weakness
* Timing trend transitions in the crypto market
* Confirming trend-based strategies with broad market support
* Visual dashboard in macro dashboards or strategy overlays
\ ✅ Designed For\
* Swing traders
* Quantitative investors
* Market structure analysts
* Anyone seeking a macro view of crypto performance
Note: Not financial advise

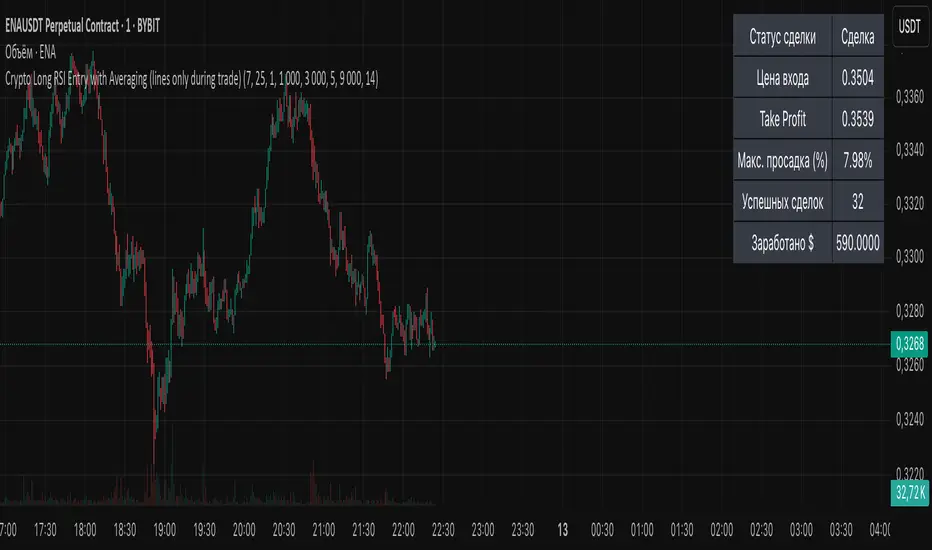
Crypto Long RSI Entry with AveragingIndicator Name:
04 - Crypto Long RSI Entry with Averaging + Info Table + Lines (03 style lines)
Description:
This indicator is designed for crypto trading on the long side only, using RSI-based entry signals combined with a multi-step averaging strategy and a visual information panel. It aims to capture price rebounds from oversold RSI levels and manage position entries with two staged averaging points, optimizing the average entry price and take-profit targets.
Key Features:
RSI-Based Entry: Enters a long position when the RSI crosses above a defined oversold level (default 25), with an optional faster entry if RSI crosses above 20 after being below it.
Two-Stage Averaging: Allows up to two averaging entries at user-defined price drop percentages (default 5% and 14%), increasing position size to improve average entry price.
Dynamic Take Profit: Adjusts take profit targets after each averaging stage, with customizable percentage levels.
Visual Signals: Marks entries, averaging points, and exits on the chart using colored labels and lines for easy tracking.
Info Table: Displays current trade status, averaging stages, total profit, number of wins, and maximum drawdown percentage in a table on the chart.
Graphical Lines: Shows horizontal lines for entry price, take profit, and averaging prices to visually track trade management.
Crypto Portfolio vs BTC – Custom Blend TrackerThis tool tracks the performance of a custom-weighted crypto portfolio (SUI, BTC, SOL, DEEP, DOGE, LOFI, and Other) against BTC. Simply input your start date to anchor performance and compare your basket’s relative strength over time. Ideal for portfolio benchmarking, alt-season tracking, or macro trend validation.
Supports all timeframes. Based on BTC-relative returns (not USD). Open-source and customizable.

Crypto EMA TableCrypto EMA Trend Scanner
A powerful tool for crypto traders to quickly identify trend strength across multiple timeframes
This indicator helps you spot potential trading opportunities by analyzing the EMA (Exponential Moving Average) alignment across four different timeframes. It displays a clean, color-coded table showing which cryptocurrencies are in a strong uptrend.
Key Features:
Multi-Timeframe Analysis: Simultaneously scan 3-minute, 15-minute, 1-hour, and 4-hour charts
Clear Visual Signals: Green cells indicate bullish EMA alignment (EMA 20 > EMA 50 > EMA 200)
Customizable Symbols: Track up to 3 different cryptocurrencies of your choice
Exchange Selection: Compatible with major exchanges (Bybit, Binance, Coinbase, Kraken, KuCoin, FTX)
Flexible Positioning: Place the table anywhere on your chart
How to Use:
Add the indicator to your chart
Select your preferred cryptocurrencies in the settings
Position the table where you want it
Look for green cells indicating EMA lineup.
Use this information to identify potential entry points or confirm your trading bias

Crypto Market Session Guide with Local TimeMaster the Markets with the Ultimate Trading Session Indicator
Timing is everything in trading. Knowing when liquidity is at its peak and when market sessions overlap can make all the difference in your strategy. This Market Session Guide Indicator helps you navigate the trading day with real-time session tracking, countdown timers, and local time adjustments—giving you a clear edge in the market.
Key Features
Live Session Tracking – Instantly see which trading session is active: Asian, European, US, or the high-volatility EU-US overlap.
Automatic Local Time Conversion – No need to convert UTC manually—session times adjust automatically based on your TradingView exchange settings.
Daylight Saving Time Adjustments – The US market opening and closing times are automatically adjusted for summer and winter shifts.
Countdown Timer for Session Close – Know exactly when the current session will end so you can time your trades effectively.
Next Market Opening Display – Always be prepared by knowing which market opens next and at what exact time in your local timezone.
Clear Visual Guide – A structured table in the top-right of your chart provides all essential session details without cluttering your screen.
How It Works
This indicator tracks the three main trading sessions:
Asian Session (Tokyo, Sydney): 00:00 - 09:00 UTC
European Session (London, Frankfurt): 07:00 - 16:00 UTC
US Session (New York, Chicago): 13:30 - 22:00 UTC (adjusts automatically for Daylight Saving Time)
EU-US Overlap: 12:00 - 16:00 UTC, the most volatile period of the trading day
It also highlights when a session is about to close and when the next one will begin, ensuring you are always aware of liquidity shifts in the market.
Why You Need This Indicator
Optimized for Forex, Crypto, and Indices – Helps traders align their strategies with the most active market hours.
Ideal for Scalping and Day Trading – Enter trades during peak volatility to maximize opportunities.
Eliminates Guesswork – Stop manually tracking time zones and market schedules—everything updates dynamically for you.
Upgrade Your Trading Strategy Today
This indicator simplifies market timing, ensuring you're always trading when liquidity and volatility are at their highest. Whether you're trading Forex, Crypto, or Stocks, knowing when markets open and close is essential for making informed decisions.
Try it out, and if you find it useful, consider sharing it with other traders. Your feedback is always welcome!
Crypto Scanner v4This guide explains a version 6 Pine Script that scans a user-provided list of cryptocurrency tokens to identify high probability tradable opportunities using several technical indicators. The script combines trend, momentum, and volume-based analyses to generate potential buying or selling signals, and it displays the results in a neatly formatted table with alerts for trading setups. Below is a detailed walkthrough of the script’s design, how traders can interpret its outputs, and recommendations for optimizing indicator inputs across different timeframes.
## Overview and Key Components
The script is designed to help traders assess multiple tokens by calculating several indicators for each one. The key components include:
- **Input Settings:**
- A comma-separated list of symbols to scan.
- Adjustable parameters for technical indicators such as ADX, RSI, MFI, and a custom Wave Trend indicator.
- Options to enable alerts and set update frequencies.
- **Indicator Calculations:**
- **ADX (Average Directional Index):** Measures trend strength. A value above the provided threshold indicates a strong trend, which is essential for validating momentum before entering a trade.
- **RSI (Relative Strength Index):** Helps determine overbought or oversold conditions. When the RSI is below the oversold level, it may present a buying opportunity, while an overbought condition (not explicitly part of this setup) could suggest selling.
- **MFI (Money Flow Index):** Similar in concept to RSI but incorporates volume, thus assessing buying and selling pressure. Values below the designated oversold threshold indicate potential undervaluation.
- **Wave Trend:** A custom indicator that calculates two components (WT1 and WT2); a crossover where WT1 moves from below to above WT2 (particularly near oversold levels) may signal a reversal and a potential entry point.
- **Scanning and Trading Zone:**
- The script identifies a *bullish setup* when the following conditions are met for a token:
- ADX exceeds the threshold (strong trend).
- Both RSI and MFI are below their oversold levels (indicating potential buying opportunities).
- A Wave Trend crossover confirms near-term reversal dynamics.
- A *trading zone* condition is also defined by specific ranges for ADX, RSI, MFI, and a limited difference between WT1 and WT2. This zone suggests that the token might be in a consolidation phase where even small moves may be significant.
- **Alerts and Table Reporting:**
- A table is generated, with each row corresponding to a token. The table contains columns for the symbol, ADX, RSI, MFI, WT1, WT2, and the trading zone status.
- Visual cues—such as different background colors—highlight tokens with a bullish setup or that are within the trading zone.
- Alerts are issued based on the detection of a bullish setup or entry into a trading zone. These alerts are limited per bar to avoid flooding the trader with notifications.
## How to Interpret the Indicator Outputs
Traders should use the indicator values as guidance, verifying them against their own analysis before making any trading decision. Here’s how to assess each output:
- **ADX:**
- **High values (above threshold):** Indicate strong trends. If other indicators confirm an oversold condition, a trader may consider a long position for a corrective reversal.
- **Low values:** Suggest that the market is not trending strongly, and caution should be taken when considering entry.
- **RSI and MFI:**
- **Below oversold levels:** These conditions are traditionally seen as signals that an asset is undervalued, potentially triggering a bounce.
- **Above typical resistance levels (not explicitly used here):** Would normally caution a trader against entering a long position.
- **Wave Trend (WT1 and WT2):**
- A crossover where WT1 moves upward above WT2 in an oversold environment can signal the beginning of a recovery or reversal, thereby reinforcing buy signals.
- **Trading Zone:**
- Being “in zone” means that the asset’s current values for ADX, RSI, MFI, and the closeness of the Wave Trend lines indicate a period of consolidation. This scenario might be suitable for both short-term scalping or as an early exit indicator, depending on further market analysis.
## Timeframe Optimization Input Table
Traders can optimize indicator inputs depending on the timeframe they use. The following table provides a set of recommended input values for various timeframes. These values are suggestions and should be adjusted based on market conditions and individual trading styles.
Timeframe ADX RSI MFI ADX RSI MFI WT Channel WT Average
5-min 10 10 10 20 30 20 7 15
15-min 12 12 12 22 30 20 9 18
1-hour 14 14 14 25 30 20 10 21
4-hour 16 16 16 27 30 20 12 24
1-day 18 18 18 30 30 20 14 28
Adjust these parameters directly in the script’s input settings to match the selected timeframe. For shorter timeframes (e.g., 5-min or 15-min), the shorter lengths help filter high-frequency noise. For longer timeframes (e.g., 1-day), longer input values may reduce false signals and capture more significant trends.
## Best Practices and Usage Tips
- **Token Limit:**
- Limit the number of tokens scanned to 10 per query line. If you need to scan more tokens, initiate a new query line. This helps manage screen real estate and ensures the table remains legible.
- **Confirming Signals:**
- Use this script as a starting point for identifying high potential trades. Each indicator’s output should be used to confirm your trading decision. Always cross-reference with additional technical analysis tools or market context.
- **Regular Review:**
- Since the script updates the table every few bars (as defined by the update frequency), review the table and alerts regularly. Market conditions change rapidly, so timely decisions are crucial.
## Conclusion
This Pine Script provides a comprehensive approach for scanning multiple cryptocurrencies using a combination of trend strength (ADX), momentum (RSI and MFI), and reversal signals (Wave Trend). By using the provided recommendation table for different timeframes and limiting the tokens to 20 per query line (with a maximum of four query lines), traders can streamline their scanning process and more effectively identify high probability tradable tokens. Ultimately, the outputs should be critically evaluated and combined with additional market research before executing any trades.

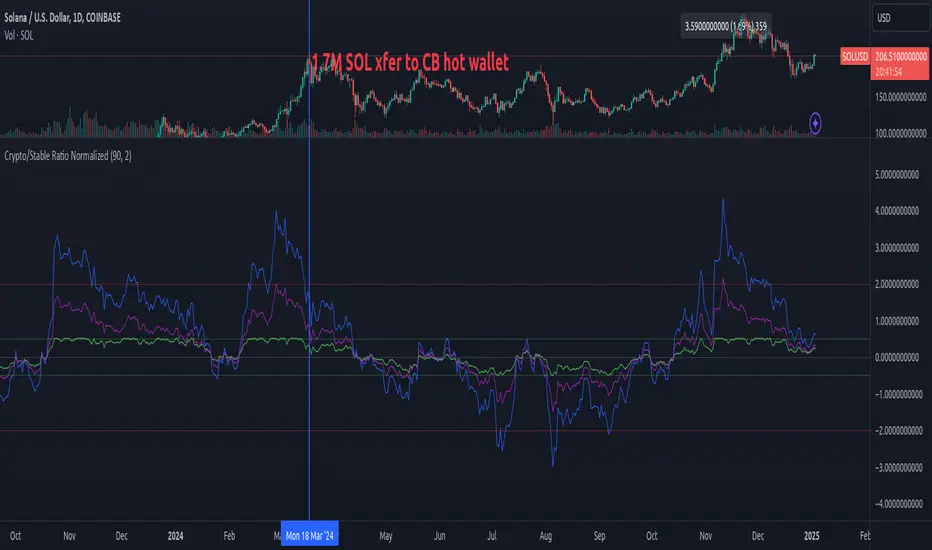
Crypto/Stable Mcap Ratio NormalizedCreate a normalized ratio of total crypto market cap to stablecoin supply (USDT + USDC + DAI). Idea is to create a reference point for the total market cap's position, relative to total "dollars" in the crypto ecosystem. It's an imperfect metric, but potentially helpful. V0.1.
This script provides four different normalization methods:
Z-Score Normalization:
Shows how many standard deviations the ratio is from its mean
Good for identifying extreme values
Mean-reverting properties
Min-Max Normalization:
Scales values between 0 and 1
Good for relative position within recent range
More sensitive to recent changes
Percent of All-Time Range:
Shows where current ratio is relative to all-time highs/lows
Good for historical context
Less sensitive to recent changes
Bollinger Band Position:
Similar to z-score but with adjustable sensitivity
Good for trading signals
Can be tuned via standard deviation multiplier
Features:
Adjustable lookback period
Reference bands for overbought/oversold levels
Built-in alerts for extreme values
Color-coded plots for easy visualization
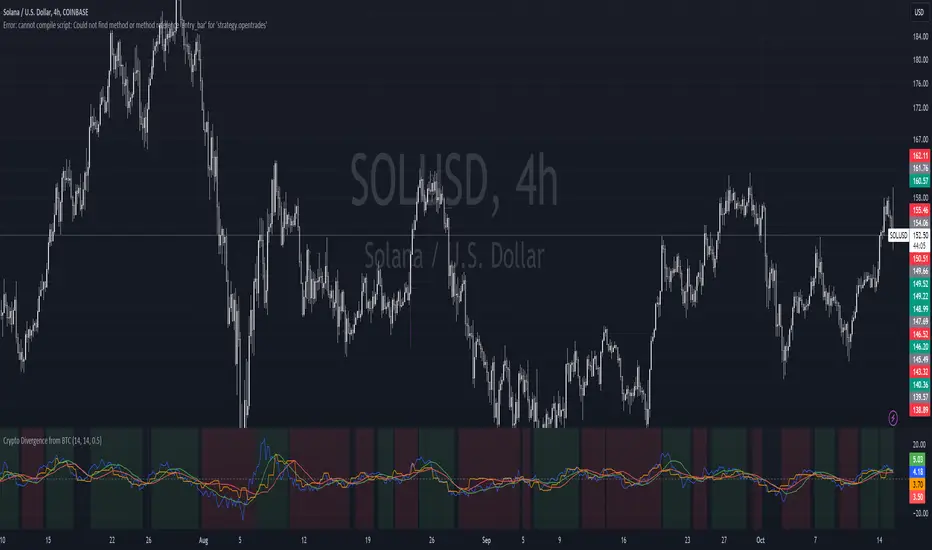
Crypto Divergence from BTCThis script is used to indicate when price action of a crypto coin is diverging significantly from that of BTC.
Explanation of the Script:
Inputs:
roc_length: The period used for calculating the Rate of Change.
ma_length: The period used for the moving average of the ROC.
threshold: The percentage difference that indicates a divergence.
Price Data:
The script retrieves the current asset's price and Bitcoin's price.
ROC Calculation:
The ROC for both the current asset and BTC is calculated based on the defined roc_length.
Moving Averages:
Simple moving averages (SMA) of the ROC values are calculated to smooth out the data.
Divergence Detection:
The indicator checks if the current asset's ROC MA is significantly higher or lower than Bitcoin's ROC MA based on the specified threshold.
Plotting:
The script plots the ROC values and their moving averages.
It also highlights the background in green when a bullish divergence is detected (when the asset is moving up while BTC is lagging) and in red for a bearish divergence.
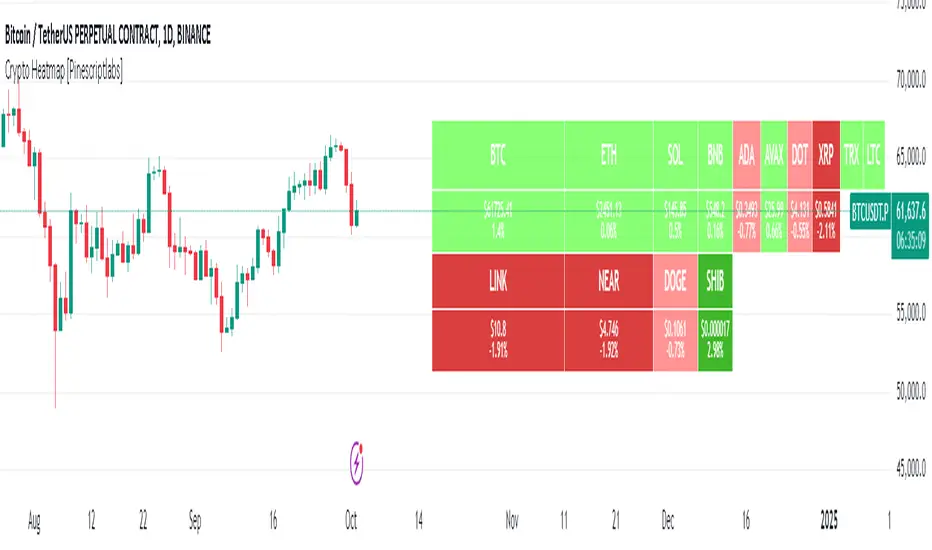
Crypto Heatmap [Pinescriptlabs]🌟 Crypto Heatmap is a visual tool that enables quick and efficient visualization of price behavior and percentage changes of various cryptocurrencies.
📊 It generates a heatmap to show variations in daily closing prices, helping traders quickly identify assets with the most movement.
📈 Percentage Change Calculation: It calculates the difference between the current price and the previous day's price, updating with each ticker.
✨ It uses a dynamic approach that adjusts colors based on market movements, making it easier to detect trading opportunities.
👀 You will notice for a moment that some cells disappear; this is because the table updates with each ticker to show real-time changes.
Español:
🌟 Crypto Heatmap es una herramienta visual que permite una rápida y eficiente visualización del comportamiento de precios y cambios porcentuales de varias criptomonedas.
📊 Genera un mapa de calor para mostrar las variaciones en los precios de cierre diario, ayudando a los traders a identificar rápidamente los activos con mayor movimiento.
📈 Cálculo del cambio porcentual: Calcula la diferencia entre el precio actual y el del día anterior, actualizándose en cada ticker.
✨ Utiliza un enfoque dinámico que ajusta los colores según los movimientos del mercado, facilitando la detección de oportunidades de trading.
Aquí tienes la traducción al español:
👀 **Observarás por un momento que algunas celdas desaparecen; esto es porque la tabla se actualiza en cada ticker para mostrar el cambio en tiempo real.**
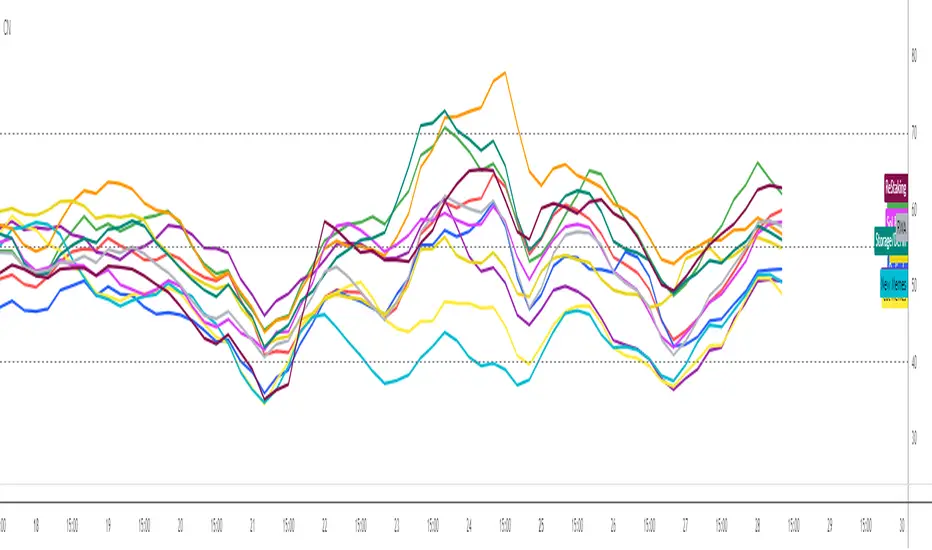
Crypto Narratives: Relative StrengthThis indicator offers a unique perspective on the crypto market by focusing on the relative strength of different narratives. It aggregates RSI data from multiple tokens associated with each narrative, providing a comprehensive view of the sentiment and momentum behind these themes. You can use it to take profit, find W bottoms or M tops to enter and exit narratives. and generally see what hot at the moment with lots of pretty colours.
This indicator tracks the relative strength of various crypto narratives using the Relative Strength Index (RSI) of representative tokens. It allows users to gauge the momentum and sentiment behind different themes in the cryptocurrency market.
Functionality:
The indicator calculates the average RSI values for the current leading tokens associated with ten different crypto narratives:
- AI (Artificial Intelligence)
- Ordinals
- DeFi (Decentralized Finance)
- Memes
- Gaming
- Level 1 (Layer 1 Protocols)
- Sol Betas (Solana Ecosystem)
- Storage/DePin
- RWA (Real-World Assets)
- ReStaking
he average RSI values for each narrative are calculated by summing the RSI values of the associated tokens and dividing by the number of tokens. The indicator plots the 3-period simple moving average (SMA) of each narrative's RSI using different colors and line styles.
Users can customize the RSI length, line width, and label offset through the input options. If the "Show Labels" option is enabled, the indicator displays labels for each narrative's RSI value on the most recent bar.
The indicator also includes horizontal lines representing overbought and oversold levels, which can be adjusted through the input options. Alerts are triggered when a narrative's RSI crosses above the overbought level or below the oversold level. The alerts include the narrative name, RSI value, and a suggestion to consider selling or buying.
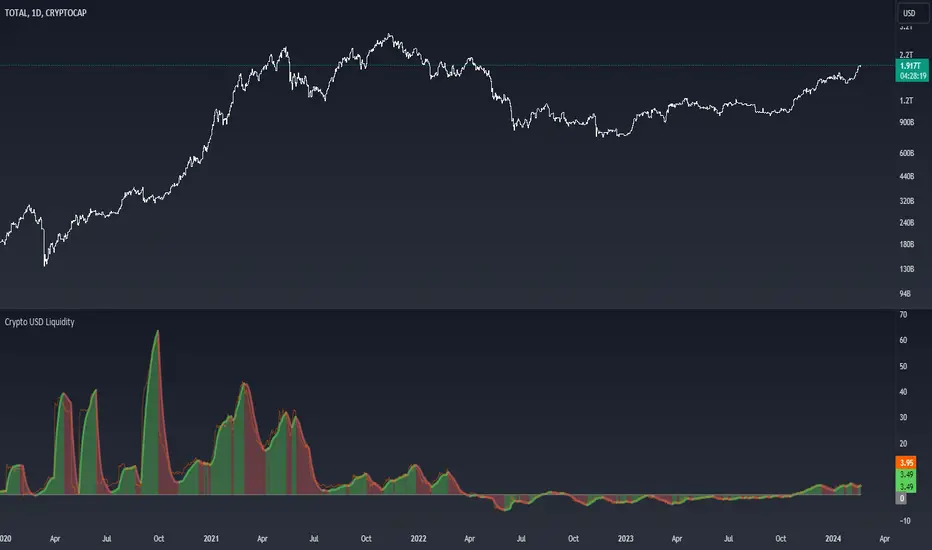
Crypto USD LiquidityThe "Crypto USD Liquidity " indicator is designed to offer a comprehensive analysis of liquidity dynamics within the cryptocurrency market, specifically focusing on various stablecoins. This versatile tool allows users to tailor their analysis by adjusting key parameters such as the Rate of Change (ROC) length and the smoothing rate.
The indicator incorporates a user-friendly interface with options to selectively display the supply data for major stablecoins, including USDT, BUSD, USDC, DAI, and TUSD . Users can toggle these options to observe and compare the liquidity trends of different stablecoin assets.
The total liquidity is computed as the summation of the selected stablecoin supplies, providing a holistic view of the overall crypto market liquidity. The Rate of Change (ROC) and its smoothing are then applied to the aggregated liquidity data. This process helps users identify trends and potential turning points in the liquidity landscape.
The visual representation on the chart includes a color-coded display: positive changing ROC values are shaded in green, indicating potential increases in liquidity, while negative values are shaded in red, suggesting potential decreases. This color scheme enhances the user's ability to quickly interpret the changing dynamics of stablecoin liquidity.
Moreover, the script includes a Zero Line for reference and overlays the raw ROC values for additional insight. The resulting chart not only serves as a powerful analytical tool for traders and investors but also contributes to a deeper understanding of the nuanced movements within the broader cryptocurrency market.
In summary, the "Crypto USD Liquidity" Pine Script indicator empowers users with a customizable and visually informative tool for analyzing and interpreting the complex dynamics of stablecoin liquidity, facilitating more informed decision-making in the realm of cryptocurrency trading and investment.
Crypto Candlestick Patterns - CN VersionIntroduction:
The candlestick chart has been used for centuries since the Japanese applications. Based on the candlestick charting, people developed candle pattern analysis. Now we have tons of books or articles illustrating the usage of reversal patterns and continuation patterns, and computers provide a faster and preciser way to recognize these pattern.
Originally we have a common *All Candlestick Patterns* indicator to use. This indicator works well for most of the markets or commodities including stocks and futures. However, for cryptocurrency market, quite a few patterns are not suitable anymore. For example, crypto markets are continuously running 7x24hrs and the big coins with good volume tend to have almost continuous price in commonly used time periods. Hence, original patterns with "window" or "jump" concepts are usually not applied to crypto.
For these issues, I modified the original *All Candlestick Patterns* indicator and introduced the Chinese version for people speaking such language.
Like most of the other indicators, I personally do not recommend anyone to simply follow the patterns it shows to enter the market. You may take these recognized patterns as a reference, and further actions on trading should be done with several other tools, such as MACD, RSI, Stochastic and etc.
Usage:
The application of this indicator is basically the same as the original *All Candlestick Patterns* and you will get an automatically generated pattern recognition by your computer system.
There are a few parameters to adjust for the indicator:
Trending Detection Settings: Here you can choose SMA-Fast, SMA-Fast/Slow or None detecting options to recognize the current market trend. This is a minor improvement from the original indicator and you can choose your preferred trending detecting settings by changing the length of SMA.
Candlestick Settings: You may adjust the rules to recognize the properties of candlesticks. I add a "perturbation" parameter here, which actually is an error tolerance for pattern recognition. Some seemingly pattern may not fulfill the strict rules of classic candlestick patterns, but we may recognize them by watch the charting on our own. Hence this error tolerance may show more potential patterns from the charting.
Plot Settings: It is the usually colour choice and providing options for bullish/bearish.
Pattern Settings: Here you can select the patterns that you would like to see from the charting. You can pick the preferred reversal patterns or choose to show all the patterns. It's all up to you!
Features:
Language Translation: Since this is a Chinese language version. I have replaced all the English explanation of patterns to Chinese ones. Move your mouse to the label, you will find a brief intro of the pattern and a notice about bullish or bearish signals it indicates.
Alerts: As the same as the original one, we will have the alert options from this indicator. All the alerts and their messages are Chinese. You can activate alerts based on this indicator from the alert management section, as the same as many other indicators you have used before.
Future Improvements:
For now I am satisfied with the work I have done, and I may apply it to several charts. It's welcome for any users to take a look at the codes and put modifications or improvements towards it. Currently most of the comments in the code are in Chinese language, since basically it's for Chinese speaking users, while the code itself and the parameter names should be pretty easy to understand in English. (I have been using English for writing in the past 8 years, hence this introduction is in English as well.)
