[blackcat] L3 Counter Peacock Spread█ OVERVIEW
The script titled " L3 Counter Peacock Spread" is an indicator designed for use in TradingView. It calculates and plots various moving averages, K lines derived from these moving averages, additional simple moving averages (SMAs), weighted moving averages (WMAs), and other technical indicators like slope calculations. The primary function of the script is to provide a comprehensive set of visual tools that traders can use to identify trends, potential support/resistance levels, and crossover signals.
█ LOGICAL FRAMEWORK
Input Parameters:
There are no explicit input parameters defined; all variables are hardcoded or calculated within the script.
Calculations:
• Moving Averages: Calculates Simple Moving Averages (SMA) using ta.sma.
• Slope Calculation: Computes the slope of a given series over a specified period using linear regression (ta.linreg).
• K Lines: Defines multiple exponentially adjusted SMAs based on a 30-period MA and a 1-period MA.
• Weighted Moving Average (WMA): Custom function to compute WMAs by iterating through price data points.
• Other Indicators: Includes Exponential Moving Average (EMA) for momentum calculation.
Plotting:
Various elements such as MAs, K lines, conditional bands, additional SMAs, and WMAs are plotted on the chart overlaying the main price action.
No loops control the behavior beyond those used in custom functions for calculating WMAs. Conditional statements determine the coloring of certain plot lines based on specific criteria.
█ CUSTOM FUNCTIONS
calculate_slope(src, length) :
• Purpose: To calculate the slope of a time-series data point over a specified number of periods.
• Functionality: Uses linear regression to find the current and previous slopes and computes their difference scaled by the timeframe multiplier.
• Parameters:
– src: Source of the input data (e.g., closing prices).
– length: Periodicity of the linreg calculation.
• Return Value: Computed slope value.
calculate_ma(source, length) :
• Purpose: To calculate the Simple Moving Average (SMA) of a given source over a specified period.
• Functionality: Utilizes TradingView’s built-in ta.sma function.
• Parameters:
– source: Input data series (e.g., closing prices).
– length: Number of bars considered for the SMA calculation.
• Return Value: Calculated SMA value.
calculate_k_lines(ma30, ma1) :
• Purpose: Generates multiple exponentially adjusted versions of a 30-period MA relative to a 1-period MA.
• Functionality: Multiplies the 30-period MA by coefficients ranging from 1.1 to 3 and subtracts multiples of the 1-period MA accordingly.
• Parameters:
– ma30: 30-period Simple Moving Average.
– ma1: 1-period Simple Moving Average.
• Return Value: Returns an array containing ten different \u2003\u2022 "K line" values.
calculate_wma(source, length) :
• Purpose: Computes the Weighted Moving Average (WMA) of a provided series over a defined period.
• Functionality: Iterates backward through the last 'n' bars, weights each bar according to its position, sums them up, and divides by the total weight.
• Parameters:
– source: Price series to average.
– length: Length of the lookback window.
• Return Value: Calculated WMA value.
█ KEY POINTS AND TECHNIQUES
• Advanced Pine Script Features: Utilization of custom functions for encapsulating complex logic, leveraging TradingView’s library functions (ta.sma, ta.linreg, ta.ema) for efficient computations.
• Optimization Techniques: Efficient computation of K lines via pre-calculated components (multiples of MA30 and MA1). Use of arrays to store intermediate results which simplifies plotting.
• Best Practices: Clear separation between calculation and visualization sections enhances readability and maintainability. Usage of color.new() allows dynamic adjustments without hardcoding colors directly into plot commands.
• Unique Approaches: Introduction of K lines provides an alternative representation of trend strength compared to traditional MAs. Implementation of conditional band coloring adds real-time context to existing visual cues.
█ EXTENDED KNOWLEDGE AND APPLICATIONS
Potential Modifications/Extensions:
• Adding more user-defined inputs for lengths of MAs, K lines, etc., would make the script more flexible.
• Incorporating alert conditions based on crossovers between key lines could enhance automated trading strategies.
Application Scenarios:
• Useful for both intraday and swing trading due to the combination of short-term and long-term MAs along with trend analysis via slopes and K lines.
• Can be integrated into larger systems combining this indicator with others like oscillators or volume-based metrics.
Related Concepts:
• Understanding how linear regression works internally aids in grasping the slope calculation.
• Familiarity with WMA versus SMA helps appreciate why different types of averaging might be necessary depending on market dynamics.
• Knowledge of candlestick patterns can complement insights gained from this indicator.
"crossover债券是什么" için komut dosyalarını ara

IU EMA Channel StrategyIU EMA Channel Strategy
Overview:
The IU EMA Channel Strategy is a simple yet effective trend-following strategy that uses two Exponential Moving Averages (EMAs) based on the high and low prices. It provides clear entry and exit signals by identifying price crossovers relative to the EMAs while incorporating a built-in Risk-to-Reward Ratio (RTR) for effective risk management.
Inputs ( Settings ):
- RTR (Risk-to-Reward Ratio): Define the ratio for risk-to-reward (default = 2).
- EMA Length: Adjust the length of the EMA channels (default = 100).
How the Strategy Works
1. EMA Channels:
- High-based EMA: EMA calculated on the high price.
- Low-based EMA: EMA calculated on the low price.
The area between these two EMAs creates a "channel" that visually highlights potential support and resistance zones.
2. Entry Rules:
- Long Entry: When the price closes above the high-based EMA (crossover).
- Short Entry: When the price closes below the low-based EMA (crossunder).
These entries ensure trades are taken in the direction of momentum.
3. Stop Loss (SL) and Take Profit (TP):
- Stop Loss:
- For long positions, the SL is set at the previous bar's low.
- For short positions, the SL is set at the previous bar's high.
- Take Profit:
- TP is automatically calculated using the Risk-to-Reward Ratio (RTR) you define.
- Example: If RTR = 2, the TP will be 2x the risk distance.
4. Exit Rules:
- Positions are closed at either the stop loss or the take profit level.
- The strategy manages exits automatically to enforce disciplined risk management.
Visual Features
1. EMA Channels:
- The high and low EMAs are dynamically color-coded:
- Green: Price is above the EMA (bullish condition).
- Red: Price is below the EMA (bearish condition).
- The area between the EMAs is shaded for better visual clarity.
2. Stop Loss and Take Profit Zones:
- SL and TP levels are plotted for both long and short positions.
- Zones are filled with:
- Red: Stop Loss area.
- Green: Take Profit area.
Be sure to manage your risk and position size properly.

3 EMA + RSI with Trail Stop [Free990] (LOW TF)This trading strategy combines three Exponential Moving Averages (EMAs) to identify trend direction, uses RSI to signal exit conditions, and applies both a fixed percentage stop-loss and a trailing stop for risk management. It aims to capture momentum when the faster EMAs cross the slower EMA, then uses RSI thresholds, time-based exits, and stops to close trades.
Short Explanation of the Logic
Trend Detection: When the 10 EMA crosses above the 20 EMA and both are above the 100 EMA (and the current price bar closes higher), it triggers a long entry signal. The reverse happens for a short (the 10 EMA crosses below the 20 EMA and both are below the 100 EMA).
RSI Exit: RSI crossing above a set threshold closes long trades; crossing below another threshold closes short trades.
Time-Based Exit: If a trade is in profit after a set number of bars, the strategy closes it.
Stop-Loss & Trailing Stop: A fixed stop-loss based on a percentage from the entry price guards against large drawdowns. A trailing stop dynamically tightens as the trade moves in favor, locking in potential gains.
Detailed Explanation of the Strategy Logic
Exponential Moving Average (EMA) Setup
Short EMA (out_a, length=10)
Medium EMA (out_b, length=20)
Long EMA (out_c, length=100)
The code calculates three separate EMAs to gauge short-term, medium-term, and longer-term trend behavior. By comparing their relative positions, the strategy infers whether the market is bullish (EMAs stacked positively) or bearish (EMAs stacked negatively).
Entry Conditions
Long Entry (entryLong): Occurs when:
The short EMA (10) crosses above the medium EMA (20).
Both EMAs (short and medium) are above the long EMA (100).
The current bar closes higher than it opened (close > open).
This suggests that momentum is shifting to the upside (short-term EMAs crossing up and price action turning bullish). If there’s an existing short position, it’s closed first before opening a new long.
Short Entry (entryShort): Occurs when:
The short EMA (10) crosses below the medium EMA (20).
Both EMAs (short and medium) are below the long EMA (100).
The current bar closes lower than it opened (close < open).
This indicates a potential shift to the downside. If there’s an existing long position, that gets closed first before opening a new short.
Exit Signals
RSI-Based Exits:
For long trades: When RSI exceeds a specified threshold (e.g., 70 by default), it triggers a long exit. RSI > short_rsi generally means overbought conditions, so the strategy exits to lock in profits or avoid a pullback.
For short trades: When RSI dips below a specified threshold (e.g., 30 by default), it triggers a short exit. RSI < long_rsi indicates oversold conditions, so the strategy closes the short to avoid a bounce.
Time-Based Exit:
If the trade has been open for xBars bars (configurable, e.g., 24 bars) and the trade is in profit (current price above entry for a long, or current price below entry for a short), the strategy closes the position. This helps lock in gains if the move takes too long or momentum stalls.
Stop-Loss Management
Fixed Stop-Loss (% Based): Each trade has a fixed stop-loss calculated as a percentage from the average entry price.
For long positions, the stop-loss is set below the entry price by a user-defined percentage (fixStopLossPerc).
For short positions, the stop-loss is set above the entry price by the same percentage.
This mechanism prevents catastrophic losses if the market moves strongly against the position.
Trailing Stop:
The strategy also sets a trail stop using trail_points (the distance in price points) and trail_offset (how quickly the stop “catches up” to price).
As the market moves in favor of the trade, the trailing stop gradually tightens, allowing profits to run while still capping potential drawdowns if the price reverses.
Order Execution Flow
When the conditions for a new position (long or short) are triggered, the strategy first checks if there’s an opposite position open. If there is, it closes that position before opening the new one (prevents going “both long and short” simultaneously).
RSI-based and time-based exits are checked on each bar. If triggered, the position is closed.
If the position remains open, the fixed stop-loss and trailing stop remain in effect until the position is exited.
Why This Combination Works
Multiple EMA Cross: Combining 10, 20, and 100 EMAs balances short-term momentum detection with a longer-term trend filter. This reduces false signals that can occur if you only look at a single crossover without considering the broader trend.
RSI Exits: RSI provides a momentum oscillator view—helpful for detecting overbought/oversold conditions, acting as an extra confirmation to exit.
Time-Based Exit: Prevents “lingering trades.” If the position is in profit but failing to advance further, it takes profit rather than risking a trend reversal.
Fixed & Trailing Stop-Loss: The fixed stop-loss is your safety net to cap worst-case losses. The trailing stop allows the strategy to lock in gains by following the trade as it moves favorably, thus maximizing profit potential while keeping risk in check.
Overall, this approach tries to capture momentum from EMA crossovers, protect profits with trailing stops, and limit risk through both a fixed percentage stop-loss and exit signals from RSI/time-based logic.

True Range Trend StrengthThis script is designed to analyze trend strength using True Range calculations alongside Donchian Channels and smoothed moving averages. It provides a dynamic way to interpret market momentum, trend reversals, and anticipate potential entry points for trades.
Key Functionalities:
Trend Strength Oscillator:
Calculates trend strength based on the difference between long and short momentum derived from ATR (Average True Range) adjusted stop levels.
Smooths the trend strength using a simple moving average for better readability.
Donchian Channels on Trend Strength Oscillator:
Plots upper and lower Donchian Channels on the smoothed trend strength oscillator.
Traders can use these levels to anticipate breakout points and determine the strength of a trend.
Zero-Cross Shading:
Highlights bullish and bearish zones with shaded backgrounds:
Green for bullish zones where smoothed trend strength is above zero.
Red for bearish zones where smoothed trend strength is below zero.
Moving Averages for Oscillator:
Overlays fast and slow moving averages on the oscillator to provide crossover signals:
Fast MA Cross Above Slow MA: Indicates bullish momentum.
Fast MA Cross Below Slow MA: Indicates bearish momentum.
Alerts:
Alerts are available for MA crossovers, allowing traders to receive timely notifications about potential trend reversals or continuation signals.
Anticipating Entries with Donchian Channels:
The integration of Donchian Channels offers an edge in anticipating excellent trade entries.
Traders can use the oscillator's position relative to the channels to gauge oversold/overbought conditions or potential breakouts.
Use Case:
This script is particularly useful for traders looking to:
Identify the strength and direction of market trends.
Time entries and exits based on dynamic Donchian Channel levels and trend strength analysis.
Incorporate moving averages and visual cues for better decision-making.

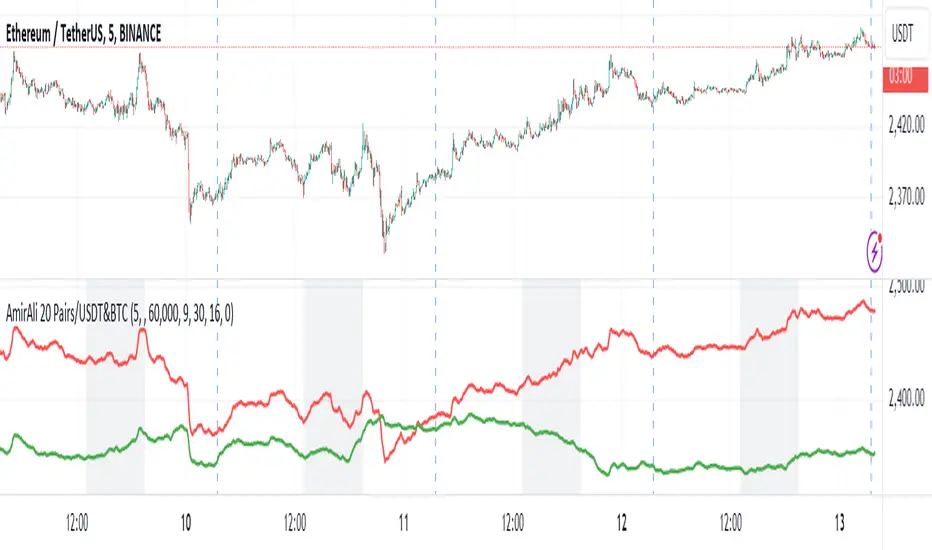
AmirAli 20 Pairs/USDT&BTCThis TradingView indicator, titled "20 Pairs/USDT&BTC," is designed to analyze and display the Exponential Moving Averages (EMAs) of various cryptocurrency pairs against USDT and BTC. Here's a detailed breakdown of its features, functionality, and usage:
Key Features:
Pairs Display: The indicator allows users to select which cryptocurrency pairs they wish to display on the chart. The available options include popular cryptocurrencies such as Ethereum (ETH), Binance Coin (BNB), Solana (SOL), Dogecoin (DOGE), Ripple (XRP), Litecoin (LTC), Polkadot (DOT), Avalanche (AVAX), Uniswap (UNI), Chainlink (LINK), Cardano (ADA), Cosmos (ATOM), Filecoin (FIL), Stellar (XLM), VeChain (VET), Enjin (ENJ), Celo (CELO), Hedera (HBAR), and Sandbox (SAND).
Dynamic Price Retrieval: For each selected pair, the indicator retrieves the closing prices for both USDT and BTC from Binance. This is done using the request.security function, which fetches real-time data.
EMA Calculation: The indicator calculates and plots the EMA for each cryptocurrency pair over a user-defined length, allowing traders to identify trends and potential buy/sell signals based on price movements relative to their EMAs.
User Customization: Users can customize several parameters, including the time frame for data retrieval, EMA length, and the visibility of each pair.
Market Hours Visualization: The indicator highlights the trading hours with a gray background, helping users identify when the market is active.
How to Use the Indicator:
Adding the Indicator: To use the indicator, add it to your TradingView chart by searching for "20 Pairs/USDT&BTC" in the public library or by pasting the provided Pine Script code into a new indicator script.
Select Pairs: Enable or disable specific cryptocurrency pairs in the input options at the top of the script. For example, if you want to analyze ETH and ADA, ensure that the respective boxes are checked.
Adjust Time Frame: Set the time frame for the indicator. You can choose any time frame or leave it blank to use the current chart's time frame.
Set EMA Length: Choose the length for the EMA calculation based on your trading strategy. A shorter EMA (e.g., 5) reacts more quickly to price changes, while a longer EMA (e.g., 20) smooths out price fluctuations.
Observe Trends: Monitor the plotted EMAs for the selected pairs. Crossovers of the price with the EMA can indicate potential buy or sell signals. For instance, if the price crosses above the EMA, it may signal a bullish trend, whereas a crossover below could indicate a bearish trend.
Consider Market Hours: Pay attention to the gray background during U.S. trading hours, as this may indicate higher volatility and trading opportunities.
Conclusion
The "20 Pairs/USDT&BTC" indicator is a powerful tool for cryptocurrency traders looking to analyze multiple pairs simultaneously. By providing a visual representation of EMAs, it aids in identifying trends and potential trading opportunities in a user-friendly manner. Make sure to adapt the settings according to your trading strategy and market conditions for optimal results.
Amir Hasankhah & Ali Beyki
RSI & Volume Impact Analyzer Ver.1.00Description:
The RSI VOL Score indicator combines the Relative Strength Index (RSI) and volume data through a mathematical calculation to assist traders in identifying and confirming potential trend reversals and continuations. By leveraging both momentum (RSI) and volume data, this indicator provides a more comprehensive view of market strength compared to using RSI or volume alone.
How It Works:
This indicator calculates a score by comparing the RSI against its moving average, adjusted by the volume data. The resulting score quantifies market momentum and strength. When the score crosses its signal line, it may indicate key moments where the market shifts between bullish and bearish trends, potentially helping traders spot these changes earlier.
Calculation Methods:
The RSI VOL Score allows users to select between several calculation methods to suit their strategy:
SMA (Simple Moving Average): Provides a balanced smoothing approach.
EMA (Exponential Moving Average): Reacts more quickly to recent price changes, offering faster signals.
VWMA (Volume Weighted Moving Average): Emphasizes high-volume periods, focusing on stronger market moves.
WMA (Weighted Moving Average): Applies greater weight to recent data for a more responsive signal.
What the Indicator Plots:
Score Line: Represents a combined metric based on RSI and volume, helping traders gauge the overall strength of the trend.
Signal Line: A smoothed version of the score that helps traders identify potential trend changes. Bullish signals occur when the score crosses above the signal line, while bearish signals occur when the score drops below.
Key Features:
Trend Identification: The score and signal line crossovers can help confirm emerging bullish or bearish trends, allowing traders to act on upward or downward momentum.
Customizable Settings: Traders can adjust the lengths of the RSI and signal line and choose between different moving averages (SMA, EMA, VWMA, WMA) to tailor the indicator to their trading style.
Timeframe-Specific: The indicator works within the selected timeframe, ensuring accurate trend analysis based on the current market context.
Practical Use Cases:
Trending Markets: In trending markets, this indicator helps confirm bullish or bearish signals by validating price moves with volume. Traders can use the crossover of the score and signal line as a guide for entering or exiting trades based on trend strength.
Ranging Markets: In ranging markets, the indicator helps filter out false signals by confirming if price movements are backed by volume, making it a useful tool for traders looking to avoid entering during weak or uncertain market conditions.
Interpreting the Score and Signal Lines:
Bullish Signal: A bullish signal occurs when the score crosses above the signal line, indicating a potential upward trend in momentum and price.
Bearish Signal: A bearish signal is generated when the score crosses below the signal line, suggesting a potential downward trend or weakening market momentum.
By mathematically combining RSI and volume data into a single trend score, the RSI VOL Score indicator provides traders with a powerful tool for identifying trend shifts early and making more confident trading decisions.
Important Note:
The signals generated by this indicator should be interpreted in conjunction with other analysis tools. It is always advisable to confirm signals before making any trading decisions.
Disclaimer:
This indicator is designed to assist traders in their decision-making process and does not provide financial advice. The creators of this tool are not responsible for any financial losses or trading decisions made based on its signals. Trading involves significant risk, and users should seek professional advice or conduct their own research before making any trading decisions.

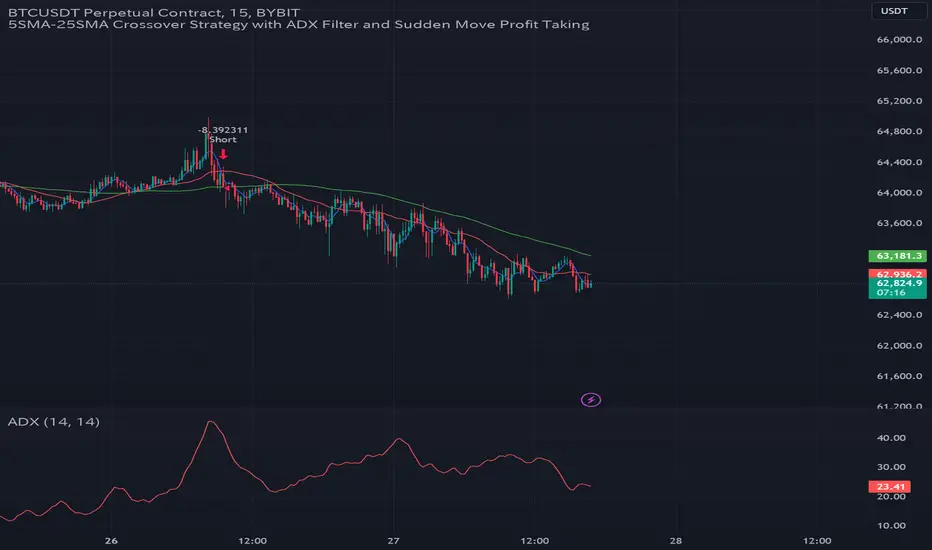
GC Strategy with Trend Filter and Sudden Move Profit TakingBYBIT:BTCUSDT.P 15M
Situation Assessment with Three Moving Averages
The strategy uses the crossover of the 5SMA and 25SMA as entry signals.
Additionally, the 75SMA is used as a filter. Long entries are only allowed when the price is above the 75SMA, and short entries are only allowed when the price is below the 75SMA.
ADX Filter
The Average Directional Index (ADX) is used to check the strength of the trend. Entry signals are only activated when the ADX is above 20. This ensures that trades are only executed when the trend is strong.
Sudden Move Detection
The strategy detects sudden price movements. If a sudden move occurs, the position is closed to lock in profits.
Entry
Long Entry: When the 5SMA crosses above the 25SMA, the price is above the 75SMA, and the ADX is above 20.
Short Entry: When the 5SMA crosses below the 25SMA, the price is below the 75SMA, and the ADX is above 20.
Exit
Positions are closed if a sudden move occurs. Positions are also closed if an opposing entry signal is generated.
This strategy aims to confirm the strength of the trend using moving average crossovers and ADX and to lock in profits based on sudden price movements.
3本の移動平均線による状況判断
5SMAと25SMA のクロスオーバーをエントリーシグナルとして使用します。
さらに、75SMAをフィルターとして使用し、価格が75SMAの上にある場合のみロングエントリーを許可し、75SMAの下にある場合のみショートエントリーを許可します。
ADXフィルター
ADX(平均方向性指数)を使ってトレンドの強さを確認します。
ADXが20より大きい場合のみ、エントリーシグナルを有効にします。これにより、トレンドが強い時にのみ取引を行うことができます。
急激な変動検知
価格の急激な変動を検出します。
急激な変動があった場合には、ポジションをクローズして利益を確定します。
エントリー
ロングエントリー
5SMAが25SMAを上にクロスし、価格が75SMAの上にあり、ADXが20を超えているとき。
ショートエントリー
5SMAが25SMAを下にクロスし、価格が75SMAの下にあり、ADXが20を超えているとき。
エグジット
急激な変動があった場合、ポジションをクローズします。
反対のエントリーシグナルが発生した場合にも、ポジションをクローズします。
このストラテジーは、移動平均のクロスオーバーとADXを使ってトレンドの強さを確認し、急激な変動に基づいて利益を確定することを目的としています。
Price Oscillator TR### Summary: How to Use the Price Oscillator with EMA Indicator
The **Price Oscillator with EMA** is a custom technical analysis tool designed to help traders identify potential buying and selling opportunities based on price momentum. Here's how to use it:
1. **Understanding the Oscillator**:
- The oscillator is calculated by normalizing the current price relative to the highest high and lowest low over a specified lookback period. It fluctuates between -70 and +70.
- When the oscillator is near +70, the price is close to the recent highs, indicating potential overbought conditions. Conversely, when it’s near -100, the price is close to recent lows, indicating potential oversold conditions.
2. **Exponential Moving Average (EMA)**:
- The indicator includes an EMA of the oscillator to smooth out price fluctuations and provide a clearer signal.
- The EMA helps to filter out noise and confirm trends.
3. **Trading Signals**:
- **Bullish Signal**: A potential buying opportunity is signaled when the oscillator crosses above its EMA. This suggests increasing upward momentum.
- **Bearish Signal**: A potential selling opportunity is signaled when the oscillator crosses below its EMA. This indicates increasing downward momentum.
4. **Visual Aids**:
- The indicator includes horizontal lines at +70, 0, and -70 to help you quickly assess overbought, neutral, and oversold conditions.
- The blue line represents the oscillator, while the orange line represents the EMA of the oscillator.
### How to Use:
- **Set your parameters**: Adjust the lookback period and EMA length to fit your trading strategy and time frame.
- **Watch for Crossovers**: Monitor when the oscillator crosses the EMA. A crossover from below to above suggests a buy, while a crossunder from above to below suggests a sell.
- **Confirm with Other Indicators**: For more reliable signals, consider using this indicator alongside other technical tools like volume analysis, trend lines, or support/resistance levels.
This indicator is ideal for traders looking to capture momentum-based trades in various market conditions.
Momentum & Squeeze Oscillator [UAlgo]The Momentum & Squeeze Oscillator is a technical analysis tool designed to help traders identify shifts in market momentum and potential squeeze conditions. This oscillator combines multiple timeframes and periods to provide a detailed view of market dynamics. It enhances the decision-making process for both short-term and long-term traders by visualizing momentum with customizable colors and alerts.
🔶 Key Features
Custom Timeframe Selection: Allows users to select a custom timeframe for oscillator calculations, providing flexibility in analyzing different market periods.
Recalculation Option: Enables or disables the recalculation of the indicator, offering more control over real-time data processing.
Squeeze Background Visualization: Highlights potential squeeze conditions with a background color, helping traders quickly spot consolidation periods.
Adjustable Squeeze Sensitivity: Users can modify the sensitivity of the squeeze detection, tailoring the indicator to their specific trading style and market conditions.
Bar Coloring Condition: Option to color the price bars based on momentum conditions, enhancing the visual representation of market trends.
Threshold Bands: Option to fill threshold bands for a clearer visualization of overbought and oversold levels.
Reference Lines: Display reference lines for overbought, oversold, and mid-levels, aiding in quick assessment of momentum extremes.
Multiple Output Modes: Offers different output visualization modes, including:
ALL: Displays all calculated momentum values (fast, medium, slow).
AVG: Shows the average momentum, providing a consolidated view.
STD: Displays the standard deviation of momentum, useful for understanding volatility.
Alerts: Configurable alerts for key momentum events such as crossovers and squeeze conditions, keeping traders informed of important market changes.
🔶 Usage
The Momentum & Squeeze Oscillator can be used for various trading purposes:
Trend Identification: Use the oscillator to determine the direction and strength of market trends. By analyzing the average, fast, medium, and slow momentum lines, traders can gain insights into short-term and long-term market movements.
Squeeze Detection: The indicator highlights periods of low volatility (squeeze conditions) which often precede significant price movements. Traders can use this information to anticipate and prepare for potential breakouts.
Overbought/Oversold Conditions: The oscillator helps identify overbought and oversold conditions, indicating potential reversal points. This is particularly useful for timing entry and exit points in the market.
Momentum Shifts: By monitoring the crossover of momentum lines with key levels (e.g., the 50 level), traders can spot shifts in market momentum, allowing them to adjust their positions accordingly.
🔶 Disclaimer:
Use with Caution: This indicator is provided for educational and informational purposes only and should not be considered as financial advice. Users should exercise caution and perform their own analysis before making trading decisions based on the indicator's signals.
Not Financial Advice: The information provided by this indicator does not constitute financial advice, and the creator (UAlgo) shall not be held responsible for any trading losses incurred as a result of using this indicator.
Backtesting Recommended: Traders are encouraged to backtest the indicator thoroughly on historical data before using it in live trading to assess its performance and suitability for their trading strategies.
Risk Management: Trading involves inherent risks, and users should implement proper risk management strategies, including but not limited to stop-loss orders and position sizing, to mitigate potential losses.
No Guarantees: The accuracy and reliability of the indicator's signals cannot be guaranteed, as they are based on historical price data and past performance may not be indicative of future results.

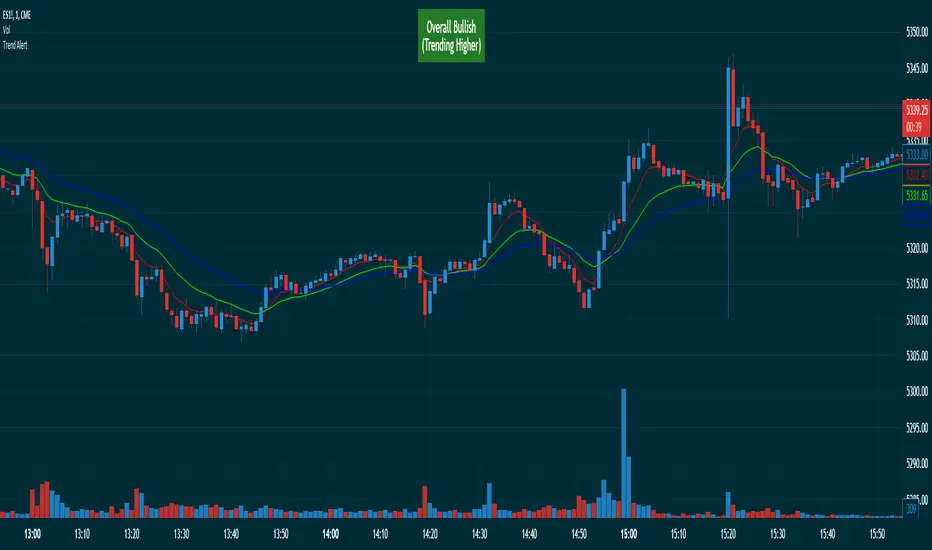
Triple EMA Trend AlertThis EMA trend indicator works by determining if a short-term EMA is above an intermediate-term EMA that is in turn above a long-term EMA (in a bullish trend) or if the reverse is true in a bearish trend. An alert box is displayed on the chart to give a trend trader a quick at-a-glance reference to see which way the overall trend is moving by turning green when the trend is overall bullish, red when overall bearish, and gray when indecisive and not clearly trending (a good time for the trend trader to consider setting back and just observing as they wait for a new trend to develop). Text is displayed in the box showing the current overall trend direction. Sometimes, using this criterion, a trend can still be considered overall bullish while the EMAs are actually bearish prior an EMA crossover that results in a trend readout change to indecisive or in the opposite direction. For this reason, the indicator will also display in parenthesis if the EMAs are trending lower or higher by comparing all live-bar EMA values to that of the previous bar’s values to determine if they are collectively trending lower or higher at that time in order to give an early warning of a potential trend reversal before the EMA crossovers change the overall bullish or bearish readout of the indicator. Both the alert box and EMA line chart overlays can be turned on and off independently, if desired.
Volume Storm Trend [ChartPrime]The Volume Storm Trend (VST) indicator is a robust tool for traders looking to analyze volume momentum and trend strength in the market. By incorporating key volume-based calculations and dynamic visualizations, VST provides clear insights into market conditions.
Components:
Calculating the median of the source data.
Volume Power Calculation: The indicator calculates the "heat power" and "cold power" by applying an Exponential Moving Average (EMA) to the median of volume data arrays.
// ---------------------------------------------------------------------------------------------------------------------}
// 𝙄𝙉𝘿𝙄𝘾𝘼𝙏𝙊𝙍 𝘾𝘼𝙇𝘾𝙐𝙇𝘼𝙏𝙄𝙊𝙉𝙎
// ---------------------------------------------------------------------------------------------------------------------{
max_val = 1000
src = close
source = ta.median(src, len)
heat.push(src > source ? (volume > max_val ? max_val : volume) : 0)
heat.remove(0)
cold.push(src < source ? (volume > max_val ? max_val : volume) : 0)
cold.remove(0)
heat_power = ta.ema(heat.median(), 10)
cold_power = ta.ema(cold.median(), 10)
Visualization:
Gradient Colors: The indicator uses gradient colors to visualize bullish volume and bearish volume powers, providing a clear contrast between rising and falling trends.
Bars Fill Color: The color fill between high and low prices changes based on whether the heat power is greater than the cold power.
Bottom Line: A zero line with changing colors based on the dominance of heat or cold power.
Weather Symbols: Visual indicators ("☀" for hot weather and "❄" for cold weather) appear on the chart when the heat and cold powers crossover, helping traders quickly identify trend changes.
Inputs:
Source: The input data source, typically the closing price.
Median Length: The period length for calculating the median of the source. Default is 40.
Volume Length: The period length for calculating the average volume. Default is 3.
Show Weather: A toggle to display weather symbols on the chart. Default is false.
Temperature Type: Allows users to choose between Celsius (°C) and Fahrenheit (°F) for temperature display.
Show Weather Function:
The `Show Weather?` function enhances the VST indicator by displaying weather symbols ("☀" for hot and "❄" for cold) when there are significant crossovers between heat power and cold power. This feature adds a visual cue for potential market tops and bottoms. When the market heats to a high temperature, it often indicates a potential top, signaling traders to consider exiting long positions or preparing for a reversal.
Additional Features:
Dynamic Table Display: A table displays the current "temperature" on the chart, indicating market heat based on the calculated heat and cold powers.
The Volume Storm Trend indicator is a powerful tool for traders
looking to enhance their market analysis with volume and momentum insights, providing a clear and visually appealing representation of key market dynamics.

Supertrend with Target Price & ATREE [SS]Hey everyone,
Releasing this supertrend mashup indicator.
This is your basic supertrend, but with two additions:
1. The integration of the ATREE technical probability modeller; and
2. The use of ATR price targets for crossovers
ATREE
ATREE stands for Advanced Technical Range Expectancy Estimator. It has its very own indicator available here . If you are not that familiar with it, I would suggest heading over to that page and reading about it, because it gives you the in-depth details.
But for a recap, ATREE uses technical indicators such as RSI, Stochastics or Z-Score to predict the likely sentiment, whether it be bullish or bearish. The indicator allows you to select the ATREE model type and supports 3 separate probability models based on either:
1. RSI
2. Stochastics; or
3. Z-Score
If you want to know which model is most effective for the ticker and timeframe you are using, you can launch up the native ATREE indicator and review the backtesting results to ascertain which model performs optimally for that particular ticker on that particular timeframe.
When ATREE assesses the sentiment as bearish, you will get a red fill. When it assesses the sentiment as bullish, you will get a green fill. This will help you adjust your bias to focus on either dip buying or rip shorting.
The ATREE timeframe is also customizable, so you can pull data from higher timeframes than you are on.
ATR Price Targets
As with my EMA 9/21 crossover with the target price, this is essentially the same concept. When the trend shifts to bullish or bearish, bull and bear targets will be printed so you know where to look for potential reversal and you can also set realistic target prices if you are scalping or day trading.
Supertrend
The last and base feature is the supertrend. The supertrend settings are customizeable.
It will provide a green line for uptrend and a redline for downtrend, the basic supertrend functionality.
And that's the indicator!
Let me know what you think and hope you enjoy!
Safe trades as always!

Weighted Alpha with Zero line indicatorDescription:
This script introduces an Enhanced Weighted Alpha Indicator, designed for traders and analysts who seek a more nuanced view of market momentum and trend strength. The Weighted Alpha is a sophisticated measure that combines the concepts of price change and consistency of trend over a specified period. This version of the indicator is enhanced with a customizable lambda value, allowing users to fine-tune the sensitivity according to their trading strategy.
Key Features:
Weighted Alpha Calculation: The script calculates the Weighted Alpha based on the daily return of the asset, adjusted by a decay factor (lambda). This provides a smoothed, long-term view of the asset's momentum.
Customizable Lambda: Users can adjust the lambda value to modify the rate at which older data decreases in relevance. A higher lambda value gives more weight to recent data, making the indicator more sensitive to recent price movements.
Zero Line Indicator: A dotted red horizontal line at the 0 value on the y-axis serves as a quick visual reference. This line helps in identifying when the Weighted Alpha crosses from positive to negative or vice versa, indicating potential shifts in market momentum.
Separate Chart Pane: The Weighted Alpha is plotted on a separate pane below the main chart, providing a clear and uncluttered view.
Usage:
Trend Analysis: A positive Weighted Alpha indicates an upward trend, while a negative value suggests a downward trend. The magnitude of the Weighted Alpha gives an idea of the trend's strength.
Crossover Signals: Watch for the Weighted Alpha line crossing the zero line. Such crossovers can signal potential trend reversals.
Customization: Experiment with different lambda values to match the indicator's sensitivity with your trading style. A lower lambda smooths out the line more, while a higher lambda makes it more responsive to recent price changes.
Conclusion:
This Enhanced Weighted Alpha Indicator is a powerful tool for traders looking to analyze and anticipate market trends with greater precision. Its customization options and clear visual representation make it a valuable addition to any trader's toolkit.

Smart MAThe Smart MA indicator is a tool designed for traders seeking insights into market trends, with its foundation rooted in moving averages. It offers two distinctive color options, with "Crossing" as the default choice and "Direction" as an alternative. Let's delve deeper into these options:
1. "Crossing" Color Option (Default):
Key Features:
Utilizes the interaction between fast and slow moving averages.
The color of the base moving average (MA) line dynamically changes based on crossovers between these moving averages.
Offers real-time visual signals for potential shifts in market sentiment.
Interpretation:
With the "Crossing" color option as the default setting, the base MA line's color responds to the interaction of the fast and slow moving averages.
A crossover where the fast MA crosses above the slow MA may prompt the base MA line to change to a bullish color (e.g., teal), indicating a potential bullish trend.
Conversely, if the fast MA crosses below the slow MA, the base MA line's color may alter to represent a bearish sentiment (e.g., red). This color shift provides a visual marker for a potential bearish trend, potentially guiding traders towards shorting opportunities.
2. "Direction" Color Option:
Key Features:
Focuses on the directional trend of the base moving average (MA).
The color of the base MA line signifies the direction in which the base MA is moving.
Aids in quickly identifying the prevailing market trend.
Interpretation:
Uptrend - Bullish Direction: When the base MA slopes upward, indicating an average price increase over the chosen base MA length, the base MA line's color may shift to a bullish hue (e.g., teal). This visual cue signals a potential uptrend, suggesting favorable long positions.
Downtrend - Bearish Direction: If the base MA slopes downward, signifying an average price decrease over the selected base MA length, the base MA line could change to a bearish shade (e.g., red). This color shift acts as an indicator of a potential downtrend, implying possible opportunities for shorting.
Customization:
Both color options allow traders to adjust the indicator's parameters, including base MA length, MA type, fast MA length, and slow MA length, to align with their trading strategies and preferred timeframes.
In summary, the Smart MA indicator, based on moving averages, provides traders with two color options: the default "Crossing" and "Direction" as an alternative. The "Crossing" option leverages fast and slow moving averages to offer real-time visual cues for dynamic market shifts. The "Direction" option simplifies trend analysis by focusing on the directional trend of the base MA. The choice between these options depends on your trading style and the depth of analysis you require. With the Smart MA indicator, you're equipped to make informed trading decisions in today's financial markets.

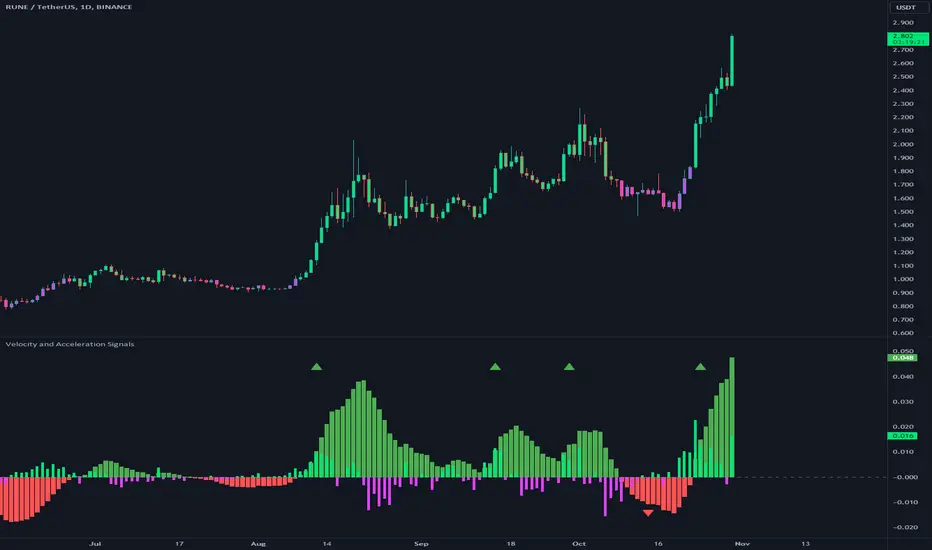
Velocity and Acceleration SignalsThe "Velocity and Acceleration Signals" indicator is a versatile tool designed to provide traders with valuable insights into price momentum and acceleration. By harnessing the power of mathematics and visualization, this indicator helps traders make informed decisions in the fast-paced world of financial markets.
Crunching the Numbers: How It Works
At its core, the indicator relies on two key concepts: velocity and acceleration. Here's how it operates:
-- Velocity Calculation : The indicator takes a step back in time, considering a user-defined historical period (typically around 14 bars). It calculates the velocity of price movements during this period. Velocity represents the speed at which an asset's price is changing and is derived by examining how much the price has moved between bars. Specifically, it computes the rate of change in price over time.
-- Acceleration Calculation : Building upon velocity, the indicator goes one step further and calculates acceleration. Acceleration signifies how quickly the velocity is changing. It quantifies whether the price is speeding up or slowing down in its ascent or descent.
-- Smoothing with EMA : To enhance clarity and reduce noise, the indicator smooths the velocity using an Exponential Moving Average (EMA) with a user-defined length. This smoothed velocity provides a more comprehensive view of the price momentum trend.
Visualizing Market Dynamics
The indicator doesn't just crunch numbers; it also paints a vivid picture of market sentiment:
-- Coloration : The indicator employs a color scheme to visualize market conditions. It uses lime for positive acceleration and fuchsia for negative acceleration. The color green represents positive smoothed velocity, while red denotes negative smoothed velocity. A gray hue signals a neutral or transitional phase.
-- Plotting Velocity and Acceleration : The indicator provides visual representations of both smoothed velocity and acceleration. Smoothed velocity is depicted as columns, with green or red coloring indicating the direction. Acceleration is displayed as a histogram, with lime or fuchsia bars showcasing bullish or bearish momentum. A gray zero line offers a reference point for changes in momentum direction.
-- Strong Up and Strong Down Conditions : For traders seeking distinctive signals, the indicator identifies "Strong Up" and "Strong Down" conditions. A "Strong Up" occurs when smoothed velocity crosses above a user-defined threshold, coupled with positive acceleration. Conversely, a "Strong Down" emerges when smoothed velocity crosses below another threshold, accompanied by negative acceleration. These conditions are marked with prominent triangular shapes.
Unlocking Trading Potential
Now, let's explore how traders can leverage the indicator:
-- Trend Confirmation : Traders can use this indicator to validate the prevailing market trend. A robust smoothed velocity, combined with acceleration in the same direction, can confirm the current trend.
-- Contrarian Signals : Extreme conditions signaled by a strong crossover or crossunder of the smoothed velocity threshold, along with appropriate acceleration, can hint at potential trend reversals.
-- Divergence Analysis : Savvy traders can employ this indicator to identify divergences between price movements and momentum. If the price exhibits higher highs while the indicator shows lower highs (or vice versa), it may signify a weakening or strengthening trend.
Navigating Limitations
As with any trading tool, it's essential to acknowledge the indicator's limitations:
-- Lookback Period : The indicator's effectiveness may vary based on the chosen historical period. Longer periods smooth out fluctuations but may lag in capturing recent changes in sentiment.
-- Threshold Sensitivity : Interpreting threshold crossovers or crossunders can be subjective. Traders should carefully fine-tune these threshold values based on their trading strategy and market conditions.
-- Context Matters : The indicator focuses solely on velocity and acceleration signals and does not incorporate other critical factors such as trading volume, market news, or fundamental analysis. Therefore, traders should use it in conjunction with additional indicators and analysis techniques.
While the primary focus is on trend and momentum analysis, this indicator indirectly provides information about volatility as well. Rapid changes in velocity and acceleration can indicate increasing volatility in the market, which may be of interest to traders looking for opportunities during volatile conditions.
However, this indicator doesn't directly measure volume. To incorporate volume analysis into your trading strategy, you may want to combine this indicator with volume-based indicators or consider other tools specifically designed for volume analysis.
In conclusion, this indicator is a valuable ally for traders looking to decode market dynamics and make data-driven trading decisions. While it offers powerful insights, it's crucial to recognize its limitations and deploy it as part of a comprehensive trading strategy.
Fiboborsa+BistTitle: "Fiboborsa+Bist Indicator for TradingView"
Description: The "Fiboborsa+Bist" indicator is a powerful tool designed for TradingView users. This indicator offers a comprehensive set of technical indicators to assist you in your technical analysis and trading decisions.
Features:
Simple Moving Averages (SMA): You can enable or disable SMA with different periods (20, 50, 100, 200) to observe different timeframes and trends.
SMA Strategy: Use SMA crossovers to determine trends. Watch for the 20-period SMA crossing above the 50-period SMA for a bullish signal. For a bearish signal, observe the 50-period SMA crossing below the 100-period SMA.
Exponential Moving Averages (EMA): Similar to SMA, you can enable or disable EMA with different periods (5, 8, 14, 21, 34, 55, 89, 144, 233) for more precise trend analysis.
EMA Strategy: Use EMA crossovers and crossunders for short-term trend changes. A buy signal may occur when the 5-period EMA crosses above the 14-period EMA, while a crossunder suggests a selling opportunity.
Weighted Moving Averages (WMA): Customize WMA settings with various periods (5, 13, 21, 34, 89, 144, 233, 377, 610, 987) to suit your trading style.
WMA Strategy: Use WMA crossovers to verify trends. When the 13-period WMA crosses above the 34-period WMA, it may indicate an uptrend.
Buy and Sell Signals: The indicator provides buy and sell signals based on EMA crossovers and crossunders. Strong signals are also highlighted.
EMA Buy and Sell Strategy: Make informed trading decisions using buy and sell signals generated by EMA crossovers and crossunders.
Ichimoku Cloud: You can enable the Ichimoku Cloud for a clear visual representation of support and resistance levels.
Ichimoku Strategy: Use the Ichimoku Cloud to determine trend direction. Entering long positions is common when the price is above the cloud and considering short positions when it's below the cloud. Verify the trend with the Chikou Span.
Bollinger Bands: Easily visualize price volatility by enabling the Bollinger Bands feature.
Bollinger Bands Strategy: Bollinger Bands help you visualize price volatility. Look for potential reversal points when the price touches or crosses the upper or lower bands.
Use the "Fiboborsa+Bist" indicator to enhance your trading strategies and make informed decisions in the dynamic world of financial markets.
Additional Information:
Bollinger Bands: Bollinger Bands are a technical analysis tool used to monitor price volatility and determine overbought or oversold conditions. This indicator consists of three components:
Middle Moving Average (SMA): Typically, a 20-day SMA is used.
Upper Band: Calculated by adding two times the standard deviation to the SMA.
Lower Band: Calculated by subtracting two times the standard deviation from the SMA.
As the price moves between these two bands, it becomes possible to identify potential buying or selling points by comparing its height or low with these bands.
Ichimoku Cloud: The Ichimoku Cloud is a comprehensive indicator used for trend identification, defining support and resistance levels, and measuring trend strength. The Ichimoku Cloud comprises five key components:
Tenkan Sen (Conversion Line): Used to identify short-term trends.
Kijun Sen (Base Line): Used to identify medium-term trends.
Senkou Span A (Leading Span A): Calculated as (Tenkan Sen + Kijun Sen) / 2 and shows future support and resistance levels.
Senkou Span B (Leading Span B): Calculated as (highest high + lowest low) / 2 and indicates future support and resistance levels.
Chikou Span (Lagging Line): Enables tracking the price backward.
The Ichimoku Cloud interprets a price above the cloud as an uptrend and below the cloud as a downtrend. The Chikou Span assists in verifying the current trend.
ADDITIONAL STRATEGY WITH RSI AND MACD INDICATORS
**Strategy: Two-Stage Trading Strategy Using RSI, MACD, and Fiboborsa+Bist Indicators**
**Stage 1: Determining the Trend and Selecting the Trading Direction**
1. **Trend Identification with Fiboborsa+Bist Indicator:**
- Analyze the simple moving averages (SMA), exponential moving averages (EMA), and weighted moving averages (WMA) used with the Fiboborsa+Bist indicator. These indicators will provide information about the direction of the market trend.
2. **Identifying Overbought and Oversold Conditions with RSI:**
- Use the RSI indicator to identify overbought (70 and above) and oversold (30 and below) conditions. This helps in measuring the strength of the trend. If RSI enters the overbought zone, a downward correction is likely. If RSI enters the oversold zone, an upward correction is probable.
3. **Evaluating Momentum with MACD:**
- Examine price momentum using the MACD indicator. When the MACD line crosses above the signal line, it may indicate an increasing upward momentum. Conversely, a downward cross can suggest an increasing downward momentum.
**Stage 2: Generating Buy and Sell Signals**
4. **Combining RSI, MACD, and Fiboborsa+Bist Indicators:**
- To generate a buy signal, wait for RSI to move out of the oversold region into an uptrend and for the MACD line to cross above the signal line.
- To generate a sell signal, wait for RSI to move out of the overbought region into a downtrend and for the MACD line to cross below the signal line.
5. **Confirmation with Fiboborsa+Bist Indicator:**
- When you receive a buy or sell signal, use the Fiboborsa+Bist indicator to confirm the market trend. Confirming the trend can strengthen your trade signals.
6. **Setting Stop-Loss and Take-Profit Levels:**
- Remember to manage risk when opening buy or sell positions. Set stop-loss and take-profit levels to limit your risk.
7. **Monitor and Adjust Your Trades:**
- Continuously monitor your trade positions and adjust your strategy as per market conditions.
This two-stage trading strategy offers the ability to determine trends and generate trade signals using different indicators. However, every trading strategy involves risks, so risk management and practical application are essential. Also, it's recommended to test this strategy in a demo account before using it in a real trading account.

Nifty 50 5mint Strategy
The script defines a specific trading session based on user inputs. This session is specified by a time range (e.g., "1000-1510") and selected days of the week (e.g., Monday to Friday). This session definition is crucial for trading only during specific times.
Lookback and Breakout Conditions:
The script uses a lookback period and the highest high and lowest low values to determine potential breakout points. The lookback period is user-defined (default is 10 periods).
The script also uses Bollinger Bands (BB) to identify potential breakout conditions. Users can enable or disable BB crossover conditions. BB consists of an upper and lower band, with the basis.
Additionally, the script uses Dema (Double Exponential Moving Average) and VWAP (Volume Weighted Average Price) . Users can enable or disable this condition.
Buy and Sell Conditions:
Buy conditions are met when the close price exceeds the highest high within the specified lookback period, Bollinger Bands conditions are satisfied, Dema-VWAP conditions are met, and the script is within the defined trading session.
Sell conditions are met when the close price falls below the lowest low within the lookback period, Bollinger Bands conditions are satisfied, Dema-VWAP conditions are met, and the script is within the defined trading session.
When either condition is met, it triggers a "long" or "short" position entry.
Trailing Stop Loss (TSL):
Users can choose between fixed points ( SL by points ) or trailing stop (Profit Trail).
For fixed points, users specify the number of points for the stop loss. A fixed stop loss is set at a certain distance from the entry price if a position is opened.
For Profit Trail, users can enable or disable this feature. If enabled, the script uses a "trail factor" (lookback period) to determine when to adjust the stop loss.
If the price moves in the direction of the trade and reaches a certain level (determined by the trail factor), the stop loss is adjusted, trailing behind the price to lock in profits.
If the close price falls below a certain level (lowest low within the trail factor(lookback)), and a position is open, the "long" position is closed (strategy.close("long")).
If the close price exceeds a certain level (highest high within the specified trail factor(lookback)), and a position is open, the "short" position is closed (strategy.close("short")).
Positions are also closed if they are open outside of the defined trading session.
Background Color:
The script changes the background color of the chart to indicate buy (green) and sell (red) signals, making it visually clear when the strategy conditions are met.
In summary, this script implements a breakout trading strategy with various customizable conditions, including Bollinger Bands, Dema-VWAP crossovers, and session-specific rules. It also includes options for setting stop losses and trailing stop losses to manage risk and lock in profits. The "trail factor" helps adjust trailing stops dynamically based on recent price movements. Positions are closed under certain conditions to manage risk and ensure compliance with the defined trading session.
CE=Buy, CE_SL=stoploss_buy, tCsl=Trailing Stop_buy.
PE=sell, PE_SL= stoploss_sell, tpsl=Trailing Stop_sell.
Remember that trading involves inherent risks, and past performance is not indicative of future results. Exercise caution, manage risk diligently, and consider the advice of financial experts when using this script or any trading strategy.

Trend Confirmation StrategyThe profitability and uniqueness of a trading strategy depend on various factors including market conditions, risk management, and the strategy's ability to capitalize on price movements. I'll describe the strategy provided and highlight its potential benefits and differences compared to other strategies:
Strategy Overview:
The provided strategy combines three technical indicators: Supertrend, MACD, and VWAP. It aims to identify potential entry and exit points by confirming trend direction and considering the proximity to the VWAP level. The strategy also incorporates stop-loss and take-profit mechanisms, as well as a trailing stop.
Unique Aspects and Potential Benefits:
Trend Confirmation: The strategy uses both Supertrend and MACD to confirm the trend direction. This dual confirmation can increase the likelihood of accurate trend identification and filter out false signals.
VWAP Confirmation: The strategy considers the proximity of the price to the VWAP level. This dynamic level can act as a support or resistance and provide additional context for entry decisions.
Adaptive Stop Loss: The strategy sets a stop-loss range, which helps provide some tolerance for minor price fluctuations. This adaptive approach considers market volatility and helps prevent premature stop-loss triggers.
Trailing Stop: The strategy incorporates a trailing stop mechanism to lock in profits as the trade moves in the desired direction. This can potentially enhance profitability during strong trends.
Partial Profit Booking: While not explicitly implemented in the provided code, you could consider booking partial profits when the MACD shows a crossover in the opposite direction. This aspect could help secure gains while still keeping exposure to potential further price movements.
Key Differences from Other Strategies:
Dual Indicator Confirmation: The combination of Supertrend and MACD for trend confirmation is a unique aspect of this strategy. It adds an extra layer of filtering to enhance the accuracy of entry signals.
Dynamic VWAP: Incorporating the VWAP level into the decision-making process adds a dynamic element to the strategy. VWAP is often used by institutional traders, and its inclusion can provide insights into the market sentiment.
Adaptive Stop Loss and Trailing: The strategy's use of an adaptive stop-loss range and a trailing stop can help manage risk and protect profits more effectively during changing market conditions.
Partial Profit Booking: The suggestion to consider partial profit booking upon MACD crossovers in the opposite direction is a practical approach to secure gains while staying in the trade.
Caution and Considerations:
Backtesting: Before deploying any strategy in real trading, it's crucial to thoroughly backtest it on historical data to understand its performance under various market conditions.
Risk Management: While the strategy has built-in risk management mechanisms, it's essential to carefully manage position sizes and overall portfolio risk.
Market Conditions: No strategy works well in all market conditions. It's important to be flexible and adjust the strategy or refrain from trading during particularly volatile or unpredictable periods.
Continuous Monitoring: Even though the strategy includes automated components, continuous monitoring of the trades and market conditions is necessary.
Adaptability: Markets can change over time. Traders need to be prepared to adapt the strategy as necessary to stay aligned with evolving market dynamics.

Engulfing Pattern BUY and SELL SystemThis indicator is based on multiple parameters such as the Open, High, Low, and Close of candles. We add confluences such as SMMA crossovers, engulfing candles, and the number of pips that it has moved from it.
The main parameter is the DFS (Distance from SMMA). This will adjust the number of signals you'll get. This parameter is calculated based on the Open price of the signal bar and the 50 SMMA price. If the difference between these two values is greater than the input value, it will not be considered a signal.
The buy/sell signal consists of the following conditions:
1. Engulfing Candle based on conditions
2. SMMA crossover (21 and 50 periods)
3. For BUYS, the RSI value is greater than 49. For SELLS, the RSI value is less than 51.
4. Open price of the signal bar is less/greater than the 50 SMMA for SELLS/BUYS respectively.
5. DFS value is less than or equal to the input value
We recommend backtesting this on FX Pairs, and metals such as Gold. It is not well suited for Crypto or Indices.
Ultimate Customizable EMA/SMAI know, not another EMA indicator, but I promise, I will make it worth your while!
About this indicator:
This is an EMA indicator, plain and simple. But its ultimate! And its ultimate in the sense that I have made it vastly customizable.
I made this indicator as a boring, single line indicator that would allow me to toggle to whichever EMA / SMA I wanted on whatever timeframe I wanted, because with the currently available EMAs and SMAs (and there are tons of them), I could never seem to get one with the precise settings I wanted.
Then I realized, if I struggled with this, chances are other people may be struggling with this. And also chances are not everyone is great with coding things quickly and it may be out of reach for those to code something specific to their individual needs and desires.
So this indicator is meant for those who, like me, may have very specific tastes for their EMA indicator and want to be able to tailor it right down to a T of what they want, but maybe don't have the skills to code things specifically the way they would like it.
So what can I do with it?
Well, you can do really whatever you want. I have made absolutely everything possible customizable, right down to the size of the plotted line (you can adjust the width of the line to make it more or less visible). But let me give you a list of the functions permitted for this indicator:
1. Toggle between an EMA or SMA: The indicator will default to show the EMA. However, you can toggle between an EMA or SMA, depending on your preference.
2. Add 2 EMA's or SMAs: The indicator permits up to 2 EMA's to be added. Both of which can be either EMA or SMA and operate independently (you can have one as EMA and the other as SMA, both as SMA or whatever combination thereof).
3. Specify your timeframes: Each EMA/SMA can have an individual timeframe. If you want to plot 2, 200 EMA's on your chart, 1 on the 5 minute chart and the other on the 1 Day chart, you can do it! The indicator will permit you to individually select which timeframe you want for both of the available EMAs/SMAs. They can both be on separate timeframes.
4. Specify your sources: In addition to both being able to be on separate timeframes, both can also be on separate sources. You can have the 200 EMA of the close price as well as the 200 EMA of the high or low price. The indicator will permit you to specify your preferred sources.
5. Plot Standard Deviation bands: You can plot the standard deviation bands of the primary EMA/SMA (this is only available on the primary EMA/SMA and not both). You can also specify the length of the standard deviation bands that can operate independently of the primary EMA/SMA. So if you have the 50 EMA but want the 200 standard deviation bands, you can do so and specify this in the data inputs.
6. Customize your alerts: The indicator provides 6 pre-programmed condition alerts that are applied to both the primary, secondary and both EMAs. This way, you can customize various alerts based on various conditions you want to look for.
7. Plot crossover / crossunder arrows: The indicator will allow you to request it to plot triangles to signal crossovers and crossunders. This can be toggled on and off based on your visual preference.
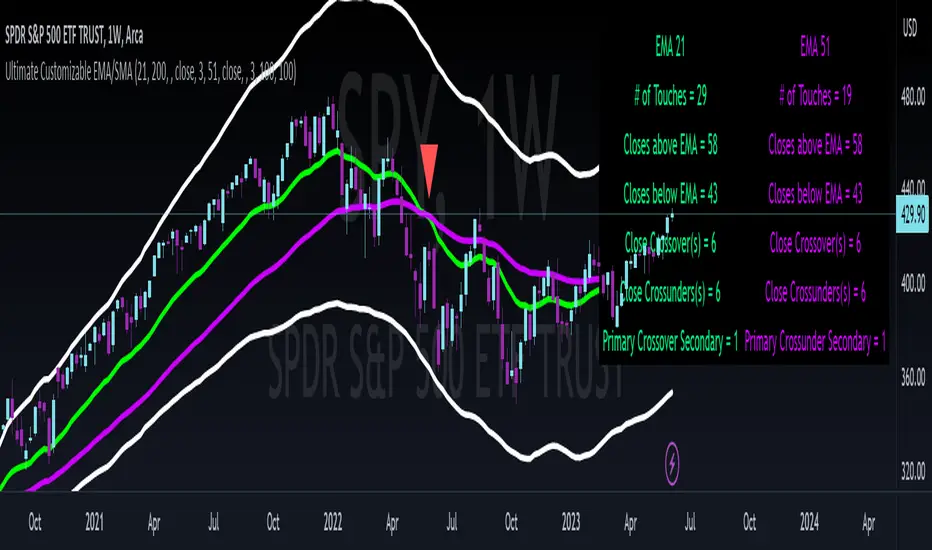
8. Provides demographic information: The EMA will provide basic demographic information about the stock's behaviour around the EMA/SMA. This is displayed in a table at the top right of the chart. It will tell you the number of touches a stock has with its various EMA/SMAs, how many closes it has had above or below the EMA/SMA (for example, a bullish ticker should have more closes above an EMA than below it and inverse for bearish), how many times the close price has crossed over or crossed under the two EMA/SMAs and how many time the EMA/SMAs have crossed over and crossed under each other. This all gives an idea of the relative strength and sentiment of a stock in a quantitative way. The length of the lookback period is customizable individually for each EMA/SMA. If you want to look back 100, 200, 500 or just 75 candles, you can specify. You can also toggle on and off each or both tables as you desire.
Final thoughts:
The indicator was meant to tailor to my general need to toggle between very specific EMAs and SMAs to gauge averages. I generally will look at various EMAs and SMAs to calculate various things and I never specifically rely on a single EMA and SMA. Its annoying having to switch between multiple indicators and I always ended up opening pinescript and coding in what exactly I wanted to look at. This was meant to stop me from having to constantly code something specifically each time I wanted very specific information and I felt like I should share it with the community, as if I find it helpful and useful, I hope others will, too!
Hopefully you find it helpful and useful and as always leave your suggestions below!
Multiple Moving Average ToolkitFeatures Overview:
Multiple Moving Averages: The script allows you to plot up to five different Moving Averages (MAs) on your chart at the same time. You can choose the type of MA (EMA, SMA, HMA, WMA, DEMA, VWMA, VWAP) and the length of each one.
Color Ribbon: You can turn the MAs into a color ribbon by selecting the "Turn into Color Ribbon?" option. This will make the area between the MAs colored and can help you identify trends more easily.
MA Value Table: You can draw a table on your chart that displays the current values of each MA, whether the trend is bullish or bearish along with the length of the MAs. The current ATR value is also shown in the last cell of the table. You can choose the location of the table (Top Left, Top Right, Bottom Left, Bottom Right) and the transparency of the background color.
Crosses: The script can detect when two MAs cross over each other (1st MA crosses 5th MA and vice versa), indicating a potential trend reversal. It will plot crosses on the chart at the point of the crossover and give an alert if the "Bullish Cross Detected" or "Bearish Cross Detected" condition is met.
How to use:
Once the script is added to your chart, you can customize the settings to fit your preferences. You can choose the type and length of each MA, whether to turn them into a color ribbon, whether to plot crosses, and whether to draw the MA Value Table.
The MA Value Table can be moved to a different location on the chart by selecting the "Location of Table" option and choosing Top Left, Top Right, Bottom Left, or Bottom Right.
Watch for MA crossovers and alerts to identify potential trend reversals. The script can help you identify bullish and bearish trends by color-coding the area between the MAs and displaying the current values of each MA in the table.
Breakdown of the script:
User Inputs
The first section of the script defines several user inputs that allows you to customize the indicator. These include options for turning the MAs into a color ribbon, plotting crosses when there is a bullish or bearish cross of the MAs, drawing a table of the MA values, and setting the transparency of the ribbon. You can also select the location of the MA value table and customize the settings for each individual MA.
Moving Average Calculation
The script defines a function called "getMA" that calculates the moving average for a given type and length. The function uses a switch statement to determine which type of moving average to use, such as an exponential moving average (EMA), simple moving average (SMA), Hull moving average (HMA), weighted moving average (WMA), double exponential moving average (DEMA), volume-weighted moving average (VWMA), or volume-weighted average price (VWAP).
The script then calls this function to calculate the values of up to five different MAs, depending on the user input. The ATR (average true range) is also calculated using the TA library.
Color Filter and Cross Detection
The script sets a color filter based on the relationship between the MAs. If the shorter-term MAs are above the longer-term MAs, the filter is set to green to indicate a bullish trend, and if the shorter-term MAs are below the longer-term MAs, the filter is set to red to indicate a bearish trend. You can adjust the transparency of the ribbon to make it more or less visible.
The script also detects when there is a bullish or bearish cross of the MAs and can generate alerts to notify you.
MA Plotting
The script plots up to five MAs on the chart, depending on the user input. The MAs are plotted as lines with different colors and thicknesses, and you can choose to turn them into a color ribbon if desired.
Cross Plotting
The script plots crosses on the chart when there is a bullish or bearish cross of the MAs. The crosses are plotted as X shapes at the location of the cross and are color-coded to indicate the direction of the cross.
MA Value Table
Finally, the script draws a table of the MA values on the chart, displaying the values of each MA as well as the current trend and the ATR. You can customize the location of the table, and the table is colored to match the color filter of the MAs.
Feel free to message me or comment on the post with any questions or issues!
Much more to come!
Thanks for reading, enjoy!

RSI Impact Heat Map [Trendoscope]Here is a simple tool to measure and display outcome of certain RSI event over heat map.
🎲 Process
🎯Event
Event can be either Crossover or Crossunder of RSI on certain value.
🎯Measuring Impact
Impact of the event after N number of bars is measured in terms of highest and lowest displacement from the last close price. Impact can be collected as either number of times of ATR or percentage of price. Impact for each trigger is recorded separately and stored in array of custom type.
🎯Plotting Heat Map
Heat map is displayed using pine tables. Users can select heat map size - which can vary from 10 to 90. Selecting optimal size is important in order to get right interpretation of data. Having higher number of cells can give more granular data. But, chart may not fit into the window. Having lower size means, stats are combined together to get less granular data which may not give right picture of the results. Default value for size is 50 - meaning data is displayed in 51X51 cells.
Range of the heat map is adjusted automatically based on min and max value of the displacement. In order to filter out or merge extreme values, range is calculated based on certain percentile of the values. This will avoid displaying lots of empty cells which can obscure the actual impact.
🎲 Settings
Settings allow users to define their event, impact duration and reference, and few display related properties. The description of these parameters are as below:
🎲 Use Cases
In this script, we have taken RSI as an example to measure impact. But, we can do this for any event. This can be price crossing over/under upper/lower bollinger bands, moving average crossovers or even complex entry or exit conditions. Overall, we can use this to plot and evaluate our trade criteria.
🎲 Interpretation
Q1 - If more coloured dots appear on the top right corner of the table, then the event is considered to trigger high volatility and high risk environment.
Q2 - If more coloured dots appear on the top left corner, then the events are considered to trigger bearish environment.
Q3 - If more coloured dots appear on the bottom left corner of the chart, then the events are considered insignificant as they neither generate higher displacement in positive or negative side. You can further alter outlier percentage to reduce the bracket and hence have higher distribution move towards
Q4 - If more coloured dots appear on the bottom right corner, then the events are considered to trigger bullish environment.
Will also look forward to implement this as library so that any conditions or events can be plugged into it.

Volatility-Weighted Moving Average SystemThis simple script creates a moving average system weighted by volatility. The moving averages are less sensitive to price action than the typical moving averages we use, and their crossovers can be used to identify extended trends.
I've colored the background depending on trend. Ideally in the future, I'll draw long or short signals on-chart depending on the width between the bands, which works as a faster indicator of trend-change than crossover does.
Hope you all enjoy. Happy holidays.