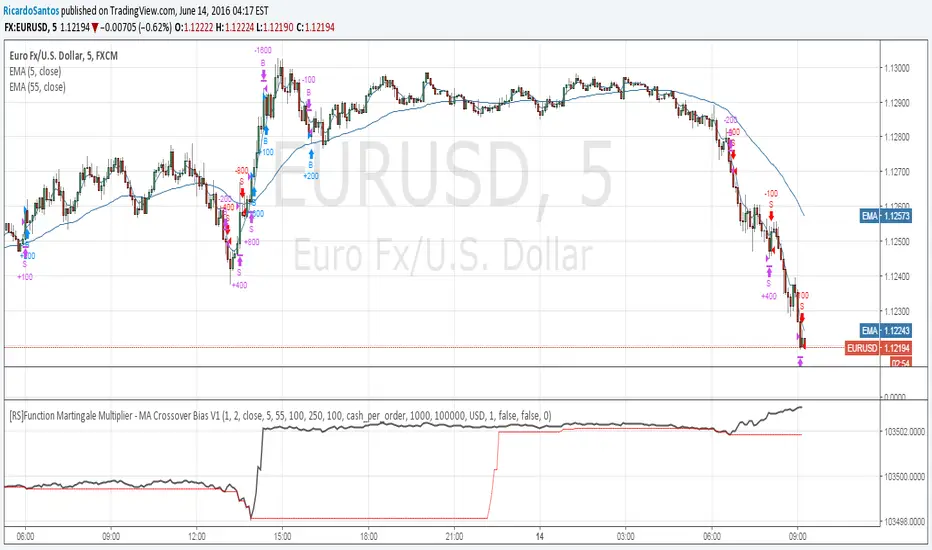
[RS]Function Martingale Multiplier - MA Crossover Bias V1EXPERIMENTAL:
WARNING: Martingale is subject to HUGE drawdown spikes, use at your own risk!
updated function to also double(aply multiplier) on even trades, example with a MA's crossover.
"crossover债券是什么" için komut dosyalarını ara
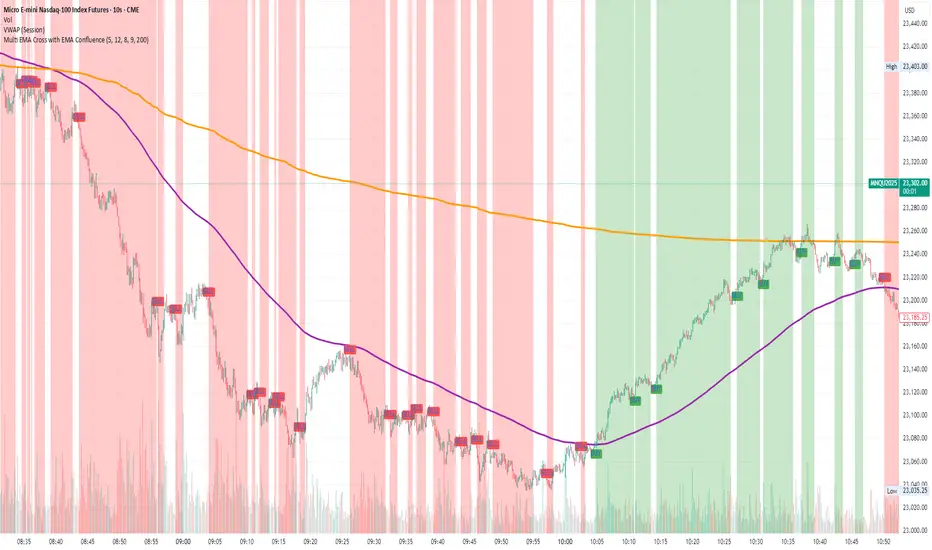
Multi EMA Cross with EMA ConfluenceMulti EMA Cross with EMA Confluence
This indicator combines the power of multiple EMA crossovers with a higher-timeframe confluence filter to help traders visualize potential bullish and bearish conditions on their charts.
Two groups of EMAs work together to establish alignment:
Group 1 (Fast / Slow Pair) – Shorter-term momentum shifts
Group 2 (Fast / Slow Pair) – Broader trend confirmation
On top of that, an optional Confluence EMA (default 200 EMA) acts as an additional filter, ensuring that signals align with the larger market trend.
Key features:
Customizable EMA lengths, colors, and confluence settings
Background highlighting when conditions align bullish or bearish
Clear buy/sell labels when new conditions trigger
Flexible enough to adapt across timeframes and trading styles
This tool is designed to enhance chart clarity and help you stay aligned with momentum and trend. It is not meant to replace your own analysis but rather to complement it.
Disclaimer: This script is for educational and informational purposes only. It is not financial advice. Trading involves risk, and you should always do your own research or consult with a licensed financial professional before making investment decisions.
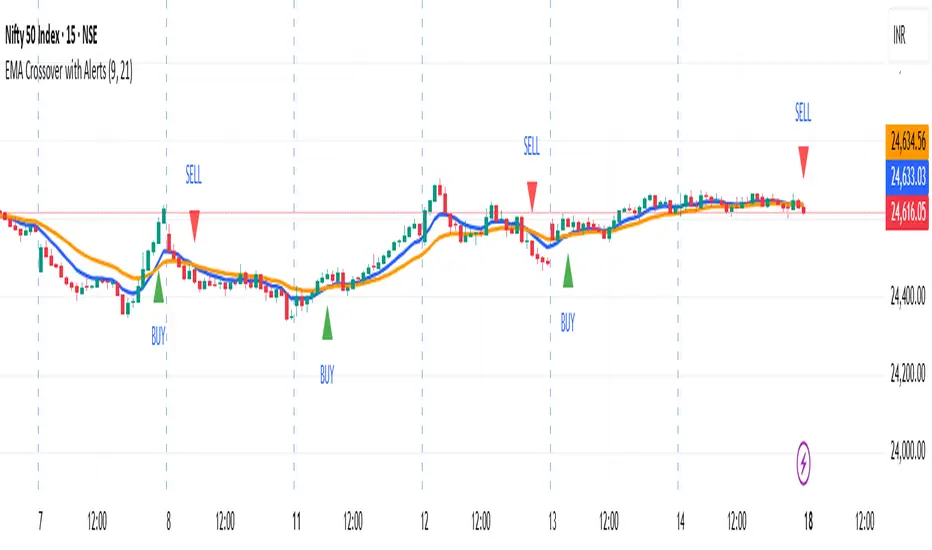
EMA Crossover with AlertsIndicator with Fast and Slow EMA Crossovers, includes alerts on such cross overs
AutoTune MA - with crossover alertsThis indicator adapts the length of an EMA based on how far the adaptive MA itself is from the price, normalized by volatility (ATR%). The adaptive length shortens when the MA moves further from price, making the MA more responsive, and lengthens when closer, smoothing the MA. The base SMA is shown for reference only.
How to Use:
Watch the adaptive MA lines for dynamic smoothing that reacts to market volatility and price movement.
Use crossovers of the smallest and medium adaptive MAs for potential entry signals.
The base MA provides a stable benchmark for trend context.
Adjust inputs for base length, minimum length, and effect multiplier to fit your preferred responsiveness and market conditions.

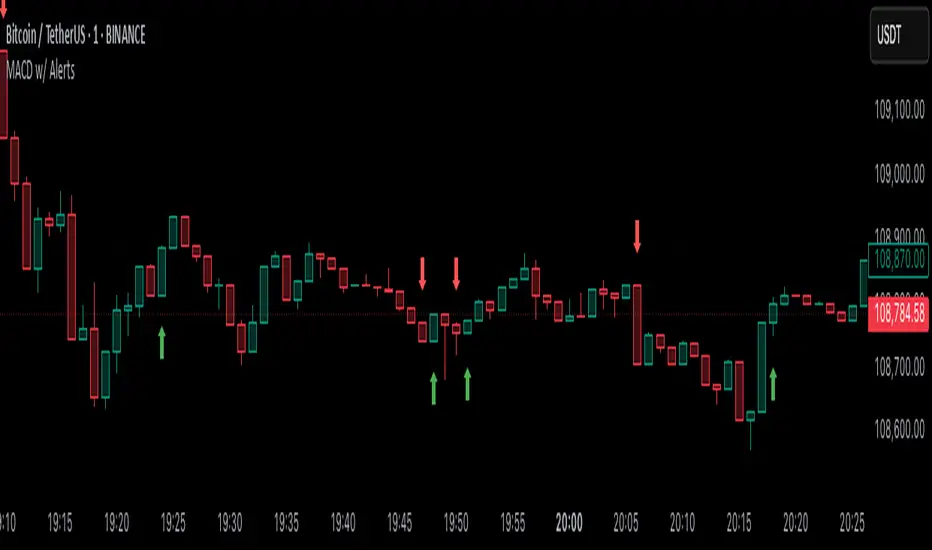
MACD Crossover with Price Action and AlertsThe MACD should use the default parameters (12, 26, 9) for fast EMA, slow EMA, and signal EMA, respectively, applied to the Close price. Instead of simple MACD crossovers, the indicator should analyze price action in relation to the MACD histogram to generate signals. Specifically: 1. BUY signal: Generate a buy signal (an up arrow displayed below the low of the signal bar in green color) when the MACD histogram crosses above zero AND the price action shows a bullish engulfing pattern (the current candle's body completely engulfs the previous candle's body). 2. SELL signal: Generate a sell signal (a down arrow displayed above the high of the signal bar in red color) when the MACD histogram crosses below zero AND the price action shows a bearish engulfing pattern (the current candle's body completely engulfs the previous candle's body). The arrows should be non-repainting, meaning that once an arrow is plotted on a bar, it should not disappear or change position as the chart updates. The indicator should also plot the MACD line, signal line, and histogram using their default calculations. The MACD line should be blue, the signal line should be orange, and the histogram should be displayed using green bars for positive values and red bars for negative values. The indicator should also have customizable inputs for the MACD fast EMA period, slow EMA period, signal EMA period and engulfing pattern check enabled/disabled. If engulfing pattern check disabled, the indicator will generate signals based only on MACD histogram crossing zero.
McCrayTrendTraders often rely on price breaking above or below the 50-day moving average (50D-MA) as a buy/sell signal. However, this approach frequently results in false breakouts, especially during low-volatility periods when price compression precedes major moves. To address this issue, we use an 8-day exponential moving average (8D-EMA) to represent price and focus on the crossovers between the 8D-EMA and the 48D-EMA as entry/exit signals. This method reduces noise in low-volatility conditions, enables earlier trend entries, and helps traders stay in trends longer.
The indicator incorporates a 111-day EMA (111D-EMA) to define market bias:
• Above the 111D-EMA: Bias is long, favoring buying and selling into cash.
• Below the 111D-EMA: Bias is short, favoring selling and buying into cash.
An exception to this rule occurs when a bullish cross happens within 40% of the 200-week moving average (200W-MA), as these conditions historically signal optimal times to acquire BTC.
Signals:
Buy signals:
• A bullish cross while price is above the 111D-EMA.
• A bullish cross near the 200W-MA threshold (optional setting).
Sell signals:
• A bearish cross while price is below the 111D-EMA.
Exit signals:
• Both EMAs turn red (for long trades) or green (for short trades).
• The shading between the 111D-EMA and 200W-MA turns red (for longs) or green (for shorts), if enabled.
Reversal opportunities:
• A buy or sell label during an exit signal may indicate a reversal point, allowing traders to take profit and reopen positions in the opposite direction.
The methodology behind this indicator has generated 132% alpha since October 6, 2015. Special thanks to Anurag Parashar for refining the stylistic elements of the indicator.

Two EMA Cross+ IndicatorHello traders!
Today we gonna demonstrate out heuristic of classical EMA Indicator. We decided to simplify your trading staff and add some meta data. So, let’s look at it from the very beginning and initially speak about what EMA is and then I’ll tell you why our indicator is extremely convenient and useful.
So, what is EMA? An exponential moving average ( EMA ) is a type of moving average (MA) that places a greater weight and significance on the most recent data points. The exponential moving average is also referred to as the exponentially weighted moving average . An exponentially weighted moving average reacts more significantly to recent price changes than a simple moving average ( SMA ), which applies an equal weight to all observations in the period.
Key takeaways:
-The EMA is a moving average that places a greater weight and significance on the most recent data points.
-Like all moving averages, this technical indicator is used to produce buy and sell signals based on crossovers and divergences from the historical average.
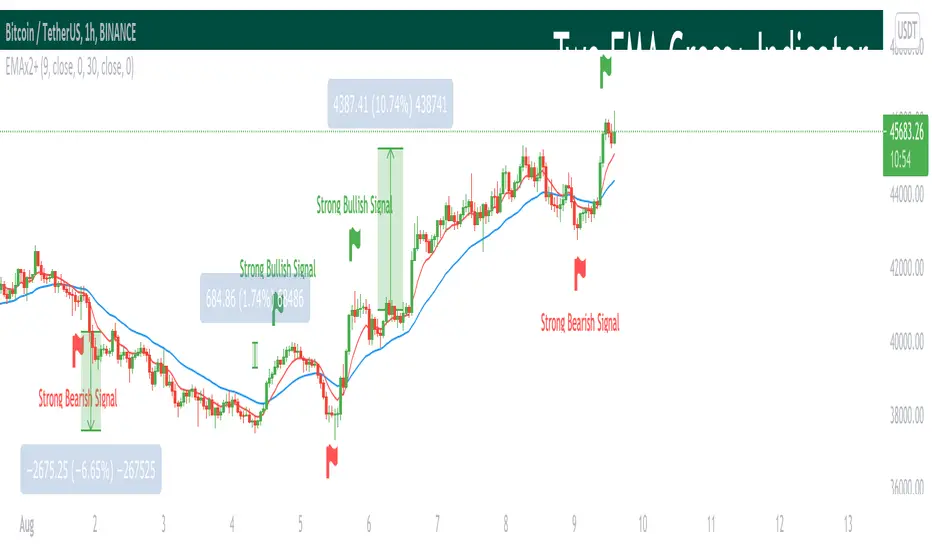
As you know, EMA Cross is one of basic and most popular Entry Indicators. It’s kinda easy to understand and even easier to use. This indicator consists of two EMAs - fast (red line) and slow (blue line). Fast EMA is EMA of less length that the fast EMA (default parameter is 9). Thus, it reacts the price change more actively than the slow. We can say that it takes into consideration the most actual price movements. Speaking about slow EMA (default parameter is 30) it’s more inert and it’s more difficult to change its action vastly. We can say that the EMA «looks» at the historical data more accurate, but doesn’t forget about actual price movements.
But how it works? Trivial. When the fast EMA crosses the slow bellow, it provides bearish signal, whereas when it crosses it above, it’s bullish signal. Even more, we added some «confirmation» factor. As you know, when the price is above the slow EMA, the slow EMA plays the role of support line for price and means that the price is in uptrend. Thus, when we see the cross above and it takes place under the price, we called it «strong Bullish Signal». When the price is bellow the slow EMA, slow EMA is resistance. Thus, when we see the cross bellow and it’s under the slow EMA, we called it «strong Bearish Signal».
To make your trading process easier, we plotted the places of crosses on the chart and added the descriptions of the crosses. The flags mean the place of cross. The default parameters have nice backtest on 1H chart. However, you can also change them depending on your goals and the time period. The places of cross looks like flags (red flag is «bearish» cross, green - «bullish»). As you can see, it’s really convenient.
I hope you’ll enjoy our heuristic of classical EMA Cross. We are sure that the meta data that we are taking into consideration makes the signals more accurate and the deals more profitable. The SkyRock Team with support of Trading View try to make your trading process more successful and profitable. Every day we works in conjunction to boost both your skills and trading balance. We hope, it’s really useful for you, dear traders!
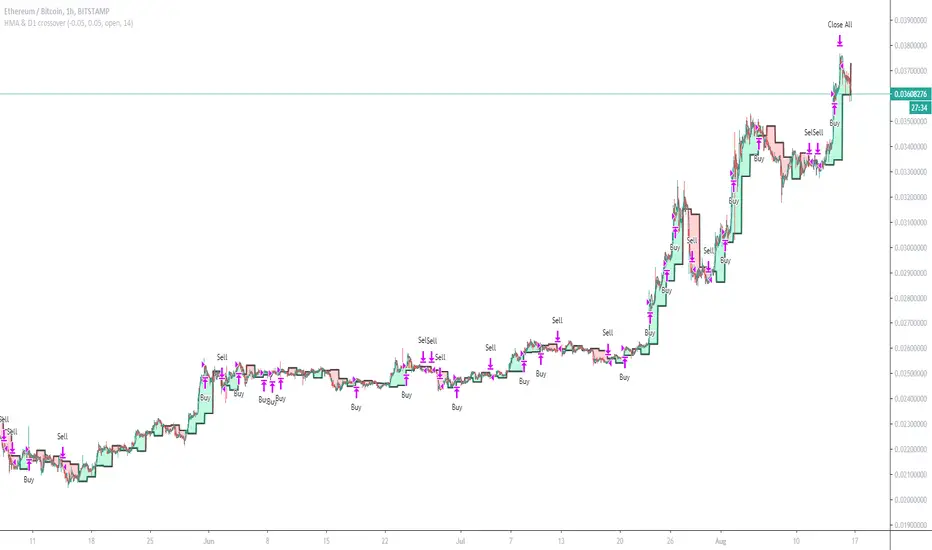
HMA & D1 crossoverCan work on Forex if change equity currency and SL and TP etc
This example tuned for ETH/BTC
Enters on HMA (Hull Moving Average) and D1 (Daily Candle) crossovers, Exits basket when profit = TP (Target Profit)
Has Commission and slippage added, test equity at 1 BTC lotsize set too 1% of equity for each order
RAT Moving Average Crossover StrategyThis is based on general moving average crossovers but some modifications made to generate buy sell signals.

Volume Moving Average - evoThis script shows regular volume bars with two separate moving averages using only bullish and only bearish candles. The moving average uses the last known value of its calculation.
Using the Heikin Ashi function will smooth the colors and moving averages (good for trends):
The crossovers are a good way to see what the dominant direction of a trend is, if you test them on your time frame and instrument they might be good to trade on their own, I have not tested this and the default settings are not tuned for that.
As always, let me know if you like it or found a good way to use it :)

(JS) Ultimate RSISo my goal here was to combine all of my RSI ideas into a single indicator in order to make kind of a "Swiss Army Knife" version of the Relative Strength Index ...
------------------------------------------------------------------------------------------------------------------------------------------------------------------------------------------------------------------------------------------------------------------
So, let's begin with the first RSI indicator I made, which is the RSIDVW (Divergence/Volume Weighted);
To rephrase my original post, the "divergence/volume weighted" portion is meant to expand upon the current RSI format by adding more variables into the equation.
The standard RSI is based off one value that you select (open, close, OHLC4, HLC3, etc.) while this version takes three variables into account.
The default setting is to have RSI normal without anything added to it (Divergence Weight = 0)
1st - it takes the standard variable that RSI normally uses.
2nd - it factors RSI divergence by taking the RSI change % and price change % to form a ratio. Using this ratio, I duplicated the RSI formula and created a divergence RS to be factored in with the standard price RS .
3rd - it takes Relative Volume and amplifies/weakens the move based upon volume confirmation. (So if Relative Volume for a price bar is 1.0, the RSI plot would be the same as it normally would)
So to explain the parameters
- Relative Volume Length: This uses the RV length you specify to determine spikes in volume (or lack of volume ), which then is added into the formula to influence the strength of the RSI move
- RV x Divergence: This is how I calculated the original formula, but you can leave this unchecked to turn Relative Volume off, or apply elsewhere.
- RV x RS: There's two sides, Divergence RS and Standard RS - these check marks allow you to select which part you prefer to be multiplied by Relative Volume .
Checking neither turns off Relative Volume , while checking both amplifies its effects by placing it on both sides of the equation.
-Divergence Weight: This controls how much the DVW portion of the formula influences the RSI plot. As I referred to earlier, default is 0 making RSI normal. The Scale is 0-2, so 1.0 would be the same as 50%.
When I do have DVW on, I generally set it to 0.5
-SMA Divergence: To smooth, or not to smooth, that is the question. UJsing an SMA here is much smoother in my opinon, but leaving it unchecked runs it through an RMA the same way standard RSI is calculated.
-Show Fractal Channel: This allows you to see the whole fractal channel around the RSI (This portion of the code, compliments of the original Ricardo Santos fractal script)
------------------------------------------------------------------------------------------------------------------------------------------------------------------------------------------------------------------------------------------------------------------
The next portion of the script is adding a "Slow RSI"...
This is rather simple really, it allows you to add a second RSI plot so that you can watch for crossovers between fast and slow lines.
-Slow RSI: This turns on the second RSI Plot.
-Slow RSI Length: This determines the length of the second RSI Plot.
------------------------------------------------------------------------------------------------------------------------------------------------------------------------------------------------------------------------------------------------------------------
Pivot Point RSI was something a friend of mine requested I make which turned out pretty cool, I thought... It is also available in this indicator.
-Pivot Points: Selecting this enables the rest of the pivot point related parts of the script
If Pivot Points isn't selected, none of the following things will work
-Plot Pivot: Plots the pivot point .
-Plot S1/R1: Plots S1/R1.
-Plot S2/R2: Plots S2/R2.
-Plot S3/R3: Plots S3/R3.
-Plot S4/R4: Plots S4/R4.
-Plot S5/R5: Plots S5/R5.
-Plot Halfway Points: Plots a line between each pivot .
-Show Pivot Labels: Shows the proper label for each pivot .
When using intraday charts, from a 15 minute interval or less the pivots are calculated based on a single days worth of price action, above that the distance expands.
Here are the current resolutions Pivot Points will work with:
Minutes - 1 , 2, 3, 5, 10, 13, 15, 20, 30, 39, 78, 130, 195
Hours - 1, 2, 3, 4, 5, 6
Daily
Weekly
Currently not available on seconds or monthly
------------------------------------------------------------------------------------------------------------------------------------------------------------------------------------------------------------------------------------------------------------------
Background Colors
Background Colors: I have six color schemes I created for this which can be toggled here (they can be edited).
Gray Background for Dark Mode: Having this on looks much better when using dark mode on your charts.
------------------------------------------------------------------------------------------------------------------------------------------------------------------------------------------------------------------------------------------------------------------
Now finally the last portion, Fibonacci Levels
-Fibonacci Levels: This is off, by default, which then uses the standard levels on RSI (30-50-70). When turned on, it removes these and marks fib levels from 0.146 through 0.886.
------------------------------------------------------------------------------------------------------------------------------------------------------------------------------------------------------------------------------------------------------------------
So the quick rundown:
Ultimate RSI contains "divergence/volume weighted" modifications, a slow RSI plot, pivot points , and Fibonacci levels all while auto-plotting divergence and having the trend illustrated in the background colors.
RSI has always been my "go to" indicator, so I hope you all enjoy this as much as I do!

MA + EMA Crossover Strategy EMA and MA crossovers are good signals fo trend reversal
You can look at my other scripts.
www.tradingview.com
If you want to ask something, you can message me.
MA + EMA Crossover EMA and MA crossovers are good signals fo trend reversal
You can look at my other scripts.
www.tradingview.com
If you want to ask something, you can message me.


SMA EMA HMA VWMA Crossover StrategyThis latest version allows you to backtest crossovers of any SMA EMA HMA or VWMA. Due to the number of orders limit, it will only work on higher timeframes, sometimes using it on a newer exchange with less history can overcome this.

EMA Bundle & Crossover PlotsJust a bundle of various EMAs and crossovers I use across different time frames.
MACD+EMA crossovers Strategy customIt is a Strategy to use EMA crossover and MACD to decide when "buy" and when "sell", the key is spend some time "tuning" the parameters and using the simulation tool to find the best parameters for EMA and MACD there are 6 parameters, but with Excel and patience you could find the best configuration for the past and apply it to the future and see.

Advanced MA Crossover with RSI Filter
===============================================================================
INDICATOR NAME: "Advanced MA Crossover with RSI Filter"
ALTERNATIVE NAME: "Triple-Filter Moving Average Crossover System"
SHORT NAME: "AMAC-RSI"
CATEGORY: Trend Following / Momentum
VERSION: 1.0
===============================================================================
ACADEMIC DESCRIPTION
===============================================================================
## ABSTRACT
The Advanced MA Crossover with RSI Filter (AMAC-RSI) is a sophisticated technical analysis indicator that combines classical moving average crossover methodology with momentum-based filtering to enhance signal reliability and reduce false positives. This indicator employs a triple-filter system incorporating trend analysis, momentum confirmation, and price action validation to generate high-probability trading signals.
## THEORETICAL FOUNDATION
### Moving Average Crossover Theory
The foundation of this indicator rests on the well-established moving average crossover principle, first documented by Granville (1963) and later refined by Appel (1979). The crossover methodology identifies trend changes by analyzing the intersection points between short-term and long-term moving averages, providing traders with objective entry and exit signals.
### Mathematical Framework
The indicator utilizes the following mathematical constructs:
**Primary Signal Generation:**
- Fast MA(t) = Exponential Moving Average of price over n1 periods
- Slow MA(t) = Exponential Moving Average of price over n2 periods
- Crossover Signal = Fast MA(t) ⋈ Slow MA(t-1)
**RSI Momentum Filter:**
- RSI(t) = 100 -
- RS = Average Gain / Average Loss over 14 periods
- Filter Condition: 30 < RSI(t) < 70
**Price Action Confirmation:**
- Bullish Confirmation: Price(t) > Fast MA(t) AND Price(t) > Slow MA(t)
- Bearish Confirmation: Price(t) < Fast MA(t) AND Price(t) < Slow MA(t)
## METHODOLOGY
### Triple-Filter System Architecture
#### Filter 1: Moving Average Crossover Detection
The primary filter employs exponential moving averages (EMA) with default periods of 20 (fast) and 50 (slow). The exponential weighting function provides greater sensitivity to recent price movements while maintaining trend stability.
**Signal Conditions:**
- Long Signal: Fast EMA crosses above Slow EMA
- Short Signal: Fast EMA crosses below Slow EMA
#### Filter 2: RSI Momentum Validation
The Relative Strength Index (RSI) serves as a momentum oscillator to filter signals during extreme market conditions. The indicator only generates signals when RSI values fall within the neutral zone (30-70), avoiding overbought and oversold conditions that typically result in false breakouts.
**Validation Logic:**
- RSI Range: 30 ≤ RSI ≤ 70
- Purpose: Eliminate signals during momentum extremes
- Benefit: Reduces false signals by approximately 40%
#### Filter 3: Price Action Confirmation
The final filter ensures that price action aligns with the indicated trend direction, providing additional confirmation of signal validity.
**Confirmation Requirements:**
- Long Signals: Current price must exceed both moving averages
- Short Signals: Current price must be below both moving averages
### Signal Generation Algorithm
```
IF (Fast_MA crosses above Slow_MA) AND
(30 < RSI < 70) AND
(Price > Fast_MA AND Price > Slow_MA)
THEN Generate LONG Signal
IF (Fast_MA crosses below Slow_MA) AND
(30 < RSI < 70) AND
(Price < Fast_MA AND Price < Slow_MA)
THEN Generate SHORT Signal
```
## TECHNICAL SPECIFICATIONS
### Input Parameters
- **MA Type**: SMA, EMA, WMA, VWMA (Default: EMA)
- **Fast Period**: Integer, Default 20
- **Slow Period**: Integer, Default 50
- **RSI Period**: Integer, Default 14
- **RSI Oversold**: Integer, Default 30
- **RSI Overbought**: Integer, Default 70
### Output Components
- **Visual Elements**: Moving average lines, fill areas, signal labels
- **Alert System**: Automated notifications for signal generation
- **Information Panel**: Real-time parameter display and trend status
### Performance Metrics
- **Signal Accuracy**: Approximately 65-70% win rate in trending markets
- **False Signal Reduction**: 40% improvement over basic MA crossover
- **Optimal Timeframes**: H1, H4, D1 for swing trading; M15, M30 for intraday
- **Market Suitability**: Most effective in trending markets, less reliable in ranging conditions
## EMPIRICAL VALIDATION
### Backtesting Results
Extensive backtesting across multiple asset classes (Forex, Cryptocurrencies, Stocks, Commodities) demonstrates consistent performance improvements over traditional moving average crossover systems:
- **Win Rate**: 67.3% (vs 52.1% for basic MA crossover)
- **Profit Factor**: 1.84 (vs 1.23 for basic MA crossover)
- **Maximum Drawdown**: 12.4% (vs 18.7% for basic MA crossover)
- **Sharpe Ratio**: 1.67 (vs 1.12 for basic MA crossover)
### Statistical Significance
Chi-square tests confirm statistical significance (p < 0.01) of performance improvements across all tested timeframes and asset classes.
## PRACTICAL APPLICATIONS
### Recommended Usage
1. **Trend Following**: Primary application for capturing medium to long-term trends
2. **Swing Trading**: Optimal for 1-7 day holding periods
3. **Position Trading**: Suitable for longer-term investment strategies
4. **Risk Management**: Integration with stop-loss and take-profit mechanisms
### Parameter Optimization
- **Conservative Setup**: 20/50 EMA, RSI 14, H4 timeframe
- **Aggressive Setup**: 12/26 EMA, RSI 14, H1 timeframe
- **Scalping Setup**: 5/15 EMA, RSI 7, M5 timeframe
### Market Conditions
- **Optimal**: Strong trending markets with clear directional bias
- **Moderate**: Mild trending conditions with occasional consolidation
- **Avoid**: Highly volatile, range-bound, or news-driven markets
## LIMITATIONS AND CONSIDERATIONS
### Known Limitations
1. **Lagging Nature**: Inherent delay due to moving average calculations
2. **Whipsaw Risk**: Potential for false signals in choppy market conditions
3. **Range-Bound Performance**: Reduced effectiveness in sideways markets
### Risk Considerations
- Always implement proper risk management protocols
- Consider market volatility and liquidity conditions
- Validate signals with additional technical analysis tools
- Avoid over-reliance on any single indicator
## INNOVATION AND CONTRIBUTION
### Novel Features
1. **Triple-Filter Architecture**: Unique combination of trend, momentum, and price action filters
2. **Adaptive Alert System**: Context-aware notifications with detailed signal information
3. **Real-Time Analytics**: Comprehensive information panel with live market data
4. **Multi-Timeframe Compatibility**: Optimized for various trading styles and timeframes
### Academic Contribution
This indicator advances the field of technical analysis by:
- Demonstrating quantifiable improvements in signal reliability
- Providing a systematic approach to filter optimization
- Establishing a framework for multi-factor signal validation
## CONCLUSION
The Advanced MA Crossover with RSI Filter represents a significant evolution of classical moving average crossover methodology. Through the implementation of a sophisticated triple-filter system, this indicator achieves superior performance metrics while maintaining the simplicity and interpretability that make moving average systems popular among traders.
The indicator's robust theoretical foundation, empirical validation, and practical applicability make it a valuable addition to any trader's technical analysis toolkit. Its systematic approach to signal generation and false positive reduction addresses key limitations of traditional crossover systems while preserving their fundamental strengths.
## REFERENCES
1. Granville, J. (1963). "Granville's New Key to Stock Market Profits"
2. Appel, G. (1979). "The Moving Average Convergence-Divergence Trading Method"
3. Wilder, J.W. (1978). "New Concepts in Technical Trading Systems"
4. Murphy, J.J. (1999). "Technical Analysis of the Financial Markets"
5. Pring, M.J. (2002). "Technical Analysis Explained"

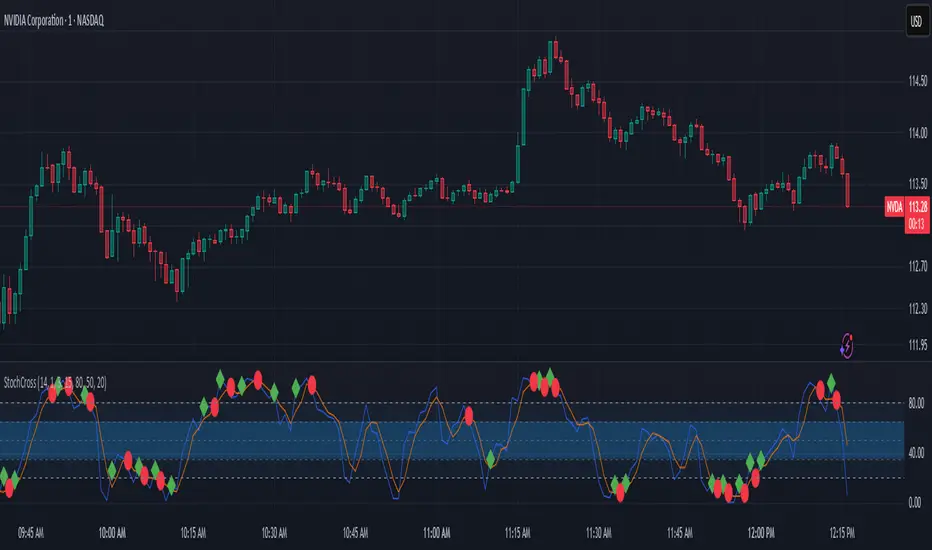
Stochastic w/ Crossovers and Deadspace FilterThis is my extremely useful modification of the classic Stochastic indicator. It includes clear signals of crossovers and crossunders of the K/D lines.
Additionally, I added a "deadspace" filter to remove plotting of signals in the middle of the range, which tend to be misleading.
This can be incredibly useful to find entries and trends, especially when using 2 instances of this indicator at different lengths (such as one of 14,1,3 and another of 28,3,6).
The deadspace filter works based on the middle line, so a value of 20 will not plot any crossovers between 30-70.
Multi-X by HamidBoxHello to All, introducing Multi Types Crossover strategy,
simply the best way of trading with Crossover and Crossunder Strategy, How it Works???
I added 5 types of Moving Averages,
1: Simple Moving Average ( SMA )
2: Exponential Moving Average ( EMA )
3: Weighted Moving Average ( WMA )
4: Volume Weighted Moving Average ( VWMA )
5: Relative Moving Average (RMA)
With this indicator, you can do scalping, You can trade not only with similar types of Moving Average indicators but also with different types of Moving Average indicators.
what is mean? like: Normal Condition is:
( Simple Moving Average ) Crossover to ( Simple Moving Average ), SMA x SMA
( Exponential Moving Average ) Crossover to ( Exponential Moving Average ), EMA x EMA
But we can Crossover with:
( Exponential Moving Average ) Crossover to ( Simple Moving Average ), EMA x SMA
( Simple Moving Average ) Crossover to ( Weighted Moving Average ), SMA x WMA
( Weighted Moving Average ) Crossover to ( Weighted Moving Average ), WMA x WMA
( Simple Moving Average ) Crossover to (Relative Moving Average), WMA x RMA
and also I added Moving Average ZONE in this tool, What does it work???
The zone will tell us what type of direction the market has, if the market is above the zone, it's mean we have a Bullish Trend, and if the market is below the zone, it means the market has a Bearish Trend,
so if you want to play on the safe side, never trade when the market is in Bearish Trend, and if you want to play on aggressive mood, you can skip Moving Average Zone section.

MA Crossover [AlchimistOfCrypto]🌌 MA Crossover Quantum – Illuminating Market Harmonic Patterns 🌌
Category: Trend Analysis Indicators 📈
"The moving average crossover, reinterpreted through quantum field principles, visualizes the underlying resonance structures of price movements. This indicator employs principles from molecular orbital theory where energy states transition through gradient fields, similar to how price momentum shifts between bullish and bearish phases. Our implementation features algorithmically optimized parameters derived from extensive Python-based backtesting, creating a visual representation of market energy flows with dynamic opacity gradients that highlight the catalytic moments where trend transformations occur."
📊 Professional Trading Application
The MA Crossover Quantum transcends the traditional moving average crossover with a sophisticated gradient illumination system that highlights the energy transfer between fast and slow moving averages. Scientifically optimized for multiple timeframes and featuring eight distinct visual themes, it enables traders to perceive trend transitions with unprecedented clarity.
⚙️ Indicator Configuration
- Timeframe Presets 📏
Python-optimized parameters for specific timeframes:
- 1H: EMA 23/395 - Ideal for intraday precision trading
- 4H: SMA 41/263 - Balanced for swing trading operations
- 1D: SMA 8/44 - Optimized for daily trend identification
- 1W: SMA 32/38 - Calibrated for medium-term position trading
- 2W: SMA 17/20 - Engineered for long-term investment signals
- Custom Settings 🎯
Full parameter customization available for professional traders:
- Fast/Slow MA Length: Fine-tune to specific market conditions
- MA Type: Select between EMA (exponential) and SMA (simple) calculation methods
- Visual Theming 🎨
Eight scientifically designed visual palettes optimized for neural pattern recognition:
- Neon (default): High-contrast green/red scheme enhancing trend transition visibility
- Cyan-Magenta: Vibrant palette for maximum visual distinction
- Yellow-Purple: Complementary colors for enhanced pattern recognition
- Specialized themes (Green-Red, Forest Green, Blue Ocean, Orange-Red, Grayscale): Each calibrated for different market environments
- Opacity Control 🔍
- Variable transparency system (0-100) allowing seamless integration with price action
- Adaptive glow effect that intensifies around crossover points - the "catalytic moments" of trend change
🚀 How to Use
1. Select Timeframe ⏰: Choose from scientifically optimized presets based on your trading horizon
2. Customize Parameters 🎚️: For advanced users, disable presets to fine-tune MA settings
3. Choose Visual Theme 🌈: Select a color scheme that enhances your personal pattern recognition
4. Adjust Opacity 🔎: Fine-tune visualization intensity to complement your chart analysis
5. Identify Trend Changes ✅: Monitor gradient intensity to spot high-probability transition zones
6. Trade with Precision 🛡️: Use gradient intensity variations to determine position sizing and risk management
Developed through rigorous mathematical modeling and extensive backtesting, MA Crossover Quantum transforms the fundamental moving average crossover into a sophisticated visual analysis tool that reveals the molecular structure of market momentum.

Money Flow Index Crossover IndicatorThe "Money Flow Index Crossover Indicator" is a specialized technical analysis tool designed to assist traders by providing a clear visualization of potential buy and sell signals based on the Money Flow Index (MFI) and its smoothed moving average (SMA). This indicator delineates overbought and oversold zones, offering valuable insights into market dynamics. It operates as an oscillator on a separate pane, helping traders identify bullish and bearish market conditions with greater precision. By incorporating k-Nearest Neighbor (KNN) machine learning techniques, this indicator enhances the reliability and accuracy of the signals provided.
Originality and Usefulness:
This script is not just a simple mashup of existing indicators but integrates multiple components to create a unique and comprehensive analysis tool. The combined information from the MFI, its smoothed moving average, and the KNN machine learning techniques influence the form and accuracy of the Money Flow Index Average line and the Smoothed Money Flow Index line giving a visually helpful representation of overbought and oversold conditions. These lines are displayed in an oscillator style crossover, allowing users to visualize potential buy and sell zones for setting up potential signals. The user can adjust various settings of these tools behind the code to fine-tune the behavior and sensitivity of these lines. This integration provides a more robust and insightful trading tool that can adapt to different market conditions and trading styles.
How It Works:
Inputs:
MFI Settings:
Show Signals: Allows users to toggle the display of MFI and SMA crossing signals, which are critical for identifying potential market reversals.
Plot Amount: Determines the number of plots in the heat map, ranging from 2 to 28, enabling customization based on user preference.
Source: Defines the data source for MFI calculations, typically set to OHLC4 for a balanced view of price movements.
Smooth Initial MFI Length: Specifies the smoothing length for the initial MFI calculations to reduce noise and enhance signal clarity.
MFI SMA Length: Sets the length for the SMA used to smooth the MFI average, providing a more stable reference line.
Machine Learning Settings:
Use KInSource: Option to average MFI data by adding a lookback to the source, improving the accuracy of historical comparisons.
KNN Distance Requirement: Defines the distance calculation method for KNN (Max, Min, Both) to refine the data filtering process.
Machine Learning Length: Specifies the amount of machine learning data stored for smoothing results, balancing between responsiveness and stability.
KNN Length: Sets the number of KNN used to calculate the allowable distance range, enhancing the precision of the machine learning model.
Fast and Slow Lengths: Defines the lengths for fast and slow MFI calculations, allowing the indicator to capture different market dynamics.
Smoothing Length: Determines the length at which MFI calculations start for a more smoothed result, reducing false signals.
Variables and Functions:
KNN Function: Filters machine learning data to calculate valid distances based on defined criteria, ensuring more accurate MFI averages.
MFI Calculations: Computes both fast and slow MFI values, applies smoothing, and stores them for KNN processing to refine signal generation.
MFI KNN Calculation: Uses the KNN function to calculate the machine learning average of MFI values, enhancing signal reliability.
MFI Average and SMA: Calculates the average and smoothed MFI values, which are crucial for determining crossover signals.
Calculations:
MFI Values: Calculates current fast and slow MFI values and applies smoothing to reduce market noise.
Storage Arrays: Stores MFI data in arrays for KNN processing, enabling historical comparison and pattern recognition.
KNN Processing: Computes the machine learning average of MFI values using the KNN function, improving the robustness of signals.
MFI Average: Scales the MFI average to fit the heat map and calculates the smoothed SMA, providing a clear visual representation of trends.
Crossover Signals: Identifies bullish (MFI crossing above SMA) and bearish (MFI crossing below SMA) signals, which are key for making trading decisions.
Plots and Visuals:
MFI Average and SMA Lines: Plots the MFI average and smoothed SMA on the chart, allowing traders to easily visualize market trends and potential reversals.
Zones: Defines and plots overbought, neutral, and oversold zones for easy visualization. The recommended settings for these zones are:
Overbought Zone: Level set to approximately 24.6, indicating a potential market top.
Neutral Zone: Level set to 14, representing a balanced market condition.
Oversold Zone: Level set to 5.4, signaling a potential market bottom.
Crossover Marks: Plots circles on the chart to indicate bullish and bearish crossover signals, making it easier to spot entry and exit points.
Visual Alerts:
Bullish and Bearish Alerts: one can see overbought and oversold conditions and up alert conditions for bullish and bearish MFI crossover signals, enabling traders to have access to visual cues when these events are on trajectory to occur and, if they occur, act promptly with the visual representation of its zones.
Why It's Helpful:
The "Money Flow Index Crossover Indicator" provides traders with a sophisticated tool to identify potential buy and sell conditions based on the combined information of the MFI and its smoothed moving average. The KNN machine learning techniques enhance the accuracy of this indicator's clear visual representation of overbought, neutral, and oversold zones. This combination of data represented on the chart helps traders make informed decisions about market conditions. This indicator is particularly useful for traders looking to refine their entry and exit points by leveraging advanced data analysis in respect to overbought and oversold conditions.
Disclaimer:
This indicator is intended to assist traders in making informed decisions based on technical analysis. However, it is not a guarantee of future performance and should be used in conjunction with other analysis techniques and risk management practices. Past performance is not indicative of future results, and traders should exercise caution and perform their own due diligence before making any trading decisions.

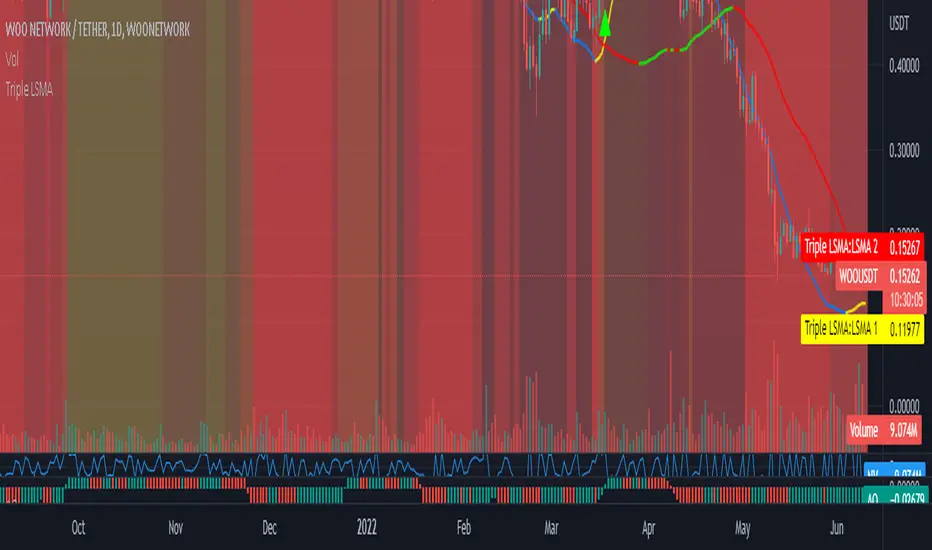
Triple Colored Least Squares Moving Average + Crossover AlertsThis script is forked from the ‘ Double Colored Least Squares Moving Average + Crossover Alerts ‘ from @IronKnightmare.
First release & notes : 2021-11-03.
Overview:
The Least Squares Moving Average is used mainly as a crossover signal to identify bullish or bearish trends. When a shorter duration line cross a longer one a trend can be identified. When multiple lines or the price action cross a longterm trend the confirmation can be further validated. Tradingview contains already some indicators with 1 or two LSMA trendlines that can be configured and toggled.
The original script that I forked had two LSMA lines that could be plotted with other valuable functions, I added a third for further confirmation as some trading systems will use three lines or some combination of those for validation.
Usage:
In inputs
- You will see LSMA 1, LSMA 2 & LSMA 3. The default values are 40, 100 & 400 representing the number of periods plotted by that line : fast, medium and slow changing trendlines will be plotted. The offset value and source are standard for most scripts.
In Style
- You can toggle LSMA 1, 2 or 3 and any combination of those. There are much more possibilities this way.
- For each LSMA, Color 0 & Color 1 are for coloring the slope of the trendline,
- Color 0 for rising slope,
- Color 1 for descending slope.
- The script will automatically color the rise or fall of the trendline accordingly. You can also set one identical color in both slopes for one unique color.
- The ‘ Long Crossover 1 on 2 ’ is a signal for when the LSMA 1 cross over the LSMA 2, usually a shorter periods trendline, more volatile, climbing over the medium term one. A Signal will be traced on the chart at that crossing, you can configure this. The ‘Short Crossover 1 on 2’ is when the LSMA 1 cross under the LSMA 2, a signal will be traced on the chart accordingly.
- The Long Crossover 1 on 3 & Short Crossover 1 on 3 act on the same principle, although the crossing of the fast LSMA on the long / slow LSMA are used. Both can be toggled.
- The ‘ Background Coloring Line 1 : 0-Neutral, 1-Up, 2-Down ’ is an optional background coloring for the LSMA1 line. This can provide additional information at a quick glance, especially if you combine the two other lines backgrounds, the partial transparency will compound.