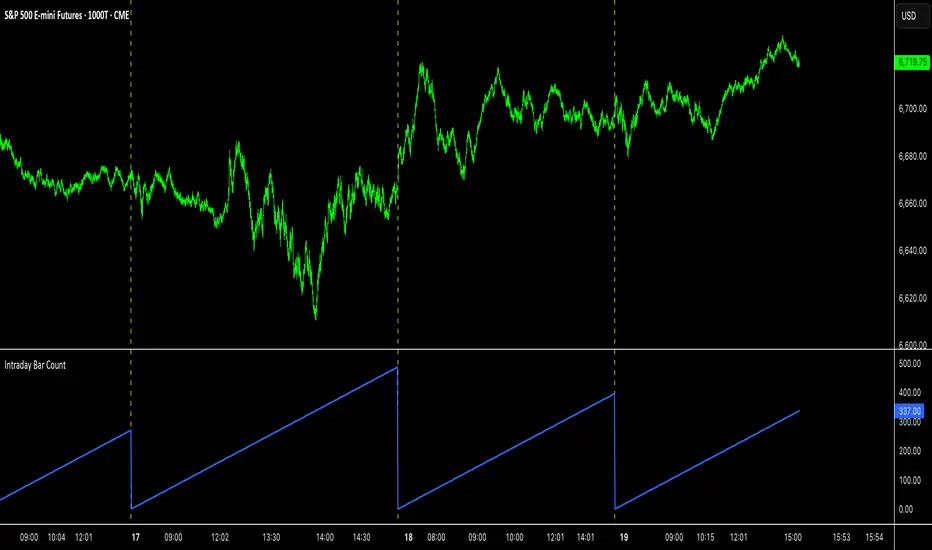
Intraday Bar CounterThis indicator plots a counter on the chart that tracks the number of bars since the beginning of the current day.
The counter resets to zero on the first bar of each new calendar day (midnight). This functionality is provided only on intraday and tick charts.
The indicator is designed to operate on a wide range of symbols without requiring manual adjustments for specific trading sessions.
"charts" için komut dosyalarını ara
Grand Master's Candlestick Dominance (ATR Enhanced)### Grand Master's Candlestick Dominance (ATR Enhanced)
**Overview**
Unleash the ancient wisdom of Japanese candlestick charting with a modern twist! This comprehensive Pine Script v5 strategy and indicator scans for over 75 classic and advanced candlestick patterns (bullish, bearish, and neutral), assigning dynamic strength scores (1-10) to each for precise signal filtering. Enhanced with Average True Range (ATR) for volatility-aware body size validation, it dominates the markets by combining timeless pattern recognition with robust confirmation layers. Whether used as a backtestable strategy or visual indicator, it empowers traders to spot high-probability reversals, continuations, and indecision setups with surgical accuracy.
Inspired by Steve Nison's *Japanese Candlestick Charting Techniques*, this tool elevates pattern analysis beyond basics—think Hammers, Engulfing patterns, Morning Stars, and rare gems like Abandoned Baby or Concealing Baby Swallow—all consolidated into intelligent arrays for real-time averaging and prioritization.
**Key Features**
- **Extensive Pattern Library**:
- **Bullish (25+ patterns)**: Hammer (8.0), Bullish Engulfing (10.0), Morning Star (7.0), Three White Soldiers (9.0), Dragonfly Doji (8.0), and more (e.g., Rising Three, Unique Three River Bottom).
- **Bearish (25+ patterns)**: Hanging Man (8.0), Bearish Engulfing (10.0), Evening Star (7.0), Three Black Crows (9.0), Gravestone Doji (8.0), and exotics like Upside Gap Two Crows or Stalled Pattern.
- **Neutral/Indecision (34+ patterns)**: Doji variants (Long-Legged, Four Price), Spinning Tops, Harami Crosses, and multi-bar setups like Upside Tasuki Gap or Advancing Block.
Each pattern includes duration tracking (1-5 bars) and ATR-adjusted body/shadow criteria for relevance in volatile conditions.
- **Smart Confirmation Filters** (All Toggleable):
- **Trend Alignment**: 20-period SMA (customizable) ensures entries align with the prevailing trend; optional higher timeframe (e.g., Daily) MA crossover for multi-timeframe confluence.
- **Support/Resistance (S/R)**: Pivot-based levels with 0.01% tolerance to confirm bounces or breaks.
- **Volume Surge**: 20-period volume MA with 1.5x spike multiplier to validate momentum.
- **ATR Body Sizing**: Filters small bodies (<0.3x ATR) and long bodies (>0.8x ATR) for context-aware pattern reliability.
- **Follow-Through**: Ensures post-pattern confirmation via bullish/bearish closes or closes beyond prior bars.
Minimum average strength (default 7.0) and individual pattern thresholds (5.0) prevent weak signals.
- **Entry & Exit Logic**:
- **Long Entry**: Bullish average strength ≥7.0 (outweighing bearish), uptrend, volume spike, near support, follow-through, and HTF alignment.
- **Short Entry**: Mirror for bearish dominance in downtrends near resistance.
- **Exits**: Bearish/neutral shift, or fixed TP (5%) / SL (2%)—pyramiding disabled, 10% equity sizing.
- Backtest range: Jan 1, 2020 – Dec 31, 2025 (editable). Initial capital: $10,000.
- **Interactive Dashboard** (Top-Right Panel):
Real-time insights including:
- Market phase (e.g., "Bullish Phase (Avg Str: 8.2)"), active pattern (e.g., "BULLISH: Bullish Engulfing (Str: 10.0, Bars: 2)"), and trend status.
- Strength breakdowns (Bull/Bear/Neutral counts & averages).
- Filter status (e.g., "Volume: ✔ Spike", "ATR: Enabled (L:0.8, S:0.3)").
- Backtest stats: Total trades, win rate, streak, and last entry/exit details (price & timestamp).
Toggle mode: Strategy (live trades) or Indicator (signals only).
- **Advanced Alerts** (15+ Toggleable Types):
Set up via TradingView's "Any alert() function call" for bar-close triggers:
- Entry/Exit signals with strength & pattern details.
- Strong patterns (≥2 bullish/bearish), neutral indecision, volume spikes.
- S/R breakouts, HTF reversals, high-confidence singles (≥8.0 strength).
- Conflicting signals, MA crossovers, ATR volatility bursts, multi-bar completions.
Example: "STRONG BULLISH PATTERN detected! Strength: 9.5 | Top Pattern: Three White Soldiers | Trend: Up".
**Customization & Usage Tips**
- **Inputs Groups**: Strategy toggles, confirmations, exits, backtest dates, and 15+ alert switches—all intuitively grouped.
- **Optimization**: Tune min strengths for aggressive (lower) or conservative (higher) trading; enable/disable filters to suit your style (e.g., disable S/R for scalping).
- **Best For**: Forex, stocks, crypto on 1H–Daily charts. Test on historical data to refine TP/SL.
- **Limitations**: No external data installs; relies on built-in TA functions. Patterns are probabilistic—combine with your risk management.
Master the candles like a grandmaster. Deploy on TradingView, backtest relentlessly, and let dominance begin! Questions? Drop a comment.
*Version: 1.0 | Updated: September 2025 | Credits: Built on Pine Script v5 with nods to Nison's timeless techniques.*

Supertrend Ravi Shinde📌 Multi-Timeframe Supertrend (MFT Supertrend)
This indicator is a refined version of the classic Supertrend, designed with multi-timeframe flexibility for traders who rely on higher-timeframe confirmation while trading lower charts.
🔑 Key Features:
Multi-Timeframe Analysis: Apply Supertrend from any higher timeframe (e.g., use 15m, 1h, or 1d Supertrend on a 5m chart).
Clear Trend Identification:
🔴 Price below Supertrend → Bearish trend.
🟢 Price above Supertrend → Bullish trend.
Customizable Parameters: Input ATR length, ATR multiplier, and timeframe of your choice.
Visual Simplicity: Clean chart display with no clutter – just the essential Supertrend line.

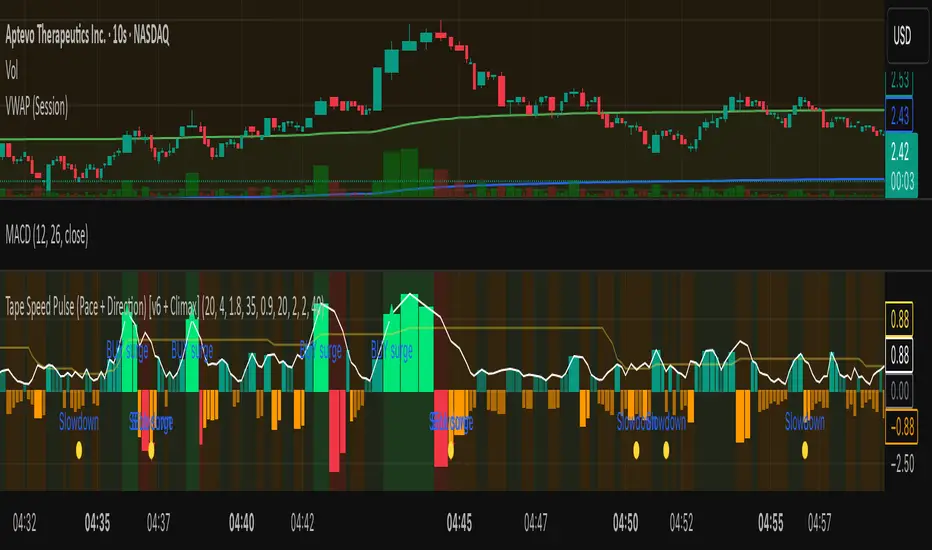
Tape Speed Pulse (Pace + Direction) [v6 + Climax]Tape Speed Pulse (Pace + Direction)
One-liner:
A lightweight “tape pulse” that turns intraday bursts of buying/selling into an easy-to-read histogram, with surge, slowdown, and climax (exhaustion) markers for fast decision-making. Use on sec and min charts.
What it measures
Pace (RVOL): current bar volume vs the recent average (smoothed).
Direction proxy: uptick/downtick by comparing close to close .
Pulse (histogram): direction × pace, so you see who’s pushing and how fast.
Colors
- Lime = Buy surge (pace ≥ threshold & upticking)
- Red = Sell surge (pace ≥ threshold & downticking)
- Teal = Buy pressure, sub-threshold
- Orange = Sell pressure, sub-threshold
- Faded/gray = Near-neutral pace (below the Neutral Band)
Lines (toggleable)
-White = Pace (RVOL)
- Yellow = Slowdown line = a drop of X% from the last 30-bar peak pace
Background tint mirrors the current state so you can glance risk: greenish for buy pressure, reddish for sell pressure.
Signals & alerts
- BUY surge – fires when pace crosses above the surge threshold with uptick direction (optional acceleration & uptick streak filters; cooldown prevents spam).
- SELL surge – mirror logic to downside.
- Slowdown – fires when pace crosses below the yellow slowdown line while direction ≤ 0 (early fade warning).
Climax (exhaustion)
- Buy Climax: previous bar was a buy surge with a large upper wick; current bar slows (below slowdown line) and direction ≤ 0.
- Sell Climax: mirror (large lower wick → slowdown → direction ≥ 0).
- Great for trimming/tight stops or fade setups at obvious spikes.
- Create alerts via Add alert → Condition: this indicator → choose the specific alert (BUY surge, SELL surge, Slowdown, Buy Climax, Sell Climax).
How to use it (playbook)
- Longs (e.g., VWAP reclaim / micro pullback)
- Only take entries when the pulse is teal→lime (buy pressure to buy surge).
- Into prior highs/VWAP bands, take partials on lime spikes.
- If you get a Slowdown dot and bars turn orange/red, tighten or exit.
Shorts (failed reclaim / lower-high)
- Look for teal→orange→red with rising pace at a level.
- Add confidence if a Buy Climax printed right before (exhaustion).
- Risk above the spike; don’t fight true ignitions out of bases.
Simple guardrails
- Avoid new longs when the histogram is orange/red; avoid new shorts when teal/lime.
- Use with VWAP + 9/20 EMA or your levels. The pulse is confirmation, not the whole thesis.
Inputs (what they do & when to tweak)
- Pace lookback (bars) – window for average volume. Lower = faster; higher = steadier.
Too jumpy? raise it. Missing quick bursts? lower it.
- Smoothing EMA (bars) – smooths pace. Higher = calmer.
Use 4–6 during the open; 3–4 midday.
- Surge threshold (× RVOL) – how fast counts as a surge.
Too many surges? raise it. Too late? lower it slightly.
- Slowdown drop from 30-bar max (%) – how far below the recent peak pace to call a slowdown.
Higher % = later slowdown; lower % = earlier warning.
- Neutral band (× RVOL) – paces below this fade to gray.
Raise to clean up noise; lower to see subtle pressure.
- Min seconds between signals – cooldown to prevent spam.
Increase in chop; reduce if you want more pings.
- BUY/SELL: min consecutive upticks/downticks – tiny streak filter.
Raise to avoid wiggles; lower for earlier signals.
Require pace accelerating into signal – ON = avoid stall breakouts; OFF = earlier pings.
Climax options: wick % threshold & “require slowdown cross”.
Raise wick% / require cross to be stricter; lower to catch more fades.
Quick presets
- Low-float runner, 5–10s chart
- Lookback 20, Smoothing 3–4, Surge 2.2–2.8, Slowdown 35–45, Neutral 1.0–1.2, Cooldown 15–25s, Streaks 2–3, Accel ON.
- Thick large-cap, 1-min
- Lookback 20–30, Smoothing 5–7, Surge 1.5–1.9, Slowdown 25–35, Neutral 0.8–1.0, Cooldown 30–60s, Streaks 2, Accel ON.
- Open vs Midday vs Power Hour
- Open: higher Surge, more Smoothing, longer Cooldown.
- Midday: lower Surge, less Smoothing to catch subtler pushes.
- Power hour: moderate Surge; keep Slowdown on for exits.
Reading common patterns
- Ignition (likely continuation): lime spike out of a base that holds above a level while pace stays above yellow.
- Exhaustion (likely fade): lime spike late in a run with upper wick → Slowdown → orange/red. The Buy Climax diamond is your tell.
Limits / notes
This is an OHLCV-based proxy (TradingView Pine can’t read raw tape/DOM). It won’t match Bookmap/Jigsaw tick-for-tick, but it’s fast and objective.
Use with levels and a risk plan. Past performance ≠ future results. Educational only.
1300 BarThe "1300 Bar" indicator is a simple yet effective tool designed to highlight the 1:00 PM EDT (New York time) bar on your chart with a yellow background. This helps traders and analysts easily identify this key intraday mark for strategic analysis or decision-making.
Key Features:
Time-Specific Highlighting: Targets the 13:00 EDT bar using the America/New_York timezone, ensuring accuracy regardless of your chart's display timezone. Focuses solely on coloring the bar yellow, providing a clear visual cue without additional overlays. Works on any symbol and timeframe, though best viewed on 1-minute to 30-minute charts for precise 13:00 EDT alignment.
How to Use:
Add the "1300 Bar" indicator to your chart. The 13:00 EDT bar will be highlighted yellow automatically. Scroll to historical data (e.g., 1:00 PM EDT on prior trading days) to see the highlighted bar.
Notes:
The indicator uses the America/New_York timezone, automatically adjusting for Daylight Saving Time (e.g., UTC-4 in EDT as of now). For best results, apply to a low timeframe (e.g., 1-min to 30-min) to ensure a bar exists at 13:00 EDT. No additional customization options are included, keeping the focus on the yellow bar highlight. Ideal for day traders or analysts who need a straightforward way to mark the 1:00 PM EDT period on their charts!

MAxRSI Signals [KedArc Quant]Description:
MAxRSI Indicator Marks LONG/SHORT signals from a Moving Average crossover and (optionally) confirms them with RSI. Includes repaint-safe confirmation, optional higher-timeframe (HTF) smoothing, bar coloring, and alert conditions.
Why combine MA + RSI
* The MA crossover is the primary trend signal (fast trend vs slow trend).
* RSI is a gate, not a second, separate signal. A crossover only becomes a trade signal if momentum agrees (e.g., RSI ≥ level for LONG, ≤ level for SHORT). This reduces weak crosses in ranging markets.
* The parts are integrated in one rule: *Crossover AND RSI condition (if enabled)* → plot signal/alert. No duplicated outputs or unrelated indicators.
How it works (logic)
* MA types: SMA / EMA / WMA / HMA (HMA is built via WMA of `len/2` and `len`, then WMA with `sqrt(len)`).
* Signals:
* LONG when *Fast MA crosses above Slow MA* and (if enabled) *RSI ≥ Long Min*.
* SHORT when *Fast MA crosses below Slow MA* and (if enabled) *RSI ≤ Short Max*.
* Repaint-safe (optional): confirms crosses on closed bars to avoid intrabar repaint.
* HTF (optional): computes MA/RSI on a higher timeframe to smooth noise on lower charts.
* Alerts: crossover alerts + state-flip (bull↔bear) alerts.
How to use (step-by-step)
1. Add to chart. Set MA Type, Fast and Slow (keep Fast < Slow).
2. Turn Use RSI Filter ON for confirmation (default: RSI 14 with 50/50 levels).
3. (Optional) Turn Repaint-Safe ON for close-confirmed signals.
4. (Optional) Turn HTF ON (e.g., 60 = 1h) for smoother signals on low TFs.
5. Enable alerts: pick “MAxRSI Long/Short” or “Bullish/Bearish State”.
Timeframe guidance
* Intraday (1–15m): EMA 9–20 fast vs EMA 50 slow, RSI filter at 50/50.
* Swing (1h–D): EMA 20 fast vs EMA 200 slow, RSI 50/50 (55/45 for stricter).
What makes it original
* Repaint-safe cross confirmation (previous-bar check) for reliable signals/alerts.
* HTF gating (doesn’t compute both branches) for speed and clarity.
* Warning-free MA helper (precomputes SMA/EMA/WMA/HMA each bar), HMA built from built-ins only.
* State-flip alerts and optional RSI overlay on price pane.
Built-ins used
`ta.sma`, `ta.ema`, `ta.wma`, (HMA built from these), `ta.rsi`, `ta.crossover`, `ta.crossunder`, `request.security`, `plot`, `plotshape`, `barcolor`, `alertcondition`, `input.*`, `math.*`.
Note: Indicator only (no orders). Test settings per symbol. Not financial advice.
⚠️ Disclaimer
This script is provided for educational purposes only.
Past performance does not guarantee future results.
Trading involves risk, and users should exercise caution and use proper risk management when applying this strategy.

Implied Volatility RangeThe Implied Volatility Range is a forward-looking tool that transforms option market data into probability ranges for future prices. Based on the lognormal distribution of asset prices assumed in modern option pricing models, it converts the implied volatility curve into a volatility cone with dynamic labels that show the market’s expectations for the price distribution at a specific point in time. At the selected future date, it displays projected price levels and their percentage change from today’s close across 1, 2, and 3 standard deviation (σ) ranges:
1σ range = ~68.2% probability the price will remain within this range.
2σ range = ~95.4% probability the price will remain within this range.
3σ range = ~99.7% probability the price will remain within this range.
What makes this indicator especially useful is its ability to incorporate implied volatility skew. When only ATM IV (%) is entered, the indicator displays the standard Black–Scholes lognormal distribution. By adding High IV (%) and Low IV (%) values tied to strikes above and below the current price, the indicator interpolates between these inputs to approximate the implied volatility skew. This adjustment produces a market-implied probability distribution that indicates whether the option market is leaning bullish or bearish, based on the data entered in the menu:
ATM IV (%) = Implied volatility at the current spot price (at-the-money).
High IV (%) = Implied volatility at a strike above the current spot price.
High Strike = Strike price corresponding to the High IV input (OTM call).
Low IV (%) = Implied volatility at a strike below the current spot price.
Low Strike = Strike price corresponding to the Low IV input (OTM put).
Expiration (Day, Month, Year) = Option expiration date for the projection.
Once these inputs are entered, the indicator calculates implied probability ranges and, if both High IV and Low IV values are provided, adjusts for skew to approximate the option market’s distribution. If no implied volatility data is supplied, the indicator defaults to a lognormal distribution based on historical volatility, using past realized volatility over the same forward horizon. This keeps the tool functional even without implied volatility inputs, though in that case the output represents only an approximation of ATM IV, not the actual market view.
In summary, the Implied Volatility Range is a powerful tool that translates implied volatility inputs into a clear and practical estimate of the market’s expectations for future prices. It allows traders to visualize the probability of price ranges while also highlighting directional bias, a dimension often difficult to interpret from traditional implied volatility charts. It should be emphasized, however, that this tool reflects only the market’s expectations at a specific point in time, which may change as new information and trading activity reshape implied volatility.

Argentum Flag [AGP] Ver.2.5Central Purpose and Concept
The Argentum Flag script is a multifunctional tool that integrates and visualizes multiple key indicators to provide a detailed and unified perspective of the market. The core concept is to analyze price from different angles—volatility, volume, and momentum—to identify confluences and patterns that may be difficult to see with separate indicators. This "mashup" is not a simple fusion of indicators, but a strategic combination of tools that complement each other to offer a comprehensive view of asset behavior.
Components and Their Functionality
This script combines and visualizes the following elements:
EMA Percentage Bands (EMA Bands):
Uses an Exponential Moving Average (EMA) as a baseline.
Calculates and draws several volatility bands that deviate from the central EMA by fixed percentages (0.47%, 0.94%, 2.36%). These bands are inspired by Fibonacci ratios and the cyclical nature of the market.
The bands are colored with a dynamic gradient that reflects the current state of volatility.
Utility: These bands act as dynamic support and resistance areas. The price entering or exiting these zones can indicate a change in volatility or a possible exhaustion of the movement.
Volatility Signals (Vortex & Prime Signals):
The script generates visual signals when the price stays outside the volatility bands for a specific number of bars.
Vortex Signals (diamond ⍲): Appear when the price crosses and stays outside the Prime bands, suggesting a high volatility or a possible continuation of the trend.
Exit/Entry Signals (circle ⌾): Are activated when the price stays outside the Vortex bands, indicating an extreme extension of volatility. These can be interpreted as potential reversal or profit-taking zones.
Utility: They help traders quickly identify moments of high and low volatility and potential turning points in price action.
Volume Analysis (Volume Bar Colors):
The script changes the color of the bars based on the relationship between the current volume and the average volume over a 50-bar period.
Utility: This feature allows the trader to immediately visualize the strength behind a price movement. For example, a bullish candle with "extreme" volume suggests strong buying interest, while a bearish candle with "low" volume could indicate a weak correction.
Summary Tables (Dashboard):
EMA-Fibo Table: Displays the values of 12 EMAs based on the Fibonacci sequence (5, 8, 13, 21...) in an easy-to-access table. The background color of each value indicates if the current price is above (bullish) or below (bearish) that EMA.
Multi-Timeframe RSI Table: Displays the Relative Strength Index (RSI) values across multiple timeframes (from 1 minute to monthly). The text color changes to highlight if the RSI is in overbought (orange) or oversold (white) areas, according to the established levels.
Utility: These tables condense a large amount of data into a simple format, allowing traders to perform a quick, multi-timeframe market analysis without constantly switching charts.
How to Use the Script
This script is a contextual analysis tool that works best when its different components are combined. It is not a "buy and sell signal" system on its own, but a tool for informed decision-making.
Trend Identification: Use the EMA table to see the general trend direction across different timeframes. A price above most of the EMAs in the table suggests a bullish bias.
Volatility Reading: Observe the EMA bands. If the price stays within the bands, volatility is low. A strong move that breaks out of the bands, accompanied by an "extreme" volume color (blue), suggests strong momentum that could continue.
Momentum Analysis: Use the RSI table to confirm movements. An overbought 15m RSI could support a reversal signal from the Vortex bands, while a 1D RSI in a neutral zone may indicate that the main trend has not changed.
Signal Confirmation: Visual signals (diamond and circle) should not be used in isolation. They must be confirmed by volume analysis and dashboard readings. For example, an "Exit Signal" (circle) with low volume may be less reliable than one with high volume and a clear reversal candle.
Disclaimer
This script is for informational and educational purposes only. It is not financial advice, nor is it a recommendation to buy or sell any financial instrument. All trading involves risk, and past performance is not indicative of future results. The user is solely responsible for their own trading decisions.

Weekly Session BreakThis indicator plots a vertical line at the end of the trading week (Friday) to mark the weekly session break. It is designed to be used on intraday charts (sub-1 hour timeframes).
The line's appearance is fully customizable via the Inputs tab, allowing you to change its color, style (solid, dotted, or dashed), and thickness.
Key Features:
End-of-Week Marker: Accurately draws a vertical line on the last bar of the trading week.
Timeframe Specific: Lines are only visible on intraday charts (1-minute to 59-minute timeframes) to prevent clutter on higher timeframes.
Customizable: Adjust the line's color, style, and thickness from the Inputs menu.

parademi super📌 Indicator Information: EMA 5-8-13 with Noise Reduction
This Pine Script indicator is designed to highlight EMA crossovers and filter out weak or noisy signals by combining multiple confirmation tools.
🔹 Core Logic
Plots three EMAs: 5, 8, and 13.
Colors bars:
Green when price is above all EMAs.
Red when price is below all EMAs.
Orange when price crosses EMA 8.
Displays arrows for 5/8 and 8/13 EMA crossovers (up = bullish, down = bearish).
🔹 Noise Reduction Filters
The script integrates several optional filters to reduce false signals:
Trend alignment: Only signals when EMAs are properly aligned (5>8>13 for bullish, 5<8<13 for bearish).
Close confirmation: Requires bar close beyond EMA 8 by a margin.
ADX filter: Ensures sufficient trend strength (custom ADX calculation).
MFI filter: Confirms with Money Flow Index thresholds.
Volatility filter: Blocks signals when EMAs are too close or ATR is too low.
Higher timeframe (HTF) filter: Confirms direction with EMA 8/13 crossover on a higher timeframe.
Debounce: Minimum bar distance between signals to avoid repetition.
🔹 Customization
All filters and thresholds are adjustable in the input menu:
Enable/disable specific filters.
Change EMA lengths, ADX/MFI parameters, ATR threshold, or HTF resolution.
Adjust the minimum bars between signals for cleaner charts.
🔹 Alerts
Built-in alerts are included for each crossover type (Bull/Bear for 5/8 and 8/13).
⚠️ Note: This is an educational tool for technical analysis. Always backtest and confirm with your own strategy before making trading decisions.

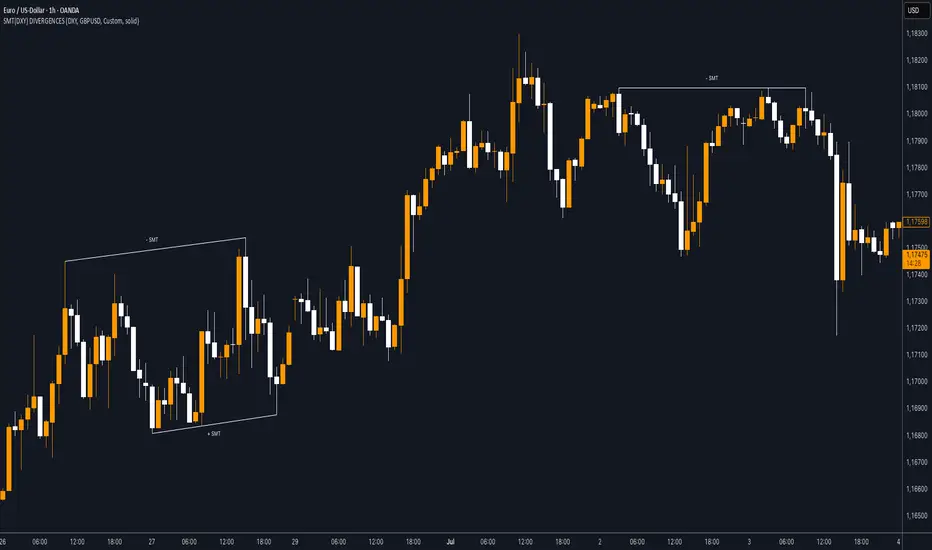
SMT (DXY) DIVERGENCESThis indicator detects Smart Money Technique (SMT) Divergences between the chart symbol and up to two comparison symbols defined in the settings.
It identifies swing highs and swing lows on correlated/uncorrelated instruments, compares their highs and lows, and determines possible divergences.
🔷 What It Detects
-Bullish SMT Divergence: When the lows of the chart symbol slope in the opposite direction of the comparison symbol’s lows.
-Bearish SMT Divergence: When the highs of the chart symbol slope in the opposite direction of the comparison symbol’s highs.
-Multi-Symbol Compatibility: Ability to compare the main symbol with one or two external tickers (default: DXY and GBPUSD).
-Negative Divergence Option: The inversion feature allows comparison with opposite-moving charts.
🔷 Calculation Logic
-Swing Detection: Swing highs and lows are confirmed using pivot-based logic.
-Comparison: Slopes of highs and lows are calculated for both the chart symbol and the comparison symbols.
-Divergence Identification: If slopes point in opposite directions, an SMT divergence (bullish or bearish) is marked.
-Visualization: Lines and labels (“+ SMT” or “– SMT”) are drawn on the chart. Historical lines can be kept or cleared depending on user settings.
🔷 Visual
Bearish SMT: Downward line with “– SMT” label.
Bullish SMT: Upward line with “+ SMT” label.
Style Options: Predefined color schemes (TLAB, standard, monochrome) or fully customizable colors.
Line Style: Solid, dashed, or dotted.
🔷 Customization Options
-Show Historical: Decide whether past divergences remain visible on the chart.
-Comparison Symbols: Define up to two external tickers, with optional inversion.
-Swing Lengths: Preconfigured pivot lengths automatically adapt to the selected timeframe (Daily, 4H, 1H, 5m/15m).
-Lines & Labels: Enable or disable bullish/bearish SMT divergences and their annotations.
🔷 Indicator Usage
Select the comparison symbol with positive or negative correlation.
Wait for the “+ SMT” or “– SMT” marker to appear on the chart.
Divergences can be used as contextual confluence when studying potential market shifts:
A + SMT marker may suggest bullish divergence.
A – SMT marker may suggest bearish divergence.
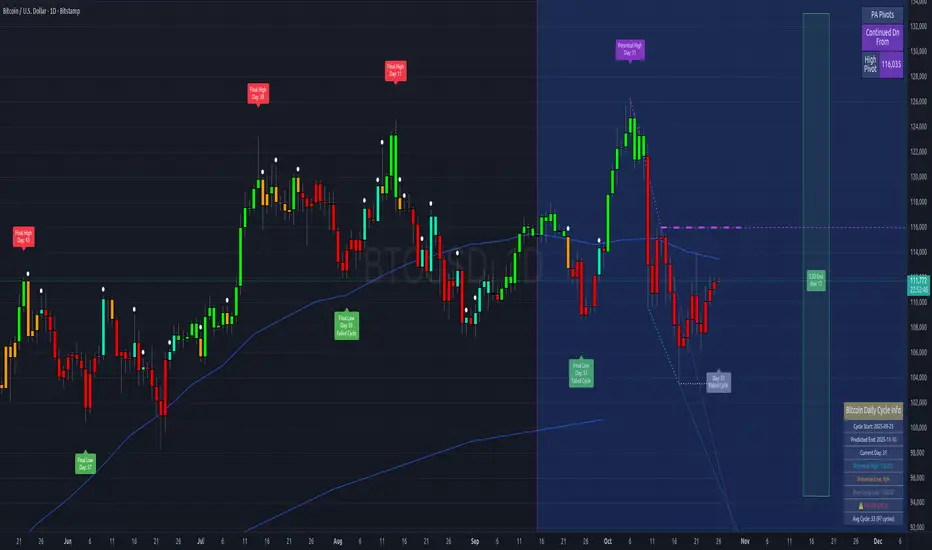
Bitcoin Cycles IndicatorTrack Bitcoin's cyclical price patterns across multiple timeframes with this cycle analysis tool. The indicator automatically identifies cycle lows and highs, marking them with clear visual labels that show cycle day counts and failed cycle detection.
Key Features:
Multi-Time frame Support - Optimized settings for Daily, Weekly, Monthly, and Custom time frames
Cycle Tracking - Identifies and labels cycle lows (green) and highs (red) with day counts
Failed Cycle Detection - Highlights when cycles break below previous lows
Customizable Settings - Adjust cycle lengths, colors, and display options for each timeframe
Info Box - Real-time cycle information display with current cycle day count
Projection Boxes - Visual cycle length projections for better analysis
Perfect for Bitcoin traders and analysts who want to understand market cycles and timing. Works best on Daily charts for short-term cycles and Weekly/Monthly charts for longer-term analysis.
Open Interest Aggregated (Lite)The Open Interest Aggregated (Lite) indicator consolidates open interest data across multiple major cryptocurrency exchanges into a single, easy-to-interpret visual. By aggregating open interest from Binance, Bybit, OKX, Bitget, and Coinbase (configurable per user preference), this indicator provides a holistic view of market positioning and trader sentiment in real time. It is designed for overlay-independent analysis, giving traders insight into derivatives market dynamics without cluttering price charts.
Key Features and Technical Details:
Aggregates open interest for USD, USDT, and USDC denominated perpetual contracts where available.
Supports configurable exchange inclusion: Binance, Bybit, OKX, Bitget, and Coinbase.
Normalizes USD-denominated open interest relative to the asset price for cross-exchange comparison.
Generates candlestick plots representing aggregated open interest: open, high, low, and close, allowing traditional technical analysis techniques (trend detection, breakouts, reversals) to be applied to derivatives positioning.
Provides optional hidden plots for each aggregated value (open, high, low, close) to support custom scripting or further analysis in Pine Script.
Color-coded candles: teal indicates an increase in open interest for the period, red indicates a decrease, highlighting shifts in trader sentiment.
Use Cases in Trading:
Trend Confirmation: Rising aggregated open interest in tandem with price increases can confirm bullish market participation, while decreasing open interest may signal weakening conviction.
Divergence Detection: Compare price action against aggregated open interest to detect potential reversals or exhaustion points.
Cross-Exchange Market Insight: By combining multiple exchanges, traders can identify shifts in global derivatives exposure rather than relying on a single market, reducing bias from localized trading anomalies.
Risk Assessment: Monitoring aggregated open interest can help anticipate periods of heightened leverage, which may correspond to increased volatility and potential liquidation events.
Why It’s Useful:
Open interest is a leading indicator of market sentiment and participation in futures markets. However, individual exchange data often provides an incomplete picture. Open Interest Aggregated (Lite) simplifies this by consolidating data across major platforms, enabling traders to make more informed decisions, assess market strength, and identify strategic entry or exit points with a clearer understanding of global positioning.
Application Notes:
Best used in combination with price analysis and volume metrics for robust trading signals.
Timeframe-independent: works on any chart interval, ensuring flexibility across intraday and longer-term strategies.
Lightweight “Lite” version ensures fast calculation while maintaining critical insights from multiple exchanges.

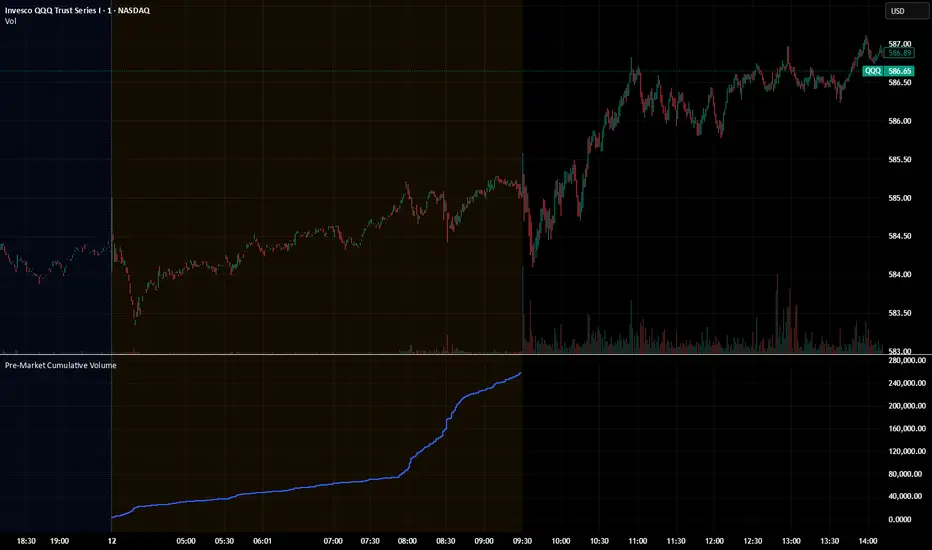
Pre‑Market Cumulative VolumeDescription:
This indicator plots the cumulative trading volume for the pre‑market session on intraday charts. It automatically detects when a bar is part of the extended pre‑market period using TradingView’s built‑in session variables, starts a new running total at the first pre‑market bar of each day, and resets at the beginning of regular trading hours. During regular market hours or the post‑market session, the indicator does not display values.
To use this script effectively, ensure extended‑hour data is enabled on the chart, and select an intraday timeframe where pre‑market data is available. The result is a simple yet powerful tool for monitoring cumulative pre‑market activity.
How to use
Add the script to a chart and make sure you are on an intraday timeframe (e.g., 1‑min, 5‑min). Extended‑hour data must be enabled; otherwise session.ispremarket will always be false.
During each pre‑market session, the indicator will reset at the first pre‑market bar and then accumulate the volume of subsequent pre‑market bars.
Outside the pre‑market (regular trading hours and post‑market), the plot outputs na, so it does not draw on those bars.
Customization (optional)
If you want to define your own pre‑market times instead of relying on TradingView’s built‑in session, you can replace the isPreMarket line with a time‑range check. For example, isPreMarket = not na(time(timeframe.period, "0400-0930")) detects bars between 04:00 and 09:30 (U.S. Eastern time). You can parameterize the session string with input.session("0400-0930", "Pre‑Market Session") to let users adjust it.

TPO Levels [VAH/POC/VAL] with Poor H/L, Single Prints & NPOCs### 🎯 Advanced Market Profile & Key Level Analysis
This script is a unique and comprehensive technical analysis tool designed to help traders understand market structure, value, and key liquidity levels using the principles of **Auction Market Theory** and **Market Profile**.
This script is unique (and shouldn't be censored) because :
It allows large history of levels to be displayed
Accurate as possible tick size
Doesn't draw a profile but only the actual levels
Supports multi-timeframe levels even on the daily mode giving macro context
There is no indicator out there that does it
While these concepts are universal, this indicator was built primarily for the dynamic, 24/7 nature of the **cryptocurrency market**. It helps you move beyond simple price action to understand *why* the market is moving, which is especially crucial in the volatile crypto space.
### ## 📊 The Concepts Behind the Calculations
To use this script effectively, it's important to understand the core concepts it is built upon. The entire script is self-contained and does not require other indicators.
* **What is Market Profile?**
Market Profile is a unique charting technique that organizes price and time data to reveal market structure. It's built from **Time Price Opportunities (TPOs)**, which are 30-minute periods of market activity. By stacking these TPOs, the script builds a distribution, showing which price levels were most accepted (heavily traded) and which were rejected (lightly traded) during a session.
* **What is the Value Area (VA)?**
The Value Area is the heart of the profile. It represents the price range where **70%** of the session's trading volume occurred. This is considered the "fair value" zone where both buyers and sellers were in general agreement.
* **Point of Control (POC):** The single price level with the most TPOs. This was the most accepted or "fairest" price of the session and acts as a gravitational line for price.
* **Value Area High (VAH):** The upper boundary of the 70% value zone.
* **Value Area Low (VAL):** The lower boundary of the 70% value zone.
VAH and VAL are dynamic support and resistance levels. Trading outside the previous session's value area can signal the start of a new trend.
***
### ## 📈 Key Features Explained
This script automatically calculates and displays the following critical market-generated information:
* **Multi-Timeframe Market Profile**
Automatically draws Daily, Weekly, and Monthly profiles, allowing you to analyze market structure across different time horizons. The script preserves up to 20 historical sessions to provide deep market context.
* **Naked Point of Control (nPOC)**
A "Naked" POC is a Point of Control from a previous session that has **not** been revisited by price. These levels often act as powerful magnets for price, representing areas of unfinished business that the market may seek to retest. The script tracks and displays Daily, Weekly, and Monthly nPOCs until they are touched.
* **Single Prints (Imbalance Zones)**
A Single Print is a price level where only one TPO traded during the session's development. This signifies a rapid, aggressive price move and an imbalanced market. These areas, like gaps in a traditional chart, are frequently revisited as the market seeks to "fill in" these thin parts of the profile.
* **Poor Structure (Unfinished Auctions)**
A **Poor High** or **Poor Low** occurs when the top or bottom of a profile is flat, with two or more TPOs at the extreme price. This suggests that the auction in that direction was weak and inconclusive. These weak structures often signal a high probability that price will eventually break that high or low.
***
### ## 💡 How to Use This Indicator
This tool is not a signal generator but an analytical framework to improve your trading decisions.
1. **Determine Market Context:** Start by asking: Is the current price trading *inside* or *outside* the previous session's Value Area?
* **Inside VA:** The market is in a state of balance or range-bound. Look for trades between the VAH and VAL.
* **Outside VA:** The market is in a state of imbalance and may be starting a trend. Look for continuation or acceptance of prices outside the prior value.
2. **Identify Key Levels:**
* Use historical **nPOCs** as potential profit targets or areas to watch for a price reaction.
* Treat historical **VAH** and **VAL** levels as significant support and resistance zones.
* Note where **Single Prints** are. These are often price magnets that may get "filled" in the future.
3. **Spot Weakness:**
* A **Poor High** suggests weak resistance that may be easily broken.
* A **Poor Low** suggests weak support, signaling a potential for a continued move lower if broken.
***
### ## ⚙️ Customization & Crypto Presets
The indicator is highly customizable, allowing you to change colors, transparency, the number of historical sessions, and more.
To help traders get started quickly, the indicator includes **built-in layout presets** specifically calibrated for major cryptocurrencies: ** BINANCE:BTCUSDT.P , BINANCE:ETHUSDT.P , and BINANCE:SOLUSDT.P **. These presets automatically adjust key visual parameters to better suit the unique price characteristics and volatility of each asset, providing an optimized view right out of the box.
***
### ## ⚠️ Disclaimer
This indicator is a tool for market analysis and should not be interpreted as direct buy or sell signals. It provides information based on historical price action, which does not guarantee future results. Trading involves significant risk, and you should always use proper risk management. This script is designed for use on standard chart types (e.g., Candlesticks, Bar) and may produce misleading information on non-standard charts.
