EBP Candle Marker### **EBP Candle Marker – TradingView Indicator**
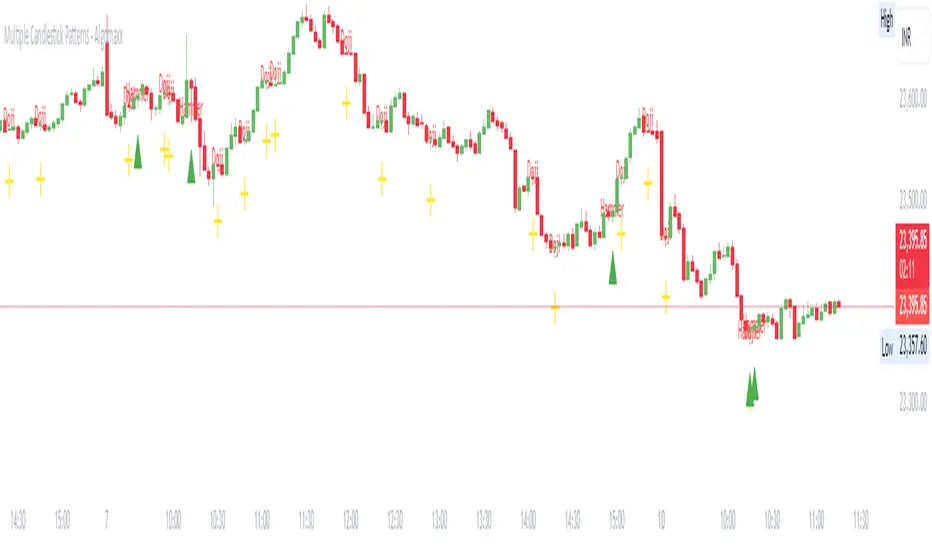
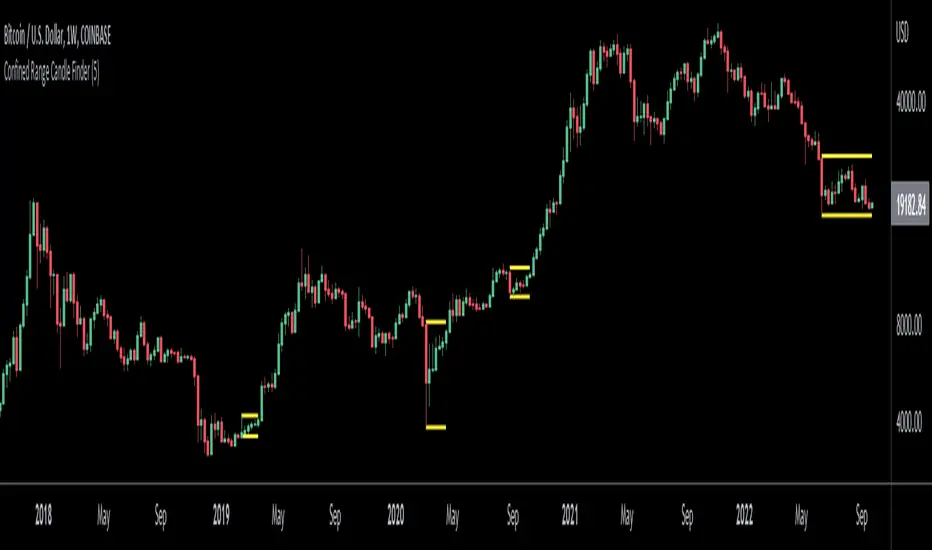
The **EBP Candle Marker** is a specialized TradingView indicator designed to identify and highlight potential liquidity sweep candles. This indicator visually emphasizes key price action patterns where the market sweeps previous highs or lows and closes in the opposite direction, often signaling potential reversals or liquidity grabs.
---
### 📊 **Indicator Logic:**
1. **Bullish Sweep:**
- The current candle’s **low** is lower than the previous candle’s **low** (indicating a liquidity sweep).
- The **close** is above both the **open** and **close** of the previous candle.
2. **Bearish Sweep:**
- The current candle’s **high** is higher than the previous candle’s **high** (indicating a liquidity sweep).
- The **close** is below both the **open** and **close** of the previous candle.
---
### 🎨 **Visual Representation:**
- **Yellow Candle Body:** Highlights any candle meeting the bullish or bearish sweep conditions.
---
### 🔔 **Alert Functionality:**
The indicator supports setting custom alerts in TradingView for:
- **Bullish Sweep Detected** – Notifies when a bullish sweep occurs.
- **Bearish Sweep Detected** – Notifies when a bearish sweep occurs.
These alerts are compatible across any timeframe, providing flexibility to monitor key market conditions.
---
### 📈 **Use Cases:**
- **Liquidity Sweep Detection:** Identify areas where the market may be triggering stop-loss orders or liquidity hunts.
- **Reversal Confirmation:** Enhance trade confirmation by identifying potential reversal zones.
- **Scalping & Swing Trading:** Suitable for both short-term and long-term trading strategies across multiple timeframes.
Pine Script® göstergesi