BTC Breakout Alert📈 BTC Breakout & Fakeout Detector with Volume, RSI & MACD Filters
This script helps identify high-confidence breakout setups by combining price action, volume spikes, and optional momentum filters (RSI & MACD). It’s designed to alert you when Bitcoin (or any asset) breaks above a defined resistance level with strong conviction — and warns you if that move turns out to be a fakeout.
🔍 Features:
✅ Confirmed Breakout Alerts: Triggers when price closes above your set resistance level with volume ≥ 1.5× the 20-period average.
⚠️ Fakeout Detection: Highlights when price closes back below resistance within a few candles after breakout.
📊 Momentum Filters:
RSI > 50 for bullish confirmation
MACD line > signal line to support breakout momentum
🔔 Custom Alerts: Built-in alert conditions for both breakout and fakeout events.
🔼🔽 Visual Markers: Arrows plotted directly on the chart for clear entry and caution zones.
🕒 Works on all timeframes and any asset that includes volume data.
Ideal for breakout traders who want more than just a price spike — this tool ensures volume and momentum alignment, helping you reduce false signals and react with more confidence.
"breakout" için komut dosyalarını ara

OpeningRange (Trading_Tix)Purpose:
The indicator highlights the high, low, and middle (50%) price levels of a specified session's opening range. These levels can serve as key support and resistance zones for trading strategies. The indicator also offers options to extend these levels beyond the session into later timeframes, making it useful for tracking breakout or trend continuation setups.
Key Features:
1. Session Detection:
The indicator identifies a specific session period using the user-defined Session Time. It calculates the start time, high, and low prices during this period:
rangeTime: Defines the session time range (default: 5:00 PM to 2:59 AM).
extendTime: Defines the extended time range where lines/backgrounds can be prolonged.
2. Opening Range Calculation:
High (high_val) and Low (low_val)**:
Tracks the highest and lowest prices during the session.
Middle Line:
A midpoint is calculated by averaging high_val and low_val.
3. Visual Elements:
Horizontal Lines:
Drawn at the high, low, and middle levels.
Customizable in width and color.
Shaded Background Box:
Covers the range between high and low prices.
The box’s color and transparency can be adjusted.
Line and Box Extension:
Optionally extends these elements into the extended time range.
4. Customization:
Users have the flexibility to:
Toggle visibility of lines, middle line, and background box.
Adjust colors, line thickness, and style.
Enable or disable the extension of lines and backgrounds into the extended period.
How It Works:
Initialization:
The script initializes variables to store range data (startTime, high_val, low_val) and drawing objects (lines, boxes).
It detects whether the current bar falls within the session (inSession) or extended timeframe (inExtend).
Plotting:
During the session:
Deletes previous lines and boxes from prior sessions.
Draws new lines at the high, low, and middle levels.
Creates a background box covering the range, if enabled.
During the extended period:
Extends the session lines and box, if the user has opted for extensions.
Updates:
Continuously adjusts the high/low values and updates the lines as new price data arrives.
Use Cases:
This indicator can be valuable for traders who:
Use the opening range to identify potential breakout zones.
Trade based on price consolidation within the range.
Want a visual representation of key price levels to plan entries and exits.
Would you like help refining this script further or adjusting its settings to match your trading style?

ZVOL — Z-Score Volume Heatmapⓩ ZVOL transforms raw volume into a statistically calibrated heatmap using Z-score thresholds. Unlike classic volume indicators that rely on fixed MA comparisons, ZVOL calculates how many standard deviations each volume bar deviates from its mean. This makes the reading adaptive across timeframes and assets, in order to distinguish meaningful crowd behavior from random volatility.
📊 The core display is a five-zone histogram, each encoded by color and statistical depth. Optional background shading mirrors these zones across the entire pane, revealing subtle compression or structural rhythm shifts across time. By grounding the volume reading in volatility-adjusted context, ZVOL inhibits impulsive trading tactics by compelling the structure, not the sentiment, to dictate the signal.
🥵 Heatmap Coloration:
🌚 Suppressed volume — congestion, coiling phases
🩱 Stable flow — early trend or resting volume
🏀 High activity — emerging pressure
💔 Extreme — possible climax or institutional print
🎗️ A dynamic Fibonacci-based 21:34-period EMA ribbon overlays the histogram. The fill area inverts color on crossover, providing a real-time read on tempo, expansion, or divergence between price structure and crowd effort.
💡 LTF Usage Suggestions:
• Confirm breakout legs when orange or red zones align with range exits
• Fade overextended moves when red bars appear into resistance
• Watch for rising EMAs and orange volume to front-run impulsive moves
• Combine with volatility suppression (e.g. ATR) to catch compression → expansion transitions
🥂 Ideal Pairings:
• OBVX Conviction Bias — to confirm directional intent behind volume shifts
• SUPeR TReND 2.718 — for directional filters
• ATR Turbulence Ribbon — to detect compression phases
👥 The OBVX Conviction Bias adds a second dimension to ZVOL by revealing whether crowd effort is aligning with price direction or diverging beneath the surface. While ZVOL identifies statistical anomalies in raw volume, OBVX tracks directional commitment using cumulative volume and moving average cross logic. Use them together to spot fake-outs, anticipate structure-confirmed breakouts, or time pullbacks with volume-based conviction.
🔬 ZVOL isn’t just a volume filter — it’s a structural lens. It reveals when crowd effort is meaningful, when it's fading, and when something is about to shift. Designed for structure-aware traders who care about context, not noise.

BB Breakout + Momentum Squeeze [Strategy]This Strategy is Based on 3 free indicators
- Bollinger Bands Breakout Oscillator: Link
- TTM Squeeze Pro: Link
- Rolling ATR Bands: Link
Bollinger Bands Breakout Oscillator - This tool shows how strong a market trend is by measuring how often prices move outside their normal Bollinger bands range. It helps you see whether prices are strongly moving in one direction or just moving sideways. By looking at how much and how frequently prices push beyond their typical boundaries, you can identify which direction the market is heading over your selected time period.
TM Squeeze Pro - This is a custom version of the TTM Squeeze indicator.
It's designed to help traders spot consolidation phases in the market (when price is coiling or "squeezing") and to catch breakouts early when volatility returns. The logic is based on the relationship between Bollinger Bands and Keltner Channels, combined with a momentum oscillator to show direction and strength.
Rolling ATR Bands - This indicator combines volatility bands (ATR) with momentum and trend signals to show where the market might be breaking out, retesting, or trending. It's highly visual and helpful for traders looking to time entries/exits during trending or volatile moves.
Logic Of the Strategy:
We are going to use the Bollinger Bands Breakout to determine the direction of the market. Than check the Volatility of the price by looking at the TTM Squeeze indicator. And use the ATR Bands to determine dynamic Stop Losses and based on the calculate the Take Profit targets and quantity for each position dynamically.
For the Long Setup:
1. We need to see the that Bull Power (Green line of the Bollinger Bands Breakout Oscilator) is crossing the level of 50.
2. Check the presence of volatility (Green dot based on the TTM Squeeze indicator)
For the Short Setup:
1. We need to see the that Bear Power (Red line of the Bollinger Bands Breakout Oscilator) is crossing the level of 50.
2. Check the presence of volatility (Green dot based on the TTM Squeeze indicator)
Stop Loss is determined by the Lower ATR Band (for the Long entry) and Upper ATR Band (For the Short entry)
Take Profit is 1:1.5 risk reward ration, which means if the Stop loss is 1% the TP target will be 1.5%
Move stop Loss to Breakeven: If the price will go in the direction of the trade for at least half of the Risk Reward target then the stop will automatically be adjusted to the entry price. For Example: the Stop Loss is 1%, the price has move at least 0.5% in the direction of your trade and that will move the Stop Loss level to the Entry point.
You can Adjust the parameters for each indicator used in that script and also adjust the Risk and Money management block to see how the PnL will change.

Adaptable Relative Momentum Index [ParadoxAlgo]The Adaptable Relative Momentum Index (RMI) by ParadoxAlgo is an advanced momentum-based indicator that builds upon the well-known RSI (Relative Strength Index) concept by introducing a customizable momentum length. This indicator measures price momentum over a specified number of periods and applies a Rolling Moving Average (RMA) to both the positive and negative price changes. The result is a versatile tool that can help traders gauge the strength of a trend, pinpoint overbought/oversold levels, and potentially identify breakout opportunities.
⸻
Smart Configuration Feature
What sets this version of the RMI apart is ParadoxAlgo’s exclusive “Smart Configuration” functionality. Instead of manually adjusting parameters, traders can simply select their Asset Class (e.g., Stocks, Forex, Futures/Indices, Crypto, Commodities) and Trading Style (e.g., Scalping, Day Trading, Swing Trading, Short-Term Investing, Long-Term Investing). Based on these selections, the indicator automatically optimizes its core parameters:
• Length – The period over which the price changes are smoothed.
• Momentum Length – The number of bars used to calculate the price change.
By automating this process, users save time on tedious trial-and-error adjustments, ensuring that the RMI’s settings are tailored to the characteristics of specific markets and personal trading horizons.
⸻
Key Features & Benefits
1. Momentum-Based Insights
• Uses RMA to smooth price movements, helping identify shifts in market momentum more clearly than a basic RSI.
• Enhanced adaptability for a wide range of asset classes and time horizons.
2. Simple Yet Powerful Configuration
• Smart Configuration automatically sets optimal parameter values for each combination of asset class and trading style.
• Eliminates guesswork and manual recalibration when switching between markets or timeframes.
3. Overbought & Oversold Visualization
• Integrated highlight zones mark potential overbought and oversold extremes (default at 80 and 20).
• Optional breakout highlighting draws attention to times when the indicator crosses these key thresholds, helping spot possible entry or exit signals.
4. Intuitive Design & Ease of Use
• Clean plotting and color-coded signal lines make it easy to interpret bullish or bearish shifts in momentum.
• Straightforward dropdown menus keep the interface user-friendly, even for novice traders.
⸻
Practical Applications
• Early Trend Detection: Spot emerging trends when the RMI transitions from oversold to higher levels or vice versa.
• Breakout Confirmation: Confirm potential breakout trades by tracking overbought/oversold breakouts alongside other technical signals.
• Support/Resistance Confluence: Combine RMI signals with horizontal support/resistance levels to reinforce trade decisions.
• Trade Timing: Quickly gauge when momentum could be shifting, helping you time entries and exits more effectively.
⸻
Disclaimer
As with any technical indicator, the Adaptable Relative Momentum Index should be used as part of a broader trading strategy that includes risk management, fundamental analysis, and other forms of technical confirmation. Past performance does not guarantee future results.
⸻
Enjoy using the Adaptable RMI and experience a more streamlined, flexible approach to momentum analysis. Feel free to explore different asset classes and trading styles to discover which configurations resonate best with your unique trading preferences.

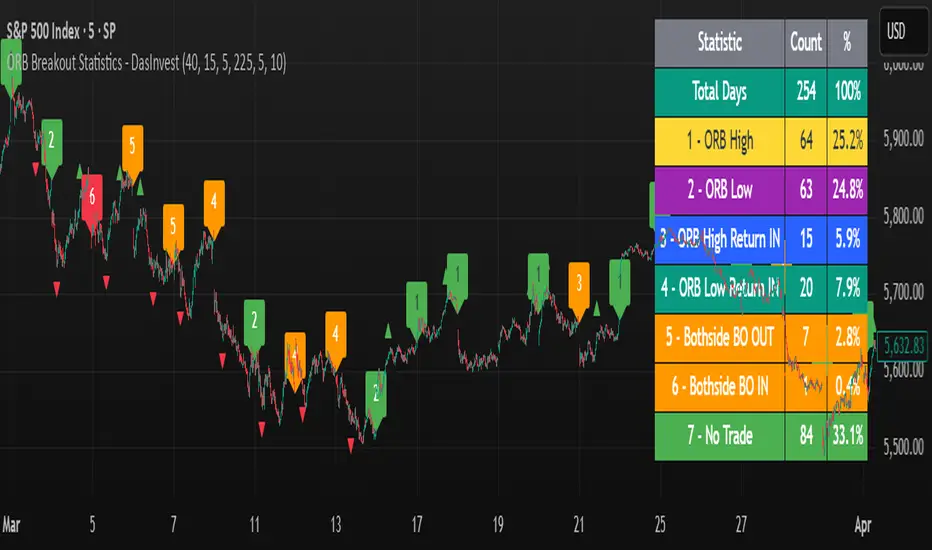
ORB Breakout Statistics with Labels and ProfitOpening Range Breakout Statistics – This indicator identifies the opening range based on user-defined inputs and detects breakouts above the high or below the low. At the end of each trading day, it classifies the session into a specific category based on price action. Additionally, it tracks profit and loss for each classification, allowing you to backtest the strategy using log files.
Geometric Momentum Breakout with Monte CarloOverview
This experimental indicator uses geometric trendline analysis combined with momentum and Monte Carlo simulation techniques to help visualize potential breakout areas. It calculates support, resistance, and an aggregated trendline using a custom Geo library (by kaigouthro). The indicator also tracks breakout signals in a way that a new buy signal is triggered only after a sell signal (and vice versa), ensuring no repeated signals in the same direction.
Important:
This script is provided for educational purposes only. It is experimental and should not be used for live trading without proper testing and validation.
Key Features
Trendline Calculation:
Uses the Geo library to compute support and resistance trendlines based on historical high and low prices. The midpoint of these trendlines forms an aggregated trendline.
Momentum Analysis:
Computes the Rate of Change (ROC) to determine momentum. Breakout conditions are met only if the price and momentum exceed a user-defined threshold.
Monte Carlo Simulation:
Simulates future price movements to estimate the probability of bullish or bearish breakouts over a specified horizon.
Signal Tracking:
A persistent variable ensures that once a buy (or sell) signal is triggered, it won’t repeat until the opposite signal occurs.
Geometric Enhancements:
Calculates an aggregated trend angle and channel width (distance between support and resistance), and draws a perpendicular “breakout zone” line.
Table Display:
A built-in table displays key metrics including:
Bullish probability
Bearish probability
Aggregated trend angle (in degrees)
Channel width
Alerts:
Configurable alerts notify when a new buy or sell breakout signal occurs.
Inputs
Resistance Lookback & Support Lookback:
Number of bars to look back for determining resistance and support points.
Momentum Length & Threshold:
Period for ROC calculation and the minimum percentage change required for a breakout confirmation.
Monte Carlo Simulation Parameters:
Simulation Horizon: Number of future bars to simulate.
Simulation Iterations: Number of simulation runs.
Table Position & Text Size:
Customize where the table is displayed on the chart and the size of the text.
How to Use
Add the Script to Your Chart:
Copy the code into the Pine Script editor on TradingView and add it to your chart.
Adjust Settings:
Customize the inputs (e.g., lookback periods, momentum threshold, simulation parameters) to fit your analysis or educational requirements.
Interpret Signals:
A buy signal is plotted as a green triangle below the bar when conditions are met and the state transitions from neutral or sell.
A sell signal is plotted as a red triangle above the bar when conditions are met and the state transitions from neutral or buy.
Alerts are triggered only on the bar where a new signal is generated.
Examine the Table:
The table displays key metrics (breakout probabilities, aggregated trend angle, and channel width) to help evaluate current market conditions.
Disclaimer
This indicator is experimental and provided for educational purposes only. It is not intended as a trading signal or financial advice. Use this script at your own risk, and always perform your own research and testing before using any experimental tools in live trading.
Credit
This indicator uses the Geo library by kaigouthro. Special thanks to Cryptonerds and @Hazzantazzan for their contributions and insights.

Swing Breakout System (SBS)The Swing Breakout Sequence (SBS) is a trading strategy that focuses on identifying high-probability entry points based on a specific pattern of price swings. This indicator will identify these patterns, then draw lines and labels to show confirmation.
How To Use:
The indicator will show both Bullish and Bearish SBS patterns.
Bullish Pattern is made up of 6 points: Low (0), HH (1), LL (2 | but higher than initial Low), New HH (3), LL (5), LL again (5)
Bearish Patten is made up of 6 points: High (0), LL (1), HH (2 | but lower than initial high), New LL (3), HH (5), HH again (5)
A label with an arrow will appear at the end, showing the completion of a successful sequence
Idea behind the strategy:
The idea behind this strategy, is the accumulation and then manipulation of liquidity throughout the sequence. For example, during SBS sequence, liquidity is accumulated during step (2), then price will push away to make a new high/low (step 3), after making a minor new high/low, price will retrace breaking the key level set up in step (2). This is price manipulating taking liquidity from behind high/low from step (2). After taking liquidity price the idea is price will continue in the original direction.
Step 0 - Setting up initial direction
Step 1 - Setting up initial direction
Step 2 - Key low/high establishing liquidity
Step 3 - Failed New high/low
Step 4 - Taking liquidity from step (2)
Step 5 - Taking liquidity from step 2 and 4
Pattern Detection:
- Uses pivot high/low points to identify swing patterns
- Stores 6 consecutive swing points in arrays
- Identifies two types of patterns:
1. Bullish Pattern: A specific sequence of higher lows and higher highs
2. Bearish Pattern: A specific sequence of lower highs and lower lows
Note: Because the indicator is identifying a perfect sequence of 6 steps, set ups may not appear frequently.
Visualization:
- Draws connecting lines between swing points
- Labels each point numerically (optional)
- Shows breakout arrows (↑ for bullish, ↓ for bearish)
- Generates alerts on valid breakouts
User Input Settings:
Core Parameters
1. Pivot Lookback Period (default: 2)
- Controls how many bars to look back/forward for pivot point detection
- Higher values create fewer but more significant pivot points
2. Minimum Pattern Height % (default: 0.1)
- Minimum required height of the pattern as a percentage of price
- Filters out insignificant patterns
3. Maximum Pattern Width (bars) (default: 50)
- Maximum allowed width of the pattern in bars
- Helps exclude patterns that form over too long a period

Silver Bullet ICT Strategy [TradingFinder] 10-11 AM NY Time +FVG🔵 Introduction
The ICT Silver Bullet trading strategy is a precise, time-based algorithmic approach that relies on Fair Value Gaps and Liquidity to identify high-probability trade setups. The strategy primarily focuses on the New York AM Session from 10:00 AM to 11:00 AM, leveraging heightened market activity within this critical window to capture short-term trading opportunities.
As an intraday strategy, it is most effective on lower timeframes, with ICT recommending a 15-minute chart or lower. While experienced traders often utilize 1-minute to 5-minute charts, beginners may find the 1-minute timeframe more manageable for applying this strategy.
This approach specifically targets quick trades, designed to take advantage of market movements within tight one-hour windows. By narrowing its focus, the Silver Bullet offers a streamlined and efficient method for traders to capitalize on liquidity shifts and price imbalances with precision.
In the fast-paced world of forex trading, the ability to identify market manipulation and false price movements is crucial for traders aiming to stay ahead of the curve. The Silver Bullet Indicator simplifies this process by integrating ICT principles such as liquidity traps, Order Blocks, and Fair Value Gaps (FVG).
These concepts form the foundation of a tool designed to mimic the strategies of institutional players, empowering traders to align their trades with the "smart money." By transforming complex market dynamics into actionable insights, the Silver Bullet Indicator provides a powerful framework for short-term trading success
Silver Bullet Bullish Setup :
Silver Bullet Bearish Setup :
🔵 How to Use
The Silver Bullet Indicator is a specialized tool that operates within the critical time windows of 9:00-10:00 and 10:00-11:00 in the forex market. Its design incorporates key principles from ICT (Inner Circle Trader) methodology, focusing on concepts such as liquidity traps, CISD Levels, Order Blocks, and Fair Value Gaps (FVG) to provide precise and actionable trade setups.
🟣 Bullish Setup
In a bullish setup, the indicator starts by marking the high and low of the session, serving as critical reference points for liquidity. A typical sequence involves a liquidity grab below the low, where the price manipulates retail traders into selling positions by breaching a key support level.
This movement is often orchestrated by smart money to accumulate buy orders. Following this liquidity grab, a market structure shift (MSS) occurs, signaled by the price breaking the CISD Level—a confirmation of bullish intent. The indicator then highlights an Order Block near the CISD Level, representing the zone where institutional buying is concentrated.
Additionally, it identifies a Fair Value Gap, which acts as a high-probability area for price retracement and trade entry. Traders can confidently take long positions when the price revisits these zones, targeting the next significant liquidity pool or resistance level.
Bullish Setup in CAPITALCOM:US100 :
🟣 Bearish Setup
Conversely, in a bearish setup, the price manipulates liquidity by creating a false breakout above the high of the session. This move entices retail traders into long positions, allowing institutional players to enter sell orders.
Once the price reverses direction and breaches the CISD Level to the downside, a change of character (CHOCH) becomes evident, confirming a bearish market structure. The indicator highlights an Order Block near this level, indicating the origin of the institutional sell orders, along with an associated FVG, which represents an imbalance zone likely to be revisited before the price continues downward.
By entering short positions when the price retraces to these levels, traders align their strategies with the anticipated continuation of bearish momentum, targeting nearby liquidity voids or support zones.
Bearish Setup in OANDA:XAUUSD :
🔵 Settings
Refine Order Block : Enables finer adjustments to Order Block levels for more accurate price responses.
Mitigation Level OB : Allows users to set specific reaction points within an Order Block, including: Proximal: Closest level to the current price. 50% OB: Midpoint of the Order Block. Distal: Farthest level from the current price.
FVG Filter : The Judas Swing indicator includes a filter for Fair Value Gap (FVG), allowing different filtering based on FVG width: FVG Filter Type: Can be set to "Very Aggressive," "Aggressive," "Defensive," or "Very Defensive." Higher defensiveness narrows the FVG width, focusing on narrower gaps.
Mitigation Level FVG : Like the Order Block, you can set price reaction levels for FVG with options such as Proximal, 50% OB, and Distal.
CISD : The Bar Back Check option enables traders to specify the number of past candles checked for identifying the CISD Level, enhancing CISD Level accuracy on the chart.
🔵 Conclusion
The Silver Bullet Indicator is a cutting-edge tool designed specifically for forex traders who aim to leverage market dynamics during critical liquidity windows. By focusing on the highly active 9:00-10:00 and 10:00-11:00 timeframes, the indicator simplifies complex market concepts such as liquidity traps, Order Blocks, Fair Value Gaps (FVG), and CISD Levels, transforming them into actionable insights.
What sets the Silver Bullet Indicator apart is its precision in detecting false breakouts and market structure shifts (MSS), enabling traders to align their strategies with institutional activity. The visual clarity of its signals, including color-coded zones and directional arrows, ensures that both novice and experienced traders can easily interpret and apply its findings in real-time.
By integrating ICT principles, the indicator empowers traders to identify high-probability entry and exit points, minimize risk, and optimize trade execution. Whether you are capturing short-term price movements or navigating complex market conditions, the Silver Bullet Indicator offers a robust framework to enhance your trading performance.
Ultimately, this tool is more than just an indicator; it is a strategic ally for traders who seek to decode the movements of smart money and capitalize on institutional strategies. With the Silver Bullet Indicator, traders can approach the market with greater confidence, precision, and profitability.

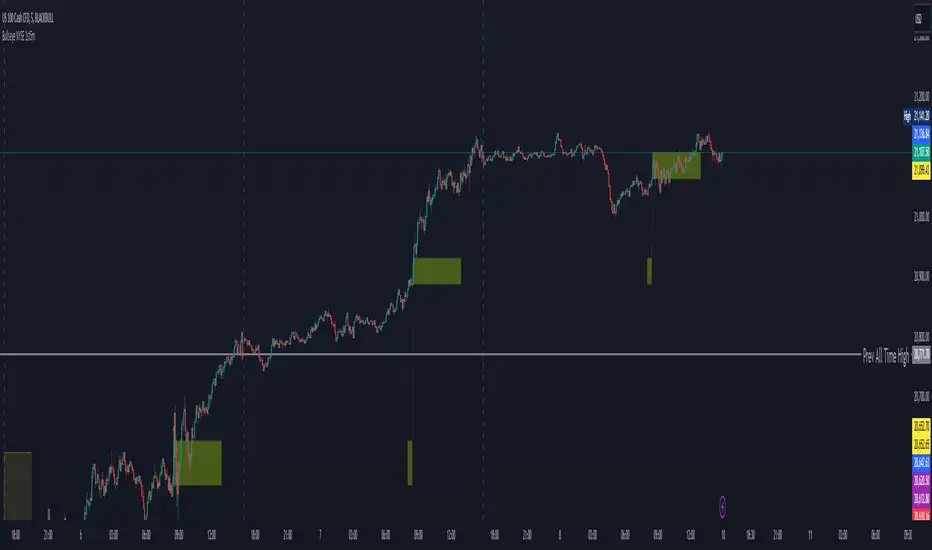
Bullseye NYSE 1st5mThis script, "BullseyeNYSE1st5m," is a TradingView indicator designed to highlight the high and low price levels during the first 5 minutes of the NYSE trading session. It works as follows:
1. **Identify NYSE Trading Hours**: The script identifies bars that fall within NYSE trading hours, specifically focusing on the first five minutes after the market opens.
2. **Calculate First 5-Minute High and Low**: During the first five minutes of the trading day, the script captures and updates the high and low prices, storing these values for the remainder of the session.
3. **Plot High and Low Levels**: The high and low values from the first five minutes are plotted as lines on the chart in yellow. This helps traders quickly identify the initial range set by the market.
4. **Fill the Area Between High and Low**: The area between the high and low levels is filled with a translucent yellow color to visually emphasize the first five-minute range.
5. **Alerts for Breakouts**: Alerts are set to notify the user when the price closes above or below the first five-minute range. This helps traders stay informed of potential breakout opportunities beyond this key opening range.
This indicator is useful for day traders looking to leverage the first few minutes of NYSE trading to identify early support and resistance levels and to spot breakout opportunities.
20-day High BreakoutOverview:
The 20-day High Breakout Indicator is a very simple yet powerful tool designed for traders seeking to capitalize on significant price movements in the stock market. This indicator identifies potential buy and sell signals based on a stock's 20-day high breakout levels, making it an essential addition to your trading strategy.
Key Features:
Swing Period Input: Customize the swing period to your preferred number of days, with a default of 20 days, allowing flexibility based on your trading style.
Trailing Stop Level: Automatically calculates the trailing stop level based on the highest high and lowest low within the defined swing period, helping to manage risk and lock in profits.
Buy and Sell Signals: Generates clear buy signals when the price crosses above the trailing stop level and sell signals when the price crosses below, enabling timely entries and exits.
Visual Indicators: Plots buy signals as green upward triangles below the bars and sell signals as red downward triangles above the bars, providing easy-to-interpret visual cues directly on the chart.
How It Works:
Resistance and Support Levels: The indicator calculates the highest high (resistance) and lowest low (support) over the defined swing period.
Swing Direction: It determines the market direction by comparing the current closing price to the previous resistance and support levels.
Trailing Stop Calculation: Depending on the market direction, the trailing stop level is set to either the support or resistance level.
Signal Generation: Buy and sell signals are generated based on the crossover of the closing price and the trailing stop level, filtered to ensure only valid signals are displayed.
Visual Representation: The trailing stop level is plotted as a line, and buy/sell signals are marked with respective shapes for easy identification.
Usage:
Trend Following: Ideal for traders looking to follow trends and catch significant breakouts in the stock price.
Risk Management: Helps in managing risk by providing a trailing stop level that adjusts with market movements.
Visual Clarity: The clear visual signals make it easy for traders to interpret and act upon the indicator's signals.
Add the 20-day High Breakout Indicator to your TradingView charts to enhance your trading strategy and gain an edge in identifying profitable trading opportunities.

KillZones + ACD Fisher [TradingFinder] Sessions + Reversal Level🔵 Introduction
🟣 ACD Method
"The Logical Trader" opens with a thorough exploration of the ACD Methodology, which focuses on pinpointing particular price levels associated with the opening range.
This approach enables traders to establish reference points for their trades, using "A" and "C" points as entry markers. Additionally, the book covers the concept of the "Pivot Range" and how integrating it with the ACD method can help maximize position size while minimizing risk.
🟣 Session
The forex market is operational 24 hours a day, five days a week, closing only on Saturdays and Sundays. Typically, traders prefer to concentrate on one specific forex trading session rather than attempting to trade around the clock.
Trading sessions are defined time periods when a particular financial market is active, allowing for the execution of trades.
The most crucial trading sessions within the 24-hour cycle are the Asia, London, and New York sessions, as these are when substantial money flows and liquidity enter the market.
🟣 Kill Zone
Traders in financial markets earn profits by capitalizing on the difference between their buy/sell prices and the prevailing market prices.
Traders vary in their trading timelines.Some traders engage in daily or even hourly trading, necessitating activity during periods with optimal trading volumes and notable price movements.
Kill zones refer to parts of a session characterized by higher trading volumes and increased price volatility compared to the rest of the session.
🔵 How to Use
🟣 Session Times
The "Asia Session" comprises two parts: "Sydney" and "Tokyo." This session begins at 23:00 and ends at 06:00 UTC. The "Asia KillZone" starts at 23:00 and ends at 03:55 UTC.
The "London Session" includes "Frankfurt" and "London," starting at 07:00 and ending at 14:25 UTC. The "London KillZone" runs from 07:00 to 09:55 UTC.
The "New York" session starts at 14:30 and ends at 19:25 UTC, with the "New York am KillZone" beginning at 14:30 and ending at 22:55 UTC.
🟣 ACD Methodology
The ACD strategy is versatile, applicable to various markets such as stocks, commodities, and forex, providing clear buy and sell signals to set price targets and stop losses.
This strategy operates on the premise that the opening range of trades holds statistical significance daily, suggesting that initial market movements impact the market's behavior throughout the day.
Known as a breakout strategy, the ACD method thrives in volatile or strongly trending markets like crude oil and stocks.
Some key rules for employing the ACD strategy include :
Utilize points A and C as critical reference points, continually monitoring these during trades as they act as entry and exit markers.
Analyze daily and multi-day pivot ranges to understand market trends. Prices above the pivots indicate an upward trend, while prices below signal a downward trend.
In forex trading, the ACD strategy can be implemented using the ACD indicator, a technical tool that gauges the market's supply and demand balance. By evaluating trading volume and price, this indicator assists traders in identifying trend strength and optimal entry and exit points.
To effectively use the ACD indicator, consider the following :
Identifying robust trends: The ACD indicator can help pinpoint strong, consistent market trends.
Determining entry and exit points: ACD generates buy and sell signals to optimize trade timing.
Bullish Setup :
When the "A up" line is breached, it’s wise to wait briefly to confirm it’s not a "Fake Breakout" and that the price stabilizes above this line.
Upon entering the trade, the most effective stop loss is positioned below the "A down" line. It's advisable to backtest this to ensure the best outcomes. The recommended reward-to-risk ratio for this strategy is 1, which should also be verified through backtesting.
Bearish Setup :
When the "A down" line is breached, it’s prudent to wait briefly to ensure it’s not a "Fake Breakout" and that the price stabilizes below this line.
Upon entering the trade, the most effective stop loss is positioned above the "A up" line. Backtesting is recommended to confirm the best results. The recommended reward-to-risk ratio for this strategy is 1, which should also be validated through backtesting.
Advantages of Combining Kill Zone and ACD Method in Market Analysis :
Precise Trade Timing : Integrating the Kill Zone strategy with the ACD Method enhances precision in trade entries and exits. The ACD Method identifies key points for trading, while the Kill Zone focuses on high-activity periods, together ensuring optimal timing for trades.
Better Trend Identification : The ACD Method’s pivot ranges help spot market trends, and when combined with the Kill Zone’s emphasis on periods of significant price movement, traders can more effectively identify and follow strong market trends.
Maximized Profits and Minimized Risks : The ACD Method's structured approach to setting price targets and stop losses, coupled with the Kill Zone's high-volume trading periods, helps maximize profit potential while reducing risk.
Robust Risk Management : Combining these methods provides a comprehensive risk management strategy, strategically placing stop losses and protecting capital during volatile periods.
Versatility Across Markets : Both methods are applicable to various markets, including stocks, commodities, and forex, offering flexibility and adaptability in different trading environments.
Enhanced Confidence : Using the combined insights of the Kill Zone and ACD Method, traders gain confidence in their decision-making process, reducing emotional trading and improving consistency.
By merging the Kill Zone’s focus on trading volumes and the ACD Method’s structured breakout strategy, traders benefit from a synergistic approach that enhances precision, trend identification, and risk management across multiple markets.

ICT KillZones + Pivot Points [TradingFinder] Support/Resistance 🟣 Introduction
Pivot Points are critical levels on a price chart where trading activity is notably high. These points are derived from the prior day's price data and serve as key reference markers for traders' decision-making processes.
Types of Pivot Points :
Floor
Woodie
Camarilla
Fibonacci
🔵 Floor Pivot Points
Widely utilized in technical analysis, floor pivot points are essential in identifying support and resistance levels. The central pivot point (PP) acts as the primary level, suggesting the trend's likely direction.
The additional resistance levels (R1, R2, R3) and support levels (S1, S2, S3) offer further insight into potential trend reversals or continuations.
🔵 Camarilla Pivot Points
Featuring eight distinct levels, Camarilla pivot points closely correspond with support and resistance, making them highly effective for setting stop-loss orders and profit targets.
🔵 Woodie Pivot Points
Similar to floor pivot points, Woodie pivot points differ by placing greater emphasis on the closing price, often resulting in different pivot levels compared to the floor method.
🔵 Fibonacci Pivot Points
Fibonacci pivot points combine the standard floor pivot points with Fibonacci retracement levels applied to the previous trading period's range. Common retracement levels used are 38.2%, 61.8%, and 100%.
🟣 Sessions
Financial markets are divided into specific time segments, known as sessions, each with unique characteristics and activity levels. These sessions are active at different times throughout the day.
The primary sessions in financial markets include :
Asian Session
European Session
New York Session
The timing of these major sessions in UTC is as follows :
Asian Session: 23:00 to 06:00
European Session: 07:00 to 14:25
New York Session: 14:30 to 22:55
🟣 Kill Zones
Kill zones are periods within a session marked by heightened trading activity. During these times, trading volume surges and price movements become more pronounced.
The timing of the major kill zones in UTC is :
Asian Kill Zone: 23:00 to 03:55
European Kill Zone: 07:00 to 09:55
New York Kill Zone: 14:30 to 16:55
Combining kill zones and pivot points in financial market analysis provides several advantages :
Enhanced Market Sentiment Analysis : Aligns key price levels with high-activity periods for a clearer market sentiment.
Improved Timing for Trade Entries and Exits : Helps better time trades based on when price movements are most likely.
Higher Probability of Successful Trades : Increases the accuracy of predicting market movements and placing profitable trades.
Strategic Stop-Loss and Profit Target Placement : Allows for precise risk management by strategically setting stop-loss and profit targets.
Versatility Across Different Time Frames : Effective in both short and long time frames, suitable for various trading strategies.
Enhanced Trend Identification and Confirmation : Confirms trends using both pivot levels and high-activity periods, ensuring stronger trend validation.
In essence, this integrated approach enhances decision-making, optimizes trading performance, and improves risk management.
🟣 How to Use
🔵 Two Approaches to Trading Pivot Points
There are two main strategies for trading pivot points: utilizing "pivot point breakouts" and "price reversals."
🔵 Pivot Point Breakout
When the price breaks through pivot lines, it signals a shift in market sentiment to the trader. In the case of an upward breakout, where the price crosses these pivot lines, a trader might enter a long position, placing their stop-loss just below the pivot point (P).
Conversely, if the price breaks downward, a short position can be initiated below the pivot point. When using the pivot point breakout strategy, the first and second support levels can serve as profit targets in an upward trend. In a downward trend, these roles are filled by the first and second resistance levels.
🔵 Price Reversal
An alternative method involves waiting for the price to reverse at the support and resistance levels. To implement this strategy, traders should take positions opposite to the prevailing trend as the price rebounds from the pivot point.
While this tool is commonly used in higher time frames, it tends to produce better results in shorter time frames, such as 1-hour, 30-minute, and 15-minute intervals.
Three Strategies for Trading the Kill Zone
There are three principal strategies for trading within the kill zone :
Kill Zone Hunt
Breakout and Pullback to Kill Zone
Trading in the Trend of the Kill Zone
🔵 Kill Zone Hunt
This strategy involves waiting until the kill zone concludes and its high and low lines are established. If the price reaches one of these lines within the same session and is strongly rejected, a trade can be executed.
🔵 Breakout and Pullback to Kill Zone
In this approach, once the kill zone ends and its high and low lines stabilize, a trade can be made if the price breaks one of these lines decisively within the same session and then pulls back to that level.
🔵 Trading in the Trend of the Kill Zone
Kill zones are characterized by high trading volumes and strong trends. Therefore, trades can be placed in the direction of the prevailing trend. For instance, if an upward trend dominates this area, a buy trade can be entered when the price reaches a demand order block.

Market Structure (Breakers) [LuxAlgo]The Market Structure (Breakers) indicator aims to detect "Breaker Market Structures", an original concept inspired by breaker blocks, and extend on the original concept of market structures by extending existing MS levels, providing supports/resistances as a result.
Various graphical elements are included that highlight the interactions between price and Breaker structures.
🔶 USAGE
Breaker structures occur when a market structure is confirmed (price breaking a previous swing level). The broken swing point is extended by a dotted line which can be used as potential support or resistance.
After a market structure, the price can eventually reverse and break one or multiple breaker structures at the same time, allowing for the detection of new trends in the price.
A market structure closer to the top/bottom of a trend can return Breaker structures breakouts more indicative of potential reversals.
Breakers MS breakouts can also be useful as exits for entries done using market market structures.
The script additionally highlights support/resistance events by highlighting candle borders, with a border using a green color indicating support events while a red color is indicative of a resistance event.
🔹 Breaker Structure Lifespan
The "lifespan" of Breaker structures, that is the amount of time the script will extend/evaluate them is determined by various user settings.
The Maximum Breaks setting determines the maximum amount of breaks a breaker structure can withstand before it is broken.
For example, a maximum amount of breaks of 3 for a bearish breaker structure would require the price to cross under that precise breaker structure level three times. Using higher values of this setting will also highlight more Breakers MS.
The Breaker Maximum Duration setting on the other hand determines how many bars a breaker structure can be evaluated without being broken. If a breaker structure is not broken after this amount of bars then it will stop being evaluated and will be removed.
🔶 SETTINGS
Swings Period: Period used for the swing detection, with higher values returning longer term markter structures.
Maximum Breaks: Amount of break required for a breaker block to be considered broken.
Breaker Maximum Duration: Maximum duration of a breaker block (in bars).

Consolidation Spotter Multi Time FrameThis tool is designed for traders looking to spot areas of consolidation on their charts across various time frames. It highlights these consolidation areas using visually appealing boxes, making it easier to identify potential breakout or breakdown zones.
How To Use:
Spotting Consolidation: When you see a box form on your chart, this represents a consolidation zone. Within this zone, the price is moving sideways without a strong upward or downward trend.
Anticipating Breakouts & Breakdowns: Watch the price as it approaches the edges of the box. A movement outside the box can signal a potential breakout (if above the box) or a breakdown (if below the box). This is where momentum shifts can happen.
Momentum Confirmation: Once the price clearly moves out of the box, it indicates a momentum shift. If the price moves upwards out of the box, this can be seen as bullish momentum. Conversely, if the price moves downwards out of the box, this can be seen as bearish momentum.
To use the tool effectively, adjust the settings to suit your trading style, choose your preferred visual theme, and watch as the script highlights key consolidation areas on your chart.
Tip: To visualize fractals, consider using multiple instances of the "Consolidation Spotter" indicator, each set to a different timeframe. This approach allows you to observe consolidations nested within larger consolidations, offering deeper insights into market structures. 😉

PDHL levels with INTRADAY Auto FIBThe present script includes Previous day High/low levels and once the PDH or PDL breaks the present bar's background changes color according to the direction of price breakout.
It's helpful when working on lower timeframe charts with small screen space, so that the user can know that the PDHL has been taken out in one glance at the chart instead of scrolling all around to find out whether the PDH or PDL are broken or not.
The high and low of day before yesterday are also plotted for reference.
The intraday fib levels get drawn taking present day's high and low into account, useful to mark support/retest levels.
The color of the intraday AUTO FIB high and low lines also change from gray to respective assigned colors once the present day price crosses PDH or PDL this is helpful while viewing charts on mobile app.
Disclaimer: Only for studying price movement ideas, trading is not advised.

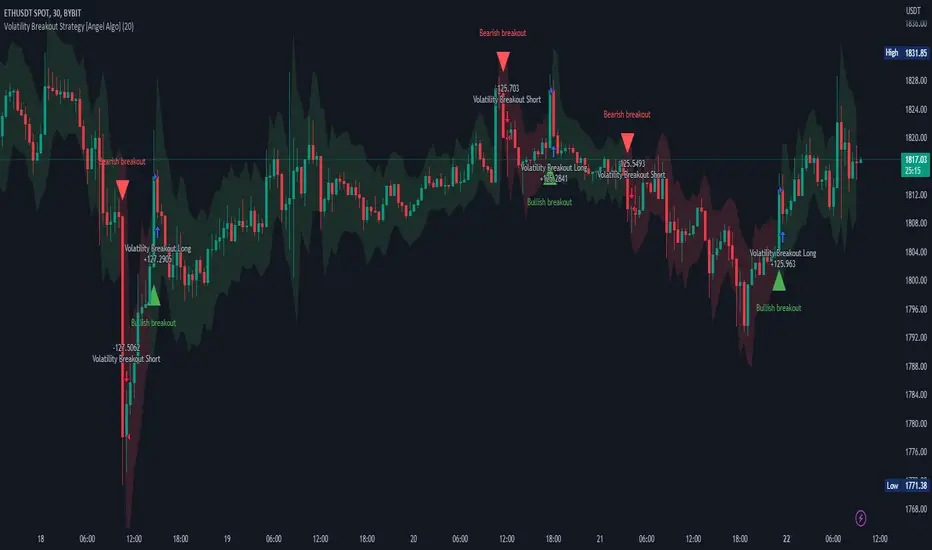
Volatility Breakout Strategy [Angel Algo]As traders, we're always looking for opportunities to profit from sudden price breakouts, and the Volatility Breakout Strategy aims to do just that.
This script is the perfect starting point for traders who want to experiment with capturing price movements resulting from increased volatility. The script plots the Average True Range (ATR) on the chart, which is a measure of the asset's volatility over a specified period. By setting the "Length" parameter, you can customize the period over which the volatility is measured.
Using the ATR, the strategy calculates upper and lower breakout levels and plots them on the chart. The signals for long and short positions are generated when the price crosses above the upper breakout level or below the lower breakout level, respectively. They are confirmed by checking the current bar state.
The strategy also fills the space between the upper and lower breakout levels with a color that indicates the latest signal direction. This feature helps traders quickly identify the prevailing trend.
The strategy uses the generated signals to enter trades. When a long or short signal is confirmed, and there is no open position in the direction of the signal, the strategy enters a long or short trade, respectively.
Choice of parameters.
Choosing the right value for the Length input parameter is crucial for tailoring the Volatility Breakout Strategy to suit your trading preferences. In general, a higher Length value implies a focus on capturing longer price moves. For instance, in this script, we have set the Length value to 20, resulting in trades that span approximately 100 candles. These trades encompass price trends consisting of multiple swings.
However, if your goal is to trade individual swings rather than longer trends, it's advisable to experiment with smaller values for the Length parameter. By reducing the Length, you can target shorter-term price movements and potentially increase the frequency of trades.
It's important to note that while a higher Length value tends to lead to longer trades, there is no strict correlation between the Length parameter and the average length of trades. This can vary across different markets. Therefore, it's essential to conduct thorough experimentation with various Length values and closely observe the length of trades they generate. Comparing these trade lengths with the average trend or swing length in the specific market can provide valuable insights.
Ideally, you should aim to select a Length value that aligns with the average trend or swing length observed in the market you are trading. This way, you can optimize the strategy to capture price movements that closely match the prevailing market conditions.
Remember, finding the optimal Length value is a process of trial and error, combined with careful observation of trade lengths and their correlation with market trends. So, don't be afraid to experiment and refine the Length parameter to maximize the effectiveness of the Volatility Breakout Strategy in your chosen market.
Disclaimer: This trading strategy is provided for educational and informational purposes only.Trading involves risk, and past performance is not indicative of future results.
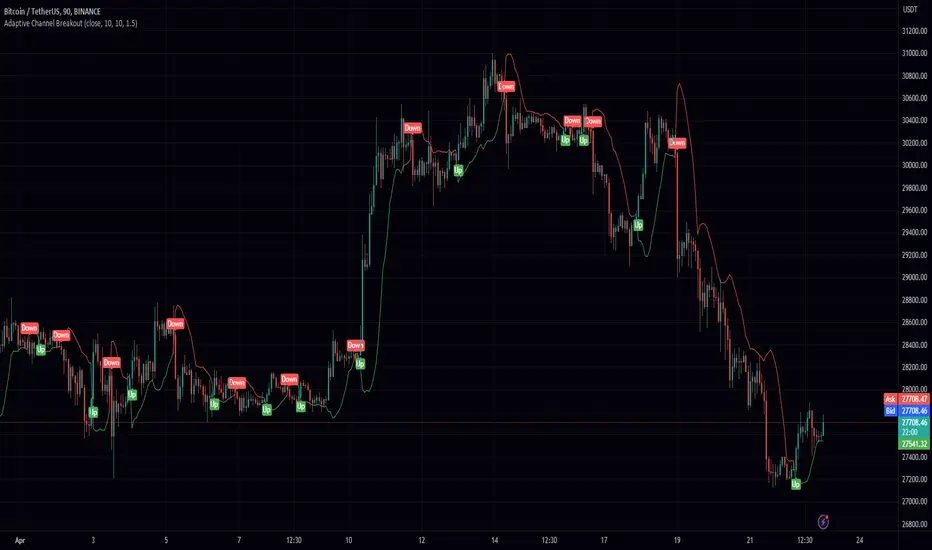
Adaptive Channel BreakoutIntroducing the "Adaptive Channel Breakout" indicator, an advanced charting tool that employs the acb function from the PeacefulIndicators library. This powerful indicator helps traders detect potential breakouts and trends by displaying an adaptive channel on the chart.
Key features of the Adaptive Channel Breakout indicator include:
Customizable input parameters: Adjust the moving average length, volatility length, and multiplier to suit your trading preferences and strategy.
Utilizes the acb function from the PeacefulIndicators library, which calculates the adaptive channel using a simple moving average (SMA) and standard deviation to measure volatility. The function also tracks the trend direction based on price crossovers and crossunders.
Clear visual representation: The adaptive channel is displayed as a linebr plot, with the color indicating the current trend direction (green for uptrends and red for downtrends).
Trend signals: The indicator includes up and down arrow labels that signify potential trend reversals, providing traders with valuable entry and exit points.
Overlay functionality: Designed to be displayed directly on the price chart for easy analysis and correlation with price action.
To use the Adaptive Channel Breakout indicator, simply add the script to your chart and customize the input parameters as needed.
Open DriveOpen Drive is a market profile concept introduced by Jim Dalton. It occurs when the price moves directionally and persistently for the first 30 minutes from the cash market open.
It is necessary to use 30-minute bars as there needs to be enough time to measure an extreme move of the cash open. This means there will be fewer trades than other strategies using faster time periodicities.
The script finds open drives from these time points 0700/ 0800 and 1300/1430.
The entry signal also has a breakout threshold using the 5-bar high and 5-bar low to only take trades moving away from the prior 5-bar range. This weeds out most mid-range trades and small range expansion bars.
If the price has had a strong move from the open and has broken either below the prior 5-bar low or above the prior 5-bar high by an amount equal to the prior 5-bar range a trade is entered in the direction of the move.
The Exit criteria; exit after 3 bars which is 90mins when using a 30min periodicity.
Note, this script is shared to show that momentum generated on or around the cash open tends to persist. The entry and exits of this strategy are quite naive but there are plenty of ways to take more aggressive entries on faster time frames when an open drive occurs. The times chosen for this strategy will suit stock index futures mainly. The user can experiment with other futures products and their corresponding pit/ cash open hours.
Google "open drive market profile" for more information on open drives and market profile concepts.
Happy trading!

DB CCI Breakout MTFDB CCI Breakout MTF
What does the indicator do?
The indicator will display crypto breakout and fallouts based on 4 timeframe CCI values. By default the current chart timeframe is used and the user may chose 3 other timeframes in the settings. Additionally, the symbol may be configured in the indicator settings. Default is Coinbase:ETHUSD.
The indicator will monitor the CCI levels on 4 timeframes and will alert to any CCI activity over 100 or under -100 which would indicate a breakout or fallout is present.
A green diamond is displayed when a breakout is detected on one or more of the timeframes for the selected symbol.
How should this indicator be used?
The indicator is a secondary alert system for the presence of breakouts or fallout conditions as under those scenarios position exit or entry strategies may be different.
Does the indicator include any alerts?
Not in this version. But I could add some if desired.
Use at your own risk and do your own diligence.
Enjoy!

Fake breakHi Traders,
I've developed an indicator which can detect fake-breaks on the chart.
In the following you'll find the definition of the fake break candles and also you will find how to recognize it on the chart with practical examples.
What is the fake break pattern?
Sometimes support and resistance lines broke with a full body and strong candles that gives us the idea of sharp movements on the chart but suddenly the next candle returns all the path of the previous candle. in this case we can say fake break is happening on the chart.
This indicator detect fake break patterns based on two criteria:
1. It uses AverageTrueRange indicator to measure the strength of the pattern.
2. The returning candle should engulf minimum 75% of the break candle.
This indicator plot 2 terms in the name of "FB-D" and "FB-U" that are abbreviations of the "Fake Break Down" and "Fake Break Up".
You can also set alerts to get notified when fake breakout happens on the chart.
Notice: This pattern is only acceptable in valid support and resistance zones and you can not rely on it everywhere on the chart (specially in the middle of the waves).
Notice: The source code of this indicator is open and you are allowed to use it on your scripts by mentioning the name of author.
Disclaimer: This is not a financial advice or any signal to buy or sell, the goal of developing such an indicator is to use for educational purposes.

Nearest Percentile Moving Average BandsWhile coding some filters into another indicator for Long/Short I noticed that ta.nearest.percentile might be the most useful tool in pinescript I've ever encountered.
While percentile_nearest can be used for all kind of things I decided to code moving averages from it and made bands for bottom percentage and top percentage.
The indicator will calculate the top % price of the given bar length.
Example settings:
length: 150
percentile: 99
So when using 99% it will draw a green line when price is moving above the top 1% price of the last 150 candles. It then calculates if the price is below the bottom 1% of the last 150 candles.
Trading use:
Use this indicator to check if the market is leaving normal territory. This signals a breakout move for example the dogecoin pump or the top of the range. I use this indicator to catch bull/bear moves for botting purposes. An other use would be to countertrend trade after the move has ended. With price being in top 1% for a while it is very probable that we see a large correction.
Below example of dogecoin pumps:

EMA MTF PlusI like trading the 1 minute and 3 minutes time-frames. I'm what is commonly called a "scalper". Long term investments yes, I have some, but for trading, I don't have neither the time,
nor the patience to wait hours or days for my trade to be complete.
This doesn't mean I discount the higher time-frames, no, I actually rely heavily on them. I found that EMAs do a decent job as support/resistance, sometimes to a tick level of precision. And this is important for a 1 minute trader.
As such, I made this script that tracks the higher time-frames EMAs and displays the last value as a line.
I do not need the whole EMA, I'm not interested in crossovers or crossunders, these are anyway late signals for me.
What's with the triangles? These are local tops/bottoms , candles that have a have decent size of the wick. These tops and bottoms are by no means "final", they are merely a rejection at certain levels of price. Due to markets complexities (and human erratic behaviors hehe) these levels could be breached at the very next candle. For a more "final" version (nothing is really final but..) I added Schaff Trend Cycle as filter, so a triangle will pop only when a trend is mature enough ( STC with a value near 0 or near 100).
Colored bars. When the body of the candle is big, it shows strength. Strong bars tend to have follow through, especially when breaking key levels. The script looks at the body of the candle and compares it with ATR (Average True Range), if it's at least 0.8 of ATR it changes the bar color to yellow (bull candles) or fuchsia(bear candles).
Range identifier. This code is copied from Lazy Bear (if there are any issues please let me know), it's very useful in conjunction with colored bars.
I look for breakout candles that go outside of the range as a signal for a trade.
There are many ways in which this script can be useful, like trading mean reversions or momentum trades (breakouts) or simply trend following trades.
I hope you guys find it useful, you can play with default values and change them as you like, these are what I found to be working best for me and my trading universe (mostly crypto).
Special thanks for the original work of:
LazyBear
everget
Jim8080
