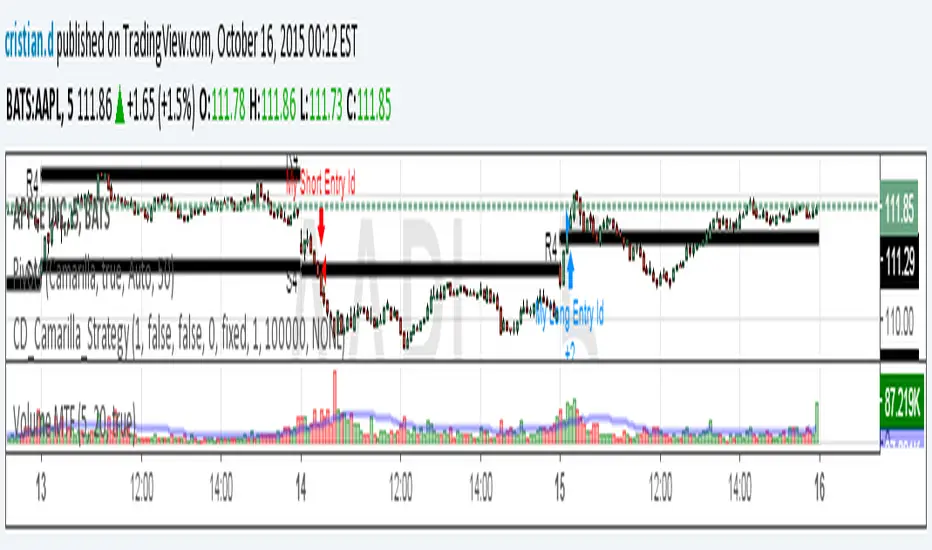
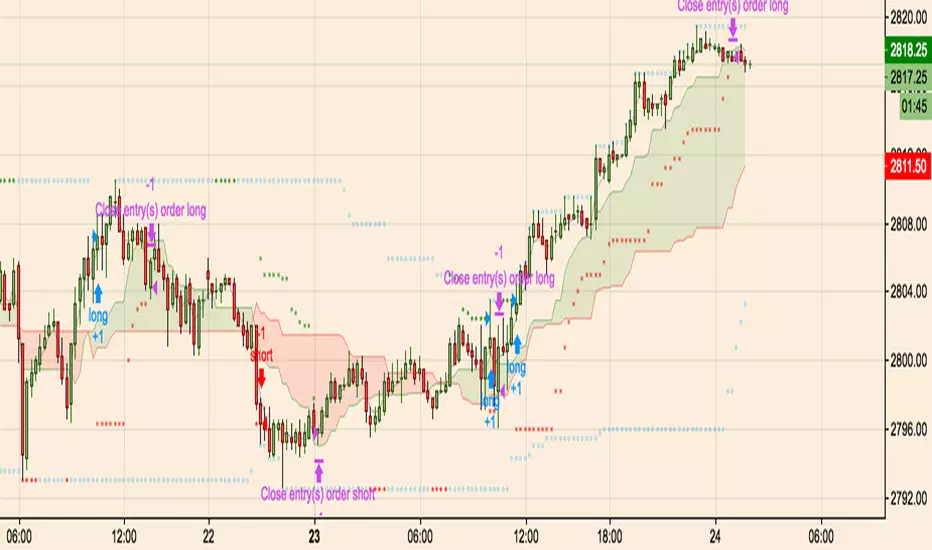
Breakout Probability (Expo)█ Overview
Breakout Probability is a valuable indicator that calculates the probability of a new high or low and displays it as a level with its percentage. The probability of a new high and low is backtested, and the results are shown in a table— a simple way to understand the next candle's likelihood of a new high or low. In addition, the indicator displays an additional four levels above and under the candle with the probability of hitting these levels.
The indicator helps traders to understand the likelihood of the next candle's direction, which can be used to set your trading bias.
█ Calculations
The algorithm calculates all the green and red candles separately depending on whether the previous candle was red or green and assigns scores if one or more lines were reached. The algorithm then calculates how many candles reached those levels in history and displays it as a percentage value on each line.
█ Example
In this example, the previous candlestick was green; we can see that a new high has been hit 72.82% of the time and the low only 28.29%. In this case, a new high was made.
█ Settings
Percentage Step
The space between the levels can be adjusted with a percentage step. 1% means that each level is located 1% above/under the previous one.
Disable 0.00% values
If a level got a 0% likelihood of being hit, the level is not displayed as default. Enable the option if you want to see all levels regardless of their values.
Number of Lines
Set the number of levels you want to display.
Show Statistic Panel
Enable this option if you want to display the backtest statistics for that a new high or low is made. (Only if the first levels have been reached or not)
█ Any Alert function call
An alert is sent on candle open, and you can select what should be included in the alert. You can enable the following options:
Ticker ID
Bias
Probability percentage
The first level high and low price
█ How to use
This indicator is a perfect tool for anyone that wants to understand the probability of a breakout and the likelihood that set levels are hit.
The indicator can be used for setting a stop loss based on where the price is most likely not to reach.
The indicator can help traders to set their bias based on probability. For example, look at the daily or a higher timeframe to get your trading bias, then go to a lower timeframe and look for setups in that direction.
-----------------
Disclaimer
The information contained in my Scripts/Indicators/Ideas/Algos/Systems does not constitute financial advice or a solicitation to buy or sell any securities of any type. I will not accept liability for any loss or damage, including without limitation any loss of profit, which may arise directly or indirectly from the use of or reliance on such information.
All investments involve risk, and the past performance of a security, industry, sector, market, financial product, trading strategy, backtest, or individual's trading does not guarantee future results or returns. Investors are fully responsible for any investment decisions they make. Such decisions should be based solely on an evaluation of their financial circumstances, investment objectives, risk tolerance, and liquidity needs.
My Scripts/Indicators/Ideas/Algos/Systems are only for educational purposes!
"breakout" için komut dosyalarını ara
Breakout CandlesCandle is considered breakout upon two conditions:
1. Volume is higher than volume ema. Input allows you to add markup so that you can check if volume > 10% more than EMA
2. Change from previous close or distance between open and close is greater than ATR Multiplier * ATR.
Breakout color is based on whether the value of previous close is higher or lower than present close.
I would love to have wick and border color changed too. But, looks like not possible :(
Breakout Trend FollowerThis is a Study mirroring the Breakout Trend Follower Strategy I made. I use this one during live trading and the other for backtesting. It will also give alerts when buy and sell signals are hit.
Breakout Relative Strength IndexIt isn't easy to determine if the price of a stock is about to break out. Here’s one way you can determine the relative strength of a breakout, enabling you to act early and realize higher profits.
This indicator was originally developed by Howard Wang Stocks & Commodities V. 33:09 (60–62)
Breakout IndicatorThis script allows you to set breakout alerts.
An alert will be triggered only when price breaks and closes beyond the specified prices. You will get an alert on the first candle that closes beyond the levels you set.
Breakout Scalperfirst draft of a breakout scalper which uses a fast and slow window
sets up some entry stops and then a trailing exit stop. performs a manual close when going sideways.
Initial Balance Breakout Signals [LuxAlgo]The Initial Balance Breakout Signals help traders identify breakouts of the Initial Balance (IB) range.
The indicator includes automatic detection of IB or can use custom sessions, highlights top and bottom IB extensions, custom Fibonacci levels, and goes further with an IB forecast with two different modes.
🔶 USAGE
The initial balance is the price range made within the first hour of the trading session. It is an intraday concept based on the idea that high volume and volatility enter the market through institutional trading at the start of the session, setting the tone for the rest of the day.
The initial balance is useful for gauging market sentiment, or, in other words, the relationship between buyers and sellers.
Bullish sentiment: Price trades above the IB range.
Mixed sentiment: Price trades within the IB range.
Bearish sentiment: Price trades below the IB range.
The initial balance high and low are important levels that many traders use to gauge sentiment. There are two main ideas behind trading around the IB range.
IB Extreme Breakout: When the price breaks and holds the IB high or low, there is a high probability that the price will continue in that direction.
IB Extreme Rejection: When the price tries to break those levels but fails, there is a high probability that it will reach the opposite IB extreme.
This indicator is a complete Initial Balance toolset with custom sessions, breakout signals, IB extensions, Fibonacci retracements, and an IB forecast. All of these features will be explained in the following sections.
🔹 Custom Sessions and Signals
By default, sessions for Initial Balance and breakout signals are in Auto mode. This means that Initial Balance takes the first hour of the trading session and shows breakout signals for the rest of the session.
With this option, traders can use the tool for open range trading, making it highly versatile. The concept behind open range (OR) is the same as that of initial balance (IB), but in OR, the range is determined by the first minute, three or five minutes, or up to the first 30 minutes of the trading session.
As shown in the image above, the top chart uses the Auto feature for the IB and Breakouts sessions. The bottom chart has the Auto feature disabled to use custom sessions for both parameters. In this case, the first three minutes of the trading session are used, turning the tool into an Open Range trading indicator.
This chart shows another example of using custom sessions to display overnight NASDAQ futures sessions.
The left chart shows a custom session from the Tokyo open to the London open, and the right chart shows a custom session from the London open to the New York open.
The chart shows both the Asian and European sessions, their top and bottom extremes, and the breakout signals from those extremes.
🔹 Initial Balance Extensions
Traders can easily extend both extremes of the Initial Balance to display their preferred targets for breakouts. Enable or disable any of them and set the IB percentage to use for the extension.
As the chart shows, the percentage selected on the settings panel directly affects the displayed levels.
Setting 25 means the tool will use a quarter of the detected initial balance range for extensions beyond the IB extremes. Setting 100 means the full IB range will be used.
Traders can use these extensions as targets for breakout signals.
🔹 Fibonacci Levels
Traders can display default or custom Fibonacci levels on the IB range to trade retracements and assess the strength of market movements. Each level can be enabled or disabled and customized by level, color, and line style.
As we can see on the chart, after the IB was completed, prices were unable to fall below the 0.236 Fibonacci level. This indicates significant bullish pressure, so it is expected that prices will rise.
Traders can use these levels as guidelines to assess the strength of the side trying to penetrate the IB. In this case, the sellers were unable to move the market beyond the first level.
🔹 Initial Balance Forecast
The tool features two different forecasting methods for the current IB. By default, it takes the average of the last ten values and applies a multiplier of one.
IB Against Previous Open: averages the difference between IB extremes and the open of the previous session.
Filter by current day of the week: averages the difference between IB extremes and the open of the current session for the same day of the week.
This feature allows traders to see the difference between the current IB and the average of the last IBs. It makes it very easy to interpret: if the current IB is higher than the average, buyers are in control; if it is lower than the average, sellers are in control.
For example, on the left side of the chart, we can see that the last day was very bullish because the IB was completely above the forecasted value. This is the IB mean of the last ten trading days.
On the right, we can see that on Monday, September 15, the IB traded slightly higher but within the forecasted value of the IB mean of the last ten Mondays. In this case, it is within expectations.
🔶 SETTINGS
Display Last X IBs: Select how many IBs to display.
Initial Balance: Choose a custom session or enable the Auto feature.
Breakouts: Enable or disable breakouts. Choose custom session or enable the Auto feature.
🔹 Extensions
Top Extension: Enable or disable the top extension and choose the percentage of IB to use.
Bottom extension: Enable or disable the bottom extension and choose the percentage of IB to use.
🔹 Fibonacci Levels
Display Fibonacci: Enable or disable Fibonacci levels.
Reverse: Reverse Fibonacci levels.
Levels, Colors & Style
Display Labels: Enable or disable labels and choose text size.
🔹 Forecast
Display Forecast: Select the forecast method.
- IB Against Previous Open: Calculates the average difference between the IB high and low and the previous day's IB open price.
- Filter by Current Day of Week: Calculates the average difference between the IB high and low and the IB open price for the same day of the week.
Forecast Memory: The number of data points used to calculate the average.
Forecast Multiplier: This multiplier will be applied to the average. Bigger numbers will result in wider predicted ranges.
Forecast Colors: Choose from a variety of colors.
Forecast Style: Choose a line style.
🔹 Style
Initial Balance Colors
Extension Transparency: Choose the extension's transparency. 0 is solid, and 100 is fully transparent.
Power Hour Breakout Signals [LuxAlgo]The Power Hour Breakout tool helps traders identify key price levels from the Power Hour and spot breakouts from those levels easily. This tool features Power Hour extensions, Fibonacci levels, and session break marks for the trader's convenience.
🔶 USAGE
The Power Hour is defined as the last hour of the trading session and is set by default from 3:00 p.m. to 4:00 p.m. New York time. During this period, volume and volatility enter the market. Traders using higher timeframes may use this period to enter or exit positions by placing MOC (Market on Close) orders.
This tool highlights the Power Hour and the top and bottom price levels. Each time prices break out from these levels, a signal is displayed on the chart.
We can use the Power Hour to gauge market sentiment:
Bullish sentiment: Price trades above the Power Hour.
Mixed sentiment: Price trades within the Power Hour.
Bearish sentiment: Price trades below the Power Hour.
🔹 Displaying Power Hours and Breakouts
By default, all detected Power Hours are displayed. Traders can manually adjust this number by disabling the "Display All" parameter in the Settings panel.
Breakouts are displayed by default, too, but this feature can be disabled as well.
The chart above shows different configurations of these parameters.
🔹 Power Hour Extensions
Traders can use Power Hour extensions as potential targets for breakout signals.
In the settings panel, traders can select the percentage of the Power Hour price range to use for each extension. For example, 100% uses the full range, 200% uses the range twice, and so on.
As seen on the chart, traders can configure different percentages for the top and bottom extensions.
🔹 Fibonacci Levels
Traders can display default or custom Fibonacci levels on the Power Hour range to identify retracement opportunities and evaluate market movement strength. Each level can be enabled or disabled, as well as customized by level, color, and line style.
For example, as we can see on the chart, prices attempt to break out at the Power Hour top level, then retrace to the 0.618 Fibonacci level, and then rise to the 200% Power Hour top extension.
🔶 SETTINGS
Display Last X Power Hours: Select how many Power Hours to display or enable the Display All feature.
Power Hour (NY Time): Choose a custom Power Hour in New York time.
🔹 Breakouts
Breakouts: Enable or disable breakouts.
Bullish Breakout: Select color for bullish breakouts.
Bearish Breakout: Select color for bearish breakouts.
🔹 Extensions
Top Extension: Enable or disable the top extension and choose the percentage of Power Hour to use.
Bottom extension: Enable or disable the bottom extension and choose the percentage of Power Hour to use.
🔹 Fibonacci Levels
Display Fibonacci: Enable or disable Fibonacci levels.
Reverse: Reverse Fibonacci levels.
Levels, Colors & Style
Display Labels: Enable or disable labels and choose text size.
🔹 Style
Power Hour Colors
Extension Transparency: Choose the extension's transparency. 0 is solid, and 100 is fully transparent.
Session Breaks: Enable or disable session breaks.
Quantitative Breakout Bands (AIBitcoinTrend)Quantitative Breakout Bands (AIBitcoinTrend) is an advanced indicator designed to adapt to dynamic market conditions by utilizing a Kalman filter for real-time data analysis and trend detection. This innovative tool empowers traders to identify price breakouts, evaluate trends, and refine their trading strategies with precision.
👽 What Are Quantitative Breakout Bands, and Why Are They Unique?
Quantitative Breakout Bands combine advanced filtering techniques (Kalman Filters) with statistical measures such as mean absolute error (MAE) to create adaptive price bands. These bands adjust to market conditions dynamically, providing insights into volatility, trend strength, and breakout opportunities.
What sets this indicator apart is its ability to incorporate both position (price) and velocity (rate of price change) into its calculations, making it highly responsive yet smooth. This dual consideration ensures traders get reliable signals without excessive lag or noise.
👽 The Math Behind the Indicator
👾 Kalman Filter Estimation:
At the core of the indicator is the Kalman Filter, a recursive algorithm used to predict the next state of a system based on past observations. It incorporates two primary elements:
State Prediction: The indicator predicts future price (position) and velocity based on previous values.
Error Covariance Adjustment: The process and measurement noise parameters refine the prediction's accuracy by balancing smoothness and responsiveness.
👾 Breakout Bands Calculation:
The breakout bands are derived from the mean absolute error (MAE) of price deviations relative to the filtered trendline:
float upperBand = kalmanPrice + bandMultiplier * mae
float lowerBand = kalmanPrice - bandMultiplier * mae
The multiplier allows traders to adjust the sensitivity of the bands to market volatility.
👾 Slope-Based Trend Detection:
A weighted slope calculation measures the gradient of the filtered price over a configurable window. This slope determines whether the market is trending bullish, bearish, or neutral.
👾 Trailing Stop Mechanism:
The trailing stop employs the Average True Range (ATR) to calculate dynamic stop levels. This ensures positions are protected during volatile moves while minimizing premature exits.
👽 How It Adapts to Price Movements
Dynamic Noise Calibration: By adjusting process and measurement noise inputs, the indicator balances smoothness (to reduce noise) with responsiveness (to adapt to sharp price changes).
Trend Responsiveness: The Kalman Filter ensures that trend changes are quickly identified, while the slope calculation adds confirmation.
Volatility Sensitivity: The MAE-based bands expand and contract in response to changes in market volatility, making them ideal for breakout detection.
👽 How Traders Can Use the Indicator
👾 Breakout Detection:
Bullish Breakouts: When the price moves above the upper band, it signals a potential upward breakout.
Bearish Breakouts: When the price moves below the lower band, it signals a potential downward breakout.
The trailing stop feature offers a dynamic way to lock in profits or minimize losses during trending moves.
👾 Trend Confirmation:
The color-coded Kalman line and slope provide visual cues:
Bullish Trend: Positive slope, green line.
Bearish Trend: Negative slope, red line.
👽 Why It’s Useful for Traders
Dynamic and Adaptive: The indicator adjusts to changing market conditions, ensuring relevance across timeframes and asset classes.
Noise Reduction: The Kalman Filter smooths price data, eliminating false signals caused by short-term noise.
Comprehensive Insights: By combining breakout detection, trend analysis, and risk management, it offers a holistic trading tool.
👽 Indicator Settings
Process Noise (Position & Velocity): Adjusts filter responsiveness to price changes.
Measurement Noise: Defines expected price noise for smoother trend detection.
Slope Window: Configures the lookback for slope calculation.
Lookback Period for MAE: Defines the sensitivity of the bands to volatility.
Band Multiplier: Controls the band width.
ATR Multiplier: Adjusts the sensitivity of the trailing stop.
Line Width: Customizes the appearance of the trailing stop line.
Disclaimer: This indicator is designed for educational purposes and does not constitute financial advice. Please consult a qualified financial advisor before making investment decisions.
False Breakouts [TradingFinder] Fake Breakouts Failure🔵 Introduction
Technical indicators are essential tools for analysts and traders in financial markets, helping them predict price movements and make better trading decisions. One of the key concepts in technical analysis that should be carefully considered is the "False Breakout."
This phenomenon occurs when a price temporarily breaks through a significant support or resistance level but fails to hold and quickly returns to its previous range. Understanding this concept and applying it in trading can reduce risks and increase profitability.
🟣 What is a False Breakout?
A Fake Breakout, as the name suggests, refers to a breakout that appears to occur but fails to sustain, leading the price to quickly revert back to its previous range. This situation often happens when inexperienced or non-professional traders, under psychological pressure and eager to enter the market quickly, initiate trades.
This creates opportunities for professional traders to take advantage of these short-term fluctuations and execute successful trades.
🟣 The Importance of Recognizing False Breakouts
Recognizing False Breakouts is crucial for any trader aiming for success in financial markets. False Breakouts typically occur when the market approaches a critical support or resistance level.
In these situations, many traders are waiting to see if the price will break through this level. However, when the price quickly returns to its previous range, it indicates weakness in the movement and the inability to sustain the breakout.
🟣 How to identify False Breakouts?
To identify Fake Breakouts, it is important to carefully analyze price charts and look for signs of a quick price reversal after breaking a key level.
Here are some chart patterns that may help you identify a False Breakout :
1. Pin Bar Pattern : The Pin Bar is a candlestick pattern that indicates a price reversal. This pattern usually appears near support and resistance levels, showing that the price attempted to break through a key level but failed and reversed.
2. Fakey Pattern : This pattern, which consists of several candlesticks, indicates a False Breakout and a quick price return to the previous range. It usually appears near key levels and can signal a trend reversal.
3. Using Multiple Timeframes : One way to identify False Breakouts is by using charts of different timeframes. Sometimes, a breakout on a one-hour chart may be a False Breakout on a daily chart. Analyzing charts across multiple timeframes can help you accurately identify this phenomenon.
🔵 How to Use
Once you identify a False Breakout, you can use it as a trading signal. For this, it is best to look for trading opportunities in the opposite direction of the False Breakout. In other words, if a False Breakout occurs at a resistance level, you might consider selling opportunities, and if it happens at a support level, you might look for buying opportunities.
Here are some key points for trading based on False Breakouts :
1. Patience and Discipline : Patience and discipline are crucial when trading with False Breakouts. Wait for the False Breakout to clearly form before entering a trade.
2. Use Stop Loss : Setting an appropriate stop loss is vital when trading based on False Breakouts. Typically, the stop loss can be placed near the level where the False Breakout occurred.
3. Seek Confirmations : Before entering a trade, look for additional confirmations. These can include other analyses or technical indicators that show the price is likely to return to its previous level.
🔵 Settings
🟣 Logical settings
Swing period : You can set the swing detection period.
Max Swing Back Method : It is in two modes "All" and "Custom". If it is in "All" mode, it will check all swings, and if it is in "Custom" mode, it will check the swings to the extent you determine.
Max Swing Bac k: You can set the number of swings that will go back for checking.
🟣 Display settings
Displaying or not displaying swings and setting the color of labels and lines.
🟣 Alert Settings
Alert False Breakout : Enables alerts for Breakout.
Message Frequency : Determines the frequency of alerts. Options include 'All' (every function call), 'Once Per Bar' (first call within the bar), and 'Once Per Bar Close' (final script execution of the real-time bar). Default is 'Once per Bar'.
Show Alert Time by Time Zone : Configures the time zone for alert messages. Default is 'UTC'.
🔵Conclusion
False Breakouts, as a key concept in technical analysis, are powerful tools for identifying sudden price changes and using them in trading. Understanding this phenomenon and applying it can help traders perform better in financial markets and avoid potential losses.
To benefit from False Breakouts, traders need to carefully analyze charts and use the appropriate analytical tools. By leveraging this strategy, traders can achieve lower-risk and higher-reward trades.
ADR Checker - Breakouts📈 ADR Checker – Breakouts
Gain the edge by knowing when a stock has already made its move.
🚀 What It Does:
The ADR Checker - Breakouts is a powerful yet simple visual tool that helps traders instantly assess whether a stock has already exceeded its Average Daily Range (ADR) for the day — a critical piece of information for momentum traders, swing traders, and especially those following breakout, VCP, or CANSLIM strategies.
Using a customizable on-screen table that always stays in view (regardless of zoom or chart scaling), this script shows:
✅ Average ADR% – 20-day average range, calculated in %.
📊 Today’s Move – how much the stock has moved today.
🔥 % of Avg ADR – today's move relative to its historical average, with live color feedback:
🟥 Over 100% (Overextended – danger!)
🟧 70-100% (Caution zone)
🟩 Below 70% (Room to move)
💡 Why It Matters:
One of the most overlooked mistakes by breakout traders is entering a trade after the move has already happened. If a stock has already moved more than its typical daily range, the odds of further continuation sharply decrease, while the risk of pullback or chop increases.
With this tool, you can:
🚫 Avoid chasing extended breakouts
🎯 Time entries before the real move
⚠️ Quickly assess risk/reward potential intraday
🧠 Example Use Case:
Imagine you're watching a classic VCP setup or flat base breakout. The stock breaks out on volume—but when you check this indicator, you see:
Today’s Move: 7.2%
Avg ADR: 5.3%
% of ADR: 135% 🟥
This tells you the stock is already well beyond its average daily range. While it may continue higher, odds now favor a consolidation, shakeout, or pullback. This is your cue to wait for a better entry or pass entirely.
On the flip side, if the breakout just started and the % of ADR is still under 50%, you have confirmation that there’s room to run — giving you more confidence to enter early.
⚙️ Fully Customizable:
Choose position on screen (top/bottom left/right)
Customize text color, background, and size
🔧 Install This Tool and:
✅ Stop chasing extended moves
✅ Add discipline to your entries
✅ Improve your breakout win rate
Perfect for VCP, CANSLIM, and BREAKOUT traders who want a clean, edge-enhancing visual guide.
Multi-Band Breakout IndicatorThe Multi-Band Breakout Indicator was created to help identify potential breakout opportunities in the market. It combines multiple bands (ATR-Based and Donchian) and moving averages to provide valuable insights into the underlying trend and potential breakouts. By understanding the calculations, interpretation, parameter adjustments, potential applications, and limitations of the indicator, traders can effectively incorporate it into their trading strategy.
Calculation:
The indicator utilizes several calculations to plot the bands and moving averages. The length parameter determines the period used for the Average True Range (ATR), which measures volatility. A higher length captures a longer-term view of price movement, while a lower length focuses on shorter-term volatility. The multiplier parameter adjusts the distance of the upper and lower bands from the ATR. A higher multiplier expands the bands, accommodating greater price volatility, while a lower multiplier tightens the bands, reflecting lower volatility. The MA Length parameter determines the period for the moving averages used to calculate the trend and trend moving average. A higher MA Length creates a smoother trend line, filtering out shorter-term fluctuations, while a lower MA Length provides a more sensitive trend line.
The Donchian calculations in the Multi-Band Breakout Indicator play a significant role in identifying potential breakout opportunities and providing additional confirmation for trading signals. In this indicator, the Donchian calculations are applied to the trend line, which represents the average of the upper and lower bands. To calculate the Donchian levels, the indicator uses the Donchian Length parameter, which determines the period over which the highest high and lowest low are calculated. A longer Donchian Length captures a broader price range, while a shorter length focuses on more recent price action. By incorporating the Donchian calculations into the Multi-Band Breakout Indicator, traders gain an additional layer of confirmation for breakout signals.
Interpretation:
The Multi-Band Breakout Indicator offers valuable interpretation for traders. The upper and lower bands represent dynamic levels of resistance and support, respectively. These bands reflect the potential price range within which the asset is expected to trade. The trend line is the average of these bands and provides a central reference point for the overall trend. When the price moves above the upper band, it suggests a potential overbought condition and a higher probability of a pullback. Conversely, when the price falls below the lower band, it indicates a potential oversold condition and an increased likelihood of a bounce. The trend moving average further smooths the trend line, making it easier to identify the prevailing direction.
The crossover of the trend line (representing the average of the upper and lower bands) and the trend moving average holds a significant benefit for traders. This crossover serves as a powerful signal for potential trend changes and breakout opportunities in the market. When the trend line crosses above the trend moving average, it suggests a shift in momentum towards the upside, indicating a potential bullish trend. This provides traders with an early indication of a possible upward movement in prices. Conversely, when the trend line crosses below the trend moving average, it indicates a shift in momentum towards the downside, signaling a potential bearish trend. This crossover acts as an early warning for potential downward price movement. By identifying these crossovers, traders can capture the initial stages of a new trend, enabling them to enter trades at favorable entry points and potentially maximize their profit potential.
Breakout Signals:
For bullish breakouts, the indicator looks for a bullish crossover between the trend line and the trend moving average. This crossover suggests a shift in momentum towards the upside. Additionally, it checks if the current price has broken above the upper band and the previous Donchian high. This confirms that the price is surpassing a previous resistance level, indicating further upward movement.
For bearish breakouts, the indicator looks for a bearish crossunder between the trend line and the trend moving average. This crossunder indicates a shift in momentum towards the downside. It also checks if the current price has broken below the lower band and the previous Donchian low. This confirms that the price is breaking through a previous support level, signaling potential downward movement.
When a bullish or bearish breakout is detected, it suggests a potential trading opportunity. Traders may consider initiating positions in the direction of the breakout, anticipating further price movement in that direction. However, it's important to remember that breakouts alone do not guarantee a successful trade. Other factors, such as market conditions, volume, and confirmation from additional indicators, should be taken into account. Risk management techniques should also be implemented to manage potential losses.
Coloration:
The coloration in the Multi-Band Breakout Indicator is used to visually represent different aspects of the indicator and provide valuable insights to traders. Let's break down the coloration components:
-- Trend/Basis Color : The tColor variable determines the color of the bars based on the relationship between the trend line (trend) and the closing price (close), as well as the relationship between the trend line and the trend moving average (trendMA). If the trend line is above the closing price and the trend moving average is also above the closing price, the bars are colored fuchsia, indicating a potential bullish trend. If the trend line is below the closing price and the trend moving average is also below the closing price, the bars are colored lime, indicating a potential bearish trend. If neither of these conditions is met, the bars are colored yellow, representing a neutral or indecisive market condition.
-- Moving Average Color : The maColor variable determines the color of the filled area between the trend line and the trend moving average. If the trend line is above the trend moving average, the area is filled with a lime color with 70% opacity, indicating a potential bullish trend. Conversely, if the trend line is below the trend moving average, the area is filled with a fuchsia color with 70% opacity, indicating a potential bearish trend. This coloration helps traders visually identify the relationship between the trend line and the trend moving average.
-- highColor and lowColor : The highColor and lowColor variables determine the colors of the high Donchian band (hhigh) and the low Donchian band (llow), respectively. These bands represent dynamic levels of resistance and support. If the highest point in the previous Donchian period (hhigh) is above the upper band, the highColor is set to olive with 90% opacity, indicating a potential resistance level. On the other hand, if the lowest point in the previous Donchian period (llow) is below the lower band, the lowColor is set to red with 90% opacity, suggesting a potential support level. These colorations help traders quickly identify important price levels and assess their significance in relation to the bands.
By incorporating coloration, the Multi-Band Breakout Indicator provides visual cues to traders, making it easier to interpret the relationships between various components and assisting in identifying potential trend changes and breakout opportunities. Traders can use these color cues to quickly assess the prevailing market conditions and make informed trading decisions.
Adjusting Parameters:
The Multi-Band Breakout Indicator offers flexibility through parameter adjustments. Traders can customize the indicator based on their preferences and trading style. The length parameter controls the sensitivity to price changes, with higher values capturing longer-term trends, while lower values focus on shorter-term price movements. By adjusting the parameters, such as the ATR length, multiplier, Donchian length, and MA length, traders can customize the indicator to suit different timeframes and trading strategies. For shorter timeframes, smaller values for these parameters may be more suitable, while longer timeframes may require larger values.
Potential Applications:
The Multi-Band Breakout Indicator can be applied in various trading strategies. It helps identify potential breakout opportunities, allowing traders to enter trades in the direction of the breakout. Traders can use the indicator to initiate trades when the price moves above the upper band or below the lower band, confirming a potential breakout and providing a signal to enter a trade. Additionally, the indicator can be combined with other technical analysis tools, such as support and resistance levels, candlestick patterns, or trend indicators, to increase the probability of successful trades. By incorporating the Multi-Band Breakout Indicator into their trading approach, traders can gain a better understanding of market trends and capture potential profit opportunities.
Limitations:
While the Multi-Band Breakout Indicator is a useful tool, it has some limitations that traders should consider. The indicator performs best in trending markets where price movements are relatively strong and sustained. During ranging or choppy market conditions, the indicator may generate false signals, leading to potential losses. It is crucial to use the indicator in conjunction with other analysis techniques and risk management strategies to enhance its effectiveness. Additionally, traders should consider external factors such as market news, economic events, and overall market sentiment when interpreting the signals generated by the indicator.
By combining multiple bands and moving averages, this indicator offers valuable insights into the underlying trend and helps traders make informed trading decisions. With customization options and careful interpretation, this indicator can be a valuable addition to any trader's toolkit, assisting in identifying potential breakouts, capturing profitable trades, and enhancing overall trading performance.
Pips Breakout CandlePips Breakout Candle measures price changes in pips. This indicator can be used to identify major price moves! The indicator comes with a sentiment line which is the sum of the Up versus Down price changes. It gives a good understanding of the current trend and identifies divergences.
Set alerts for major price moves!
Identify the trend!
Identify divergence!
Trendline Breakouts With Volume Strength [TradeDots]Trendline Breakouts With Volume Strength is an innovative indicator designed to identify potential market turning points using pivot-based trendline detection and volume confirmation. By merging dynamic trendline analysis with multi-tiered volume filters, this tool helps traders quickly spot breakouts or breakdowns that may signal significant shifts in price action.
📝 HOW IT WORKS
1. Pivot-Based Trendline Detection
The script automatically scans for recent pivot highs and lows over a user-defined lookback period.
When it finds higher pivot lows, it plots green uptrend lines; when it finds lower pivot highs, it plots red downtrend lines.
These dynamic lines update as new pivots form, providing continuously refreshed trend guidance.
2. Volume Ratio Analysis
A moving average of volume is compared against the current bar’s volume to calculate a ratio (e.g., 1.5×, 2×).
Higher ratios suggest above-average volume, often interpreted as stronger participation.
The script applies color-coded cues to highlight the intensity of volume surges.
3. Breakout & Breakdown Detection
Each trendline is monitored for a defined “break threshold,” which helps avoid minor penetrations that can trigger premature signals.
When price closes beyond a threshold below an uptrend line, the indicator labels it a “BREAKDOWN.” If it closes above a threshold on a downtrend line, it labels it a “BREAKOUT.”
Volume surges accompanying these breaks are highlighted with contextual emojis and distinct color gradients for quick visual reference.
4. Trend Direction Table
A small on-chart table provides a snapshot of the current market trend—Uptrend, Downtrend, or Sideways—based on a simple moving average slope and the number of active uptrend or downtrend lines.
This table also displays quick stats on how many lines are actively tracked, helping traders assess the broader market posture at a glance.
🛠️ HOW TO USE
1. Choose a Timeframe
This script works on multiple timeframes. Intraday traders can monitor minute or hourly charts for frequent pivot updates, while swing and position traders may prefer daily or weekly intervals to reduce noise.
2. Observe Trendlines & Labels
Watch for newly drawn green/red lines connecting pivots.
When you see a “BREAKOUT” or “BREAKDOWN” label, confirm whether volume was abnormally high based on the ratio or color-coded bars.
3. Consult the Trend Table
Use the table in the bottom-right corner to quickly check if the market is trending or range-bound.
Look at the count of active uptrend vs. downtrend lines to gauge broader sentiment.
4. Employ Additional Analysis
Combine these signals with other tools (e.g., candlestick patterns, oscillators, or fundamental analysis).
Validate potential breakouts using standard techniques like retests or support/resistance checks.
❗️LIMITATIONS
Delayed Pivots: Trendlines only adjust once new pivot highs or lows form, which can introduce a slight lag in highly volatile environments.
Choppy Markets: Rapid, back-and-forth price moves may produce conflicting trendline signals and frequent breakouts/breakdowns.
Volume Data Reliability: Gaps in volume data or unusual market conditions (holidays, low-liquidity sessions) can skew ratio readings.
RISK DISCLAIMER
Trading any financial instrument involves substantial risk, and this indicator does not guarantee profits or prevent losses. All signals and visual cues are for educational and informational purposes only; past performance does not assure future outcomes. You retain full responsibility for your trading decisions, including proper risk management, position sizing, and the use of additional confirmation methods. Always consider the possibility of losing some or all of your original investment.
Session Breakout Detector (SBD)Overview:
The Session Breakout Detector (SBD) is a TradingView indicator designed to identify and visualize breakouts from major trading sessions. It tracks a selected session (Tokyo, London, or New York) and detects price movements beyond the session's high or low, assisting traders in spotting potential breakout opportunities.
Key Features:
- Session Selection: Choose between Tokyo, London, or New York sessions.
- Breakout Detection Modes:
- Confirmed Bar: Detects breakouts when a candle closes beyond the session's range.
- Intrabar: Detects breakouts as soon as the price exceeds the session's high or low within a
candle.
- Visual Indicators:
- Displays session high, low, and range with a colored box for clear visualization.
- Marks breakouts with green (bullish) or red (bearish) triangles.
- Optional 50-Period SMA: Adds a 50-period Simple Moving Average to the chart for trend
analysis.
- Alerts: Configurable alerts for bullish and bearish breakouts.
Usage Instructions:
1. Select Session: Choose the desired trading session (Tokyo, London, or New York) from the
input settings.
2. Choose Breakout Detection Mode: Select between 'By confirmed bar' or 'By intrabars' based
on your trading preference.
3. Enable SMA (Optional): Toggle the 'Use SMA?' option to display the 50-period Simple Moving
Average.
4. Set Alerts: Configure alerts for breakout signals as per your trading strategy.
⚠️Note: This indicator is intended for informational purposes only and should not be construed as financial advice. Users are encouraged to conduct their own research and consider their individual risk tolerance before making trading decisions.
3 Pivots Interpolation BreakoutsI designed the '3 Pivots Interpolation Breakouts' indicator to intuitively identify breakout opportunities using pivot points. This tool stems from my need to anticipate market direction and capitalize on breakouts. It uses a line interpolated from three pivot highs or lows to forecast upcoming breakouts. This offers a straightforward way to visualize potential bullish and bearish breakouts with color-coded extrapolations. The aim is to simplify breakout detection, enhancing your trading strategy with precise, actionable insights.
Megabar Breakout (Range & Volume & RSI)Hey there,
This strategy is based on the idea that certain events lead to what are called Megabars. Megabars are bars that have a very large range and volume. I wanted to verify whether these bars indicate the start of a trend and whether one should follow the trend.
Summary of the Code:
The code is based on three indicators: the range of the bar, the volume of the bar, and the RSI. When certain values of these indicators are met, a Megabar is identified. The direction of the Megabar indicates the direction in which we should trade.
Why do I combine these indicators?
I want to identify special bars that have the potential to mark the beginning of a breakout. Therefore, a bar needs to exhibit high volume, have a large range (huge price movement), and we also use the Relative Strength Index (RSI) to assess potential momentum. Only if all three criteria are met within one candle, do we use this as an identifier for a megabar.
Explanation of Drawings on the Chart:
As you can see, there is a green background on my chart. The green background symbolizes the time when I'm entering a trade. Only if a Megabar happens during that time, I'm ready to enter a trade. The time is between 6 AM and 4 PM CET. It's just because I prefer that time. Also, the strategy draws an error every time a Megabar happens based on VOL and Range only (not on the RSI). That makes it pretty easy to go through your chart and check the biggest bars manually. You can activate or deactivate these settings via the input data of the strategy.
When Do We Enter a Trade?
We wait for a Megabar to happen during our trading session. If the Megabar is bullish, we open a LONG trade at the opening price of the next candle. If the Megabar is bearish, we open a SHORT trade at the opening price of the next candle.
Where Do We Put Our Take Profit & Stop Loss?
The default setting is TP = 40 Pips and SL = 30 Pips. In that case, we are always trading with a risk-reward ratio of 1.33 by default. You can easily change these settings via the input data of the strategy.
Strategy Results
The criteria for Megabars were chosen by me in a way that makes Megabars something special. They are not intended to occur too frequently, as the fundamental idea of this strategy would otherwise not hold. This results in only 37 closed trades within the last 12 months. If you change the criterias for a megabar to a milder one, you will create more Megabars and therefore more trades. It's up to you. I have adapted this strategy to the 30-minute chart of the EURUSD. In the evaluation, we consider a period of 12 months, which I believe is sufficient.
My default settings for the indicators look like this:
Avg Length Vol 20
Avg Multiplier Vol 3
Avg Length Range 20
Avg Multiplier Range 4
Value SMA RSI for Long Trades 50
Value SMA RSI for Short Trades 70
IMPORTANT: The current performance overview does not display the results of these settings. Please change the settings to my default ones so that you can see how I use this strategy.
I do not recommend trading this strategy without further testing. The script is meant to reflect a basic idea and be used as a tool to identify Megabars. I have made this strategy completely public so that it can be further developed. One can take this framework and test it on different timeframes and different markets.
HTF Cross Breakout [CHE] HTF Cross Breakout — Detects higher timeframe close crossovers for breakout signals, anchors VWAP for trend validation, and flags continuations or traps with visual extensions for delta percent and stop levels.
Summary
This indicator spots moments when the current chart's close price crosses a higher timeframe close, marking potential breakouts only when the current bar shows directional strength. It anchors a volume-weighted average price line from the breakout point to track trend health, updating labels to show if the move continues or reverses into a trap. Extensions add a dotted line linking the breakout level to the current close with percent change display, plus a stop-loss marker at the VWAP end. Signals gain robustness from higher timeframe confirmation and anti-repainting options, reducing noise in live bars compared to simple crossover tools.
Motivation: Why this design?
Traders often face false breakouts from intrabar wiggles on lower timeframes, especially without higher timeframe alignment, leading to whipsaws in volatile sessions. This design uses higher timeframe close as a stable reference for crossover detection, combined with anchored volume weighting to gauge sustained momentum. It addresses these by enforcing bar confirmation and directional filters, providing clearer entry validation and risk points without overcomplicating the chart.
What’s different vs. standard approaches?
Reference baseline
Standard crossover indicators like moving average crosses operate solely on the chart timeframe, ignoring higher timeframe context and lacking volume anchoring.
Architecture differences
- Higher timeframe data pulls via security calls with optional repainting control for stability.
- Anchored VWAP resets at each signal, accumulating from the breakout bar only.
- Label dynamics update in real-time for continuation checks, with extensions for visual delta and stop computation.
- Event-driven line finalization prunes old elements after a set bar extension.
Practical effect
Charts show persistent lines and labels that extend live but finalize cleanly on new events, avoiding clutter. This matters for spotting trap reversals early via label color shifts, and extensions provide quick risk visuals without manual calculations, improving decision speed in trend trades.
How it works (technical)
The indicator first determines a higher timeframe based on user selection, pulling its close price securely. It checks for crossovers or crossunders of the current close against this higher close, but only triggers on confirmed bars with matching directional opens and closes. On a valid event, a horizontal line and label mark the higher close level, while a dashed VWAP line starts accumulating typical price times volume from that bar onward. During the active phase, the breakout line extends to the current bar, the label repositions and updates text based on whether the current close holds above or below the level for bulls or bears. A background tint warns if the close deviates adversely from the current VWAP. Extensions draw a vertical dotted line at the last bar between the breakout level and close, placing a midpoint label with percent difference; separately, a label at the VWAP end shows a computed stop price. Persistent variables track the active state and accumulators, resetting on new events after briefly extending old elements. Repaint risk from security calls is mitigated by confirmed bar gating or user opt-in.
Parameter Guide
Plateau Length (reserved for future, currently unused): Sets a length for potential plateau detection in extensions; default 3, minimum 1. Higher values would increase stability but are not active yet—leave at default to avoid tuning.
Line Width: Controls thickness of breakout, VWAP, and extension lines; default 2, range 1 to 5. Thicker lines improve visibility on busy charts but may obscure price action—use 1 for clean views, 3 or more for emphasis.
+Bars after next HTF event (finalize old, then delete): Extends old lines and labels by this many bars before deletion on new signals; default 20, minimum 0. Shorter extensions keep charts tidy but risk cutting visuals prematurely; longer aids review but builds clutter over time.
Evaluate label only on HTF close (prevents gray traps intrabar): When true, label updates wait for higher timeframe confirmation; default true. Enabling reduces intrabar flips for stabler signals, though it may delay feedback—disable for faster live trading at repaint cost.
Allow Repainting: Permits real-time security data without confirmation offset; default false. False ensures historical accuracy but lags live bars; true speeds updates but can repaint on HTF closes.
Timeframe Type: Chooses HTF method—Auto Timeframe (dynamic steps up), Multiplier (chart multiple), or Manual (fixed string); default Auto Timeframe. Auto adapts to chart scale for convenience; Multiplier suits custom scaling like 5 times current; Manual for precise like 1D on any chart.
Multiplier for Alternate Resolution: Scales chart timeframe when Multiplier type selected; default 5, minimum 1. Values near 1 mimic current resolution for subtle shifts; higher like 10 jumps to broader context, increasing signal rarity.
Manual Resolution: Direct timeframe string like 60 for 1H when Manual type; default 60. Match to trading horizon—shorter for swing, longer for positional—to balance frequency and reliability.
Show Extension 1: Toggles dotted line and delta percent label between breakout level and current close; default true. Disable to simplify for basic use, enable for precise momentum tracking.
Dotted Line Width: Thickness for Extension 1 line; default 2, range 1 to 5. Align with main Line Width for consistency.
Text Size: Size for delta percent label; options tiny, small, normal, large; default normal. Smaller reduces overlap on dense charts; larger aids glance reads.
Decimals for Δ%: Precision in percent change display; default 2, range 0 to 6. Fewer decimals speed reading; more suit low-volatility assets.
Positive Δ Color: Hue for upward percent changes; default lime. Choose contrasting for visibility.
Negative Δ Color: Hue for downward percent changes; default red. Pair with positive for quick polarity scan.
Dotted Line Color: Color for Extension 1 line; default gray. Neutral tones blend well; brighter for emphasis.
Background Transparency (0..100): Opacity for delta label background; default 90. Higher values fade for subtlety; lower solidifies for readability.
Show Extension 2: Toggles stop-loss label at VWAP end; default true. Turn off for entry focus only.
Stop Method: Percent from VWAP end or fixed ticks; options Percent, Ticks; default Percent. Percent scales with price levels; Ticks suits tick-based instruments.
Stop %: Distance as fraction of VWAP for Percent method; default 1.0, step 0.05, minimum 0.0. Tighter like 0.5 reduces risk but increases stops; wider like 2.0 allows breathing room.
Stop Ticks: Tick count offset for Ticks method; default 20, minimum 0. Adjust per asset volatility—fewer for tight control.
Price Decimals: Rounding for stop price text; default 4, range 0 to 10. Match syminfo.precision for clean display.
Text Size: Size for stop label; options tiny, small, normal, large; default normal. Scale to chart zoom.
Text Color: Foreground for stop text; default white. Ensure contrast with background.
Inherit VWAP Color (BG tint): Bases stop label background on VWAP hue; default true. True maintains theme; false allows custom black base.
BG Transparency (0..100): Opacity for stop label background; default 0. Zero for no tint; up to 100 for full fade.
Reading & Interpretation
Breakout lines appear green for bullish crosses or red for bearish, extending live until a new event finalizes them briefly then deletes. Labels start blank, updating to Bull Cont. or Bear Cont. in matching colors if holding the level, or gray Bull Trap/Bear Trap on reversal. VWAP dashes yellow for bulls, orange for bears, sloping with accumulated volume weight—deviations trigger faint red background warnings. Extension 1's dotted vertical shows at the last bar, with midpoint label green/red for positive/negative percent from breakout to close. Extension 2 places a left-aligned label at VWAP end with stop price and method note, tinted to VWAP for context.
Practical Workflows & Combinations
For trend following, enter long on green Bull Cont. labels above VWAP with higher highs confirmation, filtering via rising structure; short on red Bear Cont. below. Pair with volume surges or RSI above 50 for bulls to avoid traps. For exits, trail stops using the Extension 2 level, tightening on warnings or gray labels—aggressive on continuations, conservative post-trap. In multi-timeframe setups, use default Auto on 15m charts for 1H signals, scaling multiplier to 4 for daily context on hourly; test on forex/stocks where volume is reliable, avoiding low-liquidity assets.
Behavior, Constraints & Performance
Signals confirm on bar close with HTF gating when strict mode active, but live bars may update if repainting enabled—opt false for backtest fidelity, true for intraday speed. Security calls risk minor repaints on HTF closes, mitigated by confirmation offsets. Resources cap at 1000 bars back, 50 lines/labels total, with event prunes to stay under budgets—no loops, minimal arrays. Limits include VWAP lag in low-volume periods and dependency on accurate HTF data; gaps or holidays may skew anchors.
Sensible Defaults & Quick Tuning
Defaults suit 5m-1H charts on liquid assets: Auto HTF, no repaint, 1% stops. For choppy markets with excess signals, enable strict eval and bump multiplier to 10 for rarer triggers. If sluggish in trends, shorten extend bars to 10 and allow repainting for quicker visuals. On high-vol like crypto, widen stop % to 2.0 and use Ticks method; for stables like indices, tighten to 0.5% and keep Percent.
What this indicator is—and isn’t
This is a signal visualization layer for breakout confirmation and basic risk marking, best as a filter in discretionary setups. It isn’t a standalone system or predictive oracle—combine with price structure, news awareness, and sizing rules for real edges.
Disclaimer
The content provided, including all code and materials, is strictly for educational and informational purposes only. It is not intended as, and should not be interpreted as, financial advice, a recommendation to buy or sell any financial instrument, or an offer of any financial product or service. All strategies, tools, and examples discussed are provided for illustrative purposes to demonstrate coding techniques and the functionality of Pine Script within a trading context.
Any results from strategies or tools provided are hypothetical, and past performance is not indicative of future results. Trading and investing involve high risk, including the potential loss of principal, and may not be suitable for all individuals. Before making any trading decisions, please consult with a qualified financial professional to understand the risks involved.
By using this script, you acknowledge and agree that any trading decisions are made solely at your discretion and risk.
Do not use this indicator on Heikin-Ashi, Renko, Kagi, Point-and-Figure, or Range charts, as these chart types can produce unrealistic results for signal markers and alerts.
Best regards and happy trading
Chervolino
D-Shape Breakout Signals [LuxAlgo]The D-Shape Breakout Signals indicator uses a unique and novel technique to provide support/resistance curves, a trailing stop loss line, and visual breakout signals from semi-circular shapes.
🔶 USAGE
D-shape is a new concept where the distance between two Swing points is used to create a semi-circle/arc, where the width is expressed as a user-defined percentage of the radius. The resulting arc can be used as a potential support/resistance as well as a source of breakouts.
Users can adjust this percentage (width of the D-shape) in the settings ( "D-Width" ), which will influence breakouts and the Stop-Loss line.
🔹 Breakouts of D-Shape
The arc of this D-shape is used for detecting breakout signals between the price and the curve. Only one breakout per D-shape can occur.
A breakout is highlighted with a colored dot, signifying its location, with a green dot being used when the top part of the arc is exceeded, and red when the bottom part of the arc is surpassed.
When the price reaches the right side of the arc without breaking the arc top/bottom, a blue-colored dot is highlighted, signaling a "Neutral Breakout".
🔹 Trailing Stop-Loss Line
The script includes a Trailing Stop-Loss line (TSL), which is only updated when a breakout of the D-Shape occurs. The TSL will return the midline of the D-Shape subject to a breakout.
The TSL can be used as a stop-loss or entry-level but can also act as a potential support/resistance level or trend visualization.
🔶 DETAILS
A D-shape will initially be colored green when a Swing Low is followed by a Swing High, and red when a Swing Low is followed by a Swing High.
A breakout of the upper side of the D-shape will always update the color to green or to red when the breakout occurs in the lower part. A Neutral Breakout will result in a blue-colored D-shape. The transparency is lowered in the event of a breakout.
In the event of a D-shape breakout, the shape will be removed when the total number of visible D-Shapes exceeds the user set "Minimum Patterns" setting. Any D-shape whose boundaries have not been exceeded (and therefore still active) will remain visible.
🔹 Trailing Stop-Loss Line
Only when a breakout occurs will the midline of the D-shape closest to the closing price potentially become the new Trailing Stop value.
The script will only consider middle lines below the closing price on an upward breakout or middle lines above the closing price when it concerns a downward breakout.
In an uptrend, with an already available green TSL, the potential new Stop-Loss value must be higher than the previous TSL value; while in a downtrend, the new TSL value must be lower.
The Stop-Loss line won't be updated when a "Neutral Breakout" occurs.
🔶 SETTINGS
Swing Length: Period used for the swing detection, with higher values returning longer-term Swing Levels.
🔹 D-Patterns
Minimum Patterns: Minimum amount of visible D-Shape patterns.
D-Width: Width of the D-Shape as a percentage of the distance between both Swing Points.
Included Swings: Include "Swing High" (followed by a Swing Low), "Swing Low" (followed by a Swing High), or "Both"
Style Historical Patterns: Show the "Arc", "Midline" or "Both" of historical patterns.
🔹 Style
Label Size/Colors
Connecting Swing Level: Shows a line connecting the first Swing Point.
Color Fill: colorfill of Trailing Stop-Loss
Banded Chikou Breakout — Quantifying Ichimoku MomentumTitle: Banded Chikou Breakout — Quantifying Ichimoku Momentum
Overview:
Banded Chikou Breakout (BCB) is a unique, algorithmic script designed to augment the capabilities of traders seeking substantial breakout opportunities. Constructed on the robust principles of the Ichimoku trading strategy, BCB is designed to quantify and filter the Chikou Span's significant breakouts above or below the price action. This script does not aim to replace the Ichimoku system; instead, it enhances it, providing an optimized tool for momentum trading.
Rationale:
Ichimoku traders often scrutinize the Chikou Span's position relative to price action to identify market trends. However, determining whether the Chikou Span is above or below due to a genuine trend or mere market noise can be challenging in choppy markets. BCB resolves this predicament by offering a unique way to interpret the Chikou Span's movement. It does so by quantifying the Chikou Span's momentum and utilizing Bollinger Bands to determine its significance. By effectively differentiating substantial movements from the insignificant, BCB can help traders better navigate the market and increase their potential for profitable trades.
How it Works:
BCB combines three key elements: a Momentum Script (simulating Chikou Span), a Bollinger Band Script, and a Timeframe Switcher, all working together to provide a refined trading perspective.
Momentum Script: Calculates the price difference between the current price and the price 'n' periods ago, transforming the Chikou Span into a quantifiable momentum value that signifies the strength and speed of a market move.
Bollinger Band Script: Computes a Simple Moving Average (SMA) around the momentum, plotting two 'bands' at a specified standard deviation from this SMA. This functionality allows traders to discern when the Chikou Span's momentum is abnormally high or low, signifying a potential significant breakout.
Timeframe Switcher: This feature lets traders apply the BCB script to a different timeframe from the one they are currently viewing. This capability can help traders identify higher timeframe breakouts and trade them with precision on the lower timeframe.
How to Use:
BCB is designed to complement the Ichimoku strategy for effective breakout identification.
Add the BCB script to your trading chart. It plots the momentum (yellow line) and Bollinger Bands (green lines) with the area between the bands shaded blue.
Utilize the Ichimoku strategy to identify larger and smaller timeframe trends.
Optional: Leverage the timeframe switcher to synchronize your trades with higher timeframe trends while operating on lower timeframes.
If the BCB momentum line crosses the upper Bollinger Band while the Ichimoku indicates a bullish trend, it signifies a potential significant upward breakout. Similarly, a cross below the lower band during a bearish trend could denote a significant downward breakout.
Remember, without the context provided by the Ichimoku system's trend analysis, BCB can yield false breakouts. It is, therefore, crucial to use these tools in tandem. I like to check for an Ichimoku trend on the 4H and 1H charts, and then use BCB on charts <60 minutes to capture trends with precision.
NR4 & NR7 with Breakouts [LuxAlgo]NR4 & NR7 with Breakouts is a simple indicator that utilizes the NR4 and NR7 candle patterns to display candle ranges and signals from range breakouts.
🔶 USAGE
The Narrow Range Patterns are candle formations determined by the last candle having a narrower (high-low) range than the previous number. This indicator showcases the 2 most recognized Narrow Range Patterns, which are the 4 and 7 bar variants (NR4 and NR7).
These patterns, introduced by Toby Crabel, are thought to provide insight for potential market breakouts by identifying periods of low volatility indicated by a candle with a small range. This is due to the idea that markets often move from periods of low volatility (contraction) to high volatility (expansion), and the NR4 and NR7 patterns help spot these transitions.
By utilizing these patterns, traders are better able to anticipate and respond to market shifts for better decision-making and risk management.
NOTE: These patterns have traditionally been studied on the Daily Timeframe Chart. This indicator allows the user to select a timeframe to generate these patterns from. It is suggested to be mindful of this when considering these patterns.
In this indicator, on the bar after the pattern is detected, the Narrow Range Bar will be highlighted with a zone, and lines displaying the range will extend from it. These ranges are helpful for providing levels to set limit orders and for managing risk.
Users are able to adjust which pattern they want visualized on their chart, please note;
All NR7s are NR4s but not all NR4s are NR7s.
Because of this, you will notice that when selecting "NR4" to display, the colors will change, but the detected ranges will not change.
🔹 Signals
When a Narrow Range Bar is detected, the script will wait for the price to close outside of the Range, then a signal will fire indicating the direction of exit. The signals are produced from the last NR4 or NR7 and will have the potential to fire from that range until a new NR4 or NR7 is detected.
After a signal fires, the logic goes into a "reset" period where it will wait for the price to reach the Range Mean before firing another signal.
These signals can be anticipated by considering the underlying logic and watching price approach the range extremities, and can be improved by utilizing other market information for confluence.
🔶 SETTINGS
Timeframe: Choose which timeframe to identify the NR4 and NR7 Pattern on. This must be Higher than the chart timeframe.
Pattern Type: Choose which (or all) patterns to display.
Breakout Support & Resistance SwiftEdgeBreakout Support & Resistance
The Breakout is a technical analysis tool designed to identify breakout opportunities in the market by detecting price movements through support and resistance levels. It plots potential entry points, stop-loss (SL), and take-profit (TP) levels based on user-defined percentages, helping traders visualize breakout setups on their charts.
How It Works
Support and Resistance Detection: The indicator uses pivot points to identify support and resistance levels over a user-defined lookback period.
Breakout Identification: A breakout is confirmed when the price crosses above a resistance level (bullish) or below a support level (bearish) and remains there for a specified number of bars.
Entry, SL, and TP Levels: Upon a confirmed breakout, the indicator sets an entry point at the closing price and calculates SL, TP1, and TP2 levels based on user-defined percentages.
Directional Filtering: To avoid conflicting signals, the indicator filters breakouts based on the current trade direction. A new entry in the opposite direction is only set if the price moves a user-defined percentage away from the previous entry or if the previous trade hits its SL, TP1, or TP2.
Visuals: The indicator plots support and resistance lines, breakout labels, and entry/SL/TP levels on the chart. Users can choose to display only the latest entry or up to 5 recent entries.
Features
Customizable Settings: Adjust the lookback period for pivot points, breakout confirmation bars, SL/TP percentages, and more.
Directional Change Control: A direction change is indicated when the price moves significantly in the opposite direction, helping to manage trend reversals.
Multiple Entry Display: Option to show up to 5 recent entries for tracking multiple breakouts.
Alerts: Receive alerts when a breakout is confirmed, including entry, SL, TP1, and TP2 levels.
Settings
Pivot Lookback Length: Number of bars to look back for identifying support and resistance levels (default: 5).
Breakout Confirmation Bars: Number of bars the price must stay above/below the level to confirm a breakout (default: 2).
Take Profit 1 (%): First take-profit level as a percentage above/below the entry (default: 2.0%).
Take Profit 2 (%): Second take-profit level as a percentage above/below the entry (default: 4.0%).
Stop Loss (%): Stop-loss level as a percentage below/above the entry (default: 1.0%).
Show Multiple Entries: Toggle to display up to 5 recent entries or only the latest (default: false).
Direction Change Threshold (%): Percentage the price must move away from the entry to allow a direction change (default: 2.0%).
How to Use
Add the Breakout Scanner to your chart.
Adjust the settings to match your trading style (e.g., tweak the pivot lookback or SL/TP percentages).
Watch for breakout labels ("Breakout") on the chart, indicating a confirmed breakout.
Use the plotted entry, SL, TP1, and TP2 levels to plan your trades.
Enable alerts to be notified of new breakouts in real-time.
Notes
This indicator is designed to assist with identifying breakout opportunities and does not guarantee specific results. Always combine it with other analysis and risk management techniques.
The direction change feature helps filter breakouts in the opposite direction, but significant price movements may still trigger a new entry in the opposite direction.
For best results, test the indicator on a demo account to understand its behavior in your preferred market and timeframe.
Smart Money Breakout Signals [AlgoAlpha]Introducing the Smart Money Breakout Signals, a cutting-edge trading indicator designed to identify key structural shifts and breakout opportunities in the market. This tool leverages a blend of smart money concepts like Break of Structure (BOS) and Change of Character (CHoCH) to provide traders with actionable insights into market direction and potential entry or exit points.
Key Features :
✨ Market Structure Analysis : Automatically detects and labels BOS and CHoCH for trend confirmation and reversals.
🎨 Customizable Visualization : Tailor bullish and bearish colors for breakout lines and signals to suit your preferences.
📊 Dynamic Take-Profit Targets : Displays three tiered take-profit levels based on breakout volatility.
🔔 Real-Time Alerts : Stay ahead of the game with notifications for bullish and bearish breakouts.
📋 Performance Dashboard : Monitor signal statistics, including win rates and total signals, directly on your chart.
How to Use :
Add the Indicator : Add the script to your favourites ⭐ and customize settings like market structure horizon and confirmation type.
Monitor Breakouts : Observe BOS and CHoCH labels to identify potential trend shifts. Use the breakout lines and tiered take-profit levels to plan trades effectively.
Set Alerts : Enable alerts for bullish or bearish breakouts to act on opportunities without constant monitoring.
How It Works :
The indicator identifies market structure by analyzing pivot highs and lows over a user-defined time horizon. A breakout is confirmed based on either candle closes or wicks surpassing previous pivot points. Upon detection, the script generates signals with breakout lines and calculates take-profit targets based on the distance from the breakout level. A built-in dashboard tracks performance metrics like total signals and win rates, giving traders real-time feedback on strategy effectiveness.