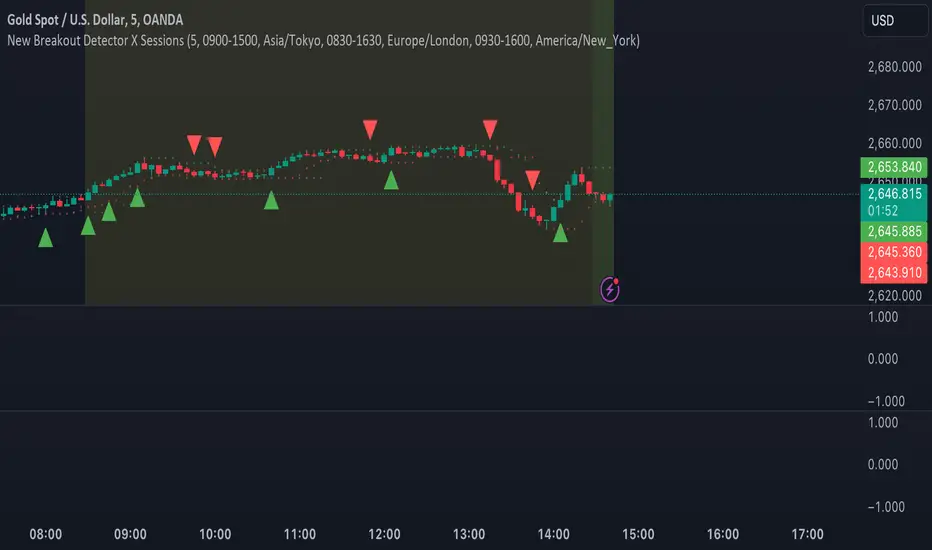
MJForex Breakout Detector X SessionsThis Pine Script code is a Breakout Detector with Trading Session highlights for use on a financial chart. Here's a detailed breakdown of its functionality:
1. Breakout Detection
The main purpose of this script is to detect breakouts based on specific price levels (like highs and lows) within a given lookback period. It identifies different types of breakouts in real time, specifically:
Higher High (HH): The highest price in the lookback period is exceeded, suggesting bullish momentum.
Higher Low (HL): A low that is higher than the previous low, which might indicate a potential upward trend continuation.
Lower High (LH): The price makes a lower high than the previous high, indicating a possible downward reversal.
Lower Low (LL): A low that is lower than the previous low, indicating bearish momentum.
Breakout Logic:
A buy signal is generated when there is a breakout above a Higher High or a Higher Low, signaling a potential bullish trend.
A sell signal is generated when there is a breakout below a Lower High or a Lower Low, signaling a potential bearish trend.
These signals are plotted on the chart using shapes (green triangles for buy signals and red triangles for sell signals).
2. Candle Body vs. Wick Consideration
The indicator allows you to choose whether the breakout is detected based on the candle body (the open and close prices) or the wick (the high and low prices).
This is controlled by a user input (use_body), so you can switch between these modes depending on your preference.
3. Trading Session Highlights
The script also visually highlights different trading sessions on the chart. Three sessions can be configured:
First Session (e.g., Asia/Tokyo)
Second Session (e.g., Europe/London)
Third Session (e.g., America/New York)
Each session is colored differently on the chart's background (blue, yellow, and green), helping you easily visualize which trading session is currently active.
4. Real-Time Alerts
The script generates real-time alerts when a breakout occurs.
Alerts are sent based on the current price action without waiting for the candle to close, which helps traders respond quickly to potential breakout signals and be aware of the particular zone or area.
Alerts:
A Buy alert is triggered when there's a Higher High (HH) or Higher Low (HL) breakout.
A Sell alert is triggered when there's a Lower High (LH) or Lower Low (LL) breakout.
These alerts can be used to notify traders when certain breakout conditions are met, allowing them to take action immediately.
5. Customizability
The script allows for several customizable inputs:
Lookback Period: The number of bars used to calculate the highest high and lowest low (default is 5).
Breakout Detection Toggle: You can choose whether to show the breakout signals on the chart.
Session Visibility: You can turn on/off the visual highlights for the trading sessions.
Body/Wick Toggle: You can select whether to consider the candle body or the wick when detecting breakouts.
In Summary:
Breakout Detection: Detects and highlights Higher High, Higher Low, Lower High, and Lower Low breakouts on the chart, generating buy/sell signals.
Candle Body/Wick Option: You can choose to detect breakouts based on the body or wick of the candle.
Real-Time Alerts: Sends alerts as soon as a breakout occurs, without waiting for the candle to close.
Trading Session Highlights: Highlights different global trading sessions for easy visual reference on the chart.
This indicator is particularly useful for traders who want to identify key breakouts and visually track trading sessions across different markets.
"breakout" için komut dosyalarını ara
[Opening Range pre-Market Breakout Screener] with Alerts (TSO)=
with Alerts (TSO)
===========================================================================
===========================================================================
This Opening Range/pre-Market breakout screener lets you monitor up to 10 symbols/instruments simultaneously (9 plus the one currently displayed on the chart). It provides alerts when the price breaks out of the pre-market range, offering two options: 1) Immediate alerts as the breakout happens with the live bar, and 2) Alerts after the bar closes. The screener also labels breakouts on the chart and offers live status updates in the stats table. The Opening Range/pre-Market area is fully customizable, with a default setting optimized for US stock market pre-market hours (07:00 am-09:30 am ET). Additionally, you can set the Active Trading Session Schedule to define specific intraday periods when breakouts and alerts will be displayed.
What sets this indicator apart from other ORB indicators is its integrated screener for multiple symbols and an IMMEDIATE alert/status feature that notifies you the moment the price breaks through the pre-market range. Moreover, it can be used worldwide as it includes an active trading session schedule for every trading region globally!
===========================================================================
Explanation of all the Features/Inputs/Settings
---------------------------------------------------------------------------
>>> This is where the desired symbols can be turned on/checked to be screened for ORB breakout - the selected/checked symbols at creation of a 'Any alert() function call' alert will alert on any of the selected/checked symbols.
>>> Active Trading Session Hours, this is where Active Trading Session Hours can be setup during which breakouts will be shown on chart/table and alerts will trigger. Every trading region is included, by default it's set to a regular US trading session: 09:30am0-4:00pm ET.
>>> ORB Breakout Config is where the desired breakout approaches can be shown/alert turn on. Closed Bar Breakout: means that a breakout is considered as occurred only when a candle bar is fully closed. Live Breakouts: a breakout occurs immediately at price breakout thru pre-Market range, while candle bar is still open.
>>> Final section is simply the stats table location.
===========================================================================
Adding Alerts in TradngView
---------------------------------------------------------------------------
1) Consolidation alert(s) for the selected/checked symbols
- Select/check/find the desired symbols/instruments (when selecting symbols, make sure - they are from correct BROKER/SOURCE as pricing may differ between different brokers, causing confusion (under 1 broker/source, the symbol will be consolidated, under another it will not...))
-Right-click anywhere on any TradingView chart
-Click on Add alert
-Condition: Select this indicator by it’s name
-Immediately below, change it to "alert() function calls only"
-Expiration: Open-ended (that may require higher tier TradingView account, otherwise the alert will need to be occasionally re-triggered)
-Alert name: Anything
-Hit “Create”
-Note: If you change ANY Settings within the indicator – you must DELETE the current alert and create a new one per steps above, otherwise it will continue triggering alerts per old Settings!
* Once alert triggers, don't get confused, as it will show "Alert on SYMBOL", the SYMBOL will be where you created the major alert for all the symbols within the screener list! Within the alert, on the bottom, it will say: "SPY - LONG Breakout - Live" - this is where the correct symbol is for which the alert for consolidation was triggered!
===========================================================================
If you have any questions or issues with the indicator, please message me directly via TradingView.
---------------------------------------------------------------------------
Good Luck! (NOTE: Trading is very risky, past performance is not necessarily indicative of future results, so please trade responsibly!)

CofeeShopCrypto CoffeeBreak RSI**This Indicator DOES NOT REPAINT**
For me the RSI who's been a very powerful tool but one of the things that's been missing from it time and time again is the ability to show true dynamic support and resistance that is generated by the movements of the RSI.
This version of the Relative Strength Index is designed to visualize and mark Support and Resistance conditions on the Relative Strength Index (RSI) itself, and leaving behind those known dynamic support and resistance (S/R) zones.
It also has the ability during live marks to show you whether the majority of momentum is to the bullish or bearish side and if there is a conflict between the current momentum and the support or resistance zone that you are inside of. In short it will create the zones during live market.
This means you don't have to wait to only look at previous values you can also make an assessment during live breakouts on current support and resistance levels as well as using previous support and resistance levels as markers for any limits in movement.
Inputs Tab:
Show Dynamic Zone Creator - Gives you a live action SR Generator on your chart at your current bars which extends a bit into the future for a better visual sense of activity.
The color of this area can be set manually or you can let the script color this area automatically.
This Generator helps to plot Support and Resistance Zones on your chart.
If no zone is triggered then it will move on.
If a zone is triggered, it will change to the appropriate color and leave the zone behind as the new candles form.
Show Dynamic Zone Mid Level - This is just a midline of the Zone Creator to get an earlier visualization of what's happening inside the zone when it is very large.
I use this midline as a breakpoint when price and RSI values come back to this level and both break it. If only ONE breaks the level, I do not take it as a confirmation.
Extend RSI support and resistance boxes into the future - this is strictly up to the user which value you set. It will simply extend the zones that were left behind into the future as many bars as you choose. Depending on the chart or asset that you trade and how much volatility there is at the time you should be able to determine a good length for these boxes.
How many bars reflect the dynamic S/R zone - raising this value can overlap more zones using more bars going backwards. This can intensify the color of the current zone being created. The lowest value you should use is 2. But the higher you make this value you will also be able to see previous zones created with more intensity. Raising this value above the RSI value can give you a very nice previous depletion of color on previous zones where you'll be able to watch them fade away and it will intensify the current ones being created.
Only show this many previous support and resistance zones - this is a way to limit the number of zones that are being left behind on your chart which could possibly slow down the activity of calculations and how your chart moves with more indicators on it. Technically you can show 400 to 500 previous zones on your chart but you don't really need to see that many in the past so set this to something that is relative to how far in history you need to reference SR levels.
------------- Lets talk about how to take trades and see false breakouts. -------------
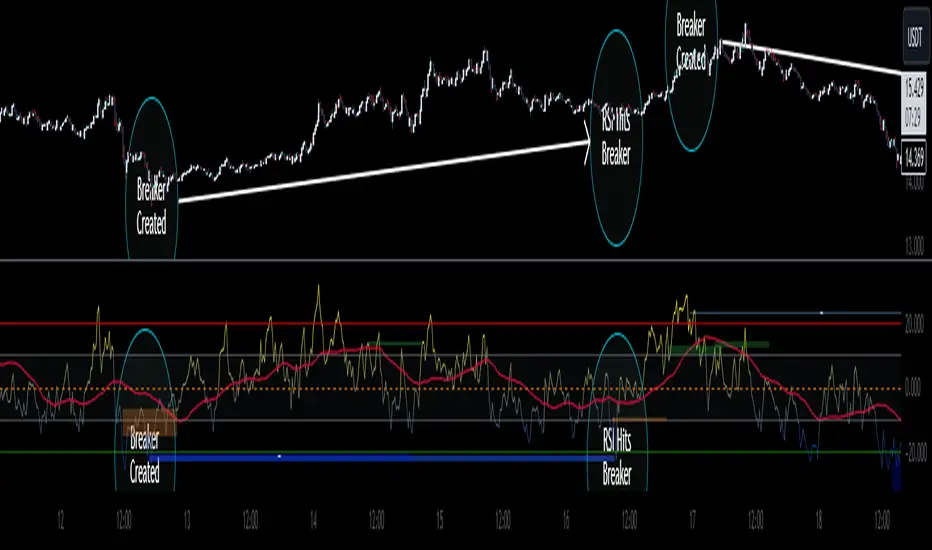
Support Created, Not broken, False Breakout
In the image below you can see how the Dynamic Zone Generator left behind a Support Level however the RSI was unable to break above it.
This creates a price swing on the chart.
The RSI later comes back to this level, however while price breaks this level, the RSI does not.
This confirms that it is a false breakout.
------------------------------------------------------------------------------------------
Now lets take a look at what a confirmed breakout is for a short along with a Continuation of short move. This is quickly followed by a divergence.
In the image below you can see how the RSI was in its ranging area and broke below that range. In this case it would be be below -10. During this time it never created a support level or resistance level underneath it implicating that it has continuous movement.
You can see later that when it broke back inside of the range did not go long instead there was a red resistance area created below the RSI. The RSI then again broke below -10 and it broke through this resistance area below it indicating another quick short entry. This is the setup for a quick continuation. Be careful of these setups as they are usually followed quickly by a divergence.
----------------------------------------------------------------------------------
The Dynamic Zone Creator takes its time to calculate. It cant predict the future so you'll have to just let it do its thing. Once the candles close and they confirm, you'll have the color, and zone size you need.
The Dynamic Zone Creator works against your currently OPEN candles.
It will give you a high and a low area of a zone which you can use in later points of the oscillator to determine if you have valid breakouts and or bounces of price and momentum.
When set to automatic coloring, its zone background and midline will automatically change their colors to match the momentum of the RSI and price.
If there is no support or resistance found, the Zone Creator will simply move onto the next candles in play.
If there IS support or resistance found, the Zone Creator will leave behind a phantom zone or Support or Resistance.
Keep in mind these zones left behind will turn into opposing Support or Resistance depending on if price and momentum break these areas simultaneously.
----------------------------Reason for closed source----------------------------
This indicator will be updated in the future to also produce trendlines, signals, and incorporate different methods of validate pivots and volume by calculations I have created of my own.
To avoid publishing this script more than once and give you all a direct access, without having to find a secondary or tertiary publication with the addons code is protected and will be updated here.
I have put several days into this particular script and will continue over the next few weeks to add in complimentary coding as this version of the script is really just stage one.
Hyper Squeeze Sniper (Dual Side: Long + Short)Hyper Squeeze Sniper (Dual Side Strategy)
This script is a comprehensive Volatility Breakout System designed to identify and trade explosive price moves following periods of consolidation. It combines the classical "Squeeze" theory with Linear Regression Momentum, Volume Analysis, and an ATR-based Trailing Stop to filter false signals and manage risk effectively.
The script operates on a logic of "Compression -> Explosion -> Trend Following" suitable for both Long and Short positions.
🛠 Detailed Methodology (How it works)
1. The Squeeze Detection (Consolidation) The core concept relies on the relationship between Bollinger Bands (BB) and Keltner Channels (KC).
Condition: When the Bollinger Bands (Standard Deviation) contract and fall inside the Keltner Channels (ATR based), it indicates a period of extremely low volatility (The Squeeze).
Visual: The background turns Gray to indicate "Do Not Trade / Wait Mode".
2. Momentum Confirmation (Linear Regression) Instead of using standard lagging indicators, this script utilizes Linear Regression of the price deviation to determine the direction of the breakout.
If the Linear Regression Slope > 0, the bias is Bullish.
If the Linear Regression Slope < 0, the bias is Bearish.
3. Volume Validation To avoid fake breakouts, a Volume Spike filter is applied. A signal is only valid if the current volume exceeds its moving average by a defined multiplier (Default x1.2).
4. Risk Management: ATR Trailing Stop Once a trade is entered, the script calculates a dynamic Trailing Stop based on the Average True Range (ATR).
- Long: The stop line trails below the price and never moves down.
- Short: The stop line trails above the price and never moves up.
- Exit: The position is closed immediately when the price breaches this volatility-based safety line.
How to Use
1. Wait: Look for the Gray Background. This is the accumulation phase.
2. Entry:
LONG: Wait for a Green Triangle ▲ (Price breaks Upper BB + Vol Spike + Bullish Momentum).
SHORT: Wait for a Red Triangle ▼ (Price breaks Lower BB + Vol Spike + Bearish Momentum).
3. Exit: Close the position when the "X" mark appears or when candles cross the trailing safety line.
Settings
- BB Length/Mult: Adjust the sensitivity of the squeeze detection.
- Vol Spike Factor: Increase this to filter out low-volume breakouts.
- ATR Period/Mult: Adjust the trailing stop distance (Higher = Wider stop for swing trading).

Total Info Indicator by MikePenzin
Install & Add to Chart
• Copy the script into Pine Editor → click Add to Chart .
• Open the ⚙️ Settings → Inputs to customize.
What It Does
• Displays key info in a floating table — trend, volume, ATR, RSI, stop loss, and more.
• Detects breakouts , smart SELL signals , and opening strength .
• Uses emojis and colours to make trends easy to read: 🟢 good, 🟡 neutral, 🔴 risky.
For Swing Traders
• Works best on Daily or 4H charts.
• Watch for 🟢 Uptrend + ⚡BUY / 🔥BUY breakout signals.
• Use ATR-based Stop Loss (shown in table).
• Avoid new entries a few days before earnings.
Suggested Setup
• 20/50/150 MA Lines: ON
• 200 MA Line: optional
• ATR Multiplier: 1.3
• Breakout Detection: ON (Volume + RSI + Trend filters)
• Smart SELLs: ON (RSI 70, EMA 20)
• Pivots: ON for quick swing levels
How to Read
• MA Row: 🟢 = price above MA (bullish).
• ATR/Stop Loss: Suggests where to place protective stop.
• Volume Info: Today’s vs 20-day average, plus pace.
• RSI & CCI: Shows momentum and overbought/oversold levels.
• Breakouts: ⚡BUY (early), 🔥BUY (confirmed).
• Smart SELLs: RSI🔴 / DIV🟣 / EMA🔵 mean potential exit zones.
Example Use
1️⃣ Find stocks with Uptrend 🟢 , rising volume, and ⚡BUY signal.
2️⃣ Enter near breakout; set Stop = shown level.
3️⃣ Take profits or trail when Smart SELLs appear or RSI peaks.
Tips
• Choose table corner under “Table Visualization.”
• Reduce clutter on small timeframes (turn off Pivots/200 MA).
• Use “Volume speed” to spot surging interest before breakouts.
• Compatible with most equities and ETFs.
Disclaimer
This script is for education & analysis only .
Not financial advice — always manage your own risk.

Resistance Breakout LevelsResistance Breakout Levels
An advanced TradingView indicator that detects significant resistance pivots and marks confirmed breakouts.
Description:
This Pine Script automatically identifies swing-high pivot points as potential resistance levels. It confirms a breakout only after a configurable number of consecutive closes above the pivot, reducing noise and avoiding false signals. Once validated, it draws a horizontal breakout line at the pivot price and adds a label with the breakout value. Traders can choose to display all breakout lines or only the single highest breakout within a specified lookback period. Additionally, a dynamic current price line spans the chart for quick reference.
Features:
• Pivot High Detection for Resistance Levels
• N-Consecutive Close Breakout Confirmation
• Toggle Between All Breakouts or Highest Breakout with Lookback Window
• Full-Width Live Current Price Line
• Customizable Line Colors, Widths, and Extension Direction
• Price Labels Directly on Breakout Lines
User Inputs:
• Pivot Bars (Left/Right): Number of bars used to detect pivot highs
• Consecutive Closes Above: Closes required above pivot to confirm breakout
• Show All Breakouts: Option to plot every confirmed breakout line
• Highest Lookback Bars: Lookback window for retaining only the highest breakout
• Breakout Line Color & Width: Customize breakout line appearance
• Price Line Color & Width: Customize live current price line appearance

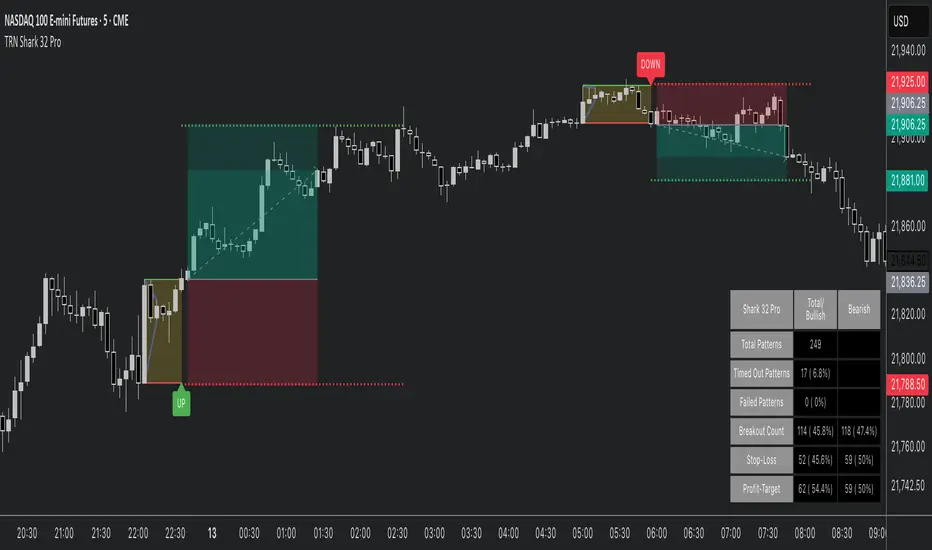
Shark 32 Pattern ProHello Traders!
The Shark32 pattern comprises multiple inside bars —each candle’s high/low is contained within the previous candle’s range—creating a tight consolidation zone. Once price breaks out, volatility frequently expands, producing sharper moves. The pattern is known for its relatively high continuation rate and the ability to offer tight risk/reward setups. It also calculates statistics, highlights stop/target levels, and offers fully customizable visuals so you can adapt the tool to your trading style.
Key Features :
Detects Shark 32 With Unlimited Inside Bars:
Automatically spots consecutive inside candles (not limited to just two), enabling you to catch more nuanced patterns.
Highlights Breakout:
Clear visual lines and labels mark where price breaks above/below the pattern boundary.
Stop-Loss & Profit Targets:
Draws a suggested stop-loss line and a projected target line, helping you manage risk and set profit objectives quickly.
Statistics & Analysis:
A built-in statistics table tracks pattern frequency, breakouts, stop-hits, target-hits, and more—helping you refine your strategy over time.
Fully Customizable Visuals:
Control line styles, colors, breakout labels, box fill, and more to fit your preference or chart theme.
Quick Resolutions:
This pattern forms fast and typically resolves within just a few bars, appealing to short-term traders.
Statistics at a Glance (based on Bulkowski's studies):
Continuation Bias : ~60% continuation bias.
Measured Move : 70%+ of bullish breakouts (in bull markets) reach the measured move.
Throwback : ~64% chance price retraces to the breakout level after an upside break.
Trend Alignment : Historically, success rates improve when trading in line with the larger trend.
How to Trade with This Indicator :
Identifying the Pattern : Wait till a Shark 32 pattern is formed.
Entry Rule : Enter on a confirmed close above the pattern high (for bullish) or below the pattern low (for bearish).
Stop Placement : Place stops a few ticks beyond the opposite side of the pattern. Tight ranges = small risk. Or use the mid-range of the pattern as a stop level.
Target Options : Aim for Risk/Reward Ratio of 2R or 3R to capture a strong follow-through. Alternatively, use the measured move of the first bar's height as a target.
Tips for Better Reliability:
Trend Alignment : Shark 32 breakouts usually work best in the direction of the broader market or trend.
Confirmation : Look for a significant volume increase at the breakout—helps filter out “fake” moves.
Throwback Awareness : ~64% of upside breakouts retest the pattern boundary; stay patient if you see a pullback.
Risk Management : Maintain tight stops and consider using alerts for activation/breakout signals.
Why This Indicator?
Clear Visuals : Highlights the pattern boundary, breakout lines, and potential stop/target levels.
Customizable : Lets you adjust line styles, risk parameters, alerts, and statistics display.
Statistical Edge : Built-in table aggregates pattern counts, success/failure rates, and average durations.
Final Thoughts:
This Shark 32 Pro indicator gives you a systematic way to spot—and trade—a compact yet powerful three-candle formation. Combine it with solid risk management and trend analysis for best results. Monitor volume and confirm breakouts with a candle close beyond the pattern’s range. While the pattern can fail, tight stops and clear targets help keep your trading efficient and disciplined.
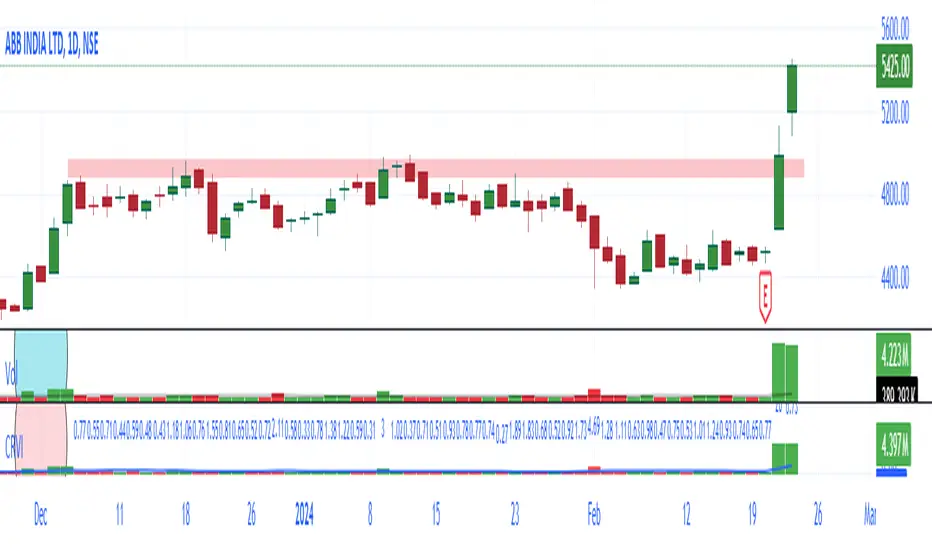
NSE + BSE Volume with Relative Volume Multiplier By AfnanIntroducing the Combined NSE + BSE Volume Indicator with Relative Volume indicator (CRVI).
The Combined NSE + BSE Volume Indicator with Relative Volume Multiplier (CRVI) is an essential tool for Indian traders who are engaged in volume breakout analysis, particularly breakout traders.
Key Features of CRVI:
Combining NSE and BSE Volume: The CRVI consolidates volume data from both the National Stock Exchange (NSE) and the Bombay Stock Exchange (BSE) into a single chart, ensuring that traders do not miss out on vital volume data from either exchange.
Understanding Operator Activity: This indicator gives traders the advantage of identifying whether operators or smart investors are building positions in either exchange. For instance, while observing an NSE stock chart, traders can now identify if operators are building positions in BSE stocks as well.
Add-on to Relative Volume / Volume Breakout Multiplier (RVI) Indicator: The CRVI is an additional feature integrated into the Relative Volume / Volume Breakout Multiplier (RVI) indicator, providing an enhanced perspective on volume dynamics.
Usage of CRVI:
Quantifying Volume Breakouts: The indicator quantifies the degree of volume breakouts concerning the Simple Moving Average (SMA), facilitating a clearer understanding of the strength of volume breakouts.
Relative Volume Interpretation: By comparing the current volume with the volume SMA, the CRVI delivers a breakout number, such as 2.0 for double the volume SMA or 0.50 for half the volume SMA. This assists traders in gauging the momentum and potential trading opportunities more effectively.
Advantages for Traders:
Enhanced Volume Analysis: Breakout traders, in particular, will find the CRVI invaluable for identifying potential trading opportunities and assessing volume strength more accurately.
Essential Toolkit Inclusion: Traders focusing on volume breakout analysis can benefit significantly from incorporating this indicator into their trading toolkit.
Embracing Continuous Improvement:
Every tool and analysis utilized contributes to the ongoing process of becoming more adept traders. Embracing continuous learning and improvement is the foundation of successful trading. As we move forward, armed with the right tools and mindset, we eliminate the doubts of today and pave the way for a more confident tomorrow.
Gratitude :
Your support, likes, and comments are deeply appreciated. If you have any questions, do not hesitate to reach out. Let's work together to make trading an enriching experience!
Support and Resistance Signals MTF [LuxAlgo]The Support and Resistance Signals MTF indicator aims to identify undoubtedly one of the key concepts of technical analysis Support and Resistance Levels and more importantly, the script aims to capture and highlight major price action movements, such as Breakouts , Tests of the Zones , Retests of the Zones , and Rejections .
The script supports Multi-TimeFrame (MTF) functionality allowing users to analyze and observe the Support and Resistance Levels/Zones and their associated Signals from a higher timeframe perspective.
This script is an extended version of our previously published Support-and-Resistance-Levels-with-Breaks script from 2020.
Identification of key support and resistance levels/zones is an essential ingredient to successful technical analysis.
🔶 USAGE
Support and resistance are key concepts that help traders understand, analyze and act on chart patterns in the financial markets. Support describes a price level where a downtrend pauses due to demand for an asset increasing, while resistance refers to a level where an uptrend reverses as a sell-off happens.
The creation of support and resistance levels comes as a result of an initial imbalance of supply/demand, which forms what we know as a swing high or swing low. This script starts its processing using the swing highs/lows. Swing Highs/Lows are levels that many of the market participants use as a historical reference to place their trading orders (buy, sell, stop loss), as a result, those price levels potentially become and serve as key support and resistance levels.
One of the important features of the script is the signals it provides. The script follows the major price movements and highlights them on the chart.
🔹 Breakouts (non-repaint)
A breakout is a price moving outside a defined support or resistance level, the significance of the breakout can be measured by examining the volume. This script is not filtering them based on volume but provides volume information for the bar where the breakout takes place.
🔹 Retests
Retest is a case where the price action breaches a zone and then revisits the level breached.
🔹 Tests
Test is a case where the price action touches the support or resistance zones.
🔹 Rejections
Rejections are pin bar patterns with high trading volume.
Finally, Multi TimeFrame (MTF) functionality allows users to analyze and observe the Support and Resistance Levels/Zones and their associated Signals from a higher timeframe perspective.
🔶 SETTINGS
The script takes into account user-defined parameters to detect and highlight the zones, levels, and signals.
🔹 Support & Resistance Settings
Detection Timeframe: Set the indicator resolution, the users may examine higher timeframe detection on their chart timeframe.
Detection Length: Swing levels detection length
Check Previous Historical S&R Level: enables the script to check the previous historical levels.
🔹 Signals
Breakouts: Toggles the visibility of the Breakouts, enables customization of the color and the size of the visuals
Tests: Toggles the visibility of the Tests, enables customization of the color and the size of the visuals
Retests: Toggles the visibility of the Retests, enables customization of the color and the size of the visuals
Rejections: Toggles the visibility of the Rejections, enables customization of the color and the size of the visuals
🔹 Others
Sentiment Profile: Toggles the visibility of the Sentiment Profiles
Bullish Nodes: Color option for Bullish Nodes
Bearish Nodes: Color option for Bearish Nodes
🔶 RELATED SCRIPTS
Support-and-Resistance-Levels-with-Breaks
Buyside-Sellside-Liquidity
Liquidity-Levels-Voids

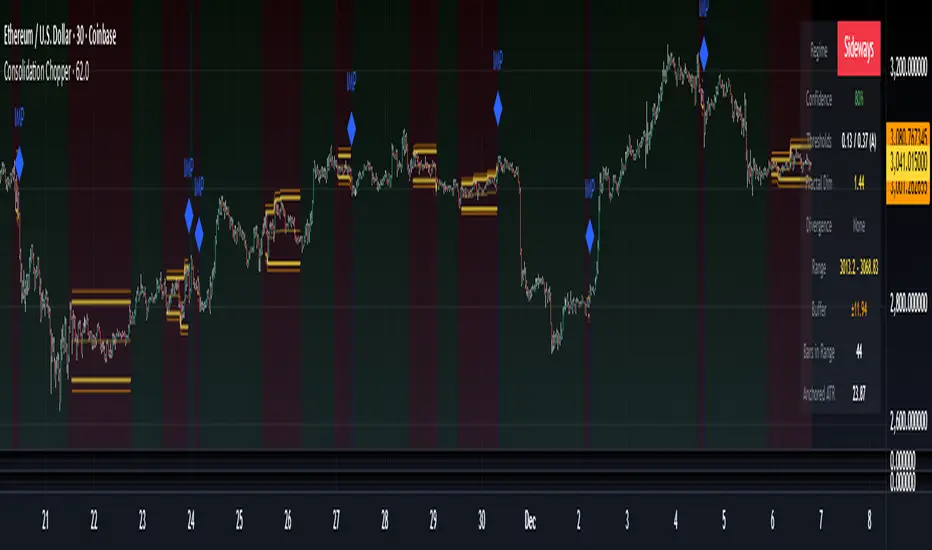
Consolidation Chopper█ OVERVIEW
Consolidation Chopper is a regime detection indicator designed to identify whether the market is currently in a consolidation (sideways) phase or a trending phase. The indicator uses a proprietary multi-timeframe approach to analyze price action across different windows, providing a more robust classification than single-timeframe methods.
The indicator features an impulse override system that can detect sudden breakouts from consolidation ranges, allowing for faster regime transitions when significant price movement occurs.
█ FEATURES
Three-State Regime Detection
• Sideways — Market is consolidating with no clear directional bias
• Breakout — An impulse move has been detected, signaling a potential regime change
• Trending — Market is exhibiting directional movement
Adaptive Thresholds
The indicator can self-calibrate its detection thresholds based on the instrument's historical behavior, making it adaptable across different markets and asset classes without manual tuning.
Dynamic Range Tracking
During consolidation periods, the indicator tracks the evolving range boundaries:
• Yellow lines show the current range high and low
• Orange lines show the buffered boundaries used for impulse detection
• Range continuously updates as price action develops
Impulse Override System
Multiple configurable conditions can trigger an early exit from consolidation:
• Bar body relative to range size
• Bar range relative to volatility
• Close beyond buffered range boundaries
• Multi-bar cumulative movement
Each condition can be independently enabled or disabled.
Confirmation Layers
Optional confirmation metrics provide additional confidence scoring for the current regime classification. The info panel displays confidence percentage and confirmation status.
Cooldown System
Prevents rapid regime oscillation by enforcing a minimum duration after breakout events before allowing return to sideways classification.
█ HOW TO USE
1 — Add the indicator to your chart. The background color indicates the current regime.
2 — During sideways regimes, observe the yellow range lines to understand the current consolidation boundaries.
3 — Watch for IMP markers which indicate impulse-triggered breakouts.
4 — Use the info panel (top right) to monitor:
Current regime and confidence level
Range boundaries and buffer values
Cooldown status
5 — Adjust impulse detection parameters based on your instrument's volatility characteristics.
Higher values = fewer triggers (more conservative)
Lower values = more triggers (more sensitive)
█ SETTINGS
Threshold Settings
Control the sensitivity of regime classification. Adaptive mode auto-calibrates based on historical data tuned for your instrument.
Impulse Override
Configure which conditions trigger early breakout detection and their respective thresholds.
Multi-Bar Impulse
Settings for detecting breakouts that occur over multiple bars rather than a single impulse candle.
Range Tracking
Configure the establishment period and buffer zone for consolidation range detection.
Cooldown
Set the minimum bars required after a breakout before returning to sideways classification.
█ LIMITATIONS
• The indicator requires sufficient historical data to establish adaptive thresholds.
Initial bars may show less reliable classifications.
• Like all regime detection methods, there is going to be inherent lag in identifying transitions, but this method minimizes it.
The impulse override system helps mitigate this but cannot eliminate it entirely.
• Performance may vary across different timeframes and instruments.
Some parameter tuning is recommended for optimal results.
█ NOTES
This indicator is designed as a filter or context tool to be used alongside other analysis methods. It does not generate trade signals directly but provides market structure context that can inform trading decisions. Typically once a range breaks you can expect directional movement/impulses or higher volatility regimes.
Smart Box Breakout Pro - Swing & ORB System🎯 **SMART BOX BREAKOUT PRO - Professional Trading System**
**Two Powerful Modes in ONE Indicator:**
✅ **SWING BOX MODE** - Automatic consolidation detection based on swing highs/lows
✅ **ORB MODE** - Opening Range Breakout for professional day trading
Stop manually drawing boxes and missing breakouts! This indicator does it ALL automatically.
━━━━━━━━━━━━━━━━━━━━━━━━━━━━━━━━━━━━━━━━━━━
## 🔥 **WHY THIS INDICATOR IS DIFFERENT**
### **1️⃣ SWING BOX MODE** (For All Timeframes)
- Automatically detects swing-based consolidation zones
- Draws perfect boxes around price consolidation
- Identifies breakouts with precision
- Works on ANY timeframe (M5 to Daily)
- Perfect for swing traders and position traders
### **2️⃣ ORB MODE** (For Day Traders) ⭐ UNIQUE FEATURE
- **Opening Range Breakout** system built-in
- Set custom time range (e.g., 09:30-10:00 for first 30 min)
- Works with multiple timezones (NY, London, Tokyo, Chicago)
- Daily auto-reset
- Professional day trading tool
### **3️⃣ 5-STAR SIGNAL QUALITY SYSTEM** 🌟
Every signal is rated 1-5 stars based on:
- ⭐ Box tightness (smaller = better)
- ⭐ Volume confirmation
- ⭐ HTF trend alignment
- ⭐ Clean breakout (no wicks back)
- ⭐ Momentum strength
**Only trade 4-5 star setups for highest probability!**
### **4️⃣ HIGHER TIMEFRAME FILTER**
- Optional HTF trend filter
- Only LONG signals in HTF uptrend
- Only SHORT signals in HTF downtrend
- Significantly improves win rate
### **5️⃣ AUTOMATIC TP/SL CALCULATION**
- Take Profit levels auto-calculated
- Stop Loss based on box structure
- Adjustable percentages
- Visual TP/SL lines on chart
### **6️⃣ PROFESSIONAL DASHBOARD**
- Live signal status
- Active box info
- Signal quality rating
- HTF trend direction
- Current TP/SL levels
━━━━━━━━━━━━━━━━━━━━━━━━━━━━━━━━━━━━━━━━━━━
## 📊 **HOW IT WORKS**
### **SWING BOX MODE:**
1. **Detection**: Indicator finds swing highs and swing lows
2. **Box Formation**: Draws box around consolidation (4 swing points)
3. **Breakout Wait**: Monitors price for breakout
4. **Signal**: When price closes above/below box → SIGNAL
5. **Quality Rating**: Shows 1-5 stars for signal quality
6. **Auto TP/SL**: Displays take profit and stop loss levels
**Perfect for:** Swing trading, position trading, all timeframes
### **ORB MODE (Opening Range Breakout):**
1. **Time Range**: You set the opening range time (e.g., 09:30-10:00)
2. **Range Formation**: Box forms during this time (tracks high/low)
3. **Range Complete**: After time ends, box is complete
4. **Breakout Wait**: Price must break above or below opening range
5. **Signal**: Breakout = entry signal with quality rating
6. **Auto TP/SL**: Professional risk management built-in
**Perfect for:** Day trading stocks, forex, crypto, futures
━━━━━━━━━━━━━━━━━━━━━━━━━━━━━━━━━━━━━━━━━━━━━
## ⚙️ **FEATURES & SETTINGS**
### **Mode Selection:**
- Toggle between Swing Box and ORB mode
- Each mode optimized for different trading styles
### **Swing Box Settings:**
- Swing Length (sensitivity)
- Min distance between boxes
- Max box width (filters out large ranges)
### **ORB Settings:**
- Custom time range (any hours you want)
- Timezone selection (NY, London, Tokyo, Chicago)
- Daily reset option
- Extend box right option
### **Trading Settings:**
- Take Profit % (adjustable)
- Stop Loss offset % (adjustable)
- Minimum signal quality filter (1-5 stars)
### **HTF Filter:**
- Enable/disable higher timeframe trend filter
- Select HTF timeframe
- EMA period for trend determination
### **Visual Customization:**
- Show/hide swing points
- Show/hide TP/SL lines
- Show/hide dashboard
- Custom colors for all elements
- Adjustable line lengths
━━━━━━━━━━━━━━━━━━━━━━━━━━━━━━━━━━━━━━━━━━━
## 🎯 **BEST USE CASES**
### **Swing Box Mode:**
✅ Forex pairs (any timeframe H1-Daily)
✅ Stock swing trading (H4-Daily)
✅ Crypto swing trading (H1-H4)
✅ Index trading (H4-Daily)
✅ Commodity swing trades
### **ORB Mode:**
✅ US Stock day trading (09:30-10:00 EST opening range)
✅ Forex day trading (London open 08:00 GMT)
✅ Crypto day trading (any session)
✅ Futures day trading (08:30-09:00 EST)
✅ Gold/Silver day trading
━━━━━━━━━━━━━━━━━━━━━━━━━━━━━━━━━━━━━━━━━━━
## 📈 **RECOMMENDED SETTINGS**
### **For Forex (Swing Box Mode):**
- Timeframe: H1 or H4
- Swing Length: 5
- Min Signal Quality: 3 stars
- HTF Filter: ON (use H4 or Daily)
### **For Stock Day Trading (ORB Mode):**
- Timeframe: 5min or 15min
- ORB Time: 0930-1000 (EST)
- Timezone: America/New_York
- Min Signal Quality: 4 stars
- HTF Filter: OFF
### **For Crypto (Swing Box Mode):**
- Timeframe: H1 or H4
- Swing Length: 5-7
- Min Signal Quality: 3 stars
- HTF Filter: ON (use H4)
### **For Index Trading (Swing Box Mode):**
- Timeframe: H4 or Daily
- Swing Length: 5
- Min Signal Quality: 4 stars
- HTF Filter: ON (use Daily)
━━━━━━━━━━━━━━━━━━━━━━━━━━━━━━━━━━━━━━━━━━━━━
## 🔔 **ALERTS**
The indicator includes 4 alert types:
1. **🚀 LONG Breakout** - Any long signal
2. **💥 SHORT Breakout** - Any short signal
3. **⭐ 5-STAR LONG** - Perfect 5-star long setup
4. **⭐ 5-STAR SHORT** - Perfect 5-star short setup
**Alert Message Format:**
🚀 LONG BREAKOUT (swing) | Quality: 4/5 | Entry: 1.2345 | TP: 1.2363 | SL: 1.2295
**How to Set Alerts:**
1. Click "Create Alert" button
2. Select alert condition (e.g., "🚀 LONG Breakout")
3. Set alert frequency: "Once Per Bar Close"
4. Name your alert
5. Done! You'll get notified of every signal
━━━━━━━━━━━━━━━━━━━━━━━━━━━━━━━━━━━━━━━━━━━
## 💡 **TRADING TIPS & BEST PRACTICES**
### **✅ DO:**
- Wait for bar close before entering (no repainting!)
- Focus on 4-5 star signals for best results
- Use HTF filter in trending markets
- Respect the auto TP/SL levels
- Trade during high volume sessions
- Use proper position sizing
### **❌ DON'T:**
- Enter before bar close (wait for confirmation)
- Ignore the quality rating (stars matter!)
- Trade against strong HTF trend without filter off
- Move stops closer than indicator suggests
- Overtrade - quality over quantity
- Risk more than 1-2% per trade
### **🎯 PRO TIPS:**
**For Swing Box Mode:**
- Best on trending pairs/stocks
- H1/H4 timeframes work best
- Combine with major support/resistance
- Wait for 4+ star signals in choppy markets
**For ORB Mode:**
- Best on volatile stocks/pairs
- First hour usually defines the day
- Higher volume = better breakouts
- Avoid on low volume days (holidays)
- 5-star ORB breakouts are gold!
━━━━━━━━━━━━━━━━━━━━━━━━━━━━━━━━━━━━━━━━━━━━━
## ❓ **FREQUENTLY ASKED QUESTIONS**
**Q: Does this indicator repaint?**
A: NO! All signals appear on bar close and never disappear or change.
**Q: Can I use this on any market?**
A: YES! Works on Forex, Stocks, Crypto, Futures, Indices, Commodities.
**Q: What's the difference between the two modes?**
A: Swing Box = auto-detects consolidation (any timeframe). ORB = opening range breakout (day trading specific time).
**Q: How accurate are the signals?**
A: Focus on 4-5 star signals with HTF filter for 60-70% win rate potential. Lower star signals = lower probability.
**Q: Can I customize the TP/SL percentages?**
A: YES! Fully adjustable in settings.
**Q: What timeframe works best?**
A: Swing Box: H1-Daily | ORB: M5-M15 (for day trading)
**Q: Do I need to watch the chart all day?**
A: NO! Set up alerts and the indicator notifies you of breakouts.
**Q: Can I backtest this?**
A: YES! All signals are visible on historical bars. Test it yourself on demo first.
**Q: Is the HTF filter necessary?**
A: Optional but recommended in trending markets. Improves win rate significantly.
**Q: How do I set up ORB for US stock trading?**
A: Mode: "ORB", Time: "0930-1000", Timezone: "America/New_York", Timeframe: M5 or M15
━━━━━━━━━━━━━━━━━━━━━━━━━━━━━━━━━━━━━━━━━━━
## 🎓 **WHAT YOU'LL LEARN**
Using this indicator teaches you:
- How to identify consolidation zones
- When breakouts are most likely to succeed
- Quality over quantity in trading
- Importance of HTF trend context
- Professional risk management (TP/SL)
- Opening Range Breakout strategy
- Box breakout methodology
━━━━━━━━━━━━━━━━━━━━━━━━━━━━━━━━━━━━━━━━━━━━━
## 🚀 **WHY TRADERS LOVE THIS INDICATOR**
✅ **Two Systems in One** - Swing Box + ORB = Amazing value
✅ **Quality Rating** - Know which signals to focus on
✅ **No Repainting** - 100% reliable, signals never change
✅ **Auto TP/SL** - Risk management handled for you
✅ **HTF Filter** - Trade with the trend for higher win rate
✅ **Professional Dashboard** - All info at a glance
✅ **Works Everywhere** - Any market, any timeframe
✅ **Clean Design** - Not cluttered, easy to read
✅ **Full Alerts** - Never miss a setup
✅ **Beginner Friendly** - Easy to understand and use
━━━━━━━━━━━━━━━━━━━━━━━━━━━━━━━━━━━━━━━━━━━
## 📊 **TECHNICAL DETAILS**
**Swing Box Detection:**
- Uses pivot high/low logic
- Pattern recognition (4 swing points)
- Filters based on box width and spacing
- Dynamic box sizing
**ORB Detection:**
- Session-based time filtering
- High/low tracking during specified range
- Automatic daily reset
- Timezone-aware calculations
**Signal Quality Algorithm:**
Evaluates 5 factors:
1. Box size (tightness)
2. Volume confirmation
3. HTF trend alignment
4. Breakout cleanliness
5. Momentum strength
**No Repainting:**
- All logic confirmed on bar close
- Variables properly managed with var keyword
- Historical consistency guaranteed
━━━━━━━━━━━━━━━━━━━━━━━━━━━━━━━━━━━━━━━━━━━
## 🎁 **BONUS FEATURES**
- Visual swing point markers (toggle on/off)
- Connection lines showing box formation
- Box extends right for easy viewing
- Color-coded signals (green=long, red=short)
- Quality stars on every signal
- Dashboard shows real-time info
- Multiple timezone support
- Fully customizable colors
━━━━━━━━━━━━━━━━━━━━━━━━━━━━━━━━━━━━━━━━━━━
## 🏆 **PERFECT FOR:**
👉 Day Traders using ORB strategy
👉 Swing Traders looking for breakouts
👉 Forex Traders on H1/H4
👉 Stock Traders (intraday and swing)
👉 Crypto Traders 24/7
👉 Futures Traders
👉 Beginners learning breakout trading
👉 Experienced traders wanting automation
━━━━━━━━━━━━━━━━━━━━━━━━━━━━━━━━━━━━━━━━━━━
## 📖 **STRATEGY GUIDE**
### **Conservative Approach:**
- Only trade 5-star signals
- Use HTF filter ON
- Trade only in direction of HTF trend
- Smaller position sizes
- **Expected Win Rate: 65-75%**
### **Balanced Approach:**
- Trade 4-5 star signals
- Use HTF filter ON
- Respect TP/SL levels
- Standard position sizing
- **Expected Win Rate: 55-65%**
### **Aggressive Approach:**
- Trade 3+ star signals
- HTF filter optional
- Both directions
- Manage trades actively
- **Expected Win Rate: 50-60%**
━━━━━━━━━━━━━━━━━━━━━━━━━━━━━━━━━━━━━━━━━━━
## 💎 **UPGRADE YOUR TRADING TODAY**
Stop missing breakouts. Stop drawing boxes manually. Stop guessing which setups are best.
**Let Smart Box Breakout Pro do the heavy lifting!**
✅ Add to your charts now (it's FREE!)
✅ Set up your alerts
✅ Start catching high-quality breakouts
✅ Trade with confidence
━━━━━━━━━━━━━━━━━━━━━━━━━━━━━━━━━━━━━━━━━━━
## 📞 **SUPPORT & UPDATES**
Questions? Suggestions? Found it useful?
- Drop a comment below
- Follow for updates and new indicators
- Check out my other professional tools
**Created by ThePipsMaker - Professional Trading Indicators**
━━━━━━━━━━━━━━━━━━━━━━━━━━━━━━━━━━━━━━━━━━━
## ⚠️ **DISCLAIMER**
This indicator is for educational purposes. Trading involves risk. Past performance does not guarantee future results. Always practice proper risk management and never risk more than you can afford to lose. Test on demo account first.
━━━━━━━━━━━━━━━━━━━━━━━━━━━━━━━━━━━━━━━━━━━
**📊 Smart Box Breakout Pro - Your Edge in the Markets! 🎯**
**#BoxBreakout #ORB #OpeningRange #SwingTrading #DayTrading #ForexIndicator #TradingViewIndicator #Breakout #SmartMoney**

Trend Impulse Channels (Zeiierman)█ Overview
Trend Impulse Channels (Zeiierman) is a precision-engineered trend-following system that visualizes discrete trend progression using volatility-scaled step logic. It replaces traditional slope-based tracking with clearly defined “trend steps,” capturing directional momentum only when price action decisively confirms a shift through an ATR-based trigger.
This tool is ideal for traders who prefer structured, stair-step progression over fluid curves, and value the clarity of momentum-based bands that reveal breakout conviction, pullback retests, and consolidation zones. The channel width adapts automatically to market volatility, while the step logic filters out noise and false flips.
⚪ The Structural Assumption
This indicator is built on a core market structure observation:
After each strong trend impulse, the market typically enters a “cooling-off” phase as profit-taking occurs and counter-trend participants enter. This often results in a shallow pullback or stall, creating a slight negative slope in an uptrend (or a positive slope in a downtrend).
These “cooling-off” phases don’t reverse the trend — they signal temporary pressure before the next leg continues. By tracking trend steps discretely and filtering for this behavior, Trend Impulse Channels helps traders align with the rhythm of impulse → pause → impulse.
█ How It Works
⚪ Step-Based Trend Engine
At the heart of this tool is a dynamic step engine that progresses only when price crosses a predefined ATR-scaled trigger level:
Trigger Threshold (× ATR) – Defines how far price must break beyond the current trend state to register a new trend step.
Step Size (Volatility-Guided) – Each trend continuation moves the trend line in discrete units, scaling with ATR and trend persistence.
Trend Direction State – Maintains a +1/-1 internal bias to support directional filters and step tracking.
⚪ Volatility-Adaptive Channel
Each step is wrapped inside a dynamic envelope scaled to current volatility:
Upper and Lower Bands – Derived from ATR and band multipliers to expand/contract as volatility changes.
⚪ Retest Signal System
Optional signal markers show when price re-tests the upper or lower band:
Upper Retest → Pullback into resistance during a bearish trend.
Lower Retest → Pullback into support during a bullish trend.
⚪ Trend Step Signals
Circular markers can be shown to mark each time the trend steps forward, making it easy to identify structurally significant moments of continuation within a larger trend.
█ How to Use
⚪ Trend Alignment
Use the Trend Line and Step Markers to visually confirm the direction of momentum. If multiple trend steps occur in sequence without reversal, this typically signals strong conviction and trend persistence.
⚪ Retest-Based Entries
Wait for pullbacks into the channel and monitor for triangle retest signals. When used in confluence with trend direction, these offer high-quality continuation setups.
⚪ Breakouts
Look for breakouts beyond the upper or lower band after a longer period of pause. For higher likelihood of success, look for breakouts in the direction of the trend.
█ Settings
Trigger Threshold (× ATR) - Defines how far price must move to register a new trend step. Controls sensitivity to trend flips.
Max Step Size (× ATR) - Caps how far each trend step can extend. Prevents runaway step expansion in high volatility.
Band Multiplier (× ATR) - Expands the upper and lower channels. Controls how much breathing room the bands allow.
Trend Hold (bars) - Minimum number of bars the trend must remain active before allowing a flip. Helps reduce noise.
Filter by Trend - Restrict retest signals to those aligned with the current trend direction.
-----------------
Disclaimer
The content provided in my scripts, indicators, ideas, algorithms, and systems is for educational and informational purposes only. It does not constitute financial advice, investment recommendations, or a solicitation to buy or sell any financial instruments. I will not accept liability for any loss or damage, including without limitation any loss of profit, which may arise directly or indirectly from the use of or reliance on such information.
All investments involve risk, and the past performance of a security, industry, sector, market, financial product, trading strategy, backtest, or individual's trading does not guarantee future results or returns. Investors are fully responsible for any investment decisions they make. Such decisions should be based solely on an evaluation of their financial circumstances, investment objectives, risk tolerance, and liquidity needs.

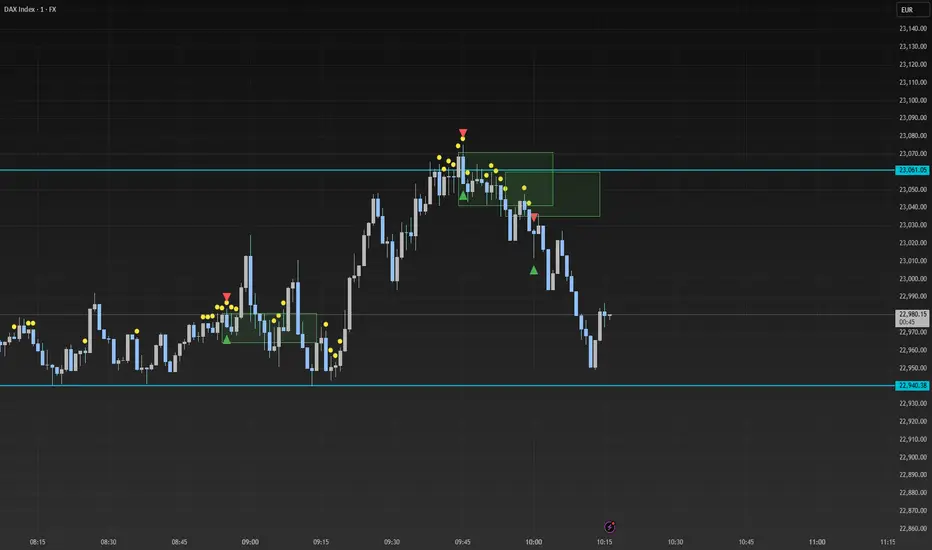
Smart Range Breakout - SwiftEdgeDescription:
The "Smart Range Breakout - SwiftEdge" indicator is a custom tool designed for identifying potential breakout opportunities on a 1-minute chart, with a focus on volatile markets like the DAX index. This script introduces a unique approach by combining range consolidation detection with volume confirmation and breakout validation, tailored for short-term trading strategies.
How It Works:
The indicator identifies consolidation periods where the price range (difference between the highest high and lowest low over a user-defined length) is below a multiple of the Average True Range (ATR). This helps detect periods of low volatility, which often precede breakouts.
Once a consolidation is confirmed (minimum number of bars), a green box is drawn on the chart, spanning a fixed length of bars (default 50), representing the potential breakout zone.
Breakouts are signaled only when a candle opens above the upper boundary (box top) or below the lower boundary (box bottom) of the consolidation box, ensuring a clear entry point based on price action at the open.
The script includes a volume filter, requiring volume to exceed a moving average by a specified multiplier, and a confirmation period to validate the breakout over consecutive bars.
To avoid signal clutter, only one breakout signal (up or down) is generated per box, and no further signals are issued until a new consolidation box is formed.
How to Use:
Apply the indicator to a 1-minute chart (optimized for DAX or similar volatile indices).
Adjust the "Consolidation Length" (default 5) to set the lookback period for detecting consolidation.
Modify the "Range Threshold (ATR Multiplier)" (default 2.0) to make the consolidation detection more or less strict based on market volatility.
Use "Minimum Consolidation Bars" (default 2) to set the minimum duration of a consolidation phase.
Tune "Confirmation Bars" (default 1) to require more bars to confirm the breakout.
Set "Volume MA Length" (default 5) and "Volume Multiplier" (default 1.1) to filter breakouts with insufficient volume.
Adjust "Max Box Length" (default 50) to control the duration of the breakout zone on the chart.
Look for green triangles below the chart for bullish breakouts and red triangles above for bearish breakouts, occurring when a candle opens outside the box with confirmed volume.
Originality:
This script stands out by integrating a fixed-length consolidation box with an opening-price breakout condition, combined with volume and multi-bar confirmation. Unlike traditional breakout indicators that rely solely on closing prices or simple price thresholds, this approach prioritizes the opening price and limits signals to one per cycle, reducing noise in volatile markets.
Chart Notes:
The accompanying chart displays the indicator's output with green boxes indicating consolidation zones, yellow dots marking consolidation periods, and green/red triangles for breakout signals. No additional scripts or unrelated drawings are included to ensure clarity.
The Curved Market Structure [BigBeluga]Curved Market Structure
The Curved Market Structure indicator offers an innovative twist on traditional market structure tools by using curved lines instead of horizontal ones, enabling faster breakout detection for traders.
🔵Key Features:
Curved Market Structure Levels: The indicator identifies high and low pivots and plots curved lines connecting these points, adapting to market dynamics and providing a more intuitive view of potential breakout zones.
Breakout Detection: Breakouts above or below the curved levels are marked with triangle symbols (▲ or ▼), making it easy to spot critical price movements.
Dynamic Target Levels: After a breakout, the indicator plots three target levels, which serve as potential price objectives. Each target is marked with a number and a star (e.g., 1★) upon being reached.
Customizable Line Length and Angle: Users can adjust the length and angle of the curved lines to fit their trading style and timeframe, making the tool versatile and adaptable.
Market Structure Trend Filtering: To maintain a clean chart, the indicator plots curved levels only from high pivots during uptrends and low pivots during downtrends.
🔵How It Works:
The indicator identifies high and low pivots using user-defined parameters (left and right bars).
Curved lines are drawn from these pivot points, showing the structure of the market and potential breakout zones.
When a breakout occurs, the indicator highlights the direction with triangle symbols and dynamically plots three price targets.
Upon reaching these targets, the level is marked with its respective number and a star, helping traders track price progression effectively.
The lines and targets are adjusted based on market conditions, ensuring real-time relevance and accuracy.
🔵Use Cases:
Spotting key breakout zones to identify entry and exit points more effectively.
Setting dynamic target levels for take-profit or stop-loss planning.
Filtering market noise and maintaining a cleaner chart while analyzing trends.
Enhancing traditional market structure analysis with an intuitive curved visualization.
This indicator is ideal for traders who want a modern, dynamic, and visually appealing way to track market structure and breakouts while maintaining chart clarity.

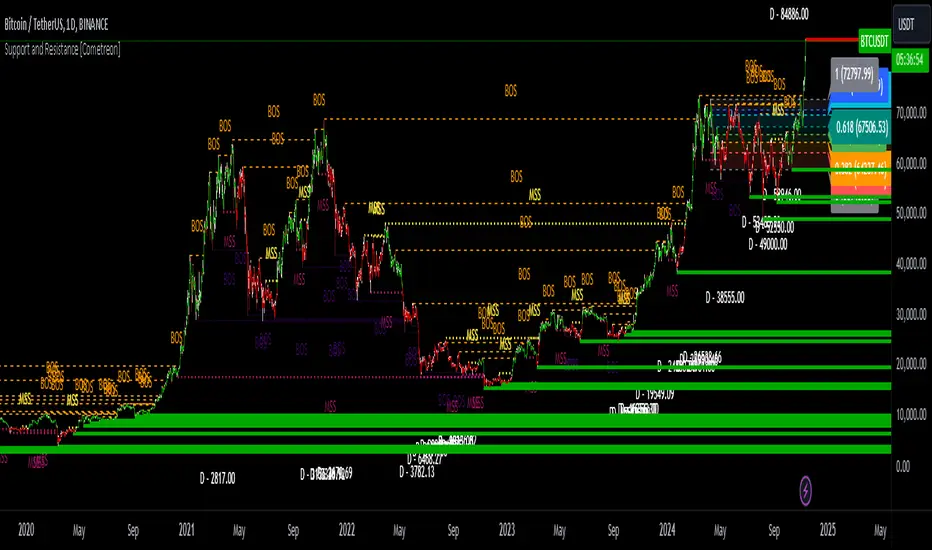
Support and Resistance MTF [Cometreon]The Support and Resistance MTF elevates your technical analysis by automatically identifying and plotting critical support and resistance levels across any symbol and timeframe—even higher ones. Powered by advanced algorithms, this tool continuously analyzes market structure and updates in real time, saving you hours of manual analysis.
If you're looking for a smart, dynamic, and highly customizable S&R solution, this is the tool for you.
🔷 Key Features & Improvements
🟩 Automatic Level Detection
The indicator automatically plots all support and resistance levels, providing a clear map of key points on the chart.
🟩 Historical Level Display
Shows historical support and resistance levels, providing a comprehensive view of the market over time.
🟩 Dynamic Trend Creation
Automatically identifies and updates trends based on levels, simplifying the understanding of market directions.
🟩 Automatic Fibonacci
Generates Fibonacci levels based on the last two support and resistance levels, offering additional reference points for potential price retracements or extensions.
🟩 Customizable Alerts
Offers a series of configurable alerts to keep you informed about breakouts, new confirmed levels, and price bounces on active levels.
🔷 Technical Details and Customizable Inputs
1️⃣ Line Types - Select the type of lines to display: active, broken, both, or none.
2️⃣ Left Length - Determines the number of candles to calculate the previous high or low point.
3️⃣ Right Length - Defines the number of candles needed to confirm a level as Support or Resistance.
4️⃣ Timeframe - You can modify the timeframe of supports and resistances to view levels of a higher timeframe. It's also possible to add additional support and resistance levels using a second timeframe.
5️⃣ Breakout Source - Change the source needed to break support and resistance levels between Close or High/Low.
6️⃣ Delete at Timeframe - Allows removing levels based on the current chart resource instead of using that of the higher timeframe.
7️⃣ Session Range - Choose a period of distance from the last candle to define how far back in the past the indicator should look for Supports or Resistances.
8️⃣ Style Valid Level - Customize the appearance of active levels, including the color of the level itself, Liquidity fill, text color, line style and thickness, extension, as well as the size, position, and values to display in the level text.
9️⃣ Liquidity - This option displays the liquidity associated with each support and resistance level, with three modes: "Wick" which goes from the high/low to the upper/lower body, "Body" instead goes from the level to the lower/upper body of the candle and "Full Range" which extends from the high to the low of the candle.
1️⃣0️⃣ Style Break Level - Allows modifying color, style, and thickness of lines, as well as text width, for two types of breakouts: "MSS" and "BOS".
" MSS " stands for " Market Structure Switch " and indicates a level breakout opposite to the previous breakout, signaling a trend reversal.
" BOS ", on the other hand, means " Break of Structure" and occurs when a level is broken in the same direction as the previous one, confirming trend continuation.
1️⃣1️⃣ Fibonacci Trend Line - Add up to 8 Fibonacci levels based on the last two identified support and resistance levels. Customize the different levels by modifying colors, thickness, style, and extension of lines. You also have the option to add a transparent background between each level.
1️⃣2️⃣ Use Only Confirmed Levels - Activate this option if you want the system to use only the last two confirmed levels, excluding potential levels not yet confirmed.
1️⃣3️⃣ Reverse - Used to reverse the direction of Fibonacci lines.
1️⃣4️⃣ Use Higher / Lower - This option allows using the currently active maximum and minimum levels of Support and Resistance. The indicator will update each Support level until it encounters another active Resistance, and vice versa.
1️⃣5️⃣ Trend Style - Activate/deactivate two types of indicator Trends: "Bar Color" based on level breakouts and "Background Color" based on the last active unconfirmed level.
1️⃣6️⃣ Signal Style - Activate or deactivate the various breakout and bounce signals. Bounces present three options:
Total Rejection(TR) : occurs when the price exceeds the high or low and closes below the liquidity level.
Internal Rejection(IR) : the price closes in the liquidity zone.
Liquidity Rejection(LR) : the price does not exceed the high or low, but only the liquidity level, closing below it.
1️⃣7️⃣ Customized Alerts - Set alerts to be notified in case of breakouts, bounces, or formation of new levels.
These options allow you to optimize the indicator for different trading styles and market conditions, ensuring accurate and tailored technical analysis.
🔍 How to Use Support and Resistance MTF Pro
📌 Using Critical Levels
Consider all levels on the chart as "magnetic points" for the price. These represent critical areas where the market tends to react.
📈 Signal Interpretation
Use the indicator's signals to interpret market movements. A level breakout can indicate a trend reversal or continuation. Bounces can suggest the holding of a level or signal a possible breakout.
🛠 Strategy Integration
Leverage the trend of support and resistance levels, breakouts, and bounces as key elements to develop and refine your trading strategies.
☄️ Support and Resistance simplifies your market analysis, saving you time and improving the accuracy of your decisions. Thanks to clearly visualized and customizable levels, you'll have a clearer and more immediate view of market dynamics.
Don't wait any longer: discover how Support and Resistance can enhance your market analysis, offering you clear indications for faster and more precise trading decisions.
TrendLines MTF [Cometreon]TrendLines MTF is a next-generation indicator designed to automatically detect and plot all relevant trendlines across any symbol and timeframe—including higher ones. Using advanced algorithms, it constantly scans price action and updates the chart in real-time, offering a fast, precise, and dynamic view of market structure.
This tool streamlines market analysis and boosts decision-making by eliminating the need for manual trendline drawing.
🔷 Key Features
🟩 Automatic Plotting
The indicator automatically draws and updates trendlines, providing a real-time overview of market trends.
🟩 Breakout and Bounce Signaling
Provides immediate notifications when a trendline is broken or the price bounces off it, allowing traders to react promptly to market changes.
🟩 Customization
Offers the ability to modify length, touches, colors, and line style to suit individual preferences.
🟩 Information Table
Includes a detailed table showing the values of all active trendlines, facilitating the monitoring of key market points.
🟩 Configurable Alerts
Allows setting custom alerts for breakouts, bounces, or creation of new trendlines.
🔷 Technical Details and Customizable Inputs
Trendline offers a range of customizable inputs that allow adapting the indicator to specific needs:
1️⃣ Trendline Type - Select between active trendlines, broken ones, both, or none.
2️⃣ Left and Right Length - Defines the extension of maximum and minimum points to identify Trendlines.
3️⃣ Timeframe - You can also modify the timeframe of Trendlines to display a higher timeframe.
4️⃣ Confirm at Timeframe - Allows you to confirm the Trendlines using the chart's timeframe instead of the selected one. This checks whether a candle has already broken the line previously.
5️⃣ Delete at Timeframe - Input to remove trendlines based on breakouts with chart candles, instead of using candles of a higher timeframe.
6️⃣ Touch Need - Sets the number of touches needed to confirm a Trendline.
7️⃣ Max Trend Line for Level - Limits the maximum number of Trendlines in a single level.
8️⃣ Extended Line After Break - Option to extend broken Trendlines by a specific value.
9️⃣ Session Range - The "Session Range" offers two options: select a specific date or a period relative to the last candle. The input allows choosing between "Choose" and "Pick Up".
With "Choose", you select a relative period, with two modes:
Last : shows the trendlines of the selected period, compatible with Replay.
Real Time : displays all TrendLines, searching from the last selected period.
Example: "1 Month" with "Last" shows the TrendLines from the previous month, while "Real Time" searches without time limits but uses the values from the last month. This allows defining the search depth of the indicator, crucial for computing power. In case of issues, use "Auto".
1️⃣0️⃣ Trendlines Style - Modify the style for each type of Trendlines (Valid, Break) including color, style, and line thickness.
1️⃣1️⃣ Trends Trendlines - Enable/disable two different trends:
Trend Bar Color : based on TrendLines breakouts. Breaking a bearish TrendLine results in a bullish trend, vice versa for breaking a bullish TrendLine.
Trend Background : based on the number of active TrendLines. For example, if the number of bullish TrendLines is greater than the "Strength", the trend will be bullish.
1️⃣2️⃣ Signal Style - You can enable or disable breakout and bounce signals, with customizable colors for each signal type.
1️⃣3️⃣ Alert - Set notifications for breakouts, bounces, or formation of new Trendlines.
1️⃣4️⃣ Table - Customize the table showing the values of all active trendlines, facilitating the monitoring of key market points. You can modify the appearance of the table, changing the color of cells and text.
These options allow you to optimize the indicator for different trading styles and market conditions, ensuring precise and personalized technical analysis.
🔍 How to Use Trendlines MTF
📌 Market Analysis
Use the displayed Trendlines as critical indicators of market dynamics to make informed trading decisions.
📈 Signal Interpretation
Leverage Trendline breakouts and bounces to identify potential trend changes and trading opportunities.
🛠 Strategy Integration
Use Trendlines and generated signals as a basis for creating personalized and innovative trading strategies.
☄️ With Trendlines, you can simplify your market analysis, saving time and improving the accuracy of your decisions with clearly visualized and customizable Trendlines.
Don't waste any more time and visit the link to get access to all Cometreon indicators.

TradingIQ - Counter Strike IQIntroducing "Counter Strike IQ" by TradingIQ
Counter Strike IQ is an exclusive trading algorithm developed by TradingIQ, designed to trade upside/downside breakouts of varying significance. By integrating artificial intelligence and IQ Technology, Counter Strike IQ analyzes historical and real-time price data to construct a dynamic trading system adaptable to various asset and timeframe combinations.
Philosophy of Counter Strike IQ
Counter Strike IQ operates on a single premise: Support and resistance levels cannot hold forever. At some point either side must break for the underlying asset to exhibit trends; otherwise, prices would be confined to an infinitely narrowing range.
Counter Strike IQ is designed to work straight out of the box. In fact, its simplicity requires just four user settings to manage output, making it incredibly straightforward to manage.
Minimum ATR Profit, Minimum ATR Stop, EMA Filter and EMA Filter Length are the only settings that manage the performance of Counter Strike IQ!
Traders don’t have to spend hours adjusting settings and trying to find what works best - Counter Strike IQ handles this on its own.
Key Features of Counter Strike IQ
Self-Learning Breakout Detection
Employs AI and IQ Technology to identify notable breakouts in real-time.
AI-Generated Trading Signals
Provides breakout trading signals derived from self-learning algorithms.
Comprehensive Trading System
Offers clear entry and exit labels.
Performance Tracking
Records and presents trading performance data, easily accessible for user analysis.
Self-Learning Trading Exits
Counter Strike IQ learns where to exit positions.
Long and Short Trading Capabilities
Supports both long and short positions to trade various market conditions.
Strike Channel
The Strike Channel represents what Counter Strike IQ considers a tradable long opportunity or a tradable short opportunity. The Strike Channel is dynamic and adjusts from chart to chart.
IQ Graph Gradient
Introduces the IQ Graph Gradient, designed to classify extreme values in price on a grand scale.
How It Works
Counter Strike IQ operates on a straightforward heuristic: go long during significant upside price moves that break established resistance levels and go short during significant downside price moves that break established support levels.
IQ Technology, TradingIQ's proprietary AI algorithm, defines what constitutes a “significant price move” and what’s considered a tradable breakout. For Counter Strike IQ, this algorithm evaluates all historical support/resistance breaks and any subsequent breakouts. For instance, the price move following up to a breakout is measured and learned from, including the significance of the identified support/resistance level (how long it’s been active, how far price moved away from it, etc). By analyzing these patterns, Counter Strike IQ adapts to identify and trade similar future breakout sequences.
In simple terms, Counter Strike IQ learns from violations of historical support/resistance levels to identify potential entry points at currently established support/resistance levels. Using this knowledge, it determines the optimal, current support/resistance price level where a breakout has a higher chance of occurring.
For long positions, Counter Strike IQ places a stop-market order at the AI-identified resistance point. If price violates this level a market order will be placed and a long position entered. Of course, this is how the algorithm trades, users can elect to use a stop-limit order amongst other order types for position entry. After the position is entered TP1 is placed (identifiable on the price chart). TP1 has a twofold purpose:
Acts as a legitimate profit target to exit 50% of the position.
Once TP1 is closed over, the initial stop loss is converted to a trailing stop, and the long position remains active so long as price continues to uptrend.
For short positions, Counter Strike IQ places a stop-market order at the AI-identified support point. If price violates this level a market order will be placed and a short position entered. Again, this is how the algorithm trades, users can elect to use a stop-limit order amongst other order types for position entry. Upon entry TP1 is placed (identifiable on the price chart). TP1 has a twofold purpose:
Acts as a legitimate profit target to exit 50% of the position.
Once TP1 is closed over, the initial stop loss is converted to a trailing stop, and the short position remains active so long as price continues to downtrend.
As a trading system, Counter Strike IQ exits TP1 using a limit order, with all stop losses exited as stop market orders.
What Classifies As a Tradable Upside Breakout or Tradable Downside Breakout?
For Counter Strike IQ, tradable price breakouts are not manually set but are instead learned by the system. What qualifies as a significant upside or downside breakout in one market might not hold the same significance in another. Counter Strike IQ continuously analyzes historical and current support/resistance levels, how far price has extended from those levels, the raw-dollar price move leading up to a violation of those levels, their longevity, and more, to determine which future levels have a higher chance of breaking out when retested!
The image above illustrates the Strike Channel and explains the corresponding prices and levels
The green upper line represents the Long Breakout Point.
The pink lower line represents the Short Breakout Point.
Any price between the two deviation points is considered “Acceptable”.
The image above shows a long position being entered after the Upside Breakout Point was reached.
Green arrows indicate that the strategy entered a long position at the highlighted price level.
Blue arrows indicate that the strategy exited a position, whether at TP1, the initial stop loss, or at the trailing stop.
Blue lines indicate the TP1 level for the current trade. Red lines indicate the initial stop loss price.
If price closes above TP1, the initial stop loss will be replaced with a trailing stop. A blue line (similar to the blue line shown for TP1) will trail price and correspond to the trailing stop price of the trade.
The image above shows the trailing stop price, represented by a blue line, used for the long position!
You can also hover over the trade labels to get more information about the trade—such as the entry price and exit price.
The image above shows a short position being entered after the Downside Breakout Point was reached.
Red arrows indicate that the strategy entered a short position at the highlighted price level.
Blue arrows indicate that the strategy exited a position, whether at TP1, the initial stop loss, or at the trailing stop.
Blue lines indicate the TP1 level for the current trade. Red lines indicate the initial stop loss price.
If price closes below TP1, the initial stop loss will be replaced with a trailing stop. A blue line (similar to the blue line shown for TP1) will trail price and correspond to the trailing stop price of the trade.
The image above shows the trailing stop price, represented by a blue line, used for the short position!
You can also hover over the trade labels to get more information about the trade—such as the entry price and exit price.
IQ Gradient Graph
The IQ Gradient Graph provides a macro characterization of extreme prices.
The lower macro extremity of the IQ Gradient Graph is colored green, while the upper macro extremity is colored red.
Minimum Profit Target And Stop Loss
The Minimum ATR Profit Target and Minimum ATR Stop Loss setting control the minimum allowed profit target and stop loss distance. On most timeframes users won’t have to alter these settings; however, on very-low timeframes such as the 1-minute chart, users can increase these values so gross profits exceed commission.
After changing either setting, Counter Strike IQ will retrain on historical data - accounting for the newly defined minimum profit target or stop loss.
AI Direction
The AI Direction setting controls the trade direction Counter Strike IQ is allowed to take.
“Trade Longs” allows for long trades.
“Trade Shorts” allows for short trades.
EMA Filter
The EMA Filter setting controls whether the AI should implement an EMA trading filter. Simply, if the EMA Filter is active, long trades can only initiate if price is trading above the user-defined EMA. Conversely, short trades can only initiate if price is trading below the user-defined EMA.
The image above shows the EMA Filter in action!
Verifying Counter Strike IQ’s Effectiveness
Counter Strike IQ automatically tracks its performance and displays the profit factor for the long strategy and the short strategy it uses. This information can be found in the table located in the top-right corner of your chart showing.
This table shows the long strategy profit factor and the short strategy profit factor.
The image above shows the long strategy profit factor and the short strategy profit factor for Counter Strike IQ.
A profit factor greater than 1 indicates a strategy profitably traded historical price data.
A profit factor less than 1 indicates a strategy unprofitably traded historical price data.
A profit factor equal to 1 indicates a strategy did not lose or gain money when trading historical price data.
Using Counter Strike IQ
While Counter Strike IQ is a full-fledged trading system with entries and exits - manual traders can certainly make use of its on chart indications and visualizations.
The hallmark feature of Counter Strike IQ is its ability to signal a breakout near its origin point. Long entries are often signaled near the start of a large upside price move; short entries are often signaled near the start of a large downside price move.
For live analysis, the Strike Channel serves as a valuable tool for identifying breakout points.
The further price moves toward the Upside Breakout Point (green), the stronger the indication that price might breakout to the upside. Conversely, the deeper price reaches toward the Downside Breakout Point (red), the stronger the indication that price might breakout to the downside.
Of course, should buying or selling pressure stall, price may fail to breakout at the identified breakout level. This is a natural consequence of any breakout trading strategy!
With this information at hand, traders can quickly switch between charts and timeframes to identify optimized areas of interest.
Ücretli komut dosyası
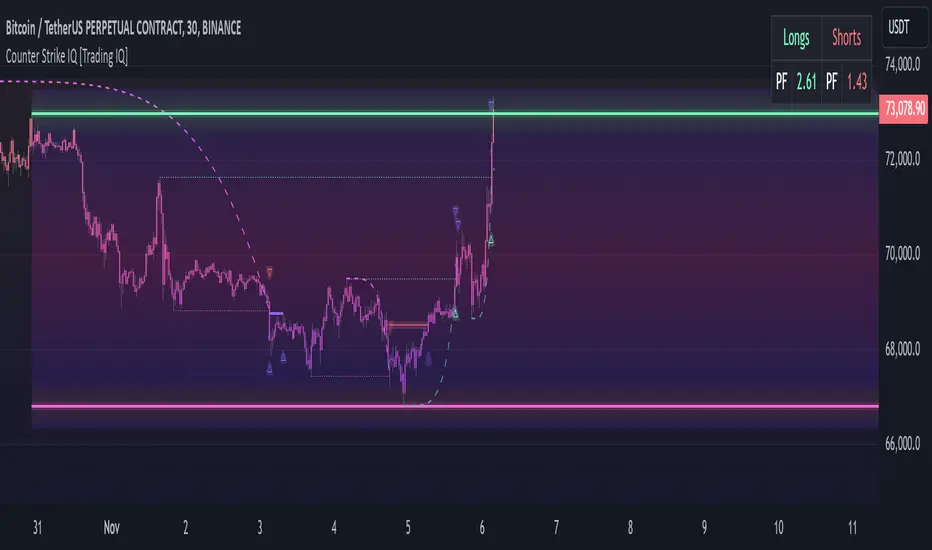
MTF Squeeze Analyzer - [tradeviZion]MTF Squeeze Analyzer
Multi-Timeframe Squeeze Pro Analyzer Tool
Overview:
The MTF Squeeze Analyzer is a comprehensive tool designed to help traders monitor the TTM Squeeze indicator across multiple timeframes in a streamlined and efficient manner. Built with Pine Script™ version 5, this indicator enhances your market analysis by providing detailed insights into squeeze conditions and momentum shifts, enabling you to make more informed trading decisions.
Key Features:
1. Multi-Timeframe Monitoring:
Comprehensive Coverage: Track squeeze conditions across multiple timeframes, including 1-minute, 5-minute, 15-minute, 30-minute, 1-hour, 2-hour, 4-hour, and daily charts.
Squeeze Counts: Keep count of the number of consecutive bars the price has been within each squeeze level (low, mid, high), helping you assess the strength and duration of consolidation periods.
2. Dynamic Table Display:
Customizable Appearance: Adjust table position, text size, and colors to suit your preferences.
Color-Coded Indicators: Easily identify squeeze levels and momentum shifts with intuitive color schemes.
Message Integration: Features rotating messages to keep you engaged and informed.
3. Alerts for Key Market Events:
Squeeze Start and Fire Alerts: Receive notifications when a squeeze starts or fires on your selected timeframes.
Custom Squeeze Count Alerts: Set thresholds for squeeze counts and get alerted when these levels are reached, allowing you to anticipate potential breakouts.
Fully Customizable: Choose which alerts you want to receive and tailor them to your trading strategy.
4. Momentum Analysis:
Momentum Oscillator: Visualize momentum using a histogram that changes color based on momentum shifts.
Detailed Insights: Determine whether momentum is increasing or decreasing to make more strategic trading decisions.
How It Works:
The indicator is based on the TTM Squeeze concept, which identifies periods of low volatility where the market is "squeezing" before a potential breakout. It analyzes the relationship between Bollinger Bands and Keltner Channels to determine squeeze conditions and uses linear regression to calculate momentum.
1. Squeeze Levels:
No Squeeze (Green): Market is not in a squeeze.
Low Compression Squeeze (Gray): Mild consolidation, potential for a breakout.
Mid Compression Squeeze (Red): Moderate consolidation, higher breakout potential.
High Compression Squeeze (Orange): Strong consolidation, significant breakout potential.
2. Squeeze Counts:
Tracks the number of consecutive bars in each squeeze condition.
Helps identify how long the market has been consolidating, providing clues about potential breakout timing.
3. Momentum Histogram:
Upward Momentum: Shown in aqua or blue, indicating increasing or decreasing upward momentum.
Downward Momentum: Displayed in red or yellow, representing increasing or decreasing downward momentum.
Using Alerts:
Stay ahead of market movements with customizable alerts:
1. Enable Alerts in Settings:
Squeeze Start Alert: Get notified when a new squeeze begins.
Squeeze Fire Alert: Be alerted when a squeeze ends, signaling a potential breakout.
Squeeze Count Alert: Set a specific number of bars for a squeeze condition, and receive an alert when this count is reached.
2. Set Up Alerts on Your Chart:
Click on the indicator name and select " Add Alert on MTF Squeeze Analyzer ".
Choose your desired alert conditions and customize the notification settings.
Click " Create " to activate the alerts.
How to Set It Up:
1. Add the Indicator to Your Chart:
Search for " MTF Squeeze Analyzer " in the TradingView Indicators library.
Add it to your chart.
2. Customize Your Settings:
Table Display:
Choose whether to show the table and select its position on the chart.
Adjust text size and colors to enhance readability.
Timeframe Selection:
Select the timeframes you want to monitor.
Enable or disable specific timeframes based on your trading strategy.
Colors & Styles:
Customize colors for different squeeze levels and momentum shifts.
Adjust header and text colors to match your chart theme.
Alert Settings:
Enable alerts for squeeze start, squeeze fire, and squeeze counts.
Set your preferred squeeze type and count threshold for alerts.
3. Interpret the Data:
Table Information:
The table displays the squeeze status and counts for each selected timeframe.
Colors indicate the type of squeeze, making it easy to assess market conditions at a glance.
Momentum Histogram:
Use the histogram to gauge the strength and direction of market momentum.
Observe color changes to identify shifts in momentum.
Why Use MTF Squeeze Analyzer ?
Enhanced Market Insight:
Gain a deeper understanding of market dynamics by monitoring multiple timeframes simultaneously.
Identify potential breakout opportunities by analyzing squeeze durations and momentum shifts.
Customizable and User-Friendly:
Tailor the indicator to fit your trading style and preferences.
Easily adjust settings without needing to delve into the code.
Time-Efficient:
Save time by viewing all relevant squeeze information in one place.
Reduce the need to switch between different charts and timeframes.
Stay Informed with Alerts:
Never miss a critical market movement with fully customizable alerts.
Focus on other tasks while the indicator monitors the market for you.
Acknowledgment:
This tool builds upon the foundational work of John Carter , who developed the TTM Squeeze concept. It also incorporates enhancements from LazyBear and Makit0 , providing a more versatile and powerful indicator. MTF Squeeze Analyzer extends these concepts by adding multi-timeframe analysis, squeeze counting, and advanced alerting features, offering traders a comprehensive solution for market analysis.
Note: Always practice proper risk management and test the indicator thoroughly to ensure it aligns with your trading strategy. Past performance is not indicative of future results.
Trade smarter with TradeVizion—unlock your trading potential today!

Price Action - Support & Resistance by DGTSᴜᴘᴘᴏʀᴛ ᴀɴᴅ Rᴇꜱɪꜱᴛᴀɴᴄᴇ , is undoubtedly one of the key concepts of technical analysis
█ Sᴜᴘᴘᴏʀᴛ ᴀɴᴅ Rᴇꜱɪꜱᴛᴀɴᴄᴇ Dᴇꜰɪɴɪᴛɪᴏɴ
Support and Resistance terms are used by traders to refer to price levels on charts that tend to act as barriers, preventing the price of an financial instrument from getting pushed in a certain direction.
A support level is a price level where buyers are more aggressive than sellers. This means that the price is more likely to "bounce" off this level rather than break through it. However, once the price has breached this level it is likely to continue falling until meeting another support level.
A resistance level is the opposite of a support level. It is where the price tends to find resistance as it rises. Again, this means that the price is more likely to "bounce" off this level rather than break through it. However, once the price has breached this level it is likely to continue rising until meeting another resistance level.
A previous support level will sometimes become a resistance level when the price attempts to move back up, and conversely, a resistance level will become a support level as the price temporarily falls back.
█ Iᴅᴇɴᴛɪꜰʏɪɴɢ Sᴜᴘᴘᴏʀᴛ ᴀɴᴅ Rᴇꜱɪꜱᴛᴀɴᴄᴇ
Support and resistance can come in various forms, and the concept is more difficult to master than it first appears. Identification of key support and resistance levels is an essential ingredient to successful technical analysis.
If the price stalls and reverses in the same price area on minimum of two different occasions, then a horizontal line is drawn to show that the market is struggling to move past that area. Those areas are static barriers, one of the most popular forms of support/resistance and are highlighted with horizontal lines.
Repeated test , the more often a support/resistance level is "tested" over an extended period of time (touched and bounced off by price), the more significance is given to that specific level
High volume , the more buying and selling that has occurred at a particular price level, the stronger the support or resistance level is likely to be
Market psychology , plays a major role as traders and investors remember the past and react to changing conditions to anticipate future market movement.
Psychological levels , is a price level that significantly affects the price of an underlying financial instrument. Typically, near round numbers often serve as support and resistance
The following support and resistance related topics are beyond the scope of this study, so they will be mentioned roughly only as a reference for support and resistance concept
Trendlines , Support and resistance levels in trends are dynamic. Throughout an uptrend, levels of support tend to look like a trendline, usually clustering around higher lows. As the price rises, the price where buyers consider the stock to be “too cheap” also changes, which creates new support levels on the way up. The same is also true for resistance levels. In an uptrend, a stock is continuously breaking through perceived resistance levels and making new highs
Moving Averages , is a constantly changing line that smooths out past price data while also allowing the trader to identify support and resistance. In the example Notice how the price of the asset finds support at the moving average when the trend is up, and how it acts as resistance when the trend is down
The Fibonacci Retracement/Extension tool , is a favorite among many short-term traders because it clearly identifies levels of potential support and resistance
Pivot Point Calculations , is another common technical analysis technique, where pivot point is calculated based on the high, low, and closing prices of previous trading session/day and support & resistance levels are projected based on the pivot point, different calculation techniques are available, as presented in this example of an pivot point indicator : PVTvX by DGT
█ Tʀᴀᴅɪɴɢ Bᴀꜱᴇᴅ ᴏɴ Sᴜᴘᴘᴏʀᴛ ᴀɴᴅ Rᴇꜱɪꜱᴛᴀɴᴄᴇ
Once an area or "zone" of support or resistance has been identified, those price levels can serve as potential entry or exit points because, as a price reaches a point of support or resistance, it will do one of two things—bounce back away from the support or resistance level (trading ranges), or violate the price level and continue in its direction (trading breakouts) —until it hits the next support or resistance level
The basic trading method for using support and resistance is to buy near support in uptrends or the parts of ranges or chart patterns where prices are moving up and to sell/sell short near resistance in downtrends or the parts of ranges and chart patterns where prices are moving down. Buying near support or selling near resistance can pay off, but there is no assurance that the support or resistance will hold. Therefore, consider waiting for some confirmation that the market is still respecting that area
Trading breakouts, a breakout is a potential trading opportunity that occurs when an asset's price moves above a resistance level or moves below a support level on increasing volume. The first step in trading breakouts is to identify current price trend patterns along with support and resistance levels in order to plan possible entry and exit points. Once the asset trades beyond the price barrier, volatility tends to increase and prices usually trend in the breakout's direction. Breakouts are such an important trading strategy since these setups are the starting point for future volatility increases, large price swings and, in many circumstances, major price trends. When trading breakouts, it is important to consider the underlying asset's support and resistance levels. The more times an asset price has touched these areas, the more valid these levels are and the more important they become. At the same time, the longer these support and resistance levels have been in play, the better the outcome when the asset price finally breaks out. Asset prices will often move slightly further than we expect them to. This doesn't happen all the time, but when it does it is called a false breakout. Therefore it is important to consider waiting for some confirmation while trading breakouts. It’s also popular for traders to sell 50% of their positions at the resistance level, and hold the rest in anticipation of a breakout above resistance
█ Pʀɪᴄᴇ Aᴄᴛɪᴏɴ - Sᴜᴘᴘᴏʀᴛ & Rᴇꜱɪꜱᴛᴀɴᴄᴇ ʙʏ DGT Sᴛᴜᴅʏ
This experimental study attempts to identify the support and resistance levels. Assumes a simple logic to discover moments where the price is rising or falling consecutively for minimum 3 bars with the condition volume increases on each bar and the last bar’s volume should be bigger than the long term volume moving average. A line will be drawn at the end of the move (highest or lowest, depending on the move direction), the line will be drawn at minimum on the 3rd bar and if condition holds for other consecutive bars the line will switch to 4th, 5th etc bar.
Lines will not be deleted so the historical ones will remain and will emphasis the levels significance when they overlap in feature. Strong levels are more likely to hold and cause the price to move in the other direction, whereas the minor levels may only cause the price to pause and keep moving in the same direction. Determining future levels of support and resistance can drastically improve the returns of a short-term investing strategy
Bar colors will be painted based on the volume of the specific bar to its long term volume moving average. This will help identifying the support and resistance levels significance and emphasis the sings of breakouts
Finally, Volume spikes will be marked on top of the price chart. A high volume usually indicates more interest in the security and the presence of institutional traders. However, a rapidly rising price in an uptrend accompanied by a huge volume may be a sign of exhaustion. Traders usually look for breaks of support and resistance to enter positions. When security break critical levels without volume , you should consider the breakout suspect and prime for a reversal off the highs/lows. Volume spikes are often the result of news-driven events. Volume spike will often lead to sharp reversals since the moves are unsustainable due to the imbalance of supply and demand
A good example with many support and resistance concepts observed on a stock chart and detected by the study
Settings:
Length of volume moving average, where volume moving average is used to detect support and resistance levels, is used as reference to compare with threshold values for volume spikes and colors of the bars
Hint, to get more historical lines scrolling chart to left will enable visualization of them. Please note they may appear to much all 500 line limit is used 😉
Special thanks to @HEMANT Telegram user, for his observations and suggestions
Disclaimer:
Trading success is all about following your trading strategy and the indicators should fit within your trading strategy, and not to be traded upon solely
The script is for informational and educational purposes only. Use of the script does not constitute professional and/or financial advice. You alone have the sole responsibility of evaluating the script output and risks associated with the use of the script. In exchange for using the script, you agree not to hold dgtrd TradingView user liable for any possible claim for damages arising from any decision you make based on use of the script

TradeChartist Ichimoku Trader ™TradeChartist Ichimoku Trader is an elegant and functional breakouts trading indicator that generates trade signals based on two types of breakouts - True Ichimoku Kumo Breakouts and Ichimoku Trade Bands Breakouts, which can be further filtered using ™TradeChartist MA Visualizer and/or using an external Filter.
===================================================================================================================
╔════════ 𝗖𝗹𝗼𝘂𝗱 𝗦𝗲𝘁𝘁𝗶𝗻𝗴𝘀 ═════════╗
Cloud Settings form the fundamental factor for this indicator to detect the breakouts. The settings for the Ichimoku Cloud is Automatic by default, but this can be changed based on the user preference from the settings under 𝐂𝐥𝐨𝐮𝐝 𝐓𝐲𝐩𝐞, which also includes a manual input option. Ichimoku traders can experiment different settings combinations under manual settings to suit their trading frequency and timeframe traded.
Ichimoku Cloud with its components can be displayed or hidden by enabling/disabling 𝐃𝐢𝐬𝐩𝐥𝐚𝐲 𝐈𝐜𝐡𝐢𝐦𝐨𝐤𝐮 𝐂𝐥𝐨𝐮𝐝. Also, Sʜᴏᴡ Iᴄʜɪᴍᴏᴋᴜ Cʀᴏssᴇs from the Cloud Settings plots tiny crosses on chart.
===================================================================================================================
╔═════════ 𝗕𝗮𝗻𝗱𝘀 𝗦𝗲𝘁𝘁𝗶𝗻𝗴𝘀 ════════╗
Even though the Ichimoku Trade Bands are derived from the Cloud Parameters, the Bᴀɴᴅ Wɪᴅᴛʜ (0.236 - 1) and Lᴏᴏᴋʙᴀᴄᴋ (5 - 200) influences the sensitivity and the width of the bands, which has an effect on the risk and reward expected from Ichimoku Trade Bands Breakout trade.
Trade Bands can be displayed or hidden by enabling/disabling 𝐃𝐢𝐬𝐩𝐥𝐚𝐲 𝐈𝐜𝐡𝐢𝐦𝐨𝐤𝐮 𝐓𝐫𝐚𝐝𝐞 𝐁𝐚𝐧𝐝𝐬. Also, the Bands mean line can be enabled or disabled using 𝐃𝐢𝐬𝐩𝐥𝐚𝐲 𝐓𝐫𝐚𝐝𝐞 𝐁𝐚𝐧𝐝𝐬 𝐌𝐞𝐚𝐧 𝐋𝐢𝐧𝐞 check box and its line width can be changed using Tʀᴀᴅᴇ Bᴀɴᴅs Mᴇᴀɴ Lɪɴᴇ Wɪᴅᴛʜ dropdown.
===================================================================================================================
╔═════════ 𝗠𝗔 𝗩𝗶𝘀𝘂𝗮𝗹𝗶𝘇𝗲𝗿 ═════════╗
MA Visualizer is a powerful and very useful original ™TradeChartist visual method to plot Moving Averages of the close price of the security for user specified look back period in a visually appealing style in the form of colour coded bands. MA Visualizer not only helps the trader spot the price action of the security relative to the moving average, but also paints a visual picture of the trend strength, which must be seen and used on chart to appreciate its elegance. One of 15 different types of Moving Averages can be used to visualize the price action.
Activate 𝗠𝗔 𝗩𝗶𝘀𝘂𝗮𝗹𝗶𝘇𝗲𝗿 and choose the MA type from MA Vɪsᴜᴀʟɪᴢᴇʀ Tʏᴘᴇ dropdown and entering the lookback period in MA Vɪsᴜᴀʟɪᴢᴇʀ ᴘᴇʀɪᴏᴅ input box. MA Visualizer colour theme can be be changed from MA Vɪsᴜᴀʟɪᴢᴇʀ Cᴏʟᴏʀ Sᴄʜᴇᴍᴇ dropdown.
The faster of the two set of bands that form the MA Visualizer reacts to price action faster and can be clearly seen from its change of colour from Bull Colour to Bear Colour or viceversa earlier than the slower set of bands. The fill colour between the bands also helps the user stay in a trade or exit a trade based on other confirmators.
===================================================================================================================
╔═══════ 𝗦𝗶𝗴𝗻𝗮𝗹𝘀 𝗮𝗻𝗱 𝗙𝗶𝗹𝘁𝗲𝗿𝘀 ═══════╗
Signal Type
True Ichimoku Kumo Breakout
Ichimoku traders mostly use the Kumo breakouts for trading based on several Bullish and Bearish conditions. For the sake of effective trade entries, trade entry plots for specific cloud events like Kumo twists, Tenkan Sen crossing Kijun Sen, price crossing cloud components etc have been intentionally ignored as Ichimoku traders often tend to visually trade them effectively.
Ichimoku Trade Bands Breakout
In addition to the True Kumo Breakouts, users of this script will be able to trade Ichimoku Trade Bands Breakouts. Ichimoku Trade Bands is an original ™TradeChartist model designed to detect early trend changes based on the Ichimoku settings. These bands are comprised of three plots - an upper band, a lower band and a mean line, namely and all are derived from the Ichimoku settings. The bands act as a filter and a breakout from bands' extreme boundaries signals a change in trend. The settings of the bands can be derived automatically or using manual input based on Ichimoku Cloud parameters, accessed from the indicator settings.
The Breakout Trade Entries can be further filtered by use of MA Visualizer or by using an external filter connected to the script.
===================================================================================================================
╔═════════ 𝗙𝗶𝗹𝘁𝗲𝗿 𝗦𝗲𝘁𝘁𝗶𝗻𝗴𝘀 ═════════╗
Filters are normally used to reduce noise in the Trade Entry Signals and they can be quite effective in helping the trader stay in trade and to minimize unproductive trade entries. Ichimoku Trader enables the user to use upto two trade filters - MA Visualizer and /or External Filter respectively.
Moving Averages are very effective trade filters and if the right Moving Average is used with right lookback period based on trade type and timeframe traded, they can be very effective in filtering trades.
Enabling 𝐔𝐬𝐞 𝐌𝐀 𝐕𝐢𝐬𝐮𝐚𝐥𝐢𝐳𝐞𝐫 𝐚𝐬 𝐓𝐫𝐚𝐝𝐞 𝐅𝐢𝐥𝐭𝐞𝐫 filters breakouts only when MA Visualizer agrees with the trend (which can be visualized using the fill colour between the MA Visualizer plots.
Enabling Fɪʟᴛᴇʀ Eᴀʀʟʏ Vɪsᴜᴀʟɪᴢᴇʀ Bʀᴇᴀᴋᴏᴜᴛs in addition filters breakouts even if price closed above the upper MA Visualizer plot without having to agree with fill colour.
In addition to MA Visualizer Filter, and external filter like RSI, MACD etc. can also be used by connecting to Ichimoku Trader under ╔═══ 𝗣𝗹𝘂𝗴 𝗙𝗶𝗹𝘁𝗲𝗿 𝗵𝗲𝗿𝗲 ═══ 🔌 dropdown by enabling 𝐔𝐬𝐞 𝐄𝐱𝐭𝐞𝐫𝐧𝐚𝐥 𝐅𝐢𝐥𝐭𝐞𝐫 𝐚𝐬 𝐓𝐫𝐚𝐝𝐞 𝐅𝐢𝐥𝐭𝐞𝐫. The external filter can be used as the only filter or in addition to MA Visualizer filter.
To get the external filter to work, Sɪɢɴᴀʟ Tʏᴘᴇ must be set right. For plots that are not oscillatory like Moving Averages, Super Trend etc., choose type as Non Oscillatory and for Oscillators like RSI, CCI, MACD etc., choose type as Oscillatory .
For Oscillators, levels must be specified for Fɪʟᴛᴇʀ Lᴇᴠᴇʟ ғᴏʀ ʟᴏɴɢs and Fɪʟᴛᴇʀ Lᴇᴠᴇʟ ғᴏʀ sʜᴏʀᴛs , especially if the Oscillator doesnt have 0 as mid line, like RSI. Even for 0 mid oscillators like CCI, filter levels like 100/-100 work effectively to filter noise.
Use 𝐓𝐫𝐚𝐝𝐞 𝐙𝐨𝐧𝐞𝐬 𝐁𝐚𝐜𝐤𝐠𝐫𝐨𝐮𝐧𝐝 𝐅𝐢𝐥𝐥 under 𝗨𝘀𝗲𝗳𝘂𝗹 𝗘𝘅𝘁𝗿𝗮𝘀 to paint the trade zones background. It helps visually see the effect of filters on the breakout entries and also the trade performance.
===================================================================================================================
╔═════════ 𝗨𝘀𝗲𝗳𝘂𝗹 𝗘𝘅𝘁𝗿𝗮𝘀 ═════════╗
Ichimoku Trader also includes the following useful extras
𝐓𝐫𝐚𝐝𝐞 𝐙𝐨𝐧𝐞𝐬 𝐁𝐚𝐜𝐤𝐠𝐫𝐨𝐮𝐧𝐝 𝐅𝐢𝐥𝐥 paints the trade zones in green and red as mentioned above.
Sʜᴏᴡ Hɪɢʜs ᴀɴᴅ Lᴏᴡs plots the highest highs of the Bull Zone and the lowest lows of the Bear Zone to help spot the wicks, support and resistance.
Tᴀᴋᴇ Pʀᴏғɪᴛ Bᴀʀs helps detect the volatility exhaustion prices and plots $ signs to help the trader take profits or move stop loss levels to secure gains or to reduce losses.
Vɪsᴜᴀʟɪᴢᴇʀ Cᴏʟᴏʀ Bᴀʀs paints the price bars with trend intensity and the user can opt from one of two themes under Bᴀʀ Cᴏʟᴏʀ Sᴄʜᴇᴍᴇ (Chilli and Flame).
The bar colors can be inverted by enabling Iɴᴠᴇʀᴛ Bᴀʀ Cᴏʟᴏʀs to see reverse bias with respect to the current trade direction.
===================================================================================================================
╔═════════ 𝗔𝗹𝗲𝗿𝘁𝘀 ═════════╗
Alerts can be created for Long and Short entries by using Once Per Bar Close as Alert Frequency. Entries are generated on Real time bars based on Breakout and filter conditions. It is recommended to wait for bar close before taking a position based on Ichimoku Trader Trade Entries.
The indicator does not repaint and can be confidently used for alerts and trade entries without worrying about signals disappearing.
™TradeChartist Ichimoku Trader 𝗧𝗿𝗲𝗻𝗱 𝗜𝗱𝗲𝗻𝘁𝗶𝗳𝗶𝗲𝗿 can also be connected to ™TradeChartist Plug and Trade to generate entries along with Targets, Stop Loss plots etc. Target and Stop Loss alerts can be created using Plug and Trade's Alerts system.
===================================================================================================================
There are several combinations of settings that can be tested on the security traded based on timeframe and risk/reward expectations. The indicator can be used for trade entries with filter combinations or can be used as standalone Visualizer for trend confirmations, levels etc. Following are a few examples using the Visualizer.
╔════════ 𝗘𝘅𝗮𝗺𝗽𝗹𝗲 𝗖𝗵𝗮𝗿𝘁𝘀 ════════╗
1. BTC-USDT 1hr True Ichimoku Kumo Breakout with no filters.
2. BTC-USDT 1hr Ichimoku Trade Bands (Default) Breakout with no filters.
3. BTC-USDT 1hr Ichimoku Trade Bands (Default) Breakout using 200 period Hull MA Visualizer filter.
4. AAPL 4hr Ichimoku Trade Bands (Default) Breakout using 200 period VIDYA MA Visualizer filter. Note: VIDYA is normally used for long term trades.
5. GBP-USD 5m True Ichimoku Kumo Breakout using 144 period TEMA MA Visualizer filter and Money Flow Index connected as external filter with 80/20 Filter values.
6. XAU-USD 1hr Ichimoku Trade Bands (Default) Breakout using 144 period TEMA MA Visualizer and Keltner Channels basis line as external non-oscillatory filter, connected to ™TradeChartist Plug and Trade using Ichimoku Trader 𝗧𝗿𝗲𝗻𝗱 𝗜𝗱𝗲𝗻𝘁𝗶𝗳𝗶𝗲𝗿.
7. SHITPERP 1hr Ichimoku Trade Bands (0.618 Band Width and Lookback 89 periods) using 50 period Zero-Lag EMA Visualizer Filter.
===================================================================================================================
Best Practice: Test with different settings first using Paper Trades before trading with real money
===================================================================================================================
This is not a free to use indicator. Get in touch with me (PM me directly if you would like trial access to test the indicator)
Premium Scripts - Trial access and Information
Trial access offered on all Premium scripts.
PM me directly to request trial access to the scripts or for more information.
===================================================================================================================
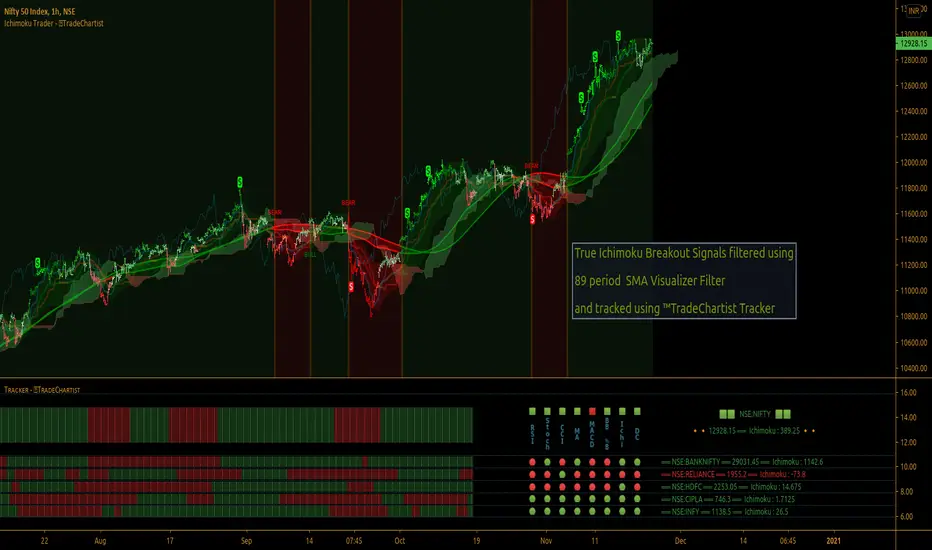
Opening Range Breakout with Multi-Timeframe Liquidity]═══════════════════════════════════════
OPENING RANGE BREAKOUT WITH MULTI-TIMEFRAME LIQUIDITY
═══════════════════════════════════════
A professional Opening Range Breakout (ORB) indicator enhanced with multi-timeframe liquidity detection, trading session visualization, volume analysis, and trend confirmation tools. Designed for intraday trading with comprehensive alert system.
───────────────────────────────────────
WHAT THIS INDICATOR DOES
───────────────────────────────────────
This indicator combines multiple trading concepts:
- Opening Range Breakout (ORB) - Customizable time period detection with automatic high/low identification
- Multi-Timeframe Liquidity - HTF (Higher Timeframe) and LTF (Lower Timeframe) key level detection
- Trading Sessions - Tokyo, London, New York, and Sydney session visualization
- Volume Analysis - Volume spike detection and strength measurement
- Multi-Timeframe Confirmation - Trend bias from higher timeframes
- EMA Integration - Trend filter and dynamic support/resistance
- Smart Alerts - Quality-filtered breakout notifications
───────────────────────────────────────
HOW IT WORKS
───────────────────────────────────────
OPENING RANGE BREAKOUT (ORB):
Concept:
The Opening Range is a period at the start of a trading session where price establishes an initial high and low. Breakouts beyond this range often indicate the direction of the day's trend.
Detection Method:
- Default: 15-minute opening range (configurable)
- Custom Range: Set specific session times with timezone support
- Automatically identifies ORH (Opening Range High) and ORL (Opening Range Low)
- Tracks ORB mid-point for reference
Range Establishment:
1. Session starts (or custom time begins)
2. Tracks highest high and lowest low during the period
3. Range confirmed at end of opening period
4. Levels extend throughout the session
Breakout Detection:
- Bullish Breakout: Close above ORH
- Bearish Breakout: Close below ORL
- Mid-point acts as bias indicator
Visual Display:
- Shaded box during range formation
- Horizontal lines for ORH, ORL, and mid-point
- Labels showing level values
- Color-coded fills based on selected method
Fill Color Methods:
1. Session Comparison:
- Green: Current OR mid > Previous OR mid
- Red: Current OR mid < Previous OR mid
- Gray: Equal or first session
- Shows day-over-day momentum
2. Breakout Direction (Recommended):
- Green: Price currently above ORH (bullish breakout)
- Red: Price currently below ORL (bearish breakout)
- Gray: Price inside range (no breakout)
- Real-time breakout status
MULTI-TIMEFRAME LIQUIDITY:
Two-Tier System for comprehensive level identification:
HTF (Higher Timeframe) Key Liquidity:
- Default: 4H timeframe (configurable to Daily, Weekly)
- Identifies major institutional levels
- Uses pivot detection with adjustable parameters
- Suitable for swing highs/lows where large orders rest
LTF (Lower Timeframe) Key Liquidity:
- Default: 1H timeframe (configurable)
- Provides precision entry/exit levels
- Finer granularity for intraday trading
- Captures minor swing points
Calculation Method:
- Pivot high/low detection algorithm
- Configurable left bars (lookback) and right bars (confirmation)
- Timeframe multiplier for accurate multi-timeframe detection
- Automatic level extension
Mitigation System:
- Tracks when levels are swept (broken)
- Configurable mitigation type: Wick or Close-based
- Option to remove or show mitigated levels
- Display limit prevents chart clutter
Asset-Specific Optimization:
The indicator includes quick reference settings for different assets:
- Major Forex (EUR/USD, GBP/USD): Default settings optimal
- Crypto (BTC/ETH): Left=12, Right=4, Display=7
- Gold: HTF=1D, Left=20
TRADING SESSIONS:
Four Major Sessions with Full Customization:
Tokyo Session:
- Default: 04:00-13:00 UTC+4
- Asian trading hours
- Often sets daily range
London Session:
- Default: 11:00-20:00 UTC+4
- Highest liquidity period
- Major institutional activity
New York Session:
- Default: 16:00-01:00 UTC+4
- US market hours
- High-impact news events
Sydney Session:
- Default: 01:00-10:00 UTC+4
- Earliest Asian activity
- Lower volatility
Session Features:
- Shaded background boxes
- Session name labels
- Optional open/close lines
- Session high/low tracking with colored lines
- Each session has independent color settings
- Fully customizable times and timezones
VOLUME ANALYSIS:
Volume-Based Trade Confirmation:
Volume MA:
- Configurable period (default: 20)
- Establishes average volume baseline
- Used for spike detection
Volume Spike Detection:
- Identifies when volume exceeds MA * multiplier
- Default: 1.5x average volume
- Confirms breakout strength
Volume Strength Measurement:
- Calculates current volume as percentage of average
- Shows relative volume intensity
- Used in alert quality filtering
High Volume Bars:
- Identifies bars above 50th percentile
- Additional confirmation layer
- Indicates institutional participation
MULTI-TIMEFRAME CONFIRMATION:
Trend Bias from Higher Timeframes:
HTF 1 (Trend):
- Default: 1H timeframe
- Uses EMA to determine intermediate trend
- Compares current timeframe EMA to HTF EMA
HTF 2 (Bias):
- Default: 4H timeframe
- Uses 50 EMA for longer-term bias
- Confirms overall market direction
Bias Classifications:
- Bullish Bias: HTF close > HTF 50 EMA AND Current EMA > HTF1 EMA
- Bearish Bias: HTF close < HTF 50 EMA AND Current EMA < HTF1 EMA
- Neutral Bias: Mixed signals between timeframes
EMA Stack Analysis:
- Compares EMA alignment across timeframes
- +1: Bullish stack (lower TF EMA > higher TF EMA)
- -1: Bearish stack (lower TF EMA < higher TF EMA)
- 0: Neutral/crossed
Usage:
- Filters false breakouts
- Confirms trend direction
- Improves trade quality
EMA INTEGRATION:
Dynamic EMA for Trend Reference:
Features:
- Configurable period (default: 20)
- Customizable color and width
- Acts as dynamic support/resistance
- Trend filter for ORB trades
Application:
- Above EMA: Favor long breakouts
- Below EMA: Favor short breakouts
- EMA cross: Potential trend change
- Distance from EMA: Momentum gauge
SMART ALERT SYSTEM:
Quality-Filtered Breakout Notifications:
Alert Types:
1. Standard ORB Breakout
2. High Quality ORB Breakout
Quality Criteria:
- Volume Confirmation: Volume > 1.2x average
- MTF Confirmation: Bias aligned with breakout direction
Standard Alert:
- Basic breakout detection
- Price crosses ORH or ORL
- Icon: 🚀 (bullish) or 🔻 (bearish)
High Quality Alert:
- Both volume AND MTF confirmed
- Stronger probability setup
- Icon: 🚀⭐ (bullish) or 🔻⭐ (bearish)
Alert Information Includes:
- Alert quality rating
- Breakout level and current price
- Volume strength percentage (if enabled)
- MTF bias status (if enabled)
- Recommended action
One Alert Per Bar:
- Prevents alert spam
- Uses flag system to track sent alerts
- Resets on new ORB session
───────────────────────────────────────
HOW TO USE
───────────────────────────────────────
OPENING RANGE SETUP:
Basic Configuration:
1. Select time period for opening range (default: 15 minutes)
2. Choose fill color method (Breakout Direction recommended)
3. Enable historical data display if needed
Custom Range (Advanced):
1. Enable Custom Range toggle
2. Set specific session time (e.g., 0930-0945)
3. Select appropriate timezone
4. Useful for specific market opens (NYSE, LSE, etc.)
LIQUIDITY LEVELS SETUP:
Quick Configuration by Asset:
- Forex: Use default settings (Left=15, Right=5)
- Crypto: Set Left=12, Right=4, Display=7
- Gold: Set HTF=1D, Left=20
HTF Liquidity:
- Purpose: Major support/resistance levels
- Recommended: 4H for day trading, 1D for swing trading
- Use as profit targets or reversal zones
LTF Liquidity:
- Purpose: Entry/exit refinement
- Recommended: 1H for day trading, 4H for swing trading
- Use for position management
Mitigation Settings:
- Wick-based: More sensitive (default)
- Close-based: More conservative
- Remove or Show mitigated levels based on preference
TRADING SESSIONS SETUP:
Enable/Disable Sessions:
- Master toggle for all sessions
- Individual session controls
- Show/hide session names
Session High/Low Lines:
- Enable to see session extremes
- Each session has custom colors
- Useful for range trading
Customization:
- Adjust session times for your broker
- Set timezone to match your location
- Customize colors for visibility
VOLUME ANALYSIS SETUP:
Enable Volume Analysis:
1. Toggle on Volume Analysis
2. Set MA length (20 recommended)
3. Adjust spike multiplier (1.5 typical)
Usage:
- Confirm breakouts with volume
- Identify climactic moves
- Filter false signals
MULTI-TIMEFRAME SETUP:
HTF Selection:
- HTF 1 (Trend): 1H for day trading, 4H for swing
- HTF 2 (Bias): 4H for day trading, 1D for swing
Interpretation:
- Trade only with bias alignment
- Neutral bias: Be cautious
- Bias changes: Potential reversals
EMA SETUP:
Configuration:
- Period: 20 for responsive, 50 for smoother
- Color: Choose contrasting color
- Width: 1-2 for visibility
Usage:
- Filter trades: Long above, Short below
- Dynamic support/resistance reference
- Trend confirmation
ALERT SETUP:
TradingView Alert Creation:
1. Enable alerts in indicator settings
2. Enable ORB Breakout Alerts
3. Right-click chart → Add Alert
4. Select this indicator
5. Choose "Any alert() function call"
6. Configure delivery method (mobile, email, webhook)
Alert Filtering:
- All alerts include quality rating
- High Quality alerts = Volume + MTF confirmed
- Standard alerts = Basic breakout only
───────────────────────────────────────
TRADING STRATEGIES
───────────────────────────────────────
CLASSIC ORB STRATEGY:
Setup:
1. Wait for opening range to complete
2. Price breaks and closes above ORH or below ORL
3. Volume > average (if enabled)
4. MTF bias aligned (if enabled)
Entry:
- Bullish: Buy on break above ORH
- Bearish: Sell on break below ORL
- Consider retest entries for better risk/reward
Stop Loss:
- Bullish: Below ORL or range mid-point
- Bearish: Above ORH or range mid-point
- Adjust based on volatility
Targets:
- Initial: Range width extension (ORH + range width)
- Secondary: HTF liquidity levels
- Final: Session high/low or major support/resistance
ORB + LIQUIDITY CONFLUENCE:
Enhanced Setup:
1. Opening range established
2. HTF liquidity level near or beyond ORH/ORL
3. Breakout occurs with volume
4. Price targets the liquidity level
Entry:
- Enter on ORB breakout
- Target the HTF liquidity level
- Use LTF liquidity for position management
Management:
- Partial profits at ORB + range width
- Move stop to breakeven at LTF liquidity
- Final exit at HTF liquidity sweep
ORB REJECTION STRATEGY (Counter-Trend):
Setup:
1. Price breaks above ORH or below ORL
2. Weak volume (below average)
3. MTF bias opposite to breakout
4. Price closes back inside range
Entry:
- Failed bullish break: Short below ORH
- Failed bearish break: Long above ORL
Stop Loss:
- Beyond the failed breakout level
- Or beyond session extreme
Target:
- Opposite end of opening range
- Range mid-point for partial profit
SESSION-BASED ORB TRADING:
Tokyo Session:
- Typically narrower ranges
- Good for range trading
- Wait for London open breakout
London Session:
- Highest volume and volatility
- Strong ORB setups
- Major liquidity sweeps common
New York Session:
- Strong trending moves
- News-driven volatility
- Good for momentum trades
Sydney Session:
- Quieter conditions
- Suitable for range strategies
- Sets up Tokyo session
EMA-FILTERED ORB:
Rules:
- Only take bullish breaks if price > EMA
- Only take bearish breaks if price < EMA
- Ignore counter-trend breaks
Benefits:
- Reduces false signals
- Aligns with larger trend
- Improves win rate
───────────────────────────────────────
CONFIGURATION GUIDE
───────────────────────────────────────
OPENING RANGE SETTINGS:
Time Period:
- 15 min: Standard for most markets
- 30 min: Wider range, fewer breakouts
- 60 min: For slower markets or swing trades
Custom Range:
- Use for specific market opens
- NYSE: 0930-1000 EST
- LSE: 0800-0830 GMT
- Set timezone to match exchange
Historical Display:
- Enable: See all previous session data
- Disable: Cleaner chart, current session only
LIQUIDITY SETTINGS:
Left Bars (5-30):
- Lower: More frequent, sensitive levels
- Higher: Fewer, more significant levels
- Recommended: 15 for most markets
Right Bars (1-25):
- Confirmation period
- Higher: More reliable, less frequent
- Recommended: 5 for balance
Display Limit (1-20):
- Number of active levels shown
- Higher: More context, busier chart
- Recommended: 7 for clarity
Extension Options:
- Short: Levels visible near formation
- Current: Extended to current bar (recommended)
- Max: Extended indefinitely
VOLUME SETTINGS:
MA Length (5-50):
- Shorter: More responsive to spikes
- Longer: Smoother baseline
- Recommended: 20 for balance
Spike Multiplier (1.0-3.0):
- Lower: More sensitive spike detection
- Higher: Only extreme spikes
- Recommended: 1.5 for day trading
MULTI-TIMEFRAME SETTINGS:
HTF 1 (Trend):
- 5m chart: Use 15m or 1H
- 15m chart: Use 1H or 4H
- 1H chart: Use 4H or 1D
HTF 2 (Bias):
- One level higher than HTF 1
- Provides longer-term context
- Don't use same as HTF 1
EMA SETTINGS:
Length:
- 20: Responsive, more signals
- 50: Smoother, stronger filter
- 200: Long-term trend only
Style:
- Choose contrasting color
- Width 1-2 for visibility
- Match your trading style
───────────────────────────────────────
BEST PRACTICES
───────────────────────────────────────
Chart Timeframe Selection:
- ORB Trading: Use 5m or 15m charts
- Session Review: Use 1H or 4H charts
- Swing Trading: Use 1H or 4H charts
Quality Over Quantity:
- Wait for high-quality alerts (volume + MTF)
- Avoid trading every breakout
- Focus on confluence setups
Risk Management:
- Position size based on range width
- Wider ranges = smaller positions
- Use stop losses always
- Take partial profits at targets
Market Conditions:
- Best results in trending markets
- Reduce position size in choppy conditions
- Consider session overlaps for volatility
- Avoid trading near major news if inexperienced
Continuous Improvement:
- Track win rate by session
- Note which confluence factors work best
- Adjust settings based on market volatility
- Review performance weekly
───────────────────────────────────────
PERFORMANCE OPTIMIZATION
───────────────────────────────────────
This indicator is optimized with:
- max_bars_back declarations for efficient processing
- Conditional calculations based on enabled features
- Proper memory management for drawing objects
- Minimal recalculation on each bar
Best Practices:
- Disable unused features (sessions, MTF, volume)
- Limit historical display to reduce rendering
- Use appropriate timeframe for your strategy
- Clear old drawing objects periodically
───────────────────────────────────────
EDUCATIONAL DISCLAIMER
───────────────────────────────────────
This indicator combines established trading concepts:
- Opening Range Breakout theory (price action)
- Liquidity level detection (pivot analysis)
- Session-based trading (time-of-day patterns)
- Volume analysis (confirmation technique)
- Multi-timeframe analysis (trend alignment)
All calculations use standard technical analysis methods:
- Pivot high/low detection algorithms
- Moving averages for trend and volume
- Session time filtering
- Timeframe security functions
The indicator identifies potential trading setups but does not predict future price movements. Success requires proper application within a complete trading strategy including risk management, position sizing, and market context.
───────────────────────────────────────
USAGE DISCLAIMER
───────────────────────────────────────
This tool is for educational and analytical purposes. Opening Range Breakout trading involves substantial risk. The alert system and quality filters are designed to identify potential setups but do not guarantee profitability. Always conduct independent analysis, use proper risk management, and never risk capital you cannot afford to lose. Past performance does not indicate future results. Trading intraday breakouts requires experience and discipline.
───────────────────────────────────────
CREDITS & ATTRIBUTION
───────────────────────────────────────
ORIGINAL SOURCE:
This indicator builds upon concepts from LuxAlgo's-ORB

Pivot Trend Flow [BigBeluga]🔵 OVERVIEW
Pivot Trend Flow turns raw swing points into a clean, adaptive trend band. It averages recent pivot highs and lows to form two dynamic reference levels; when price crosses above the averaged highs, trend flips bullish and a green band is drawn; when it crosses below the averaged lows, trend flips bearish and a red band is drawn. During an uptrend the script highlights breakouts of previous pivot highs with ▲ labels, and during a downtrend it flags breakdowns of previous pivot lows with ▼ labels—making structure shifts and continuation signals obvious.
🔵 CONCEPTS
Pivot-Based Averages : Recent pivot highs/lows are collected and averaged to create smoothed upper/lower reference levels.
if not na(ph)
phArray.push(ph)
if not na(pl)
plArray.push(pl)
if phArray.size() > avgWindow
upper := phArray.avg()
phArray.shift()
if plArray.size() > avgWindow
lower := plArray.avg()
plArray.shift()
Trend State via Crosses : Close above the averaged-highs ⇒ bullish trend; close below the averaged-lows ⇒ bearish trend.
Trend Band : A colored band (green/red) is plotted and optionally filled to visualize the active regime around price.
Structure Triggers :
In bull mode the tool watches for prior pivot-high breakouts (▲).
In bear mode it watches for prior pivot-low breakdowns (▼).
🔵 FEATURES
Adaptive Trend Detection from averaged pivot highs/lows.
Clear Visuals : Green band in uptrends, red band in downtrends; optional fill for quick read.
Breakout/Breakdown Labels :
▲ marks breaks of previous pivot highs in uptrends
▼ marks breaks of previous pivot lows in downtrends
Minimal Clutter : Uses compact lines and labels that extend only on confirmation.
Customizable Colors & Fill for trend states and band styling.
🔵 HOW TO USE
Pivot Length : Sets how swing points are detected. Smaller = more reactive; larger = smoother.
Avg Window (pivots) : How many recent pivot highs/lows are averaged. Increase to stabilize the band; decrease for agility.
Read the Band :
Green band active ⇒ prioritize longs, pullback buys toward the band.
Red band active ⇒ prioritize shorts, pullback sells toward the band.
Trade the Triggers :
In bull mode, ▲ on a prior pivot-high break can confirm continuation.
In bear mode, ▼ on a prior pivot-low break can confirm continuation.
Combine with Context : Use HTF trend, S/R, or volume for confluence and to filter signals.
Fill Color Toggle : Enable/disable band fill to match your chart style.
🔵 CONCLUSION
Pivot Trend Flow converts swing structure into an actionable, low-lag trend framework. By blending averaged pivots with clean breakout/breakdown labels, it clarifies trend direction, timing, and continuation spots—ideal as a core bias tool or a confirmation layer in any trading system.

Simple Turnover (Enhanced v2)📊 Simple Turnover (Enhanced)
🔹 Overview
The Simple Turnover Indicator calculates a stock’s turnover by combining both price and volume, and then compares it against quarterly highs. This helps traders quickly gauge whether market participation in a move is strong enough to confirm a breakout, or weak and likely to be false.
Unlike volume alone, turnover considers both traded volume and price level, giving a truer reflection of capital flow in/out of a stock.
________________________________________
🔹 Formulae Used
1. Average Price (SMA)
AvgPrice=SMA(Close,n)
2. Average Volume (SMA)
AvgVol=SMA(Volume,n)
3. Turnover (Raw)
Turnover raw=AvgPrice × AvgVol
4. Unit Adjustment
• If Millions → Turnover = Turnover raw × 10^−6
• If Crores → Turnover = Turnover raw × 10^−7
• If Raw → Turnover = Turnover raw
5. Quarterly High Turnover (qHigh)
Within each calendar quarter (Jan–Mar, Apr–Jun, Jul–Sep, Oct–Dec), we track the maximum turnover seen:
qHigh=max (Turnover within current quarter)
________________________________________
🔹 Visualization
• Bars → Color follows price candle:
o Green if Close ≥ Open
o Red if Close < Open
• Blue Line → Rolling Quarterly High Turnover (qHigh)
________________________________________
🔹 Strategy Use Case
The Simple Turnover Indicator is most effective for confirming true vs false breakouts.
• A true breakout should be supported by increasing turnover, showing real capital backing the move.
• A false breakout often occurs with weak or declining turnover, suggesting lack of conviction.
📌 Example Strategy (3H timeframe):
1. Identify a demand zone using your preferred supply-demand indicator.
2. From this demand zone, monitor turnover bars.
3. A potential long entry is validated when:
o The current turnover bar is at least 20% higher than the previous one or two bars.
o Example setting: SMA length = 5 (i.e., turnover = 5-bar average close × 5-bar average volume).
4. This confirms strong participation in the move, increasing probability of a sustained breakout.
________________________________________
🔹 Disclaimer
⚠️ This indicator/strategy does not guarantee 100% accurate results.
It is intended to improve the probability of identifying true breakouts.
The actual success of the strategy will depend on price action, market momentum, and prevailing market conditions.
Always use this as a supporting tool along with broader trading analysis and risk management.
