"breakout" için komut dosyalarını ara


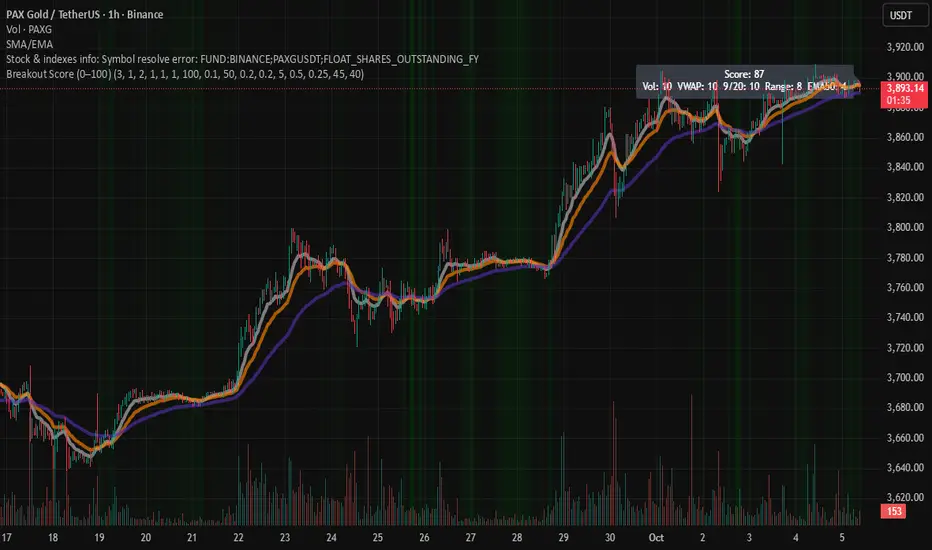
Breakout Score (0–100)Breakouts are often the trader's best setups. Often seen on the chart as wedges and flags, consolidation before a pop up or down. This script attempts to visualize breakout potential with gradients in the background. I built this to place on my side charts to quickly visualize that a setup was forming.
For this indicator, Breakouts have generally been assumed as:
Decrease in average volume over N candles
Proximity to VWAP
Convergence/cross of price to the 9, 20 and 50 EMAs
Range compression (formation of flag or consolidation)
each of these factors are scored and rated. Multiple signals exponentially increase the gradient. Depending on the score, the chart will display a visual gradient behind the chart. Color, opacity and filtering fully customizable.
Enjoy!
Breakout Identifier + Pivots with pos/neg/neu candlesBreakout Identifier is an indicator that displays breakouts which can be used to help a trader buy or sell. This is a volatility-based indicator that has customizable inputs. Each signal is also plotted with a pivot which can help to trade within a range or determine a trap.
To edit the gap between each signals change signal integer, goes by price.
BG colors are also assigned to candles as negative, positive, or neutral which are colored as follows:
Green = high > high of previous candle
Red = low < low of previous candle
Silver = neither of these options

Breakout NinjaBreakout Ninja is a multi-confirmation trend following system that can help traders manage their trades on all chart styles and timeframes. The algorithm uses multiple timeframes to position the user towards higher probability breakouts, creating no-trend zones (marked by yellow candles) where the market appears to be choppy, and providing buy/sell signals (blue candles) when breaking out of a prior structure.
A trend always begins with a breakout of a prior price structure. Breakout Buddy attempts to identify a trend according to the definition, "higher high, higher low," or "lower high, lower low," and tries to keep the trader in the move until that definition is broken (a downtrend ends when price exceeds a prior lower high, and vice versa). Because it is a trend-following algorithm, it must capture large trend winners in order for it to turn a profit over time. It is, of course, best utilized in a trending market condition.
Use the trailing dots as guidance for a stop order exit. It is advised to use the second-closest dot for an emergency trailing stop, and exit when the candle closes yellow (whichever happens first).
Occasionally, price can touch one of the indicator's levels, but fail to close beyond it (rejection). When this occurs, it can provide good risk/reward entries in the direction of the rejection. These candles can show purple and is considered an extra feature for alternative rulesets. This feature can be enabled from settings.
Users can choose between double or triple confirmation for trading signals, toggle buy/sell labels, toggle trade duration shading, define the system parameters, toggle rejection candles, and choose the session time. The indicator will only paint during session hours. Default is 0945-1625 to capture the US cash session while avoiding volatility around the opening range.
Customizable alert scheme for buy/sell, move stop, and price-nearing-breakout warning (possibly useful on higher lookback settings or alternative charting modes) available. Separate alert conditions for buy, sell, close long, and close short also available.
Message us via the link below to gain access.

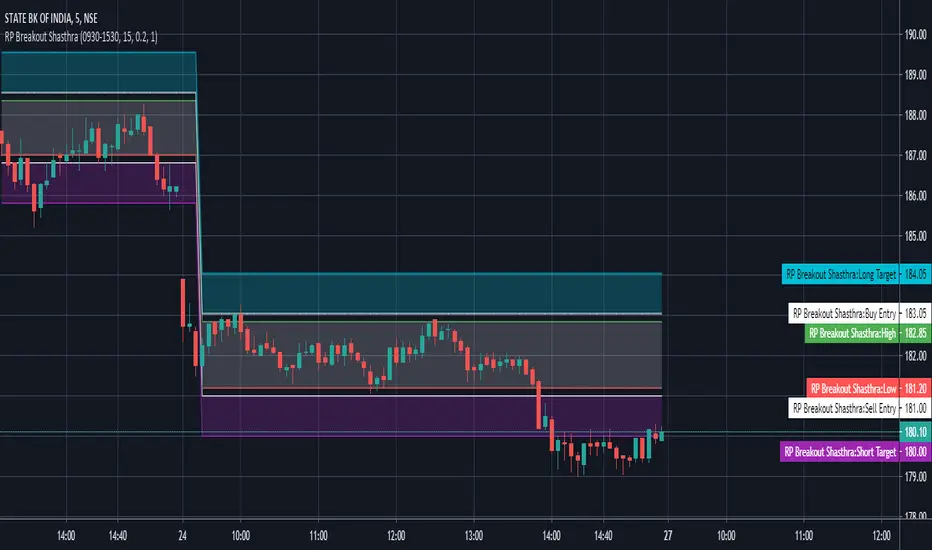
Breakout Shasthra by RPThe RP Breakout Shasthra indicator is designed to show custom breakout levels.
There are many ORB (Opening range breakout) indicators which either take 9:15 as the default start time and the resolution is also fixed.
There are many successful breakouts like 10:15 - 30mins breakout, 12:30 - 1 hour breakouts etc.
So this indicator is designed to deliver you custom options to set the beakout time and duration.
Also there is an option to plot previous breakout lines to backtest.
The options window is simple.
In the INPUT Tab
Show Previous breakout - This option plots the High and Low of the required time-frame for all the previous days. this is useful in back testing or finding unsuitable environments to avoid trade.
Breakout start time - This is set to default sessions. Here you only need to select the start time.
Breakout Timeframe - The duration to consider can be set here.
Example:- If you wanted 11:30 - 15 mins breakout. Change Breakout start time from 9:15 to 11:30
Change Breakout Timeframe from 60 to 15
And hit OK.
In the Styles Tab
You can customize the color / Add labels / Show Shapes (Buy entry / Sell Entry)

Breakout Detector (Previous MTF High Low Levels) [LuxAlgo]The Breakout Detector (Previous MTF High Low Levels) indicator highlights breakouts of previous high/low levels from a higher timeframe.
The indicator is able to: display take-profit/stop-loss levels based on a user selected Win/Loss ratio, detect false breakouts, and display a dashboard with various useful statistics.
Do note that previous high/low levels are subject to backpainting, that is they are drawn retrospectively in their corresponding location. Other elements in the script are not subject to backpainting.
🔶 USAGE
Breakouts occur when the price closes above a previous Higher Timeframe (HTF) High or below a previous HTF Low.
On the advent of a breakout, the closing price acts as an entry level at which a Take Profit (TP) and Stop Loss (SL) are placed. When a TP or SL level is reached, the SL/TP box border is highlighted.
When there is a breakout in the opposite direction of an active breakout, previous breakout levels stop being updated. Not reaching an SL/TP level will result in a partial loss/win,
which will result in the box being highlighted with a dotted border (default). This can also be set as a dashed or solid border.
Detection of False Breakouts (default on) can be helpful to avoid false positives, these can also be indicative of potential trend reversals.
This indicator contains visualization when a new HTF interval begins (thick vertical grey line) and a dashboard for reviewing the breakout results (both defaults enabled; and can be disabled).
As seen in the example above, the active, open breakout is colored green/red.
You can enable the setting ' Cancel TP/SL at the end of HTF ', which will stop updating previous TP/SL levels on the occurrence of a new HTF interval.
🔶 DETAILS
🔹 Principles
Every time a new timeframe period starts, the previous high and low are detected of the higher timeframe. On that bar only there won't be a breakout detection.
A breakout is confirmed when the close price breaks the previous HTF high/low
A breakout in the same direction as the active breakout is ignored.
A breakout in the opposite direction stops previous breakout levels from being updated.
Take Profit/Stop Loss, partially or not, will be highlighted in an easily interpretable manner.
🔹 Set Higher Timeframe
There are 2 options for choosing a higher timeframe:
• Choose a specific higher timeframe (in this example, Weekly higher TF on a 4h chart)
• Choose a multiple of the current timeframe (in this example, 75 minutes TF on a 15 min chart - 15 x 5)
Do mind, that when using this option, non-standard TFs can give less desired timeframe changes.
🔹 Setting Win/Loss Levels
The Stop Loss (SL) / Take Profit (TP) setting has 2 options:
W%:L% : A fixed percentage is chosen, for TP and SL.
W:L : In this case L (Loss-part) is set through Loss Settings , W (Win-part) is calculated by multiplying L , for example W : L = 2 : 1, W will be twice as large as the L .
🔹 Loss Settings
The last drawing at the right is still active (colored green/red)
The Loss part can be:
A multiple of the Average True Range (ATR) of the last 200 bars.
A multiple of the Range Cumulative Mean (RCM).
The Latest Swing (with Length setting)
Range Cumulative Mean is the sum of the Candle Range (high - low) divided by its bar index.
🔹 False Breakouts
A False Breakout is confirmed when the price of the bar immediately after the breakout bar returns above/below the breakout level.
🔹 Dashboard
🔶 ALERTS
This publication provides several alerts
Bullish/Bearish Breakout: A new Breakout.
Bullish/Bearish False Breakout: False Breakout detected, 1 bar after the Breakout.
Bullish/Bearish TP: When the TP/profit level has been reached.
Bullish/Bearish Fail: When the SL/stop-loss level has been reached.
Note that when a new Breakout causes the previous Breakout to stop being updated, only an alert is provided of the new Breakout.
🔶 SETTINGS
🔹 Set Higher Timeframe
Option : HTF/Mult
HTF : When HTF is chosen as Option , set the Higher Timeframe (higher than current TF)
Mult : When Mult is chosen as Option , set the multiple of current TF (for example 3, curr. TF 15min -> 45min)
🔹 Set Win/Loss Level
SL/TP : W:L or W%:L%: Set the Win/Loss Ratio (Take Profit/Stop Loss)
• W : L : Set the Ratio of Win (TP) against Loss (SL) . The L level is set at Loss Settings
• W% : L% : Set a fixed percentage of breakout price as SL/TP
🔹 Loss Settings
When W : L is chosen as SL/TP Option, this sets the Loss part (L)
Base :
• RCM : Range Cumulative Mean
• ATR : Average True Range of last 200 bars
• Last Swing : Last Swing Low when bullish breakout, last Swing High when bearish breakout
Multiple : x times RCM/ATR
Swing Length : Sets the 'left' period ('right' period is always 1)
Colours : colour of TP/SL box and border
Borders : Style border when breakout levels stop being updated, but TP/SL is not reached. (Default dotted dot , other option is dashed dsh or solid sol )
🔹 Extra
Show Timeframe Change : Show a grey vertical line when a new Higher Timeframe interval begins
Detect False Outbreak
Cancel TP/SL at end of HTF
🔹 Show Dashboard
Location: Location of the dashboard (Top Right or Bottom Right/Left)
Size: Text size (Tiny, Small, Normal)
See USAGE/DETAILS for more information

Breakouts with timefilter [LuciTech]Here's the updated description with "colors" replaced by "colours" throughout, maintaining the original structure and content:
Breaking Point 2.0
This is a technical analysis overlay indicator designed to identify breakout levels based on pivot highs and lows, with a focus on price action during customizable time windows using London time (UK). It draws horizontal lines at pivot points and plots signals when price breaks above or below these levels, offering traders a tool to monitor potential bullish or bearish movements. The indicator includes options for time filtering and displaying only the most recent breakout.
Features
The Pivot Breakout Lines display horizontal lines at detected pivot highs (bullish) and pivot lows (bearish), coloured green and red by default. These lines extend from the pivot point to the breakout bar and can be set to show only the latest breakout.
The Breakout Signals mark bullish breakouts with an upward triangle below the bar and bearish breakouts with a downward triangle above the bar, using customizable colours.
The Time Filter restricts signals and lines to a specific window (default: 14:30–15:00 UK), which can be toggled on or off. A shaded background highlights this period when enabled.
How It Works
The indicator calculates pivot highs and lows using a user-defined lookback period (default: 5 bars). When price closes above a pivot high, it triggers a bullish signal and draws a line from the pivot to the breakout bar. When price closes below a pivot low, it triggers a bearish signal with a corresponding line.
If the time filter is active, signals and lines only appear within the specified window. Outside this period—or if the filter is disabled—they appear based solely on price action. The indicator maintains up to three recent pivots in memory, removing older ones as new pivots form.
Alerts are available for both bullish and bearish breakouts, triggered when signals occur.
Settings
Length controls the lookback period for pivot detection (default: 5).
Colours Bull/Bear sets the colours for bullish (default: green) and bearish (default: red) lines and signals.
Show Last Breakout toggles whether only the most recent breakout line and signal are displayed (default: false).
Time Filter enables or disables the time restriction (default: true).
Fill Background toggles a shaded area during the time window (default: true), with a customizable colour.
Time Settings define the start hour/minute and end hour/minute for the filter (default: 14:30–15:00).
Interpretation
The Pivot Breakout Lines highlight levels where price has previously reversed, potentially acting as support or resistance. A breakout above a pivot high may suggest bullish momentum, while a breakout below a pivot low may indicate bearish pressure.
The Breakout Signals provide visual cues for these events, useful for timing entries or exits. When "Show Last Breakout" is enabled, the chart focuses on the most recent signal, reducing clutter.
The Time Filter and background shading help traders concentrate on specific trading sessions, such as high-volatility periods. When disabled, the indicator tracks breakouts across all times.

Breakout Shasthra with buffer and target option by RPThe RP Breakout Shasthra indicator is designed to show custom breakout levels.
There are many ORB (Opening range breakout) indicators which either take 9:15 as the default start time and the resolution is also fixed.
There are many successful breakouts like 10:15 - 30mins breakout, 12:30 - 1 hour breakouts etc.
So this indicator is designed to deliver you custom options to set the beakout time and duration.
Also there is an option to plot previous breakout lines to backtest.
The options window is simple.
In the INPUT Tab
Breakout start time - This is set to default sessions. Here you only need to select the start time.
Breakout Timeframe - The duration to consider can be set here.
Enter Buffer - Set the point above which to take entry. Use Keyboard to enter decimals
Enter Target - Set the point for target to take exit. Use Keyboard to enter decimals
Example:- If you wanted 11:30 - 15 mins breakout. Change Breakout start time from 9:15 to 11:30
Change Breakout Timeframe from 60 to 15
And hit OK.
In the Styles Tab
You can customize the color
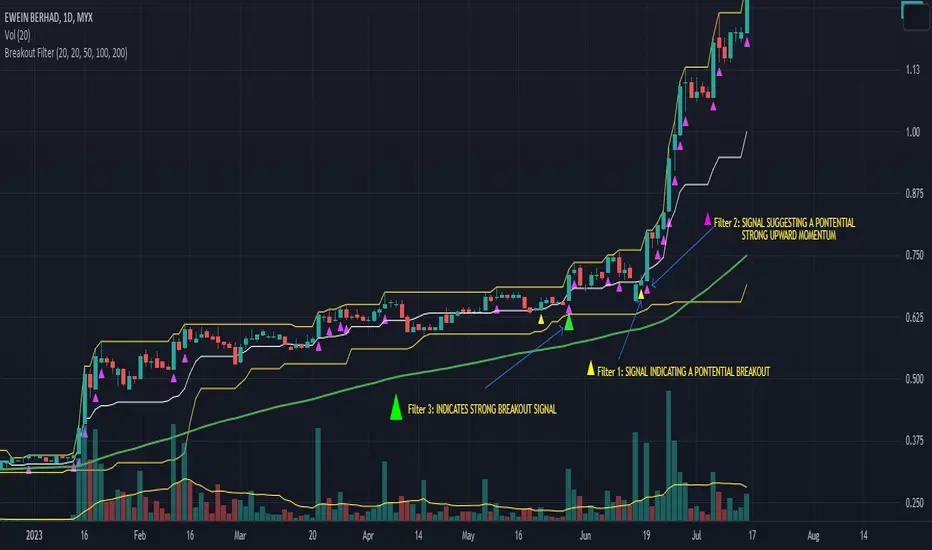
Breakout FilterIntroduction:
The Breakout Filter is a technical analysis indicator designed to identify potential breakout trading opportunities in the financial markets. It combines breakout conditions based on price and volume with the visualization of Exponential Moving Average (EMA) lines. This indicator can be a valuable tool for traders seeking to capture breakout movements while utilizing EMA lines for additional trend analysis.
Indicator Overview:
The Breakout Filter consists of three main filters: Filter 1, Filter 2, and Filter 3. Each filter has its own set of conditions that need to be met for a breakout signal to be generated. Additionally, the indicator plots EMA lines on the chart to provide further insights into the market trend.
Filter 1: Price & Volume Breakout (Default symbol: Tiny Yellow Triangle)
Filter 1 focuses on identifying breakouts based on both price and volume criteria. It considers the following conditions:
- Price Breakout: The close price crosses above the Donchian Channel's middle line, indicating a potential upward breakout.
- Volume Breakout: The trading volume exceeds the moving average of volume, suggesting increased market participation during the breakout.
When both the price breakout and volume breakout conditions are met, Filter 1 generates a signal indicating a potential breakout in the market. This filter helps traders identify significant price movements accompanied by higher trading volumes.
Filter 2: Upper Band Breakout
Filter 2 specifically looks for breakouts above the upper band of the Donchian Channel. This condition suggests a potential strong upward momentum in the market. When the high price exceeds the upper band, Filter 2 generates a signal, indicating a breakout above the recent price range.
Filter 3: Combined Filter 1 and Filter 2
Filter 3 combines the conditions of both Filter 1 and Filter 2. It requires that both Filter 1 and Filter 2 generate signals simultaneously. When this happens, it indicates a strong breakout signal with price and volume confirming the upward momentum.
EMA Lines:
The Breakout Filter with EMA Lines also includes the visualization of Exponential Moving Average (EMA) lines on the chart. EMA is a popular technical indicator used to identify the overall trend in the market. The indicator plots three EMA lines with different periods: EMA1, EMA2, and EMA3. Traders can choose the periods for each EMA line based on their preference and trading strategy.
The EMA lines can provide additional insights into the market trend and potential support or resistance levels. By observing the interaction between the price and the EMA lines, traders can gain a better understanding of the prevailing market sentiment and make informed trading decisions.
How to screen these filters using Trading View Screener
Insert column "DONCHIAN20 UP" and set to "EQUAL HIGH"
Conclusion:
The Breakout Filter with EMA Lines is a comprehensive indicator that combines breakout conditions based on price and volume with the visualization of EMA lines. It helps traders identify potential breakout trading opportunities while providing insights into the market trend. By using this indicator, traders can enhance their trading strategies and potentially improve their trading outcomes.
Please note that this write-up is for informational purposes only and should not be considered as financial advice. Traders should conduct their own analysis and exercise caution when making trading decisions.
Breakout FinderHelo All,
I got many requests for a Breakout script and here it's. This script searches the breakouts/breakdowns and draw square if there is one.
The options:
"Period" is used to find Pivot Points
"Max Breakout Length" is the maximum length to search breakouts
"Threshold Rate %" is channel width of the breakout area. calculated using highest/lowest of last 300 bars.
"Minimum Number of Tests" is the minimum number of tests that the Price tried to break the S/R level
and some options for coloring and linestyle
Lets see some examples:
in this example "Minimum Number of Tests" is 2 so the Price must have tested to break resistance area 2 times and then it breaks it as seen in the screenshot:
in following example Threshold rate is %10, so the channel width is very big:
as you can see in followinf screenshot you can choose different colors and line styles:
Alerts added ;)
Enjoy!

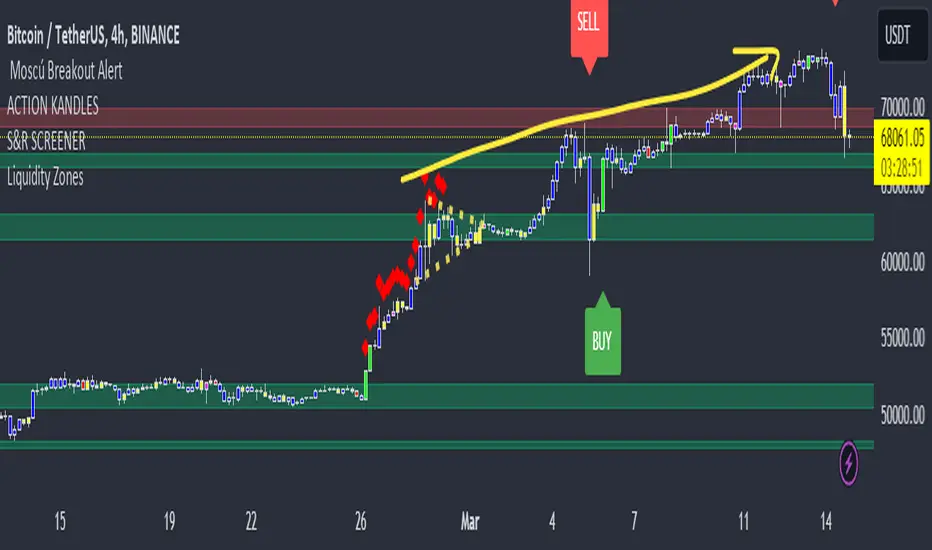
Moscú Breakout Alert Breakout trading is used by active investors to take a position within a trend's early stages. Generally speaking, this strategy can be the starting point for major price moves, expansions in volatility and, when managed properly, can offer limited downside risk. If you can master the art of going for Breakout you can often come across explosive trades that win quickly!
With our indicator "Moscú Breakout Alert", you can receive a buy/sell signal which would indicate that you have reached an area with a high probability of breakout.
We always recommend that you use the cue script in your preferred time frame and in favor of the main trend.
If you want to access the script please leave us a private message we will be contacting you as soon as possible!
Breakout Patterns Detector: Triangle & Wedge [Splirus]This indicator identifies Breakout Patterns such as Ascending Triangles , Descending Triangles , Symmetric Triangles , Ascending Wedges , and Descending Wedges , using candlestick charts and Trendlines. It provides visual cues, stop-loss (SL), and take-profit (TP) levels, alongside a detailed dashboard to evaluate performance. The indicator supports two alert modes: Manual Mode for trader notifications and Bot Mode for automated trading signals.
To achieve optimal results, users are encouraged to experiment with indicator parameters and analyze the dashboard summary to find the perfect configuration for each timeframe, pair, and market condition.
Pattern Identification
The indicator detects the following breakout patterns based on pivot highs and lows:
Ascending Triangle : Flat upper trendline, rising lower trendline.
Descending Triangle : Flat lower trendline, declining upper trendline.
Symmetric Triangle : Converging trendlines with similar slopes (within a user-defined threshold).
Ascending Wedge : Both trendlines slope upward, converging.
Descending Wedge : Both trendlines slope downward, converging.
Patterns are identified using configurable left and right bars for small and big patterns, with slope thresholds normalized by ATR. A trend confirmation filter ensures breakouts align with market direction, and users can adjust breakout confirmation bars to validate signals.
The goal is to fine-tune these settings to suit specific timeframes and pairs, as each combination may require a unique setup for optimal performance.
Stop-Loss Calculation
Stop-loss levels are calculated dynamically based on pattern type and breakout direction:
Symmetric Triangle : SL is set at the first pivot of the opposite trendline, adjusted by a buffer percentage.
Ascending/Descending Triangle : SL is placed at the breakout trendline’s price, plus the buffer.
Ascending/Descending Wedge : SL is set at the second pivot of the opposite trendline, adjusted by the buffer.
The indicator calculates leverage based on a user-defined risk tolerance percentage. Users should adjust the SL buffer and risk tolerance to balance risk and reward, monitoring the dashboard to assess how these settings impact performance across different timeframes and pairs.
Take-Profit Calculation
Three take-profit levels ( TP1 , TP2 , TP3 ) are calculated using pattern height and user-defined multipliers:
For Ascending/Descending Triangles, height is the difference between the max and min prices within the pattern.
For Symmetric Triangles and Wedges, height is the vertical distance between trendlines at the pattern’s start.
TP levels are set as:
TP1 = Breakout price ± (Height × TP1 Multiplier).
TP2 = Breakout price ± (Height × TP2 Multiplier).
TP3 = Breakout price ± (Height × TP3 Multiplier, with a 1.5x adjustment for Wedges).
Experiment with TP multipliers to optimize the risk-reward ratio, using the dashboard to evaluate TP hit rates and overall profitability for each configuration.
Symmetric Triangle:
Ascending/Descending Wedge:
Ascending/Descending Triangles:
Finding the Perfect Configuration
The indicator’s dashboard provides a comprehensive summary of performance metrics, including total trades, TP1/TP2/TP3 hits, SL hits, profit/loss percentages, and win rates for bullish, bearish, and combined trades. These metrics are crucial for identifying the ideal parameter settings:
Timeframe and Pair Variability : Each timeframe (e.g., 15m, 30min, 1H, 4H, Daily) and pair (e.g., BTC/USD, EUR/USD) behaves differently. Adjust parameters like left/right bars, minimum pattern length, and breakout confirmation bars to match the volatility and trend characteristics of the chosen pair and timeframe.
Parameter Tuning : Modify slope thresholds, trend confirmation filters, and bars inside the pattern to filter out false breakouts. For example, a higher breakout confirmation bar setting may reduce signals but increase reliability on longer timeframes.
Dashboard Analysis : Focus on the dashboard’s win rate, profit/loss ratio, and TP/SL hit frequencies. A “Perfect” win rate (>66%) or high TP hit rate indicates a strong configuration. If the SL hit rate is high, consider tightening the trend confirmation filter or increasing the SL buffer.
Iterative Testing : Test different combinations of settings (e.g., small vs. big patterns, aggressive vs. conservative breakout confirmation) and compare dashboard results over time. The goal is to find a balance where the indicator consistently delivers high win rates and profitability for your specific trading setup.
Alert Modes
The indicator supports two alert modes to suit different trading styles:
Manual Mode : Generates alerts for breakouts with entry price, SL, TP1/TP2/TP3, and leverage, tailored for Crypto or Forex markets. Use this mode to manually evaluate signals while refining configurations.
Bot Mode : Sends automated trading signals. To avoid conflicts, Bot Mode ensures no short position alert is triggered while a long position is active, and vice versa. This mode is ideal once you’ve identified an optimal configuration via the dashboard.
Additional Features
Historical Patterns : Displays past trendlines with customizable transparency and extension, helping users analyze how patterns performed under different settings.
Customizable Settings : Adjust pattern size, breakout confirmation, trend filters, and visual preferences (colors, dashboard location) to match your trading style.
Market Compatibility : Supports Crypto and Forex markets across all timeframes, but requires careful tuning for each market type.
Usage Notes
Start with default settings and monitor the dashboard to establish a baseline performance for your chosen timeframe and pair.
Gradually adjust one parameter at a time (e.g., left/right bars, TP multipliers) and compare dashboard results to identify improvements.
Use historical pattern analysis to understand how past breakouts performed under different configurations, guiding your optimization process.
Once a high win rate and profitability are achieved, consider automating trades with Bot Mode for consistent execution.
Disclaimer
This indicator is intended for educational purposes only and should not be considered financial advice. Trading involves significant risk, and past performance is not indicative of future results. Users are strongly advised to thoroughly test and validate the indicator’s signals in a demo environment before using it in live trading. The author is not responsible for any financial losses incurred while using this indicator. Always conduct your own research and consult with a qualified financial advisor before making trading decisions.

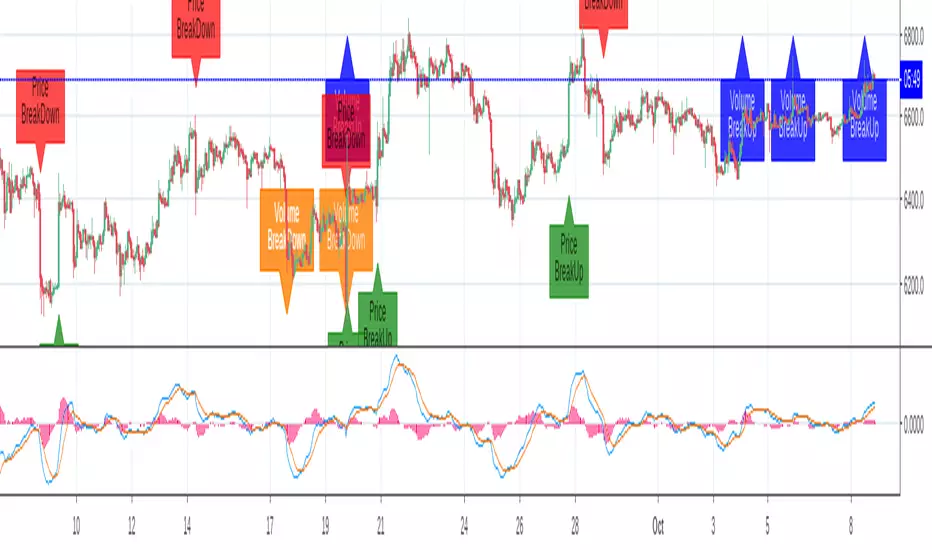
Breakout Labels and Alert For Price And VolumeThe indicator is developped for bitcoin and other cryptocurrencies, whose price and volume changes heavily within minutes. For the other Asset Classes, you may need to adjust the parameters.
Benefits:
1. Since a breakout of price or volume often means the start of a trend, this indicator alerts and displays a label when there is a breakout in price or volume.
2. The indicator prints labels on the chart, which helps people to study the relationship between a breakout and the trend.
3. The volume change is compared to a SMA of volume, instead of the last bar, which can reflect the change compared to a certain period.
4. You can set an alert for breakouts of both price and volume, instead of do it two times.
Settings:
SMA Length for volume: is the length to calculator volume SMA, default:108.
Toggle on/off to display or hide labels for price or volume breakout.
Customize the alert threshhold for price or volume breakout in different time period:3m,5m,15m,30m,60m and other
Use percentageGapForSlopeshape to adjust the relative position of labels.
Style - color settings: Orange for Volume Down, Blue for Volume Up, Red for Price Down, Green for Price Up.
Breakout Boxes [ChartPrime]⯁ OVERVIEW
The Breakout Boxes indicator identifies key structural levels by detecting and aligning two consecutive pivots — forming confirmation zones where potential breakouts are most likely to occur. Once two pivots align within a defined ATR range, the indicator constructs a Breakout Box around that area, tracking volume distribution and breakout strength. When price breaks above or below these boxes, breakout labels (⯁ BreakUp / BreakDn) are displayed to confirm trend continuation.
⯁ KEY FEATURES
Pivot-Based Detection: Uses a customizable pivot length to identify market swing highs and lows.
Two-Pivot Alignment Logic: A breakout box is only created when two pivot highs or lows form near the same level, confirming structural alignment and increasing breakout reliability.
Dynamic Box Generation: Builds upper and lower boxes once pivot alignment is confirmed, adapting automatically to new structures.
Volume Distribution Analysis: Each box measures total traded volume and separates it into bullish and bearish components, showing buy/sell percentages inside the range.
The volume data is calculated in real time as long as the box remains active and unbroken, allowing traders to monitor live accumulation or distribution before a breakout occurs.
Breakout Confirmation Signals: Labels appear when price decisively breaks above the upper box (⯁ BreakUp) or below the lower one (⯁ BreakDn).
Adaptive ATR Scaling: Box size dynamically adjusts to volatility, maintaining consistent proportions across assets and timeframes.
Color-Coded Visualization: Upper (bearish) boxes use pink tones; lower (bullish) boxes use green, both with transparent fill for volume clarity.
Automatic Box Resetting: Previous boxes close when a new pivot pair forms, ensuring only the most relevant structure is active.
⯁ USAGE
Watch for Two Pivot Alignments — the indicator only activates when structural confluence exists, reducing false breakout signals.
Upper Boxes represent resistance formed by two aligned swing highs; a breakout above indicates potential bullish continuation.
Lower Boxes represent support formed by two aligned swing lows; a breakdown below indicates bearish continuation.
Analyze the Volume Ratio inside each box — higher buy volume in upper boxes supports bullish breakouts, while higher sell volume in lower boxes supports bearish moves.
Use this tool alongside trend indicators or higher timeframe context to confirm the direction of breakouts.
⯁ CONCLUSION
The Breakout Boxes indicator refines breakout analysis by requiring two aligned pivots to validate structural zones. By combining pivot confluence with volume distribution and adaptive ATR scaling, it provides a precise, data-backed visualization of breakout strength and direction — a powerful tool for structure-based trading confirmation.

Breakout Statistic - Break MasterBreakMaster by Merlin
Description:
BreakMaster 📈🔥 empowers you to track market momentum by analyzing breakout patterns! 🚀 This indicator detects when the price breaks above the previous candle’s high or below its low and calculates how often these breakouts result in bullish or bearish closes. 📊 Results are displayed in a sleek, easy-to-read table, helping you make informed trading decisions! 💡
How It Works (Super Simple! 😎):
1.Breakout Detection 🔎: Checks if the price breaks the high or low of the previous candle.
2.Close Analysis 🟢🔴: Determines if the breakout candle closes bullish (close > open) or bearish (close < open).
3.Statistics Calculation 📉: Counts the breakouts and calculates the percentage of bullish/bearish closes.
4.Visual Display 🖼️: Presents all data in a stylish table at the top-right of your chart, with customizable dark or light mode! 🌙☀️
Why BreakMaster? 🌟
Simple & Clear ✅: No complex formulas—just breakouts and closing stats.
Customizable 🎨: Choose dark or light mode to match your style.
Decision-Friendly 💸: See the reliability of breakouts with percentages to boost your strategy!
How to Use:
Add BreakMaster to your TradingView chart.
Select your preferred theme (Dark/Light).
Watch the table for real-time breakout stats! 📈
Happy trading with BreakMaster! 🚀💪

Breakout PRO (B:Pro) v3.0Breakout PRO (B:Pro) v3.0 is a multi-filter breakout and trend suite designed for discretionary trading on any symbol and timeframe. It combines a custom EMA cloud, volatility and momentum filters, higher-timeframe trend, and quality scoring into one tool, instead of using multiple separate indicators.
Core concept
The script builds a three-layer EMA cloud around price. The relative position of fast, mid, and slow EMAs plus an ATR padding defines:
Bull regime: stacked EMAs with cloud acting as dynamic support
Bear regime: stacked EMAs with cloud acting as dynamic resistance
Neutral regime: mixed EMAs, cloud fades to neutral color
This cloud defines the main trend and the breakout levels (cloud upper / cloud lower).
A higher-timeframe 200 EMA (configurable timeframe) adds a long-term bias filter.
Support, resistance and structure
Last confirmed swing high and swing low are detected with pivot logic and plotted as dotted support / resistance lines.
These levels are invalidated with a small ATR buffer when price clearly breaks them.
Optional long-term EMA targets (T1 and T2, default 233 and 377) are plotted on the price scale as potential mean-reversion or trend-continuation targets.
Filters used in entries
Long and short breakout signals are only shown when multiple conditions agree. You can enable or disable each filter:
Volume: current volume vs volume SMA
MACD: direction and histogram momentum
RSI: classic OB/OS, with sentiment-adjusted levels
Stoch RSI: direction of K vs D in valid zones
Bollinger Bands + Keltner Channel: squeeze and BB breakouts
VWAP: price relative to VWAP
ADX: trend strength threshold
OBV and Ichimoku: optional extra trend confirmation
A separate Market Sentiment input (Standard, Bullish, Bearish, Consolidation) shifts RSI zones, ADX threshold, and volume requirements so the same logic adapts to different environments.
Signals and exits
The main entry logic:
Long signal: bull EMA stack, breakout above the last pivot resistance and above the upper cloud, plus all enabled long filters are satisfied.
Short signal: mirror conditions below support and below the lower cloud.
Trade state is tracked inside the script:
ATR-based stop level is set on entry using mode-dependent ATR multipliers.
Optional maximum trade duration (different for Short, Mid and Long modes).
Exit markers are plotted when stops are hit, the cloud / EMA stack flips against the trade, MACD or RSI contradict the position, or the time limit is exceeded.
Additional icons mark:
Strong breakouts / breakdowns with large ATR and volume
Squeeze releases after a volatility contraction
EMA cross signals
Continuation and potential reversal zones inside the cloud
Optional RSI divergence arrows based on a separate RSI tuned per trade mode.
Quality and safety scoring
For every entry the script computes:
Safety score (1–3): based mainly on volume, ADX trend strength, and alignment with the cloud regime.
Quality score (1–3): based on BB breakout, MACD and RSI agreement, and whether the signal matches the selected market sentiment.
You can:
Show small S/Q labels next to the entry signal
Use the fixed panel in the bottom-left corner to view the last 5 trade events (opens, closes, crosses) with their S and Q values.
Inputs and layout options
Key inputs:
Trade Mode: Short (e.g. 30 min), Mid (e.g. 4h), Long (e.g. 1D+). Adjusts EMA lengths, ATR settings and the RSI length used for divergences.
Market Sentiment: adjusts filters as described above.
Per-filter toggles for volume, MACD, RSI, Stoch RSI, BB, Ichimoku, ADX, OBV, VWAP, HTF levels.
Panel size: Desktop, Phone, or None for the signal history table.
Side labels: Desktop (full text labels on the price scale) or Phone (compact labels without text) for better compatibility on small screens.
Usage notes
This is a technical analysis tool, not a trading system or financial advice. Signals are calculated on closed data without intentional look-ahead, but values on the current forming bar can still change until the bar closes. Use the script as a structured framework for trend, breakout and confluence analysis, and always confirm signals with your own risk management and testing.

Breakout & Trend & Scalping (Zeiierman)█ Overview
Breakout & Trend & Scalping (Zeiierman) transforms time, volume, and trend behavior into a unified visual framework for identifying market expansion, compression, and breakout phases. Instead of viewing price as an isolated movement, the indicator reinterprets it as a continuous relationship between time-driven flow, volume displacement, and trend momentum.
The system constructs a hybrid analytical field using OBV-based flow modeling, time–trend alignment, and adaptive candle smoothing, providing a clear and fluid representation of both breakout probability and structural trend strength.
This advanced framework adapts to different market contexts, including intraday scalping, swing-trend validation, and multi-timeframe continuation analysis, revealing how volume and trend energy accumulate before volatility expansion.
⚪ Why This One Is Unique
Unlike conventional breakout or trend indicators that rely solely on price or volatility, this tool integrates time-weighted OBV mechanics, multi-timeframe trend correlation, and volatility-normalized candle transformation.
Its design leverages an adaptive Time–Trend Integration Engine that adjusts dynamically based on the selected timeframe and method. The result is a fluid, self-normalizing view of market rhythm, capturing not only the visible structure of trends but also the hidden buildup of momentum that precedes breakouts.
█ Main Feature: BTS Adaptive Candle System
The BTS Adaptive Candle System unifies time-based and trend-based flow analysis into a single visual model of market behavior. It synchronizes short-term momentum with long-term trend equilibrium, revealing how volume and directional energy evolve across different temporal structures.
The flow is inherently adaptive. During stable phases, it compresses volatility to emphasize directional persistence and trend continuity. When acceleration builds, it expands to highlight breakout potential and the ignition of new momentum.
Green-to-red and (red-to-green) transitions indicate shifts in order-flow dominance, while color intensity reflects the relative strength of participation. The built-in smoothing system filters out random noise while maintaining fast response to emerging direction, making the BTS Candle System equally effective for scalping precision, breakout confirmation, and long-term trend tracking.
█ How to Use
⚪ Trend Trading
Bullish trends appear when candles remain near the top of their range with bright, steady coloration. This structure shows sustained accumulation and consistent trend support. Fading color or mixed tones suggest short pauses or shallow pullbacks within an ongoing uptrend.
Bearish trends form when candles cluster near the lower range and deepen in red intensity, reflecting growing selling pressure. Consistent red sequences mark continued distribution, while lighter tones or brief color shifts often precede corrective bounces within a broader downtrend.
⚪ Trend Change Trading
When a large BTS candle crosses the midline, it often marks a decisive shift in market control. A strong candle breaking above the midline reflects dominant buying flow and the early phase of bullish momentum, often signaling the start of a new upward trend.
Conversely, when a large candle drops below the midline, it shows dominant selling pressure and the potential beginning of a downward cycle.
These midline transitions represent key moments where institutional flow changes direction. A rapid color shift or fading saturation in candles around these areas frequently precedes a trend reversal or volatility breakout, making them powerful confirmation points for both breakout and trend-change strategies.
⚪ Retracement/Pullback Trading
When BTS candles remain green or turn light yellow near the midline, it indicates balanced momentum as price consolidates during a temporary retracement. A renewed shift back to bright green candles from this area often signals the end of the pullback and the continuation of the uptrend.
In a downtrend, when BTS candles shift to light yellow or fade toward the midline, it shows a temporary slowdown in selling pressure as the price retraces upward. A return to deep red candles after this brief balance phase confirms renewed selling momentum and continuation of the prevailing downtrend.
⚪ Breakout Trading
Big candles in the BTS indicate a shift in control. If this occurs around a resistance level, there is a high chance that price will break out upward.
Similarly, if a large downward BTS candle appears near a support level, there is a high chance that a bearish breakout will follow through.
█ How It Works
⚪ Integrated Market Framework
The BTS system merges time, trend, and volatility behavior into a single adaptive flow field. It constantly balances fast and slow market components, maintaining a smooth equilibrium between short-term reactions and long-term structure.
Calculation: Uses normalized scaling and adaptive synchronization to align directional momentum across changing market states.
⚪ Core Trend Engine
At its center, the model interprets how price movement evolves within its volatility range. It tracks shifts in directional energy and transforms them into a stable momentum surface that highlights both trend continuation and turning points.
Calculation: Applies equilibrium-based mapping to sustain consistent directional flow even during market acceleration or compression.
⚪ Volatility Envelope System
The indicator forms a dynamic envelope around price movement, expanding and contracting with the current market speed. These zones reflect where energy concentrates or fades, helping visualize breakout potential and exhaustion levels.
Calculation: Adapts envelope boundaries through volatility-responsive scaling and balanced symmetry control.
⚪ Adaptive Time Modes
Two adaptive modes — Time and Trend — control how the model responds to changing conditions. The system automatically adjusts its responsiveness, allowing it to behave as a fast scalping model or a slow trend tracker without losing structural balance.
Calculation: Dynamically modifies its internal scaling to maintain equilibrium between speed and smoothness across selected timeframes.
-----------------
Disclaimer
The content provided in my scripts, indicators, ideas, algorithms, and systems is for educational and informational purposes only. It does not constitute financial advice, investment recommendations, or a solicitation to buy or sell any financial instruments. I will not accept liability for any loss or damage, including without limitation any loss of profit, which may arise directly or indirectly from the use of or reliance on such information.
All investments involve risk, and the past performance of a security, industry, sector, market, financial product, trading strategy, backtest, or individual's trading does not guarantee future results or returns. Investors are fully responsible for any investment decisions they make. Such decisions should be based solely on an evaluation of their financial circumstances, investment objectives, risk tolerance, and liquidity needs.
Ücretli komut dosyası

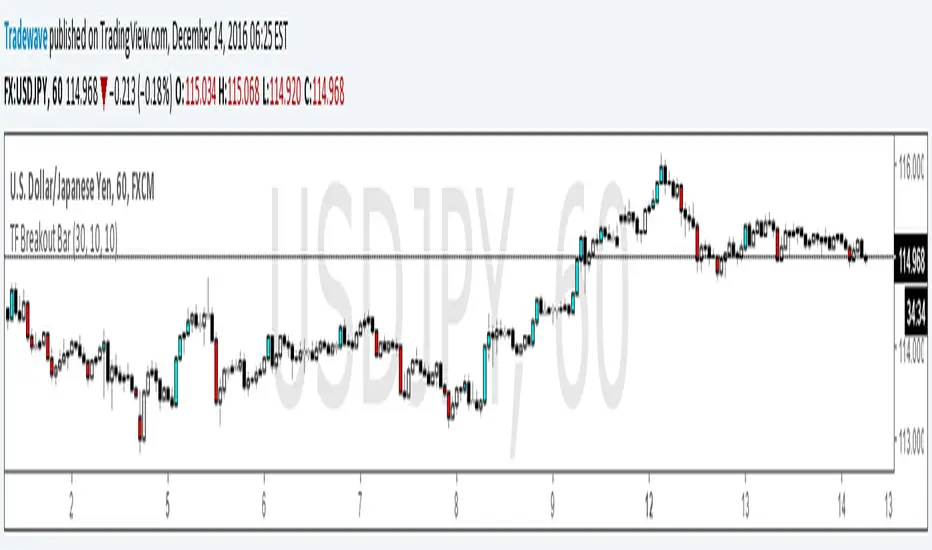
TF Breakout BarIndicator Name: TF Breakout Bar
Creator: Andrew Palladino
Date: 12/14/2016
The TF Breakout Bar allows the user to check for a breakout or a breakdown on a specific time frame regardless of what time frame resolution the current chart is on.
The user can change the following:
Breakout and Breakdown time frame
Lookback bar period for breakouts
Lookback bar period for breakdowns
Breakout and Retest Signals [AlgoAlpha]OVERVIEW
This script detects breakout and retest signals by identifying key pivot points in price action and analyzing their relationship with historical swing highs and lows. It highlights breakout structures using ATR-based tolerance levels and volume analysis to confirm potential trend continuations or reversals. The script marks significant price levels with dynamic boxes and dashed lines to help traders visualize breakout and retest areas effectively.
CONCEPTS
The script relies on pivot point analysis, a technique used to identify significant price levels where the market has previously reversed. It dynamically tracks a set number of recent swing highs and lows, allowing traders to see if the price is revisiting a previously significant level. The concept of breakouts and retests is widely used in technical analysis to determine potential entry points. A breakout occurs when the price moves beyond a resistance or support level, and a retest happens when the price returns to test that level before continuing in the breakout direction. This script enhances that analysis by incorporating ATR-based tolerance levels, ensuring that price zones are not too large.
FEATURES
Breakout and Retest Markings : Highlights breakout and retest areas with shaded boxes, allowing traders to visualize where price action is confirming key levels.
Volume Delta and Ratio : Analyzes volume at breakout levels to gauge the strength of the move, displaying volume delta information for additional context. The script also displays the ratio of selling to buying at the retest along traders to make better judgement on their entries.
Multi-Timeframe Adaptability : Dynamically adjusts volume analysis to align with the appropriate lower timeframe, ensuring reliable volume comparisons.
Alerts for Breakout and Retest Events : Traders can receive real-time notifications when bullish or bearish breakout retests are detected.
USAGE
This script is best suited for traders looking to identify strong breakout and retest setups across different timeframes. Users can customize the pivot detection period and swing point memory to adjust sensitivity based on their trading style. The ATR length and multiplier allow further refinement of breakout tolerance, reducing noise in volatile markets. The breakout zones are displayed as shaded boxes, where traders can assess whether a price retest is occurring under favorable conditions. Alerts can be set to notify traders of potential trade opportunities.

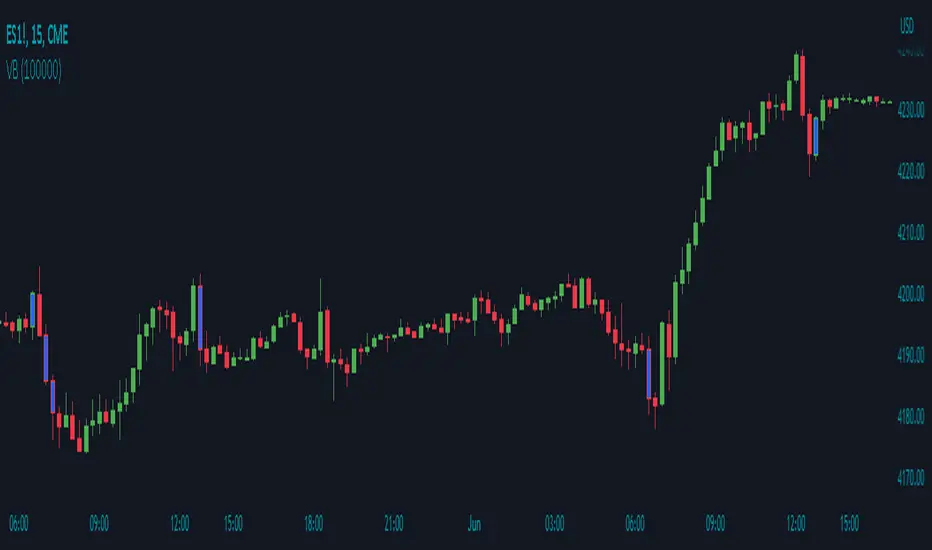
Volume Breakout by Chosen VolumeDescription:
The Volume Breakout indicator (VB) is a technical analysis tool that highlights candles with significant trading volume. It helps traders identify potential breakout periods characterized by high volume activity.
How it Works:
The Volume Breakout indicator compares the volume of each candle with a user-defined minimum volume threshold. If the volume of a candle exceeds or is equal to the specified minimum volume requirement, the indicator identifies it as a volume breakout and marks it accordingly.
Usage:
To effectively utilize the Volume Breakout indicator, follow these steps:
1. Apply the VB indicator to your chart by adding it from the available indicators.
2. Customize the minimum required volume parameter according to your trading preferences. This parameter determines the threshold volume level that a candle must meet or exceed to be considered a breakout candidate.
3. Observe the candles on the chart:
- Candles that meet or exceed the minimum required volume are highlighted with a specific color (yellow by default), indicating potential breakout periods.
4. Pay attention to the volume breakout indications within the candles, as they suggest periods of increased trading activity.
5. Analyze the price action accompanying the volume breakout candles. Breakouts often indicate a surge in buying or selling pressure, potentially leading to significant price moves or trend reversals.
6. Combine the analysis of volume breakout candles with other technical analysis tools, such as trend lines, support and resistance levels, or indicators, to confirm potential trade setups.
7. Implement appropriate risk management strategies, including setting stop-loss orders and position sizing, to manage your trades effectively and protect your capital.
Breakouts with Tests & Retests [LuxAlgo]The Breakouts Tests & Retests indicator highlights tests and retests of levels constructed from detected swing points. A swing area of interest switches colors when a breakout occurs.
Users can control the sensitivity of the swing point detection and the width of the swing areas.
🔶 USAGE
When a Swing point is detected, an area of interest is drawn, colored green for a bullish swing and red when bearish.
A test is confirmed when the opening price is situated in the area of interest, and the closing price is above or below the area, depending on whether it is a bullish or bearish swing. Tests are highlighted with a solid-colored triangle.
A breakout is confirmed when the price closes in the opposite position, below or above the area, in which case the area will switch colors.
If the opening price is located within the area and the closing price closes outside the area, in the same direction as the breakout, this is considered a retest . Retests are highlighted with a hollow-colored triangle.
Note that tests/retests do not act on wicks. The main factor is that the opening price is in the area of interest, while the closing price is outside.
🔹 Area Of Interest Width
The user can adjust the width of the swing areas. Changing the " Width " is a fast and easy way to find different areas of interest.
A higher "Multiple" setting would return a wider area, allowing price to develop within it for a longer period of time and potentially provide later test signals.
When a swing area is broken, a higher "Width" setting can make it more complicated for the price to break it again, allowing a swing area to remain valid for a longer period of time thus potentially providing more retest signals.
🔶 DETAILS
Generally, only one bullish/bearish pattern can be active at a time. This means that no more than 1 bullish or bearish area will be active.
The " Display " settings, however, can help control how areas of different types are displayed.
Bullish AND Bearish: Both, bullish and bearish patterns can be drawn at the same time
Bullish OR Bearish: Only 1 bullish or 1 bearish pattern is drawn at a time
Bullish: Only bullish patterns
Bearish: Only bearish patterns
🔹 Test/Retest Labels
The user can adjust the settings so only the latest test/retest label is shown or set a minimum number of bars until the next test/retest can be drawn.
🔹 Maximum Bars
Users can set a limit of bars for when there is no test/retest in that period; the area of interest won't be updated anymore and will be available and ready for the next Swing.
An option for pulling the area back to the last retest is included.
🔶 SETTINGS
Display: Determines which swing areas are displayed by the indicator. See the "DETAILS" section for more information
Multiple: Adjusts the width of the areas of interest
Maximum Bars: Limit of bars for when there is no test/retest
Display Test/Retest Labels: Show all labels or just the last test/retest label associated with a swing area
Minimum Bars: Minimum bars required for a subsequent test/retest label are allowed to be displayed
Set Back To Last Retest: When after "Maximum Bars" no test/retest is found, place the right side of the area at the last test/retest
🔹 Swings
Left: x amount of wicks on the left of a potential Swing need to be higher/lower for a Swing to be confirmed.
Right: The number of wicks on the right of a potential swing needs to be higher/lower for a Swing to be confirmed.
🔹 Style
Bullish: color for test period (before a breakout) / retest period (after a breakout)
Bearish: color for test period (before a breakout) / retest period (after a breakout)
Label Size

Breakout/Consolidation Filter [jwammo12]This indicator acts as a filter for determining recent breakouts and consolidations in price.
The first way to use the indicator is with a short lookback period. It then will paint yellow most of the time, with red marking a sharp recent breakdown in price and green marking a sharp breakout in price. This can be used to follow the breakout, or to fade it.
The second way to use the indicator is a long lookback period. This will change the output to be colored most of the time, with small sections of yellow. The yellow indicators areas where price has not made a large move in a while, or periods of consolidation. This can then be used to plan reversal trades, or follows any new trend.
The blue line is a Average True Range Percent Rank, when this value is high, it means that breakouts are less likely to trigger, since price has been moving rapidly recently, and a relative breakout would have to be a large move. When the line is low, breakouts will trigger more easily, since price has been moving relatively slowly
