DoremonAutomate trading using Tradingview. Build trading bots for bitcoin, altcoins, forex, stocks and more...
Doremon loading.....
"bot" için komut dosyalarını ara

69Air69Air Indicator Automate trading using Tradingview. Build trading bots for bitcoin, altcoins, forex, stocks and more...

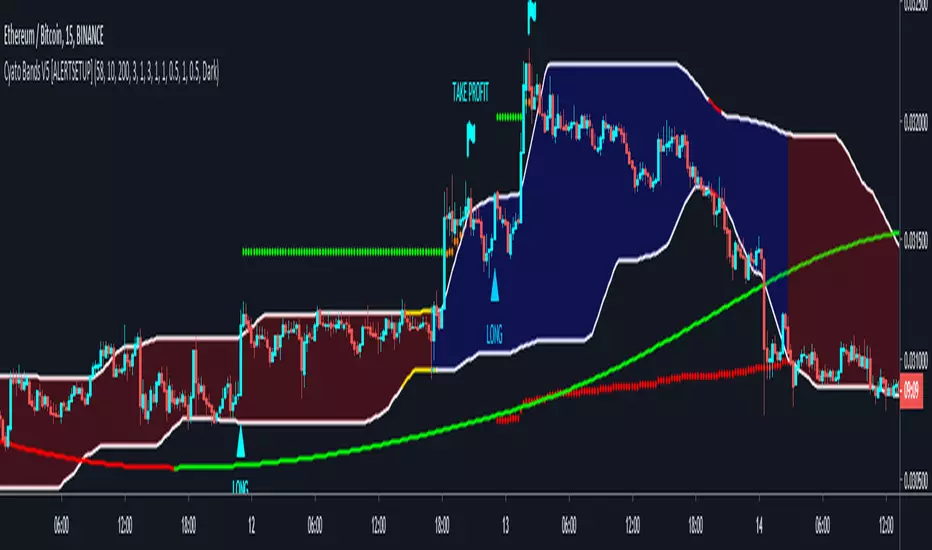
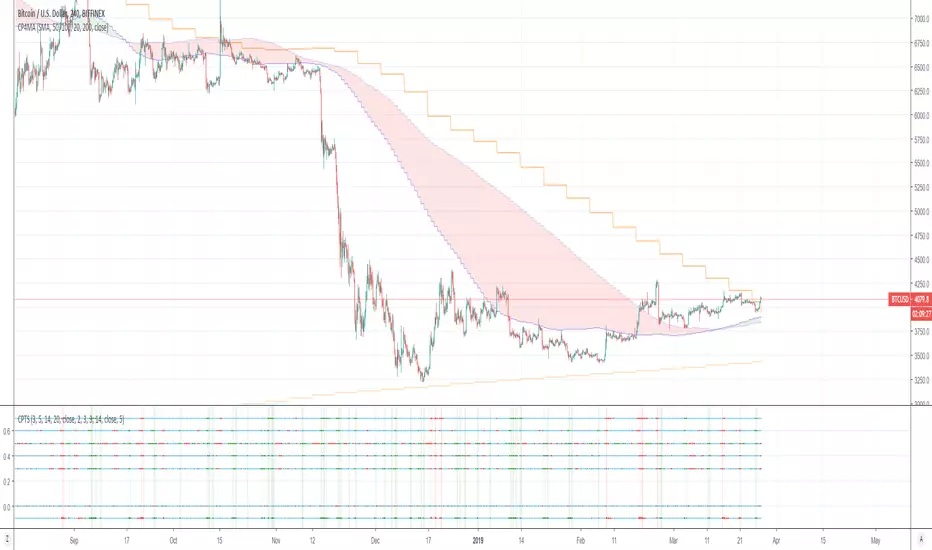
Cyatophilum Bands Pro Trader V5 [ALERTSETUP]Alert Setup version
Get the Free Backtest version here :
This version includes a new feature.
Trailing Take Profit with % deviation.
For those seeing the indicator for the first time, it works like Donchian Channels with lag and a channel width condition to detect breakouts. On top of that I integrated a Stop Loss and Take Profit system to pinescript.
Backtest results below are calculated with :
Short + Long Strategy
0.05% Commission
100% of 10 000% equity per trade
Strategy data from 25/04/2019 to 18/05/2019
Default Configuration for BITFINEX:ETHBTC 3 minutes timeframe.
This version also has the Stop Loss / Take Profit system included in the previous version, plus a short / long setup distinction. For example you can choose a different stop loss % for long and for short trades.
Previous version:
Get access to the Alert Setup version and automate the strategy today !
Purchase the Cyatophilum Indicators pack
I will publish backtests and configurations so make sure to follow me if you don't want to miss anything !
My Website - blockchainfiesta.com -
My Discord channel - discord.gg -
69Plus69Plus Indicator by Marsu Pilami
Automate trading using Tradingview. Build trading bots for bitcoin, altcoins, forex, stocks and more...

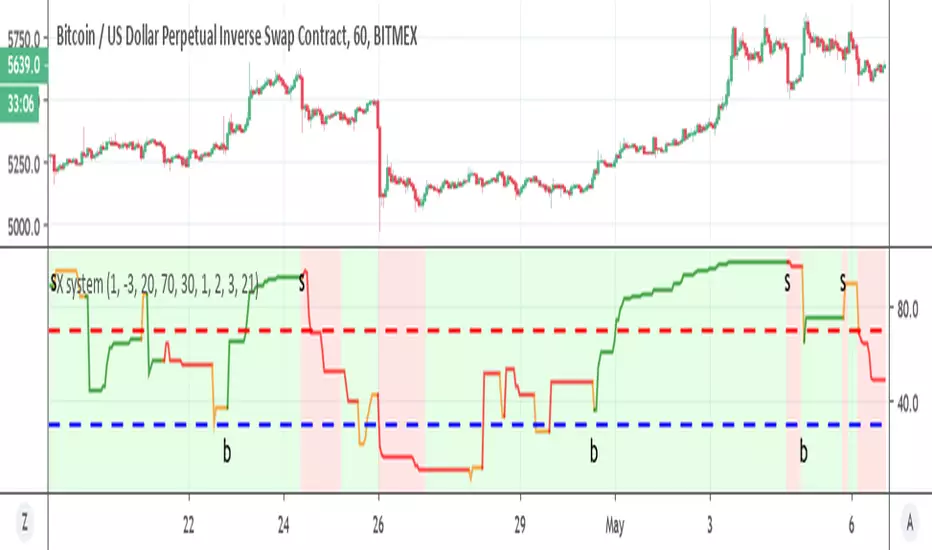
X systemSo how this system work ?
1. the bullish and bearish zones in lime and red are based on percent channel (you can modify it according to your needs) . this now is on 1 hour candles so I set it to 1% above and 3% bellow for BTC on bitmex.
2. we ha RSI super trend system which generate our buy and sell signals .
Since the Super trend is an RSI like it act like one as we can see when it go from high to low much more easy compare to regular super trend
One can optimize it to be full auto mode but it need more work to be much better and safe
This indicator aim is to help you in your decisions for buy and sell and I would not advise to use it as a bot but as a helper when you decide to buy and sell
Kal’s MTF ADX Rangoli RollerKaly MTF ADX Rangoli Roller is a method/study for finding trending stocks, indexes and cryptocurrencies using two different data periods (10, 5) of ADX Overlap over different time-frames (10m, 1H, 4H, 1D, 1W, 1M). In the study, I used 5-Period ADX for all mentioned time-frames. You may use 10-Period ADX for lower time-frames especially 10m and 1H.
Sample Image of the pinescript code(at the end of this post) in Tradingview looks as follows:
Note: Kal's MTF ADX Rangoli Roller is the lower Plot. The upper plot is KAL’s ADX Overlap Technical Study with MACD Filter( )
Description:
----------------
In the study plot, the lowest row is 10m, row above is 1H, row above is 4H, then 1D, then 1W and highest row is 1M
Lime(Bright Green) dot implies Trending Uptrend for that time-frame (first phase)
Green dot implies Trending Uptrend for that time-frame (second phase near exhaustion)
Red dot implies Trending Downward for that time-frame (first phase)
Maroon dot implies Trending Downward for that time-frame (second phase near exhaustion)
Lime cross implies Strong Trending Uptrend for that time-frame (first phase)
Green cross implies Strong Trending Uptrend for that time-frame (second phase near exhaustion)
Red cross implies Trending Strong Downward for that time-frame (first phase)
Maroon cross implies Trending Strong Downward for that time-frame (second phase near exhaustion)
Yellow is ‘Squeeze On’ setting. During the squeeze period, the ADX signals are almost always ineffective. One may wait and watch over during this time. Once the Squeeze is released (i.e. no longer yellow), the trend corresponds to the color of the dots and crosses.
Black is CRSI Overbought condition for that time-frame. It’s best to wait and research for possibility of trend reversal because
1. Profit-booking/trimming happens after CRSI Overbought condition.
2. Large Short-sellers may take huge positions during this time pushing the stock prices up.
White is CRSI Oversold condition for that time-frame. It’s best to wait and research for possibility of trend reversal because
1. Profit-booking/trimming happens after CRSI Oversold conditions.
2. Large buyers may take huge positions during this time pushing the stock prices down.
I am a disabled man. Therefore, I am not able to write in detail here today. More Details will follow as time permits. Please let me know if I am missing anything…
Legal Disclaimer: I published here so I get replies from fellow viewers to educate myself and for my daily expenses. Hence, if anyone uses this script for making their decisions, I am not responsible for any failures incurred.
Safe Trading!
Kal Gandikota
PS: If you found this script interesting and edifying please follow and upvote.
PS2: Please kindly donate for my daily expenses (atleast as you would on streets) at the following addresses:
BTC Wallet: 1NeDC1GvpFa49DFLuT1v28ohFjqtoWXNQ5
ETH Wallet: 0x35e557F39A998e7d35dD27c6720C3553e1c65053
NEO Wallet: AUdiNJDW7boeUyYYNhX86p2T8eWwuELSGr
PS3: For more information on ADX and CRSI, please 'Google' or search here yourself.
PS4: This study is intended for research in creating automated Python Trading Systems using Pandas( steemit.com ).
Screenshots of the pinescript code looks as follows:
10minute Screenshot of Kal's MTF ADX Rangoli Roller (Above)
1 Hour Screenshot of Kal's MTF ADX Rangoli Roller (Above)
4 Hour Screenshot of Kal's MTF ADX Rangoli Roller (Above)
1 Day Screenshot of Kal's MTF ADX Rangoli Roller (Above)
1 Week Screenshot of Kal's MTF ADX Rangoli Roller (Above)
1 Month Screenshot of Kal's MTF ADX Rangoli Roller (Above)
Ichimoku Analyzer☑️Ichimoku Analyzer
-This indicator automatically analyzes the Ichimoku conditions.
- Long and Short signals.
- Allows you to add an MA filter.
-Works in any timeframe or market like Forex, Crypto, Commodities even Stocks.
-Recommended manual trading and bots.
Do you need an Script or an expert adviser for Forex, contact our coding service!
Get this indicator today! contact us.

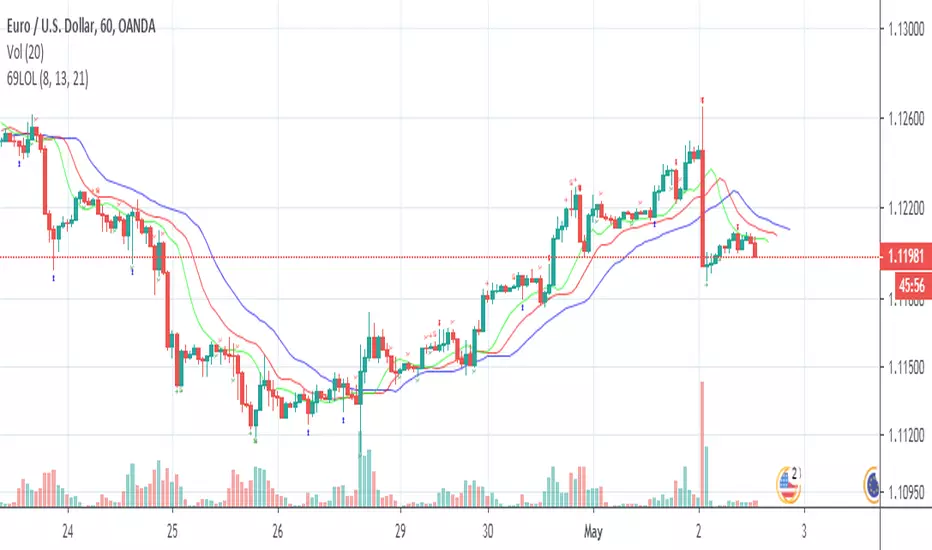
69LOL69LOL Trading using Tradingview. Build trading bots for bitcoin, altcoins, forex, stocks and more...
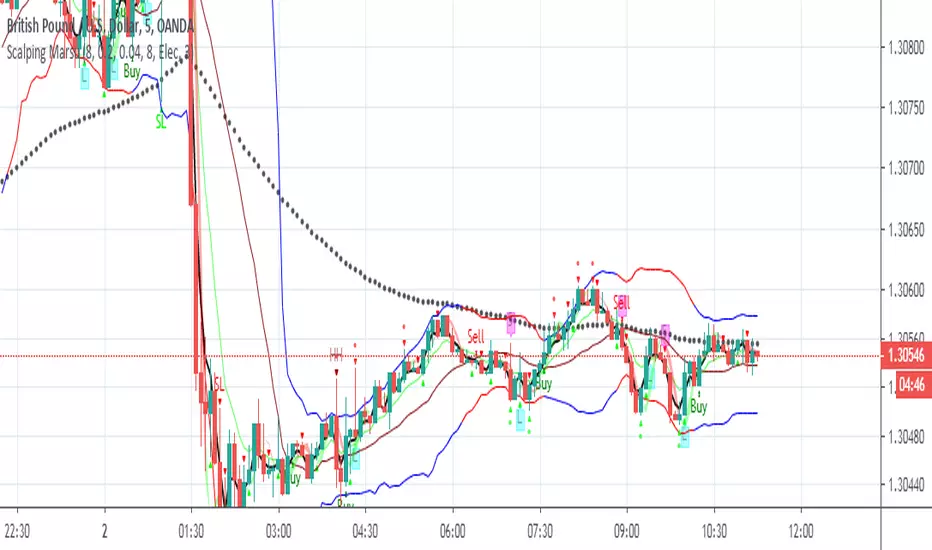
Scalping MarsuScalping Marsu
Trading using Tradingview. Build trading bots for bitcoin , altcoins, forex, stocks and more...
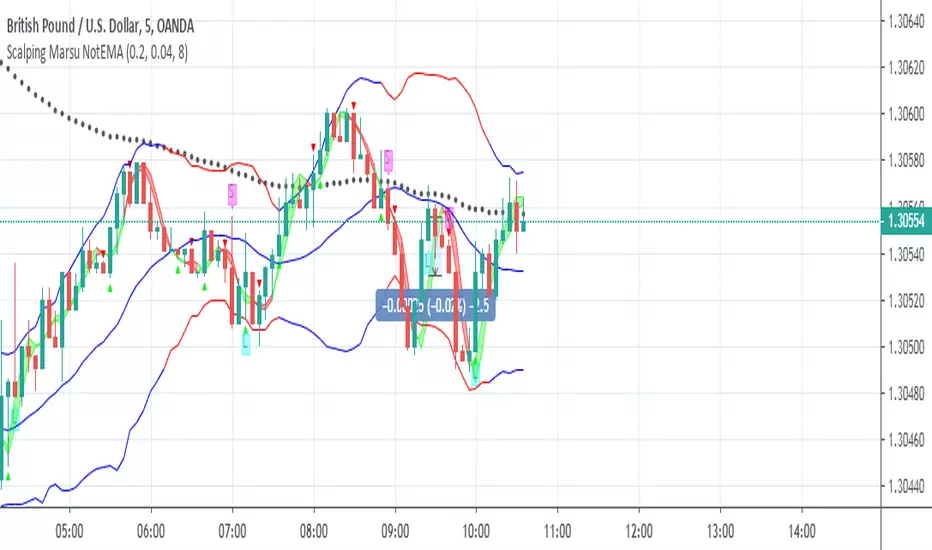
Scalping Marsu NotEMAScalping Marsu NotEMA
Trading using Tradingview. Build trading bots for bitcoin, altcoins, forex, stocks and more...
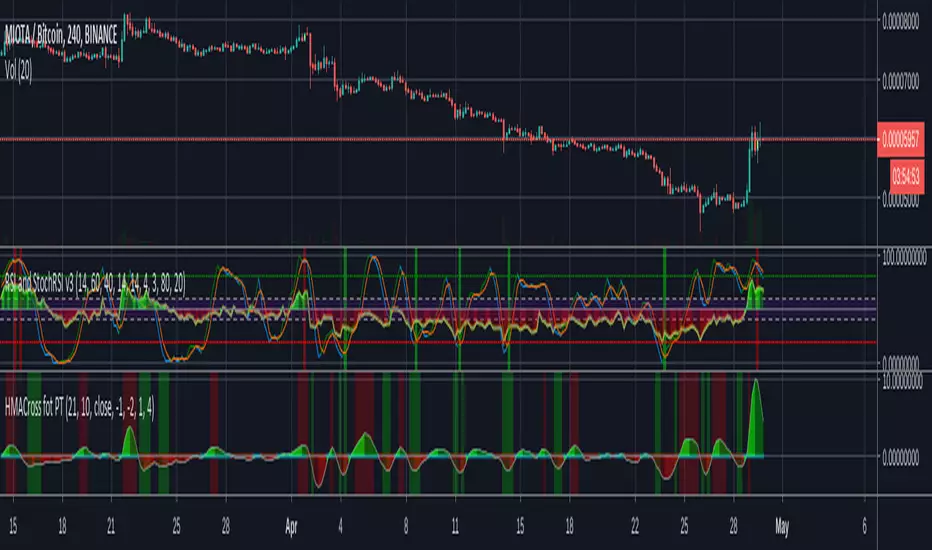
Scalping of Marsu PilamiScalping of Marsu Pilami
Trading using Tradingview. Build trading bots for bitcoin, altcoins, forex, stocks and more...

3 Commas On/Off Switch w/ AlertsThis is a useful on/off switch to turn on/off your bots while a coin is trending. Uses HULL moving averages to signal alerts.
Use at your own risk

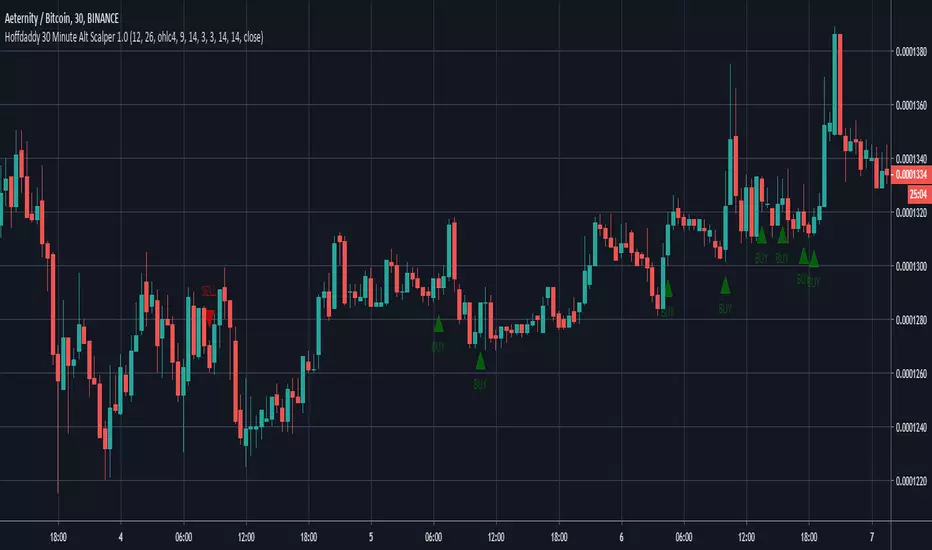
Hoffdaddy 30 Minute Alt Scalper 1.0Scalping indicator for bot trading on altcoins vs BTC. Works best on 30 minutes with minimal DCA, tight stop loss, and 1-2% take profit. No repaint, use candle close on alerts to avoid ghost signals.
PM for temporary access.
As always, I welcome feedback.
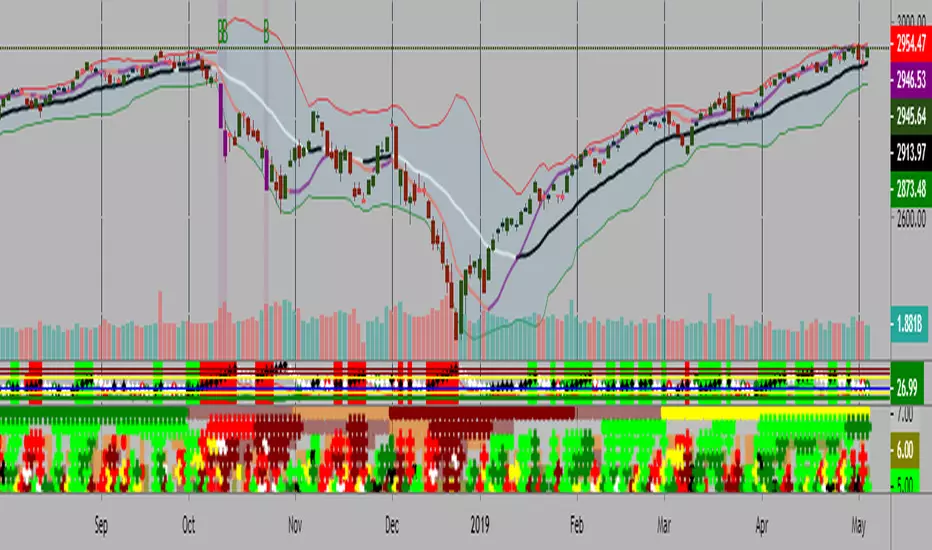
TrendMaster PremiumTrendMaster
TrendMaster is a complete trend following system with strict entry, exit and trade management criteria. The indicator is optimised for weekly, daily and 4-hour candlesticks and can be used for all trending markets. It was developed primarily for less experienced traders that struggle to determine relevant information from irrelevant information when viewing a candlestick chart. The indicator was built to solve the problem that all new traders face.
Setting Up The Indicator
After purchase, open the TradingView indicator library. Under the Invite-Only Scripts section, you will see TrendMaster. Add it to your chart. Next, you must customise your theme settings to allow TrendMaster to take over control of your candle colours. You can find a complete set-up tutorial on our website.
The Cloud
The indicator includes a moving average cloud which serves as a visual guide to local support and resistance. For a signal candle to print, price must trade above the moving average cloud and above the medium-term trend. By requiring multiple criteria we drastically reduce false entries. When price exits the cloud to the upside it typically trends above and finds support at the cloud during retracements.
Candle Colours
By default, TrendMaster will colour your candles in black and white. White candles indicate an uptrend in an asset and the candles will not change colour until the trend has reversed and a counter-trend signal has been printed. Black candles indicate a downtrend, they will remain black until a counter-trend long signal candle has been printed.
Signal candles
A signal candle is printed when the price of an asset closes above or below the moving average cloud and the medium term trend moving average. By requiring two criteria for a single candle to print we will see a drastic reduction in the number of false signals.
The TrendMaster entry technique further reduces the likelihood of false entries. To enter a trade we do not buy the signal candle immediately. Instead, we treat the signal candle as an indication that a trend change is possible. We want to see confirmation of this trend before making an entry. To enter we place a pending order a few ticks above or below the high or low of the signal candle. By doing this we only enter a trade when the asset has shown a continuation in the direction of the suggested trend change.
Once a trade has been taken we remain in that trade until either we have been stopped out on the break of a Williams fractal or the trend has reversed by printing an opposite to trend signal candle. It is important that we remain with the trend to ensure that we capture the maximum opportunity available.
If you would like to use TrendMaster or any of our other Indicators, please visit my site. Here you can purchase one of our packages which include indicators, market scanner bots and a large Discord community. You will also find educational content and how to guides for our indicators.
Our Story
Founded in 2018 by IchimokuScholar and C00kie, TrendMaster is a team that produces technical analysis indicators with an emphasis on simplicity and noise reduction. We support a large community with educational content, automated market scanners and mentoring in our private chat rooms. We produce technical analysis indicators geared primarily towards the emerging Cryptocurrency asset class. We provide educational material to assist trader development and host a large online trend following community. All of our products are designed to help traders distinguish relevant information from background noise. Our indicators encourage disciplined trade management to maximise the opportunity captured while minimising losses.
IchimokuScholar
IchimokuScholar – In 2017 I retired from a career in higher education to focus on Trading. I like to trade long term trends, focusing primarily on continuation setups. I am dedicated to sharing my knowledge of trading and take great pleasure in simplifying technical analysis for newer traders.
C00kie
I started trading crypto in 2017 and immediately started coding a bunch of tools to improve my quality of life. Some definitely worked out better than others. Like to trade the higher timeframes and drawing horizontal lines on charts. I am also pretty much obligated to like cookies.

21 TraderHello Fellow Traders!
-------------------------------------------
This is the newest addition to Gnome Alerts PRO!
Trade Moving Average Breakouts with Minimal Drawdon.
This Bot Script works on all Crypto, Leverage, Forex, & Traditional Exchanges.
FEATURES
------------------------
*Autoview Ready*
- Easy to Use
- Backtesting Included
-Take Profit
- Stop Loss

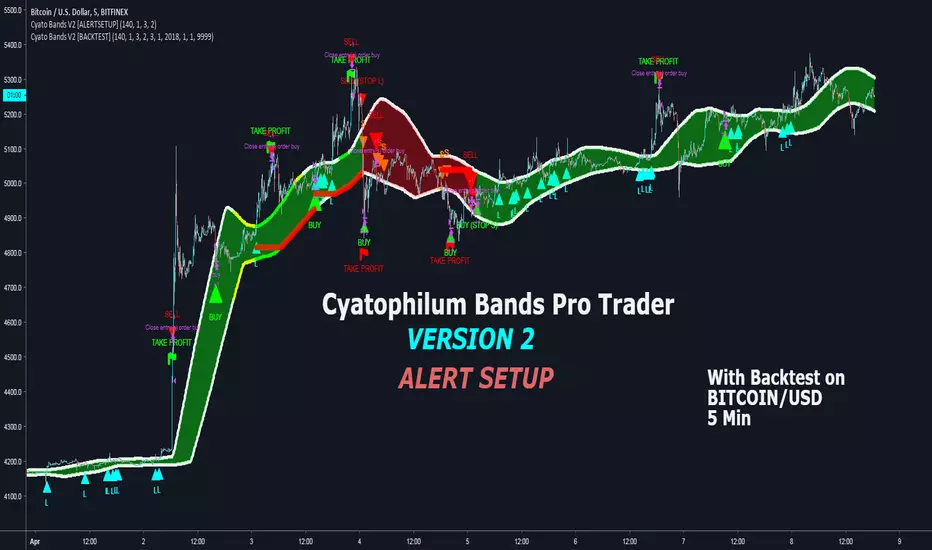
Cyatophilum Bands Pro Trader V2 [ALERTSETUP]An Original Automated Strategy that can be used for Manual or Bot Trading, on any timeframe and market.
Presentation page with video
How it works
The Cyatophilum Bands behave as either Trend Lines during a bear or bull market, or Support and Resistance during a Flat Market. Buy and Sell signals trigger upon Trend Reversal Breakouts.
Stop Loss System
An integrated Stop Loss System. Helps reducing risk by creating buy and sell signals when the price breaks through the red line.
Trailing Stop
Transform your Stop Loss into a Trailing Stop Loss. The red line will increase/decrease to secure profits.
Take Profit
Secure your profits using this new feature! When a flag appears, a buy/sell signal will trigger.
Re-Entries
A feature that can be helpful when using Take Profit or for manual trading in case you missed a trade.
Use it literally Anywhere
This indicator can be used on any timeframe and market (not only cryptocurrencies).
Backtest Below
Note: can be easily automated with Autoview
Get the indicator today!
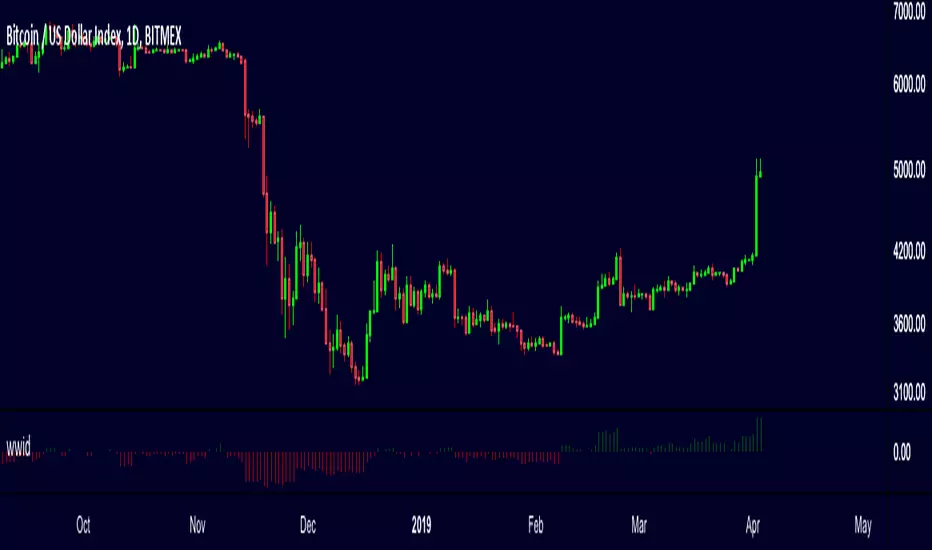
wwidoscillator which uses the combination of 4 indicators
use it on HTF only, like 4H and above to visualise the trend change
for access to bots and indicator, send a DM
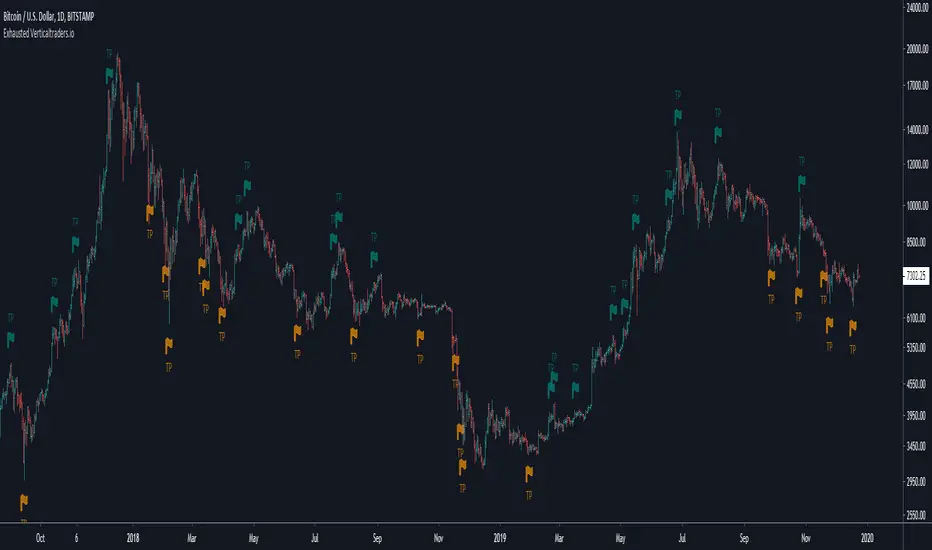
Exhausted-This algorithm takes in consideration Media averages, Volatility Movements, trend direction and other Mathematical Properties.
-After adding this signal on TradingView, you will get notified when it is suggested to protect profit or exits long and short positions.
-Meaning of colors:
Dark Red: suggestion protect profits Long
Red: suggestion exit Long
Dark green: suggestion protect profits Short
Green: suggestion exit Short
-You can activate notification alerts for any of the conditions.
-Works in any timeframe or market like Forex, Crypto, Commodities even Stocks.
-Recommended manual trading.
Do you need an Script or an expert adviser for Forex, contact our coding service!
Get this indicator today! contact us.
Cryptopeep 4 Moving AveragesWith this little script you can have 4 moving averages (either simple or exponential)
2 x day ma's and 2 x week ma's.
The advantage is, you can use a smaller time frames, eg on an 1hr and values will show the values of a day and week time frame.
It also has an option in settings to indicate where the weekends are (with all the bots this is getting less relevant).
The defaults are:
A 50 day and 100 day ma, this will be filled either red or green indicating trend pattern.
A 20 week and 200 week ma, this will not be filled.
You can change all these in settings.
Adv Scalper-This algorithm takes in consideration Media averages, Volatility Movements, trend direction and other Mathematical Properties.
-After adding this signal on TradingView, you will get notified every of potential long and short points triggered by the indicator.
-This signal alerts you anytime bars form a bullish or bearish pattern and price start to move in the suggested direction.
- It is recommended to use in 15-30 min timeframes in forex , but It works in any timeframe or market like Forex, Crypto, Commodities even Stocks.
-Recommended manual trading.
Do you need an Script or an expert adviser for Forex, contact our coding service!
Get this indicator today! contact us.

Premium 3-This algorithm takes in consideration Media averages, Volatility Movements and other Mathematical Properties.
-Allows you to find divergences and price trends in a simple way
-After adding this signal on TradingView, you will see potential long and short according to the colors of the candlesticks.
-It works in any time frame or market like Forex, Crypto, Commodities even Stocks.
Bullish Strength
Olive: weak
Dark green: medium
Light green: strong
Lime: very strong
Bearish strength
Fuchsia: weak
Maron: medium
Red: strong
Intense red: very strong
Do you need an Script or an expert adviser for Forex, contact our coding service
Get this indicator today! contact us

ABV Scalper - Free Bitcoin Scalper IndicatorExcited to bring you this totally free to use indicator to be used as a scalper for Bitcoin!
You are required to use the following:
Use with Bitfinex charts
Use Heiken Ashi candles
Use the 30m timeframe
UTC time setting
This indicator does not take new entries on weekends given lower volatility in the market. However, if it enters a trade it will manage the position over the weekend for Stop Loss and Take Profit logic.
This indicator is setup to be fully automated!
If you love this indicator and the work we put behind it - please give it a like and share it with your network!
