Mean reversal QFL v3My aim is to make the bots trade as you would trading QFL manually and “by the book” or at least to my experience and understanding from the material out there of how you should plan a QFL trade.
Im absolutely not a pro trader, I have made my share of costly mistakes trying to be clever or Beeing impatient resulting in painful losses. QFL is we’re I’ve had consistently good results tough.
Is this where I have to say I’m not a financial advisor and all that? Well I’m not. As always Do your own research and backtest, backtest, backtest.
First: I believe no bot strategy are set and forget, while they can run unattended 80-90% of the time you're always going to find yourself in a situation where you will have to manually handle a bad deal. It would also make sense to be somewhat involved in the really good trades making the most out of them. That’s why understanding the strategy the bot Is using is really important, hence why I prefer QFL. It's an easy concept to understand, and proved to be a safe way of making steady profit in pretty much all market conditions if done right.
Some changes in how aggressive you are might be needed if you are the impatient kind of trader who needs to see a lot of deals happening. But it is an added risk. In those cases Luc would advise to start “nibbling” but that would be hard to implement in a bot but I will see if that’s something I can implement.
Same goes for going the more conservative route when market conditions calls for it.
QFL stands for Quickfingersluc, and sometimes it is referred to as the Base Strategy or Mean Reversals. Its main idea is about identifying the moment of panic selling and buying below the base level and utilizing Safety orders.
Base level or Support Level refers to the lowest price level that was reached before the moment the price started increasing again. At that level, you can notice that buyers of some cryptocurrencies make a strong reaction.
As a bit of a learning material i want to make a few points on important factors in trading using the QFL strategy:
• Identify strong bases
• Read the history of the chart
• No emotions
Trading QFL using a bot has it’s limitations:
· Some of the bases are questionable but im constantly trying to improve this
· The strategy don’t take into consideration chart history(success rate)*
· You need to follow a predefined (by you) buying ladder, hence not considering a particular coin's average price movement, which may vary quite a lot. This why I for now has limited the strategy to SIMPLE bots. So that unique alerts can be created for each pair.
· A set Take profit %, possibly making you miss out on higher profits(This is easy to change during a trade though), and no chance of selling in layers(This is coming soon).
1. Some of the bases are questionable
The strategy will start trades of bases that you wouldn’t consider being a strong base(or a base at all) when looking at the chart.
For those not as familiar with QFL. What is a base, and what qualifies as a strong base?
• A base is also called the Support Level, which is the lowest price level that was reached before the price started turning and increasing again.
• A strong base is recognized by a steep fall in price after breaking the base(Panic), followed by a big reaction pump.
• The reaction pump is the most important factor to say that it is a strong base.
• And also the last base, the one you are trading of is the one that counts
Tip: Look for V shapes on the chart, easy to spot when zoomed out.
2. The integrated signals don’t take into consideration chart history(success rate)*
How can you assess the success rate by looking at the chart?
After finding the bases based on the criterias from the 1st point. Looking at the, how many times did it respect the base after breaking it? 7/10, 8/10, 9/10 times? Great! Chances of the next trade also respecting the base is big, and I would consider raising the TP on that deal. Any lower than that I would keep a really close eye on the deal, or even consider closing the deal. And again remember the last base is the one that counts. If all the others are nice strong bases but that last one you are about to take a trade off is no good the base is invalidated so be cautious.
3. You need to follow a predefined (by you) buying ladder
Crypto is volatile, and there is a huge variation in price movements on all the coins.
Trading manually, looking at the chart gives you a good idea on how much a coin on avg. drops below base, and how big the following reaction is. This gives you an indication on how deep you need to set your layers, and where you can take profit.
Using the strategy you have the backtester to see how much max deviation has been in the past so that you can figure out what the optimal max deviation is.
4. A set Take profit %, possibly making you miss out on higher profits(This is easy to change during a trade though), and no chance of selling in layers.
Not going to say to much about this other than what I often do is:
When a bot has started a trade I usually take a look at the chart. If I like what I see, nice chart history, success rate and trading of a strong previous base etc, with the current base break resulting in a panic drop I will consider increasing the TP so that it will make more profit. This can be a bit risky but also very rewarding. Imagine filling all safeties and then selling just below base! Massive profits!! (Gotta be honest though, almost never stretch it that far with a bot though, but it is a possibility) .
If you have studied the chart and concluded that this particular trade has a 90% chance of success, there isn’t really any reason not to place TP just below base. This is where I would like to have the option of layering my sell orders as well so its something im working on implementing.
Trailing is an option in 3commas, but it’s slow to place orders making you miss a selling opportunity when the coin makes a sudden spike up.
ABOUT THIS STRATEGY
In this strategy we can also reverse the strategy and go short. But i must warn you that that is alot riskier.
QFL is meant to be used on higher TF's like 1hr, 2hr and 4hr. But this strategy also work well on lower Timeframes.
The script also simulates DCA strategy with parameters used in 3commas DCA bots for futures trading.
Experiment with parameters to find your trading setup.
Beware how large your total leveraged position is and how far can market go before you get liquidated!
Do that with the help of futures liquidation calculators you can find online!
Included:
An internal average price and profit calculating, instead of TV`s native one, which is subject to severe slippage.
A graphic interface, so levels are clearly visible and back-test analyzing made easier.
Long & Short direction of the strategy.
Table display a summary of past trades
Vertical colored lines appear when the new maximum deviation from the original price has
been reached
All the trading happens with total account capital, and all order sizes inputs are expressed in percent.
How to use:
- Add the script to the current chart
- Open the strategy settings
-Tweak the settings to to your liking.
-Make a SIMPLE bot in 3commas and use the same settings as you did in tradingview if you only want the strategy to send signals to open a deal and let 3commas handle the rest.
If you check safety orders, Take profit deal stop and Stop loss. The strategy will send all the orders to 3 commas. If that’s what you want set TP in 3commas to 50% set number of safety orders to 0 and keep stop loss unchecked.
- Insert bot details using the deal start condition message found in your 3commas bot.
- When happy, right click on the "..." next to the strategy name, then "Add alert'".
- Under "Condition", on the second line, chose "Any alert () function call". Add the webhook from 3commas( 3commas.io ), give it a name, use {{strategy.order.alert_message}} as a placeholder message and "create".
In the future this signal might make it to the 3commas marketplace. You can then subscribe to that signal where I have cherrypicked coins based on thorough backtesting and optimization.
How to obtain access to the script: send me a private message in Tradingview
"bot" için komut dosyalarını ara

AUTOMATIC GRID BOT STRATEGY [ilovealgotrading]
OVERVIEW:
This Grid trading strategy can help you maximize your profit in a ranging sideways market with no clear direction.
INDICATOR:
We can get some money by taking advantage of the movement of the price between the range we have determined.
Short positions are opened while the price is rising, long positions are opened while the price is falling.
Therefore, there is no need to predict the trend direction.
What is different in this indicator:
I want to say thank you to © thequantscience. His GRID SPOT TRADING ALGORITHM - GRID BOT TRADING strategy helped me when I was writing my indicator.
I want to explain what I have improved:
1- Grid strategy is a type of strategy that can be traded in very short time frames and users can trade this strategy algorithmically by connecting this strategy to their own accounts with the help of API systems. For this reason, I have developed a software that can give us signals by dynamically changing the long and short messages when users are trading.
2- We can change the start and end dates of our grid bot as we want. It is necessary to use this setting when setting up automatic bots, so that previously opened transactions are not taken into account.
3 - Lot or quantity size should not be excessively small when users are taking automatic trades because exchanges have limitations, to avoid this problem, I have prevented this error by automatically rounding up to the nearest quantity size inside the software.
4 - Users can avoid excessive losses by using stop loss on this grid bot if they wish.
5 - When our price is over the range high or below the range low, our open positions are closed, if the stop button is active. We can also change which close price time frame we take as a basis from the settings.
6 -Users can set how many dollars they can enter per transaction while performing their transactions automatically.
IMPLEMENTATION DETAILS – SETTINGS:
This script allows the user to choose the highs and lows leves of our range. Our bot trades in the specified range.
1. This strategy allows us to set start and end backtest dates.
2. We can change range high and range low leves of our bot
3. IF people want to trade algorithmically with the help of this bot, there are 6 different input systems that will receive the Json codes as an alarm
4. IF the price closes above the upper line or below the lower line, all transactions will be closed. We can determine in which time frame our transactions will be stopped if the price closes outside these levels.We can adjust how our bot works by activating or turning off the Stop Loss button.
5. In this strategy, you can determine your dollar cost for per position.
6. The user can also divide the interval we have determined into 10 parts or 20 equal parts.
7. The grid is divided and colored at the interval we set. At the same time, if we don't want we can turn off colored channels.
Notes:
If you're going to connect this bot to an automatic Long and Short direction,
Don’t forget! you need to Webhook URL,
Don’t miss paste this code to your message window {{strategy.order.alert_message}}
ALSO:
Set your range below the support zones and above the resistance zones.
Don't be afraid to take a wide range, it doesn't matter if you make a little money, the important thing is that you don't lose money.
If you have any ideas what to add to my work to add more sources or make calculations cooler, suggest in DM .

Strategy for UT Bot Alerts indicator Using the UT Bot alerts indicator by @QuantNomad, this strategy was designed for showing an example of how this indicator could be used, also, it has the goal to help some people from a group that use to use this indicator for their trading. Under any circumstance I recommend to use it without testing it before in real time.
Backtesting context: 2020-02-05 to 2023-02-25 of BTCUSD 4H by Tvc. Commissions: 0.03% for each entry, 0.03% for each exit. Risk per trade: 2.5% of the total account
For this strategy, 3 indicators are used:
UT Bot Alerts indicator by Quantnomad
One Ema of 200 periods for indicate the trend
Atr stop loss from Gatherio
Trade conditions:
For longs:
Close price is higher than Atr from UT Bot
Ema from UT Bot cross over Atr from UT Bot.
This gives us our long signal. Stop loss will be determined by atr stop loss (white point), break even(blue point) by a risk/reward ratio of 0.75:1 and take profit of 3:1 where half position will be closed. This will be showed as buy (open long position)
The other half will be closed when close price is lower than Atr and Ema from UT Bot cross under Atr. This will be showed as cl buy (close long position)
For shorts:
Close price is lower than Atr from UT Bot
Ema from UT Bot cross over Atr from UT Bot.
This gives us our short signal. Stop loss will be determined by atr stop loss (white point), break even(blue point) by a risk/reward ratio of 0.75:1 and take profit of 3:1 where half position will be closed. This will be showed as sell (open short position)
The other half will be closed when close price is higher than Atr and Ema from UT Bot cross over Atr. This will be showed as cl sell (close short position)
Risk management
For calculate the amount of the position you will use just a small percent of your initial capital for the strategy and you will use the atr stop loss for this.
Example: You have 1000 usd and you just want to risk 2,5% of your account, there is a long signal at price of 20,000 usd. The stop loss price from atr stop loss is 19,000. You calculate the distance in percent between 20,000 and 19,000. In this case, that distance would be of 5,0%. Then, you calculate your position by this way: (initial or current capital * risk per trade of your account) / (stop loss distance).
Using these values on the formula: (1000*2,5%)/(5,0%) = 500usd. It means, you have to use 500 usd for risking 2.5% of your account.
We will use this risk management for apply compound interest.
In settings, with position amount calculator, you can enter the amount in usd of your account and the amount in percentage for risking per trade of the account. You will see this value in green color in the upper left corner that shows the amount in usd to use for risking the specific percentage of your account.
Script functions
Inside of settings, you will find some utilities for display atr stop loss, break evens, positions, signals, indicators, etc.
You will find the settings for risk management at the end of the script if you want to change something. But rebember, do not change values from indicators, the idea is to not over optimize the strategy.
If you want to change the initial capital for backtest the strategy, go to properties, and also enter the commisions of your exchange and slippage for more realistic results.
In risk managment you can find an option called "Use leverage ?", activate this if you want to backtest using leverage, which means that in case of not having enough money for risking the % determined by you of your account using your initial capital, you will use leverage for using the enough amount for risking that % of your acount in a buy position. Otherwise, the amount will be limited by your initial/current capital
---> Do not forget to deactivate Trades on chart option in style settings for a cleaner look of the chart <---
Some things to consider
USE UNDER YOUR OWN RISK. PAST RESULTS DO NOT REPRESENT THE FUTURE.
DEPENDING OF % ACCOUNT RISK PER TRADE, YOU COULD REQUIRE LEVERAGE FOR OPEN SOME POSITIONS, SO PLEASE, BE CAREFULL AND USE CORRECTLY THE RISK MANAGEMENT
Do not forget to change commissions and other parameters related with back testing results!
Strategies for trending markets use to have more looses than wins and it takes a long time to get profits, so do not forget to be patient and consistent !
---> The strategy can still be improved, you can change some parameters depending of the asset and timeframe like risk/reward for taking profits, for break even, also the main parameters of the UT Bot Alerts <----

Godtrix's Crypto HA+RSI+EMA+ATH+DCA Strategy 3.0New Updates is here! Upgrade from previous version 2.0 (Please avoid using v2.0 as it's outdated.)
Great stability, Repaint bug fixes, and New features!
==================
| Introduction: |
==================
This is a Long Term Strategy, using compounding profit method, it can generate high returns, but it also risk for losses, this can be overcome if you set Stop Loss to over 25% for bitcoin & 60% for Altcoins.
Best profit plan with this strategy is you trade on Future leverage while you hold on to your coin, so that when price goes up, your coin value goes up, and at the same time, you trade with your leverage to earn even more, easily doubling up your total profit.
Benefits:
Fully customizable and you can easily personalized it and FINE TUNE it according to the market or coin you trading on.
The strategy is based on REAL PRACTICAL trading skills, so it works in real-world.
I fixed the "repainting" issue so the backtest it shows you IS ACCURATE when you run for real-time.
We all know one indicator is not going to help you win your trades, so this strategy combines ALL three: EMA for long+short term trend, HA for short term trend, RSI for entry/exit
This strategy is designed for LONG trade (Buy low, Sell high), not for SHORT trade.
This is not day trading, it is more to mid-term trading, where there's only few trades per month
Mainly is coded to work with 3Commas bot auto trading, so you only need to key in your Bot ID & Email Token.
Bot trading NOTE:
- You need to replace the Alert Message with this: {{strategy.order.alert_message}}
- And you'll need the Bot's webhook Url set with the Alert too.
- One Alert will work for both Buy and Sell Order
- If you using other Bot service, you can enter Custom Command in Input Settings too, it works on any bot service.
Lastly,
regarding the setting advice, I would say you try playing with different settings and your objective is to achieve a backtest result that has:
1) Profitable is > 80%
2) Losing trades is nearly 0 or below 25% of your winning trades. Trick is using far stop loss %
3) Net Profit be almost same or more than "Buy & Hold Profit"
==================
| Latest Updates: |
==================
=| Tidy Up Codings |=
- Group input fields so it'll be easier to understand and find the settings
- Upgrade code for obsolete 'transp' options
=| Repaint Issues |=
- Previous v2.0's RSI has repaint issue, creating false result against real-time data. I've fixed this.
- Also done fine-tuning other parts of the codes to prevent possible repaint issues.
=| Bot System |=
- Improved Custom Bot system, so that you're able to set dynamic order size/quantity with my custom keyword: and
Base Order Example:
{ 'message_type': 'bot', 'bot_id': 1234567, 'email_token': 'abcdefgh-1234-1234-1234', 'base_order': , 'delay_seconds': 0, 'pair': 'USDT_BTC'}
=| EMA Downtrend Exit |=
- Added option for you to decide whether to close position when detected EMA Long term downtrend.
=| EMA 2 (short term) is removed |=
- After several test, I've decided to remove this because it doesn't contribute to improving the results.
=| Heikin Ashi System |=
- Improved the chart display, now you'll see the HA candle 'shadowed' behind, so you'll see both actual price candle and HA candle at same time.
- Added the system that detect the HA candle sizes to decide specifically when it's suitable for Entry and Exit.
>> For "Entry/Exit Range"
- This means after HA is valid for Entry or Exit, how many following bars are allowed to stay valid so it will match other requirements to be completely fulfilled for Entry or Exit.
>> For "Crossing Interval"
- This means after detected HA line crossover, how many HA intervals is allow to Entry or Exit
>> For "Reversed Exit"
- This function let's you decide whether to close position if after HA bull (green candle) changed into HA Bear (red candle)
=| RSI A Entry |=
- Added option to avoid Entry during NTZ (No trade Zone)
- Also added the option to avoid next same condition RSI A entry too soon
=| RSI B Entry |=
- This function is for Entry if RSI is going very low, mostly due to bigger price drops in short time, it's good for buying DIP, however we'll never be able to know when a DIP ends, so do more test on this settings before put into real use.
- Added "avoid" options to help avoid getting Entry at "false" DIP, more like a short & fast pullback which causes RSI to drop very low but actually the price is near ATH or Recent High.
- Added option for Entry with Trailing Price Lower Buy combine with a limit order that grabs low price, so whichever it fulfill first.
=| New: Avoid Entry |=
- Well, it's a pain if you bought at the top, so I've added two options that will avoid buying near ATH and Recent High.
=| Time-limit Removed |=
- Sorry that I've missed look on the script policy which I'm not allowed to put a time-limit for public scripts.
=| System Improvements |=
- HA condition detection is optimized and bug fixed
- RSI values now reads accurately on each bar despite using higher timeframe, especially when moving to next interval
=| New: Dollar Cost Averaging (DCA) Orders |=
- Although DCA strategy is not appealing for Long term strategy, but I've added it for your extra options and flexibilities.
- The settings are quite straight-forward and standard, so I won't be explaining here.
=| New: Backtest Start & End Date |=
- This is very good function when you need more accurate result starting at specific date & time.
- Also if you set the date & time for your real trading starts, it'll much result the same as your actual trading records, which helps you to see clearer and make future decisions.
Any found bugs or flaws, please feel free to PM me, I can't get notifications from comments here below, so I'll not able to reply you the soonest possible, still not sure how to turn on notification for comments, anyone who knows can PM and teach me, lol... Thanks in advance!
Well, this is free version, hope it helps! Feedbacks are all welcome :)
(To Moderators: I've fully use the "f_security()" guideline, but instead of creating a separate function, I apply directly on all security() function. Please don't ban my script before fully check if I've truly fixed repaint. Thank you.)
BITSTAMP:BTCUSD COINBASE:BTCUSD COINBASE:ETHUSD BINANCE:BNBUSDT

Martingale + Grid DCA Strategy [YinYangAlgorithms]This Strategy focuses on strategically Martingaling when the price has dropped X% from your current Dollar Cost Average (DCA). When it does Martingale, it will create a Purchase Grid around this location to likewise attempt to get you a better DCA. Likewise following the Martingale strategy, it will sell when your Profit has hit your target of X%.
Martingale may be an effective way to lower your DCA. This is due to the fact that if your initial purchase; or in our case, initial Grid, all went through and the price kept going down afterwards, that you may purchase more to help lower your DCA even more. By doing so, you may bring your DCA down and effectively may make it easier and quicker to reach your target profit %.
Grid trading may be an effective way of reducing risk and lowering your DCA as you are spreading your purchases out over multiple different locations. Likewise we offer the ability to ‘Stack Grids’. What this means, is that if a single bar was to go through 20 grids, the purchase amount would be 20x what each grid is valued at. This may help get you a lower DCA as rather than creating 20 purchase orders at each grid location, we create a single purchase order at the lowest grid location, but for 20x the amount.
By combining both Martingale and Grid DCA techniques we attempt to lower your DCA strategically until you have reached your target profit %.
Before we start, we just want to make it known that first off, this Strategy features 8% Commission Fees, you may change this in the Settings to better reflect the Commission Fees of your exchange. On a similar note, due to Commission Fees being one of the number one profit killers in fast swing trade strategies, this strategy doesn’t focus on low trades, but the ideology of it may result in low amounts of trades. Please keep in mind this is not a bad thing. Since it has the ability to ‘Stack Grid Purchases’ it may purchase more for less and result in more profit, less commission fees, and likewise less # of trades.
Tutorial:
In this example above, we have it set so we Martingale twice, and we use 100 grids between the upper and lower level of each martingale; for a total of 200 Grids. This strategy will take total capital (initial capital + net profit) and divide it by the amount of grids. This will result in the $ amount purchased per grid. For instance, say you started with $10,000 and you’ve made $2000 from this Strategy so far, your total capital is $12,000. If you likewise are implementing 200 grids within your Strategy, this will result in $12,000 / 200 = $60 per grid. However, please note, that the further down the grid / martingale is, the more volume it is able to purchase for $60.
The white line within the Strategy represents your DCA. As the Strategy makes purchases, this will continue to get lower as will your Target Profit price (Blue Line). When the Close goes above your Target Profit price, the Strategy will close all open positions and claim the profit. This profit is then reinvested back into the Strategy, which may exponentially help the Strategy become more profitable the longer it runs for.
In the example above, we’ve zoomed in on the first example. In this we want to focus on how the Strategy got back into the trades shortly after it sold. Currently within the Settings we have it set so our entry is when the Lowest with a length of 3 is less than the previous Lowest with a length of 3. This is 100% customizable and there are multiple different entry options you can choose from and customize such as:
EMA 7 Crossover EMA 21
EMA 7 Crossunder EMA 21
RSI 14 Crossover RSI MA 14
RSI 14 Crossunder RSI MA 14
MFI 14 Crossover MFI MA 14
MFI 14 Crossunder MFI MA 14
Lowest of X Length < Previous Lowest of X Length
Highest of X Length > Previous Highest of X Length
All of these entry options may be tailored to be checked for on a different Time Frame than the one you are currently using the Strategy on. For instance, you may be running the Strategy on the 15 minute Time Frame yet decide you want the RSI to cross over the RSI MA on the 1 Day to be a valid entry location.
Please keep in mind, this Strategy focuses on DCA, this means you may not want the initial purchase to be the best location. You may want to buy when others think it is a good time to sell. This is because there may be strong bearish momentum which drives the price down drastically and potentially getting you a good DCA before it corrects back up.
We will continue to add more Entry options as time goes on, and if you have any in mind please don’t hesitate to let us know.
Now, back to the example above, if we refer to the Yellow circle, you may see that the Lowest of a length of 3 was less than its previous lowest, this triggered the martingales to create their grids. Only a few bars later, the price went into the first grid and went a little lower than its midpoint (Yellow line). This caused about 60% of the first grid to be purchased. Shortly after the price went even lower into this grid and caused the entire first martingale grid to be purchased. However, if you notice, the white line (your DCA) is lower than the midpoint of the first grid. This is due to the fact that we have ‘Stack Grid Purchases’ enabled. This allows the Strategy to purchase more when a single bar crosses through multiple grid locations; and effectively may lower your average more than if it simply executed a purchase order at each grid.
Still looking at the same location within our next example, if we simply increase the Martingale amount from 2 to 3 we can see something strange happens. What happened is our Target Profit price was reached, then our entry condition was met, which caused all of the martingale grids to be formed; however, the price continued to increase afterwards. This may not be a good thing, sure the price could correct back down to these grid locations, but what if it didn’t and it just kept increasing? This would result in this Strategy being stuck and unable to make any trades. For this reason we have implemented a Failsafe in the Settings called ‘Reset Grids if no purchase happens after X bars’.
We have enabled our Failsafe ‘Reset Grids if no purchase happens after X bars’ in this example above. By default it is set to 100 bars, but you can change this to whatever works best for you. If you set it to 0, this Failsafe will be disabled and act like the example prior where it is possible to be stuck with no trades executing.
This Failsafe may be an important way to ensure the Strategy is able to make purchases, however it may also mean the Grids increase in price when it is used, and if a massive correction were to occur afterwards, you may lose out on potential profit.
This Strategy was designed with WebHooks in mind. WebHooks allow you to send signals from the Strategy to your exchange. Simply set up a Custom TradingView Bot within the OKX exchange or 3Commas platform (which has your exchange API), enter the data required from the bot into the settings here, select your bot type in ‘Webhook Alert Type’, and then set up the alert. After that you’re good to go and this Strategy will fully automate all of its trades within your exchange for you. You need to format the Alert a certain way for it to work, which we will go over in the next example.
Add an alert for this Strategy and simply modify the alert message so all it says is:
{{strategy.order.alert_message}}
Likewise change from the Alert ‘Settings’ to Alert ‘Notifications’ at the top of the alert popup. Within the Notifications we will enable ‘Webhook URL’ and then we will pass the URL we are sending the Webhook to. In this example we’ve put OKX exchange Webhook URL, however if you are using 3Commas you’ll need to change this to theirs.
OKX Webhook URL:
www.okx.com
3Commas Webhook URL:
app.3commas.io
Make sure you click ‘Create’ to actually create this alert. After that you’re all set! There are many Tutorials videos you can watch if you are still a little confused as to how Webhook trading works.
Due to the nature of this Strategy and how it is designed to work, it has the ability to never sell unless there it will make profit. However, because of this it also may be stuck waiting in trades for quite a long period of time (usually a few months); especially when your Target Profit % is 15% like in the example above. However, this example above may be a good indication that it may maintain profitability for a long period of time; considering this ‘Deep Backtest’ is from 2017-8-17.
We will conclude the tutorial here. Hopefully you understand how this Strategy has the potential to make calculated and strategic DCA Grid purchases for you and then based on a traditional Martingale fashion, bulk sell at the desired Target Profit Percent.
Settings:
Purchase Settings:
Only Purchase if its lower than DCA: Generally speaking, we want to lower our Average, and therefore it makes sense to only buy when the close is lower than our current DCA and a Purchase Condition is met.
Purchase Condition: When creating the initial buy location you must remember, you want to Buy when others are Fearful and Sell when others are Greedy. Therefore, many of the Buy conditions involve times many would likewise Sell. This is one of the bonuses to using a Strategy like this as it will attempt to get you a good entry location at times people are selling.
Lower / Upper Change Length: This Lower / Upper Length is only used if the Purchase Condition is set to 'Lower Changed' or 'Upper Changed'. This is when the Lowest or Highest of this length changes. Lowest would become lower or Highest would become higher.
Purchase Resolution: Purchase Resolution is the Time Frame that the Purchase Condition is calculated on. For instance, you may only want to start a new Purchase Order when the RSI Crosses RSI MA on the 1 Day, but yet you run this Strategy on the 15 minutes.
Sell Settings:
Trailing Take Profit: Trailing Take Profit is where once your Target Profit Percent has been hit, this will trail up to attempt to claim even more profit.
Target Profit Percent: What is your Target Profit Percent? The Strategy will close all positions when the close price is greater than your DCA * this Target Profit Percent.
Grid Settings:
Stack Grid Purchases: If a close goes through multiple Buy Grids in one bar, should we amplify its purchase amount based on how many grids it went through?
Reset Grids if no purchase happens after X Bars: Set this to 0 if you never want to reset. This is very useful in case the price is very bullish and continues to increase after our Target Profit location is hit. What may happen is, Target Profit location is hit, then the Entry condition is met but the price just keeps increasing afterwards. We may not want to be sitting waiting for the price to drop, which may never happen. This is more of a failsafe if anything. You may set it very large, like 500+ if you only want to use it in extreme situations.
Grid % Less than Initial Purchase Price: How big should our Buy Grid be? For instance if we bought at 0.25 and this value is set to 20%, that means our Buy Grid spans from 0.2 - 0.25.
Grid Amounts: How many Grids should we create within our Buy location?
Martingale Settings:
Amount of Times 'Planned' to Martingale: The more Grids + the More Martingales = the less $ spent per grid, however the less risk. Remember it may be better to be right and take your time than risk too much and be stuck too long.
Martingale Percent: When the current price is this percent less than our DCA, lets create another Buy Grid so we can lower our average more. This will make our profit location less.
Webhook Alerts:
Webhook Alert Type: How should we format this Alert? 3Commas and OKX take their alerts differently, so please select the proper one or your webhooks won't work.
3Commas Webhook Alerts:
3Commas Bot ID: The 3Commas Bot ID is needed so we know which BOT ID we are sending this webhook too.
3Commas Email Token: The 3Commas Email Token is needed for your webhooks to work properly as it is linked to your account.
OKX Webhook Alerts:
OKX Signal Token: This Signal Token is attached to your OKX bot and will be used to access it within OKX.
If you have any questions, comments, ideas or concerns please don't hesitate to contact us.
HAPPY TRADING!

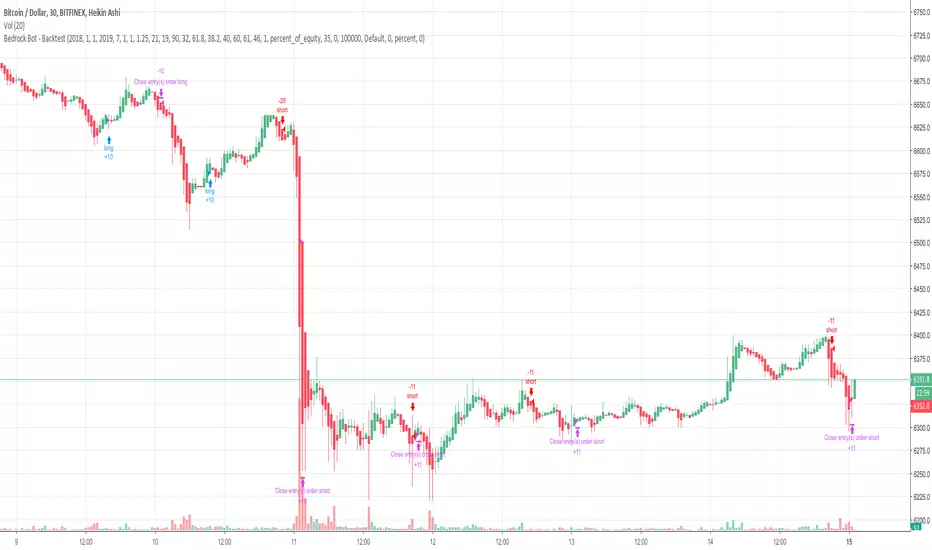
Bedrock Bot - BTCUSD 30m Scalper BotBedrock Bot trades on BTCUSD charts and is a high frequency scalper bot - for those that like a little more action.
The strategy was developed for use on more recent market conditions - smaller trends within larger sideways ranges. It will work in trends as well. It is made for quick take profits and tight stop losses to maximize overall profit and minimize losses (check out the win ratio and downdraw results). It does not trade on the weekends as much of the volume is now weekday based.
Backtest results look great and we have been running this bot on live markets as well in forward testing with profit results.
These live tests were done exclusively on BitMex and by using automation on Crypto Bots Hub . Monthly returns have been around 8% - you may think this doesn't sound amazing but understand compound interest and do check out the win percentage and downdraw. In these sideways markets, this can keep building your profits slow and steady with minimal risk.
The bot controls entries, stop losses, and take profits as part of the code.
Message me on information to get free access.
AlgoTrade DCA Bot Backtester█ OVERVIEW
This script can be used to backtest DCA Bots. It draws inspiration from 3Commas and has most settings that are available on 3Commas. It contains a few popular DCA Bot Presets that are well known in the community for you to test out! Preset used here: Kirigakure V4
█ FEATURES
DCA Preset (Custom, Standard TA,Urma Lite V3,Kirigakure V1,Kirigakure V3,Kirigakure V4)
Order Size Type (Fixed/% of equity to simulate compounding)
Base Order Size
Safety Order Size
Max Safety Trades Count
Price Deviation to open safety order %
Safety Order Volume Scale
Safety Order Step Scale
Take Profit %
Use ADR (Average Daily Range) as Take Profit
ADR length (if ADR as take profit is enabled)
Take Profit Type (% from total volume / % from base order)
Trailing Take Profit
Stop Loss
Deal Start Condition (Start ASAP) ▶ More Deal Starting Conditions will be added in the future
Bot Direction (Long / Short)
Start Time ▶ 1999-01-01 (Use this to always backtest the entire history)
End Time
This strategy also allows you to plot the Average Price and Take Profit of each trade, so it's easier to follow the trade and understand what's happening.
█ HOW TO USE
1. Select a DCA Preset and change the initial capital to the exact amount that is required (seen in the error message on top of the table). When using a Preset the following settings will be locked, meaning if you change them in the script's settings it won't have any effect:
Base Order Size
Safety Order Size
Max Safety Trades Count
Price Deviation to open safety order %
Safety Order Volume Scale
Safety Order Step Scale
Use ADR (Average Daily Range) as Take Profit
1.1 When using Presets you can choose the Order Size Type of Fixed or % of equity which simulates compounding
1.2 Choose a Direction and a Start and End Time
2. To backtest customized settings choose the preset "Custom"
2.1 All other settings are now "unlocked" and can be used
█ LIMITATIONS
Whenever a DCA preset is changed the initial_capital needs to be changed to the exact amount the settings require. If the initial_capital is not the same there will be an error of top of the table. To fix this error navigate to the Script's Settings and Properties and change the initial_capital to the same amount that is stated in the error.
DCA Bots with a high number of safety orders, e.g. 100, can run into an error that says "Maximum number of orders (9000) reached". If this error happens change the backtesting time to a shorter timeframe.
Using % of equity simulates compounding but is unrealistic because you cannot re-invest every single dollar
█ THANKS
This script in insipred by rouxam's "Backtesting 3commas DCA Bot v2" script

Sig30MALICEHello everyone
Bot is optimalized BINANCE:ALICEUSDTPERP BOT, which select leverage betwen 2x and 4x
TimeFrame : 30min
TP : 80 point
SL : 120 point
the bot works as follows:
the way he opens a position consists of two conditions
1) Moving average (crossovers)
2) RSI
Backtesting is set for counting as 13 contrat, this bot can get more with 50% of equity.
I think this is really solid 30min bot, which is already really important to make something solid on 30min
However keep in mind this is scalper and optimalization scalpers are really hard and have to be set from time to time
This bot is also great for other optimalizations .
.
.
.
.
.
.
Enjoy

Cava Signals Backtesting/VisualizerPLEASE READ THE DESCRIPTION CAREFULLY
Trying this again, as it seems I keep violating the rules unintentionally. Moderator, please forgive me as I try to make this right.
This backtesting/visualizer script was created for me to get a visual idea of the Cava Signals indicator throughout its development time and continuous optimization.
This script is to be used on the 30-minute timeframe on supported markets, and whether I can only publish strategies on regular candles, the indicator is meant to trigger on heikin ashi candles.I understand backtesting on non-regular candles produces unrealistic results, but I emphasize that this script is more for visualization purposes rather than accurate $ amounts from the trades. The signals are used along with a dedicated bot configuration, so part of the strategy is not managed by the script, but by the bot's config.
Some behind the scenes on what we are looking at:
a combination of ema and sma crosses on different time frames (5m, 15m, 30m, 60m and 90m) - we call this the wave trend
a combination of stochastic rsi on different time frames (10m, 30m)
a combination of schaff trend cycles on different time frames (5m, 20m and 30m)
a combination of money flow index on different time frames (10m and 30m)
volume information for each supported market/pair
and a couple of other info particular to each pair
With the above combination of data points, we try to optimize our strategy for an entry, for dca'ing down in case the coin goes down as well as dca'ing up to maximize profit when a coin is going up, take profit levels when we recognize a good time to do so, and of course, a closing level. I would like to emphasize the *visualization* purpose of this script in recognizing lows, highs, and market structure to identify the important levels to signal - this script is NOT to be used for accurate backtesting, but for an idea of the overall performance of when signals are triggered.
Let me try to explain the workflow and icons you see on the chart:
The colored circles on the bottom of the chart are all buy signals; each color corresponds to a particular buy signal, we have a combination of 9 possible situations that would trigger a buy signal. Some would trigger a buy signal only in combination with other buy signals or other indicators within the script. we also display a green upwards arrow below bars when a buy signal is triggered.
The colored arrows pointing down on the top of the chart are close signals. We have a combination of 5 closing criteria each color corresponds to one, just like the buy signals do. We only close a trade in profit. If not in profit, we will look to DCA down.
DCA signals are shown by the green flag above bars. they are signals to DCA up or down depending on the trade being negative or positive. DCA'ing up or down is also managed by the bot's configuration for limits on when to accept the signal.
Take Profit levels are shown by the green diamond above bars and work in conjunction with the bot's config on when to take the signal if at all and other take profit levels. Usually, when we hit the first take profit level we move our stop loss to entry via the bot's take profit safety feature. You can see this call with the close entry named TPS .
The black bars you may see on the chart is to illustrate when the market is extended based on a particular strategy. During this period we will not trigger a buy signal unless there is a huge spike in positive volume .
The green number below the bars is the total positive delta volume on the buy candles.
On the table on the right upper corner, we show some information on the market and performance of the backtesting - for visualization purposes only!
Currently, the script is tailored to work with the following markets/pairs:
Binance Spot: ADA, ALGO, ATOM, AVAX, BNB, BTC , DOT, ETH, LINK, LUNA, MATIC, SOL, VET, XRP, XTZ
Binance Futures: BTC , ETH, ADA, ALGO, ATOM, BNB, COMP, DOT, ENJ , LINK, OCEAN, OMG, SOL, VET, XMR, XRP, XTZ, AVAX, AAVE, DOGE, LTC, LUNA, MKR , NEAR, ONT, RUNE, SUSHI, LTC, XLM , COMP, ONT, THETA, FTM , EGLD , WAVES, ONE, HTN , CHZ , HOT, MANA, CRV , RVN, BAT, ANKR, 1INCH, ALICE, ATA , AXS , CHR , COTI, NKN , RAY, REN, SRM , SXP , TLM
ByBit Inverse Perpetual: BTCUSD , ETHUSD
ByBit Futures: AAVE, ADA, ALGO, AVAX, AXS , BNB, BTC , DOT, ETH, LINK, LTC, MATIC, SOL, SUSHI, UNI , XEM, XRP, XTZ
The chosen pairs are subject to change based on the best-performing assets we are constantly analyzing.
I hope this helps to understand the script, its purpose and ideas. I hope this satisfies the community rules - it was not my intention to break them - if there's anything on the above or the script that still violates the guidelines, please let me know and accept my apologies in advance.
If anyone would like to know more, let me know in the comment section.
Thank you!

[Fedra Algotrading Strategy]English / Spanish
Algotrading strategy optimized for cryptocurrencies. Originally conceived to trade automatically through bots (that's how I use it), it also works to get signals and trade manually in any exchange.
It works in spot. It does not repaint. Works in 15M, 30M, 1H and 4H (I prefer short periods).
Features:
Buy the dip:
Attempts to buy on the dip, finding entries when the price makes abrupt dips that break the linear regression of the last periods (default 40).
Trailing Take Profit:
Once the percentage established for the take profit is reached, the strategy follows the price if it is rising until it stops rising and only then makes the sale.
Trend Detection:
Determines whether the market is in an uptrend or downtrend by crossing 2 SMAs. This affects the performance of the strategy. This works as a filter to avoid making entries in a downtrend.
Trailing Break Even:
If the market enters a downtrend with an open trade, a Trailing Break Even is triggered, (configurable, default 1.5%). The intention is to close the trade as soon as possible, but without losses. The value of 1.5% is intended to cover commission costs and a possible spread. Like the Take Profit, the Trailing Break Even follows the price as it rises until it stops doing so before closing the trade.
How to use this strategy?
In the properties of the strategy you assign the amount you will trade (default 100), the percentage of the total capital you will use in each trade (default 100%) and the value of the commissions (default 1%).
Select the pair to trade. The strategy is optimized for trading pairs with stable coins. The strategy benefits from volatility so choosing among currencies with a market cap between 50M and 10,000M gives better profits than with top 10 currencies.
In the strategy options, disable the stoploss by setting it to 100% to be able to concentrate on the Take Profit.
With an eye on the "Net Profit" of the strategy, start with the take profit at 3% (for lower percentages there is the Break Even) and increase it 1 by 1 until determining which is the best for our pair (the one that gives us a better net profit).
Once the Take Profit is established, enable the StopLoss starting from 1 and choosing the best parameter looking for the balance that makes us feel comfortable between the Net Profit and the total of closed operations.
Test this same with candles of different periods (I trade with 15M and 30M candles).
Tip:
To trade automatically using a bot, I recommend using pairs in which the strategy has a profitability higher than 80%.
To counteract possible overfitting, when the strategy has given me a 30% profit, I recalculate the optimal parameters.
If you are interested in auromatizing it to trade on Binance, Binance US, AAX, Kucoin, Liquid, Okex, Bitfinex, Bittrex, Coinbase Pro, Gemini, HitBTC, Kraken or Poloniex, I recommend using Quadency bots, they are free and the ones I use.
This will eventually be a paid script, but you can request free access for now.
I am still working on optimizations, improvements, and more features.
DCA version coming soon.
I leave some optimizations of the spares I am trading at the moment (On 15M candles):
PAIR SL TP Bars Profit Profit Rentability
OM 3 4 96 70 2703.41% 88.57%
NU 4 3 96 81 1170.38% 86.42%
ONE 4 4 192 83 756% 91.57%
FTM 8 4 192 80 900.00% 92.50%
LUNA 3 8 192 78 410.98% 83.33%
OMG 6 4 192 72 408.75% 88.89%
FRONT 2 5 96 61 406% 85.25%
SOL 5 10 96 84 381.78% 83.33%
UTK 2 4 192 59 520.00% 88.06%
NMR 2 3 96 76 279% 80.26%
STPT 1 4 96 84 272.34% 79.76%
ROSE 5 4 96 59 478.00% 88.00%
clv 4 5 192 46 216% 78.26%
XTZ 4 6 96 87 216.00% 82.76%
C98 1 6 96 36 184.46% 80.56%
ALGO 7 4 192 61 222.00% 88.52%
ATOM 6 4 96 73 160.40% 86.30%
DOT 3 6 96 75 156.54% 84%
REEF 4 4 96 67 154.90% 85.07%
AUDIO 10 5 192 62 128.48% 83.87%
DYDX 1 10 96 20 120.76% 90%
DOT 4 6 96 77 111.33% 83.12%
KEEP 7 5 96 69 110% 87%
MINA 7 6 96 23 100.29% 86.96%
OPUL 1 5 96 18 95.26% 100%
HBAR 1 3 192 76 91.82% 81.58%
VRA/USDT 7 4 96 81 89.35% 81.48%
XEC 3 14 96 27 89.24% 85.19%
*****************************************************SPANISH*****************************************
Estrategia de Algotrading optimizada para criptomonedas. Originalmente concebida para operar de manera automática mediante bots (así la utilizo yo), funciona también para obtener señales y operar manualmente en cualquier exchange.
Funciona en spot. No repinta. Funciona en 15M, 30M, 1H y 4H (Yo prefiero periodos cortos)
Características:
Buy the dip:
Intenta comprar en el dip, encontrando entradas cuando el precio hace bajadas abruptas que rompen la regresión lineal de los últimos periodos (por defecto 40)
Trailing Take Profit:
Una vez alcanzado el porcentaje establecido para el take profit, la estrategia acompaña al precio si está en ascenso hasta que deja de subir y recién ahí realiza la venta.
Detección de Trend:
Determina si el mercado tiene una tendencia alcista o bajista mediante el cruce de 2 SMAs. Esto afecta el funcionamiento de la estrategia. Esto funciona como filtro para evitar realizar entradas en una tendencia bajista.
Trailing Break Even:
Si el mercado entra en tendencia bajista con una operación abierta, se activa un Trailing Break Even, (configurable, por defecto 1.5%). La intención es cerrar la operación lo antes posible, pero sin pérdidas. El valor de 1.5% está pensado para cubrir los costos de comisiones y un posible spread. Al igual que el Take Profit, El Trailing Break Even acompaña al precio mientras sube hasta que deja de hacerlo antes de cerrar la operación.
Cómo utilizar esta estrategia?
En las propiedades de la estrategia se le asigna el monto con el que va a operar (por defecto 100), el porcentaje del total de capital que utilizará en cada operación (por defecto 100%) y el valor de las comisiones (por defecto 1%)
Seleccionar el par a operar. La estrategia está optimizada para operar en pares con stablecoins. La estrategia se beneficia con la volatilidad por lo que elegir entre las monedas con un market cap de entre 50M y 10.000M da mejores beneficios que con monedas del top 10
En las opciones de la estrategia, deshabilitar el stoploss configurándolo en 100% para poder concentrarnos en el Take Profit.
Con un ojo en el “Beneficio Neto” de la estrategia, comenzar con el take profit en 3% (para porcentajes menores está el Break Even) e ir aumentándolo de 1 en 1 hasta determinar cuál es el mejor para nuestro par (el que nos proporciona un major beneficio neto).
Establecido el Take Profit, habilitar el StopLoss partiendo de 1 y eligiendo el mejor parámetro buscando el equilibrio que nos haga sentir cómodos entre el Beneficio Neto y el total de operaciones cerradas.
Probar esto mismo con velas de diferentes periodos (Yo opero con velas de 15M y 30M)
Consejo:
Para operar de manera automática mediante un bot, recomiendo utilizar pares en los que la estrategia tenga una rentabilidad superior al 80%
Para contrarestar posible overfiting, cuando la estrategia me ha dado un 30% de profit, vuelvo a calcular los parámetros óptimos.
Si te interesa auromatizarla para operar en Binance, Binance US, AAX, Kucoin, Liquid, Okex, Bitfinex, Bittrex, Coinbase Pro, Gemini, HitBTC, Kraken o Poloniex, recomiendo usar los bots de Quadency, son gratiutos y los que yo utilizo.
Este será eventualmente un script pago, pero puedes solicitar acceso gratuito por ahora.
Sigo trabajando en optimizaciones, mejoras, y más funciones.
Próximamente versión DCA.
Dejo algunas optimizaciones de lo spares que yo estoy operando en este momento (En velas de 15M contra BUSD):
PAR SL TP Bars Operaciones Profit Rentabilidad
OM 3 4 96 70 2703.41% 88.57%
NU 4 3 96 81 1170.38% 86.42%
ONE 4 4 192 83 756% 91.57%
FTM 8 4 192 80 900.00% 92.50%
LUNA 3 8 192 78 410.98% 83.33%
OMG 6 4 192 72 408.75% 88.89%
FRONT 2 5 96 61 406% 85.25%
SOL 5 10 96 84 381.78% 83.33%
UTK 2 4 192 59 520.00% 88.06%
NMR 2 3 96 76 279% 80.26%
STPT 1 4 96 84 272.34% 79.76%
ROSE 5 4 96 59 478.00% 88.00%
clv 4 5 192 46 216% 78.26%
XTZ 4 6 96 87 216.00% 82.76%
C98 1 6 96 36 184.46% 80.56%
ALGO 7 4 192 61 222.00% 88.52%
ATOM 6 4 96 73 160.40% 86.30%
DOT 3 6 96 75 156.54% 84%
REEF 4 4 96 67 154.90% 85.07%
AUDIO 10 5 192 62 128.48% 83.87%
DYDX 1 10 96 20 120.76% 90%
DOT 4 6 96 77 111.33% 83.12%
KEEP 7 5 96 69 110% 87%
MINA 7 6 96 23 100.29% 86.96%
OPUL 1 5 96 18 95.26% 100%
HBAR 1 3 192 76 91.82% 81.58%
VRA/USDT 7 4 96 81 89.35% 81.48%
XEC 3 14 96 27 89.24% 85.19%

BTC botI made good money on this bot in last few month so i decided to donate it to community (its from my private bot collection) design for BTC mainly . it a great bot for longs , shity for shorts :)
no security in this bot so no repaint
the key issue in any bot design is to find good low , after you just exit by take profit
the exit strategy here is based on pivot system
entry is based on Low finder script (that i put as open script )
the Take profit system is based on Adolgov script
in reality main problem now is that bot cannot utilize signal from alerts .but we are working to fix this issue with a good that will come soon
this script is to show how to create a smart non repainting strategy using take profit and finding low as the key for it success
this strategy very good for bullish assets. may not work as well when we are on bearish trend so keep this in mind if you use it

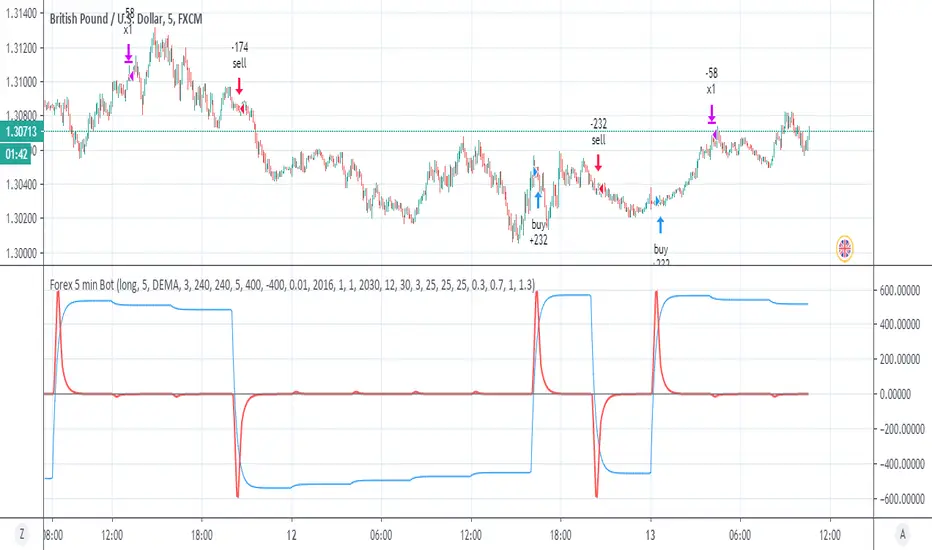
Forex 5 min BotBy request of freind made this bot for forex 5 min
it has 3 mode
non repaint at all (usless and not proftible) but no repaint at all:)
corected -attempt to correct some repaint
repainted -by using the method in ECG and MACD ECG
you can find detail explation about this there
here it the buy and sell are cross of close no repaint state(black line)
and the repaint state of the ECG bot model
and the brain is the MACD ECG model
there is peep take profit and stop lose +TS
you can try different options for this bot
I set it to forex 5 min chart on 4 hour MTF
the system is not free of some repaint that may exist
so my advice is to be coutios with this dodel and test it very before you decide to span mony on its decisions
for further detail please let me know either PM
or write bellow
so as the name imply it design for 5 min chart
if you want different chart you need to increase repaint control according to the candels
3 min=3
5min=5
15min=15
30min=30
45min=45
60min=60
choose any MTF you wish
the up and low have no meaning as we not use them like the ECG bot
Master Arb Recipes – 3 Commas signal Bot integration Master Arb Recipes – 3 Commas signal Bot integration
Purpose
A systematic arbitrage/accumulation framework with pre-tuned “recipes” for BTC/ETH/XRP/SUI/SOL plus a fully manual mode. It automates signal generation for external execution bots (via alert() JSON), while showing on-chart panels for goals, active parameters, DCA position, and P&L/ROI/CAGR. Backtests simulate market orders with optional slippage and TradingView commissions.
Key ideas
Entries: Intrabar trigger when price drops by the recipe’s Entry drop % from the previous close.
Exits: Profit-taking when price rises by the recipe’s Exit rise % (optionally requiring price above average cost).
DCA accounting: Tracks running quantity, average cost, realized (cash) P&L, and unrealized (coin) P&L.
Capital planning: “ReqCap” column estimates capital = Entry $ × Allowed entries (UI only; does not affect orders).
Alerts (live only): Sends minimal Custom Signal JSON for enter_long / exit_long to your execution bot.
What’s included on chart
Top-Right: Strategy Goals Table
Describes the objective for each preset. Auto-filters by the chart’s base (optional).
Bottom-Left: Active Recipe Panel (with 3C UI column)
Shows the active preset (or custom) with: timeframe, Sell-Above-Cost state, Entry/Exit %, Exit-as-%-of-Entry, min bars between entries, once-per-bar gate, and 3Commas UI guidance for optional filters and per-order dollars.
Top-Left: DCA Panel
Current base quantity, average cost, and realized P&L.
Bottom-Right: P&L + ROI/CAGR Panel
Cash P&L (realized), Coin P&L (unrealized), Total P&L, ROI since first fill, and annualized CAGR. Displays denominators for both StartCap (strategy.initial_capital) and ReqCap (planning).
Presets
BTC: STH1_D, LTH1_6H, LTH2_D, LTH3_W, LTH4_6H
ETH: STH1_D, STH2_D, LTH1_D
XRP: STH1_D, STH2_6H, LTH1_6H, LTH2_1H
SUI: STH1_D, STH2_D, STH3_D
SOL: STH1_D, LTH1_D
Each preset sets Entry drop %, Exit rise %, default Entry $, Exit-as-%-of-Entry, Sell-Above-Cost flag, and a reference timeframe (display only). Custom mode lets you define these manually.
Inputs you’ll use
3Commas Custom Signal: secret, bot_uuid, max_lag_sec.
Start Window: Exact date/time + timezone to begin trading/signals.
Entry/Exit Parameters: Entry drop %, Exit rise %, Sell Above Avg Cost toggle, Exit as % of Entry.
Capital Planning: Allowed entries (for ReqCap), Entry $ override (panel only).
Execution/Sim: Simulated slippage %, once-per-bar gate, minimum bars between entries, TradingView commission.
Panels: Toggles + positions for each table.
Alert / Bot integration
Alerts fire only in realtime (barstate.isrealtime) on order submission.
Create one alert on this script using “Any alert() function call”.
Payload (Custom Signal style) includes:
secret, bot_uuid, max_lag, timestamp, trigger_price, tv_exchange, tv_instrument, action where action ∈ {enter_long, exit_long}.
Sizing: This script does not include per-order sizing in the JSON; size in your bot UI. The on-chart Entry $ / Exit $ values are for planning/backtest display.
3Commas optional filter mapping (shown in the panel’s “3C UI” column):
Entry filters:
Same order: set to –EntryDrop% (ON)
From average entry: set to –EntryDrop% (ON)
Exit filters:
If Sell Above Cost = ON → From average entry +ExitRise% (ON); Same order OFF
If Sell Above Cost = OFF → Same order +ExitRise% (ON); From average entry OFF
Per-order volume: Use your bot’s UI. Panel shows the dollars you planned (Entry $ and Exit $).
Backtest notes & limitations
Uses calc_on_every_tick=true and intrabar checks against the previous close for entry drops; historical behavior won’t perfectly match exchange microstructure.
process_orders_on_close=false; fills are simulated at bar prices with your slippage setting and TV commission.
Alerts and webhook timing depend on TradingView + broker/exchange latencies; use max_lag_sec accordingly.
Required Capital (ReqCap) is for planning only and does not reserve funds or constrain orders.
Recommended markets/timeframes
Crypto spot or futures charts that trade 24/7. Preset labels (D/6H/1H/W) are reference rhythms for volatility; the script runs on any timeframe but results will vary.
Change log (04092025)
Added 3C UI guidance column in Active Recipe panel (dynamic % per recipe).
Restored Goals (top-right) and P&L/ROI/CAGR (bottom-right with StartCap & ReqCap).
Minor UI clarifications; trading logic unchanged.
Disclaimer
This script is for research and education. It is not financial advice and makes no performance promises. Backtests are hypothetical and subject to substantial limitations. Markets involve risk; you can lose capital. Test on paper first and deploy at your own discretion. Licensed under the Mozilla Public License 2.0.

Ultimate Trading BotHow the "Ultimate Trading Bot" Works:
This Pine Script trading bot executes buy and sell trades based on a combination of technical indicators:
Indicators Used:
RSI (Relative Strength Index)
Measures momentum and determines overbought (70) and oversold (30) levels.
A crossover above 30 suggests a potential buy, and a cross below 70 suggests a potential sell.
Moving Average (MA)
A simple moving average (SMA) of 50 periods to track the trend.
Prices above the MA indicate an uptrend, while prices below indicate a downtrend.
Stochastic Oscillator (%K and %D)
Identifies overbought and oversold conditions using a smoothed stochastic formula.
A crossover of %K above %D signals a buy, and a crossover below %D signals a sell.
MACD (Moving Average Convergence Divergence)
Uses a 12-period fast EMA and a 26-period slow EMA, with a 9-period signal line.
A crossover of MACD above the signal line suggests a bullish move, and a cross below suggests bearish movement.
Trade Execution:
Buy (Long Entry) Conditions:
RSI crosses above 30 (indicating recovery from an oversold state).
The closing price is above the 50-period moving average (showing an uptrend).
The MACD line crosses above the signal line (indicating upward momentum).
The Stochastic %K crosses above %D (indicating bullish momentum).
→ If all conditions are met, the bot enters a long (buy) position.
Sell (Exit Trade) Conditions:
RSI crosses below 70 (indicating overbought conditions).
The closing price is below the 50-period moving average (downtrend).
The MACD line crosses below the signal line (bearish signal).
The Stochastic %K crosses below %D (bearish momentum).
→ If all conditions are met, the bot closes the long position.
Visuals:
The bot plots the moving average, RSI, MACD, and Stochastic indicators for reference.
It also displays buy/sell signals with arrows:
Green arrow (Buy Signal) → When all buy conditions are met.
Red arrow (Sell Signal) → When all sell conditions are met.
How to Use It in TradingView:

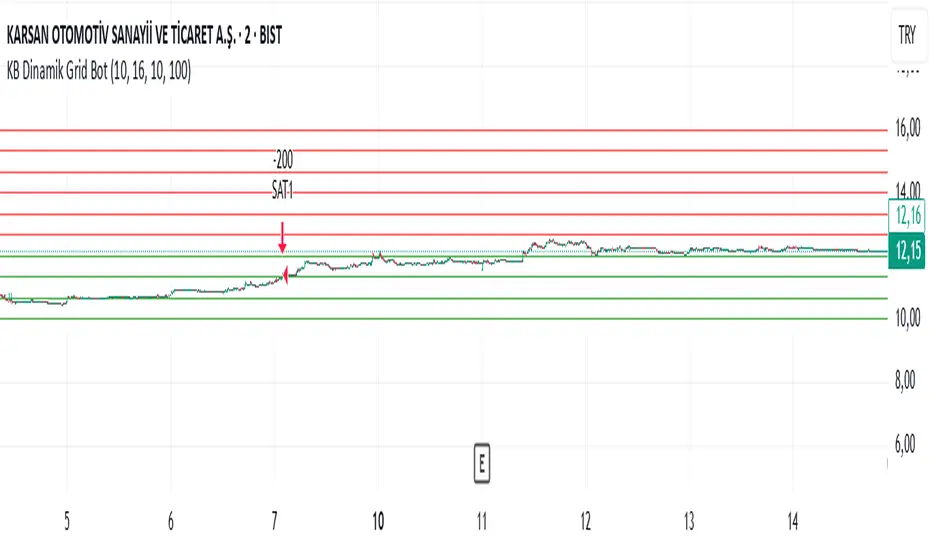
KB Dinamik Grid Bot V8 TrailingThis Pine Script code aims to create a "Dynamic Grid Trading Bot" and perform automatic trading between price ranges. Let's break it down into sections to better understand its functions:
1. Settings and User Inputs
The user can specify the following parameters for the bot:
Lower and Upper Price Limit: Determines the price range where the grid levels are defined.
Number of Grid Lines: Defines how many levels the grid will consist of.
Transaction Amount: Specifies the trading volume for each trading transaction.
Start Date: The date when the bot will start trading.
Price Step (priceStep): Specifies specific steps after the comma to adjust the grid levels more precisely.
Trailing: A feature that activates dynamic selling by following price movements.
2. Calculating Grid Levels
Grid levels: Divides the specified price range into user-defined levels and rounds each level with priceStep.
Lines and labels: Lines and labels are created to visually represent grid levels.
3. Buying and Selling Logic
Buying Transaction: When the price approaches a lower grid level (as much as the offset) and the position is empty, a purchase is made.
Trailing Selling: If Trailing is active, a sale is made when the price passes the specified "trailing step" level.
Normal Selling: If Trailing is not active, a sale is made when the price approaches an upper grid level.
4. Profit and Statistics Tracking
The bot tracks the profit-loss status per transaction and in total.
The number of purchases and sales and net profit information are calculated from the start date.
5. Table Display
The bot places statistical data in a table:
Number of purchases and sales.
Starting date.
Total number of transactions.
Net profit.
Amount of open positions.
6. Drawing and Tracking
Each price movement is updated and the color of the grid lines (green or red) is changed depending on the price's status relative to the level.
This code is a strategy that aims to make a profit by continuously buying and selling in the event of price fluctuations within a range. The "Trailing" feature allows you to keep your profits when the price moves upwards. Net profit, open positions and other statistics are displayed in the table.
Titan Investments|Quantitative THEMIS|Pro|BINANCE:BTCUSDTP:4hInvestment Strategy (Quantitative Trading)
| 🛑 | Watch "LIVE" and 'COPY' this strategy in real time:
🔗 Link: www.tradingview.com
Hello, welcome, feel free 🌹💐
Since the stone age to the most technological age, one thing has not changed, that which continues impress human beings the most, is the other human being!
Deep down, it's all very simple or very complicated, depends on how you look at it.
I believe that everyone was born to do something very well in life.
But few are those who have, let's use the word 'luck' .
Few are those who have the 'luck' to discover this thing.
That is why few are happy and successful in their jobs and professions.
Thank God I had this 'luck' , and discovered what I was born to do well.
And I was born to program. 👨💻
📋 Summary : Project Titan
0️⃣ : 🦄 Project Titan
1️⃣ : ⚖️ Quantitative THEMIS
2️⃣ : 🏛️ Titan Community
3️⃣ : 👨💻 Who am I ❔
4️⃣ : ❓ What is Statistical/Probabilistic Trading ❓
5️⃣ : ❓ How Statistical/Probabilistic Trading works ❓
6️⃣ : ❓ Why use a Statistical/Probabilistic system ❓
7️⃣ : ❓ Why the human brain is not prepared to do Trading ❓
8️⃣ : ❓ What is Backtest ❓
9️⃣ : ❓ How to build a Consistent system ❓
🔟 : ❓ What is a Quantitative Trading system ❓
1️⃣1️⃣ : ❓ How to build a Quantitative Trading system ❓
1️⃣2️⃣ : ❓ How to Exploit Market Anomalies ❓
1️⃣3️⃣ : ❓ What Defines a Robust, Profitable and Consistent System ❓
1️⃣4️⃣ : 🔧 Fixed Technical
1️⃣5️⃣ : ❌ Fixed Outputs : 🎯 TP(%) & 🛑SL(%)
1️⃣6️⃣ : ⚠️ Risk Profile
1️⃣7️⃣ : ⭕ Moving Exits : (Indicators)
1️⃣8️⃣ : 💸 Initial Capital
1️⃣9️⃣ : ⚙️ Entry Options
2️⃣0️⃣ : ❓ How to Automate this Strategy ❓ : 🤖 Automation : 'Third-Party Services'
2️⃣1️⃣ : ❓ How to Automate this Strategy ❓ : 🤖 Automation : 'Exchanges
2️⃣2️⃣ : ❓ How to Automate this Strategy ❓ : 🤖 Automation : 'Messaging Services'
2️⃣3️⃣ : ❓ How to Automate this Strategy ❓ : 🤖 Automation : '🧲🤖Copy-Trading'
2️⃣4️⃣ : ❔ Why be a Titan Pro 👽❔
2️⃣5️⃣ : ❔ Why be a Titan Aff 🛸❔
2️⃣6️⃣ : 📋 Summary : ⚖️ Strategy: Titan Investments|Quantitative THEMIS|Pro|BINANCE:BTCUSDTP:4h
2️⃣7️⃣ : 📊 PERFORMANCE : 🆑 Conservative
2️⃣8️⃣ : 📊 PERFORMANCE : Ⓜ️ Moderate
2️⃣9️⃣ : 📊 PERFORMANCE : 🅰 Aggressive
3️⃣0️⃣ : 🛠️ Roadmap
3️⃣1️⃣ : 🧻 Notes ❕
3️⃣2️⃣ : 🚨 Disclaimer ❕❗
3️⃣3️⃣ : ♻️ ® No Repaint
3️⃣4️⃣ : 🔒 Copyright ©️
3️⃣5️⃣ : 👏 Acknowledgments
3️⃣6️⃣ : 👮 House Rules : 📺 TradingView
3️⃣7️⃣ : 🏛️ Become a Titan Pro member 👽
3️⃣8️⃣ : 🏛️ Be a member Titan Aff 🛸
0️⃣ : 🦄 Project Titan
This is the first real, 100% automated Quantitative Strategy made available to the public and the pinescript community for TradingView.
You will be able to automate all signals of this strategy for your broker , centralized or decentralized and also for messaging services : Discord, Telegram or Twitter .
This is the first strategy of a larger project, in 2023, I will provide a total of 6 100% automated 'Quantitative' strategies to the pinescript community for TradingView.
The future strategies to be shared here will also be unique , never before seen, real 'Quantitative' bots with real, validated results in real operation.
Just like the 'Quantitative THEMIS' strategy, it will be something out of the loop throughout the pinescript/tradingview community, truly unique tools for building mutual wealth consistently and continuously for our community.
1️⃣ : ⚖️ Quantitative THEMIS : Titan Investments|Quantitative THEMIS|Pro|BINANCE:BTCUSDTP:4h
This is a truly unique and out of the curve strategy for BTC /USD .
A truly real strategy, with real, validated results and in real operation.
A unique tool for building mutual wealth, consistently and continuously for the members of the Titan community.
Initially we will operate on a monthly, quarterly, annual or biennial subscription service.
Our goal here is to build a great community, in exchange for an extremely fair value for the use of our truly unique tools, which bring and will bring real results to our community members.
With this business model it will be possible to provide all Titan users and community members with the purest and highest degree of sophistication in the market with pinescript for tradingview, providing unique and truly profitable strategies.
My goal here is to offer the best to our members!
The best 'pinescript' tradingview service in the world!
We are the only Start-Up in the world that will decentralize real and full access to truly real 'quantitative' tools that bring and will bring real results for mutual and ongoing wealth building for our community.
2️⃣ : 🏛️ Titan Community : 👽 Pro 🔁 Aff 🛸
Become a Titan Pro 👽
To get access to the strategy: "Quantitative THEMIS" , and future Titan strategies in a 100% automated way, along with all tutorials for automation.
Pro Plans: 30 Days, 90 Days, 12 Months, 24 Months.
👽 Pro 🅼 Monthly
👽 Pro 🆀 Quarterly
👽 Pro🅰 Annual
👽 Pro👾Two Years
You will have access to a truly unique system that is out of the curve .
A 100% real, 100% automated, tested, validated, profitable, and in real operation strategy.
Become a Titan Affiliate 🛸
By becoming a Titan Affiliate 🛸, you will automatically receive 50% of the value of each new subscription you refer .
You will receive 50% for any of the above plans that you refer .
This way we will encourage our community to grow in a fair and healthy way, because we know what we have in our hands and what we deliver real value to our users.
We are at the highest level of sophistication in the market, the consistency here and the results here speak for themselves.
So growing our community means growing mutual wealth and raising collective conscience.
Wealth must be created not divided.
And here we are creating mutual wealth on all ends and in all ways.
A non-zero sum system, where everybody wins.
3️⃣ : 👨💻 Who am I ❔
My name is FilipeSoh I am 26 years old, Technical Analyst, Trader, Computer Engineer, pinescript Specialist, with extensive experience in several languages and technologies.
For the last 4 years I have been focusing on developing, editing and creating pinescript indicators and strategies for Tradingview for people and myself.
Full-time passionate workaholic pinescript developer with over 10,000 hours of pinescript development.
• Pinescript expert ▬Tradingview.
• Specialist in Automated Trading
• Specialist in Quantitative Trading.
• Statistical/Probabilistic Trading Specialist - Mark Douglas Scholl.
• Inventor of the 'Classic Forecast' Indicators.
• Inventor of the 'Backtest Table'.
4️⃣ : ❓ What is Statistical/Probabilistic Trading ❓
Statistical/probabilistic trading is the only way to get a positive mathematical expectation regarding the market and consequently that is the only way to make money consistently from it.
I will present below some more details about the Quantitative THEMIS strategy, it is a real strategy, tested, validated and in real operation, 'Skin in the Game' , a consistent way to make money with statistical/probabilistic trading in a 100% automated.
I am a Technical Analyst , I used to be a Discretionary Trader , today I am 100% a Statistical Trader .
I've gotten rich and made a lot of money, and I've also lost a lot with 'leverage'.
That was a few years ago.
The book that changed everything for me was "Trading in The Zone" by Mark Douglas.
That's when I understood that the market is just a game of statistics and probability, like a casino!
It was then that I understood that the human brain is not prepared for trading, because it involves triggers and mental emotions.
And emotions in trading and in making trading decisions do not go well together, not in the long run, because you always have the burden of being wrong with the outcome of that particular position.
But remembering that the market is just a statistical game!
5️⃣ : ❓ How Statistical/Probabilistic Trading works ❓
Let's use a 'coin' as an example:
If we toss a 'coin' up 10 times.
Do you agree that it is impossible for us to know exactly the result of the 'plays' before they actually happen?
As in the example above, would you agree, that we cannot "guess" the outcome of a position before it actually happens?
As much as we cannot "guess" whether the coin will drop heads or tails on each flip.
We can analyze the "backtest" of the 10 moves made with that coin:
If we analyze the 10 moves and count the number of times the coin fell heads or tails in a specific sequence, we then have a percentage of times the coin fell heads or tails, so we have a 'backtest' of those moves.
Then on the next flip we can now assume a point or a favorable position for one side, the side with the highest probability .
In a nutshell, this is more or less how probabilistic statistical trading works.
As Statistical Traders we can never say whether such a Trader/Position we take will be a winner or a loser.
But still we can have a positive and consistent result in a "sequence" of trades, because before we even open a position, backtests have already been performed so we identify an anomaly and build a system that will have a positive statistical advantage in our favor over the market.
The advantage will not be in one trade itself, but in the "sequence" of trades as a whole!
Because our system will work like a casino, having a positive mathematical expectation relative to the players/market.
Design, develop, test models and systems that can take advantage of market anomalies, until they change.
Be the casino! - Mark Douglas
6️⃣ : ❓ Why use a Statistical/Probabilistic system ❓
In recent years I have focused and specialized in developing 100% automated trading systems, essentially for the cryptocurrency market.
I have developed many extremely robust and efficient systems, with positive mathematical expectation towards the market.
These are not complex systems per se , because here we want to avoid 'over-optimization' as much as possible.
As Da Vinci said: "Simplicity is the highest degree of sophistication".
I say this because I have tested, tried and developed hundreds of systems/strategies.
I believe I have programmed more than 10,000 unique indicators/strategies, because this is my passion and purpose in life.
I am passionate about what I do, completely!
I love statistical trading because it is the only way to get consistency in the long run!
This is why I have studied, applied, developed, and specialized in 100% automated cryptocurrency trading systems.
The reason why our systems are extremely "simple" is because, as I mentioned before, in statistical trading we want to exploit the market anomaly to the maximum, that is, this anomaly will change from time to time, usually we can exploit a trading system efficiently for about 6 to 12 months, or for a few years, that is; for fixed 'scalpers' systems.
Because at some point these anomalies will be identified , and from the moment they are identified they will be exploited and will stop being anomalies .
With the system presented here; you can even copy the indicators and input values shared here;
However; what I have to offer you is: it is me , our team , and our community !
That is, we will constantly monitor this system, for life , because our goal here is to create a unique , perpetual , profitable , and consistent system for our community.
Myself , our team and our community will keep this script periodically updated , to ensure the positive mathematical expectation of it.
So we don't mind sharing the current parameters and values , because the real value is also in the future updates that this system will receive from me and our team , guided by our culture and our community of real users !
As we are hosted on 'tradingview', all future updates for this strategy, will be implemented and updated automatically on your tradingview account.
What we want here is: to make sure you get gains from our system, because if you get gains , our ecosystem will grow as a whole in a healthy and scalable way, so we will be generating continuous mutual wealth and raising the collective consciousness .
People Need People: 3️⃣🅿
7️⃣ : ❓ Why the human brain is not prepared to do Trading ❓
Today my greatest skill is to develop statistically profitable and 100% automated strategies for 'pinescript' tradingview.
Note that I said: 'profitable' because in fact statistical trading is the only way to make money in a 'consistent' way from the market.
And consequently have a positive wealth curve every cycle, because we will be based on mathematics, not on feelings and news.
Because the human brain is not prepared to do trading.
Because trading is connected to the decision making of the cerebral cortex.
And the decision making is automatically linked to emotions, and emotions don't match with trading decision making, because in those moments, we can feel the best and also the worst sensations and emotions, and this certainly affects us and makes us commit grotesque mistakes!
That's why the human brain is not prepared to do trading.
If you want to participate in a fully automated, profitable and consistent trading system; be a Titan Pro 👽
I believe we are walking an extremely enriching path here, not only in terms of financial returns for our community, but also in terms of knowledge about probabilistic and automated statistical trading.
You will have access to an extremely robust system, which was built upon very strong concepts and foundations, and upon the world's main asset in a few years: Bitcoin .
We are the tip of the best that exists in the cryptocurrency market when it comes to probabilistic and automated statistical trading.
Result is result! Me being dressed or naked.
This is just the beginning!
But there is a way to consistently make money from the market.
Being the Casino! - Mark Douglas
8️⃣ : ❓ What is Backtest ❓
Imagine the market as a purely random system, but even in 'randomness' there are patterns.
So now imagine the market and statistical trading as follows:
Repeating the above 'coin' example, let's think of it as follows:
If we toss a coin up 10 times again.
It is impossible to know which flips will have heads or tails, correct?
But if we analyze these 10 tosses, then we will have a mathematical statistic of the past result, for example, 70 % of the tosses fell 'heads'.
That is:
7 moves fell on "heads" .
3 moves fell on "tails" .
So based on these conditions and on the generic backtest presented here, we could adopt " heads " as our system of moves, to have a statistical and probabilistic advantage in relation to the next move to be performed.
That is, if you define a system, based on backtests , that has a robust positive mathematical expectation in relation to the market you will have a profitable system.
For every move you make you will have a positive statistical advantage in your favor over the market before you even make the move.
Like a casino in relation to all its players!
The casino does not have an advantage over one specific player, but over all players, because it has a positive mathematical expectation about all the moves that night.
The casino will always have a positive statistical advantage over its players.
Note that there will always be real players who will make real, million-dollar bankrolls that night, but this condition is already built into the casino's 'strategy', which has a pre-determined positive statistical advantage of that night as a whole.
Statistical trading is the same thing, as long as you don't understand this you will keep losing money and consistently.
9️⃣ : ❓ How to build a Consistent system ❓
See most traders around the world perform trades believing that that specific position taken will make them filthy rich, because they simply believe faithfully that the position taken will be an undoubted winner, based on a trader's methodology: 'trading a trade' without analyzing the whole context, just using 'empirical' aspects in their system.
But if you think of trading, as a sequence of moves.
You see, 'a sequence' !
When we think statistically, it doesn't matter your result for this , or for the next specific trade , but the final sequence of trades as a whole.
As the market has a random system of results distribution , if your system has a positive statistical advantage in relation to the market, at the end of that sequence you'll have the biggest probability of having a winning bank.
That's how you do real trading!
And with consistency!
Trading is a long term game, but when you change the key you realize that it is a simple game to make money in a consistent way from the market, all you need is patience.
Even more when we are based on Bitcoin, which has its 'Halving' effect where, in theory, we will never lose money in 3 to 4 years intervals, due to its scarcity and the fact that Bitcoin is the 'discovery of digital scarcity' which makes it the digital gold, we believe in this thesis and we follow Satoshi's legacy.
So align Bitcoin with a probabilistic statistical trading system with a positive mathematical expectation of the market and 100% automated with the long term, and all you need is patience, and you will become rich.
In fact Bitcoin by itself is already a path, buy, wait for each halving and your wealth will be maintained.
No inflation, unlike fiat currencies.
This is a complete and extremely robust strategy, with the most current possible and 'not possible' techniques involved and applied here.
Today I am at another level in developing 100% automated 'quantitative' strategies.
I was born for this!
🔟 : ❓ What is a Quantitative Trading system ❓
In addition to having access to a revolutionary strategy you will have access to disruptive 100% multifunctional tables with the ability to perform 'backtests' for better tracking and monitoring of your system on a customized basis.
I would like to emphasize one thing, and that is that you keep this in mind.
Today my greatest skill in 'pinescript' is to build indicators, but mainly strategies, based on statistical and probabilistic trading, with a postive mathematical expectation in relation to the market, in a 100% automated way.
This with the goal of building a consistent and continuous positive equity curve through mathematics using data, converting it into statistical / probabilistic parameters and applying them to a Quantitative model.
Before becoming a Quantitative Trader , I was a Technical Analyst and a Discretionary Trader .
First as a position trader and then as a day trader.
Before becoming a Trader, I trained myself as a Technical Analyst , to masterly understand the shape and workings of the market in theory.
But everything changed when I met 'Mark Douglas' , when I got to know his works, that's when my head exploded 🤯, and I started to understand the market for good!
The market is nothing more than a 'random' system of distributing results.
See that I said: 'random' .
Do yourself a mental exercise.
Is there really such a thing as random ?
I believe not, as far as we know maybe the 'singularity'.
So thinking this way, to translate, the market is nothing more than a game of probability, statistics and pure mathematics.
Like a casino!
What happens is that most traders, whenever they take a position, take it with all the empirical certainty that such position will win or lose, and do not take into consideration the total sequence of results to understand their place in the market.
Understanding your place in the market gives you the ability to create and design systems that can exploit the present market anomaly, and thus make money statistically, consistently, and 100% automated.
Thinking of it this way, it is easy to make money from the market.
There are many ways to make money from the market, but the only consistent way I know of is through 'probabilistic and automated statistical trading'.
1️⃣1️⃣ : ❓ How to build a Quantitative Trading system ❓
There are some fundamental points that must be addressed here in order to understand what makes up a system based on statistics and probability applied to a quantitative model.
When we talk about 'discretionary' trading, it is a trading system based on human decisions after the defined 'empirical' conditions are met.
It is quite another thing to build a fully automated system without any human interference/interaction .
That said:
Building a statistically profitable system is perfectly possible, but this is a high level task , but with possible high rewards and consistent gains.
Here you will find a real "Skin In The Game" strategy.
With all due respect, but the vast majority of traders who post strategies on TradingView do not understand what they are doing.
Most of them do not understand the minimum complexity involved in the main variable for the construction of a real strategy, the mother variable: "strategy".
I say this by my own experience, because I have analyzed practically all the existing publications of TradingView + 200,000 indicators and strategies.
I breathe pinescript, I eat pinescript, I sleep pinescript, I bathe pinescript, I live TradingView.
But the main advantage for the TradingView users, is that all entry and exit orders made by this strategy can be checked and analyzed thoroughly, to validate and prove the veracity of this strategy, because this is a 100% real strategy.
Here there is a huge world of possibilities, but only one way to build a 'pinescript strategy' that will work correctly aligned to the real world with real results .
There are some fundamental points to take into consideration when building a profitable trading system:
The most important of these for me is: 'DrawDown' .
Followed by: 'Hit Rate' .
And only after that we use the parameter: 'Profit'.
See, this is because here, we are dealing with the 'imponderable' , and anything can happen in this scenario.
But there is one thing that makes us sleep peacefully at night, and that is: controlling losses .
That is, in other words: controlling the DrawDown .
The amateur is concerned with 'winning', the professional is concerned with conserving capital.
If we have the losses under control, then we can move on to the other two parameters: hit rate and profit.
See, the second most important factor in building a system is the hit rate.
I say this from my own experience.
I have worked with many systems with a 'low hit rate', but extremely profitable.
For example: systems with hit rates of 40 to 50%.
But as much as statistically and mathematically the profit is rewarding, operating systems with a low hit rate is always very stressful psychologically.
That's why there are two big reasons why when I build an automated trading system, I focus on the high hit rate of the system, they are
1 - To reduce psychological damage as much as possible .
2 - And more important , when we create a system with a 'high hit rate' , there is a huge intrinsic advantage here, that most statistic traders don't take in consideration.
That is: knowing more quickly when the system stops being functional.
The main advantage of a system with a high hit rate is: to identify when the system stops being functional and stop exploiting the market's anomaly.
Look: When we are talking about trading and random distribution of results on the market, do you agree that when we create a trading system, we are focused on exploring some anomaly of that market?
When that anomaly is verified by the market, it will stop being functional with time.
That's why trading systems, 'scalpers', especially for cryptocurrencies, need constant monitoring, quarterly, semi-annually or annually.
Because market movements change from time to time.
Because we go through different cycles from time to time, such as congestion cycles, accumulation , distribution , volatility , uptrends and downtrends .
1️⃣2️⃣ : ❓ How to Exploit Market Anomalies ❓
You see there is a very important point that must be stressed here.
As we are always trying to exploit an 'anomaly' in the market.
So the 'number' of indicators/tools that will integrate the system is of paramount importance.
But most traders do not take this into consideration.
To build a professional, robust, consistent, and profitable system, you don't need to use hundreds of indicators to build your setup.
This will actually make it harder to read when the setup stops working and needs some adjustment.
So focusing on a high hit rate is very important here, this is a fundamental principle that is widely ignored , and with a high hit rate, we can know much more accurately when the system is no longer functional much faster.
As Darwin said: "It is not the strongest or the most intelligent that wins the game of life, it is the most adapted.
So simple systems, as contradictory as it may seem, are more efficient, because they help to identify inflection points in the market much more quickly.
1️⃣3️⃣ : ❓ What Defines a Robust, Profitable and Consistent System ❓
See I have built, hundreds of thousands of indicators and 'pinescript' strategies, hundreds of thousands.
This is an extremely professional, robust and profitable system.
Based on the currency pairs: BTC /USDT
There are many ways and avenues to build a profitable trading setup/system.
And actually this is not a difficult task, taking in consideration, as the main factor here, that our trading and investment plan is for the long term, so consequently we will face scenarios with less noise.
He who is in a hurry eats raw.
As mentioned before.
Defining trends in pinescript is technically a simple task, the hardest task is to determine congestion zones with low volume and volatility, it's in these moments that many false signals are generated, and consequently is where most setups face their maximum DrawDown.
That's why this strategy was strictly and thoroughly planned, built on a very solid foundation, to avoid as much noise as possible, for a positive and consistent equity curve in each market cycle, 'Consistency' is our 'Mantra' around here.
1️⃣4️⃣ : 🔧 Fixed Technical
• Strategy: Titan Investments|Quantitative THEMIS|Pro|BINANCE:BTCUSDTP:4h
• Pair: BTC/USDTP
• Time Frame: 4 hours
• Broker: Binance (Recommended)
For a more conservative scenario, we have built the Quantitative THEMIS for the 4h time frame, with the main focus on consistency.
So we can avoid noise as much as possible!
1️⃣5️⃣ : ❌ Fixed Outputs : 🎯 TP(%) & 🛑SL(%)
In order to build a 'perpetual' system specific to BTC/USDT, it took a lot of testing, and more testing, and a lot of investment and research.
There is one initial and fundamental point that we can address to justify the incredible consistency presented here.
That fundamental point is our exit via Take Profit or Stop Loss percentage (%).
🎯 Take Profit (%)
🛑 Stop Loss (%)
See, today I have been testing some more advanced backtesting models for some cryptocurrency systems.
In which I perform 'backtest of backtest', i.e. we use a set of strategies each focused on a principle, operating individually, but they are part of something unique, i.e. we do 'backtests' of 'backtests' together.
What I mean is that we do a lot of backtesting around here.
I can assure you, that always the best output for a trading system is to set fixed output values!
In other words:
🎯 Take Profit (%)
🛑 Stop Loss (%)
This happens because statistically setting fixed exit structures in the vast majority of times, presents a superior result on the capital/equity curve, throughout history and for the vast majority of setups compared to other exit methods.
This is due to a mathematical principle of simplicity, 'avoiding more noise'.
Thus whenever the Quantitative THEMIS strategy takes a position it has a target and a defined maximum stop percentage.
1️⃣6️⃣ : ⚠️ Risk Profile
The strategy, currently has 3 risk profiles ⚠️ patterns for 'fixed percentage exits': Take Profit (%) and Stop Loss (%) .
They are: ⚠️ Rich's Profiles
✔️🆑 Conservative: 🎯 TP=2.7 % 🛑 SL=2.7 %
❌Ⓜ️ Moderate: 🎯 TP=2.8 % 🛑 SL=2.7 %
❌🅰 Aggressive: 🎯 TP=1.6 % 🛑 SL=6.9 %
You will be able to select and switch between the above options and profiles through the 'input' menu of the strategy by navigating to the "⚠️ Risk Profile" menu.
You can then select, test and apply the Risk Profile above that best suits your risk management, expectations and reality , as well as customize all the 'fixed exit' values through the TP and SL menus below.
1️⃣7️⃣ : ⭕ Moving Exits : (Indicators)
The strategy currently also has 'Moving Exits' based on indicator signals.
These are Moving Exits (Indicators)
📈 LONG : (EXIT)
🧃 (MAO) Short : true
📉 SHORT : (EXIT)
🧃 (MAO) Long: false
You can select and toggle between the above options through the 'input' menu of the strategy by navigating to the "LONG : Exit" and "SHORT : Exit" menu.
1️⃣8️⃣ : 💸 Initial Capital
By default the "Initial Capital" set for entries and backtests of this strategy is: 10000 $
You can set another value for the 'Starting Capital' through the tradingview menu under "properties" , and edit the value of the "Initial Capital" field.
This way you can set and test other 'Entry Values' for your trades, tests and backtests.
1️⃣9️⃣ : ⚙️ Entry Options
By default the 'order size' set for this strategy is 100 % of the 'initial capital' on each new trade.
You can set and test other entry options like : contracts , cash , % of equity
You should make these changes directly in the input menu of the strategy by navigating to the menu "⚙️ Properties : TradingView" below.
⚙️ Properties : (TradingView)
📊 Strategy Type: strategy.position_size != 1
📝💲 % Order Type: % of equity
📝💲 % Order Size: 100
Leverage: 1
So you can define and test other 'Entry Options' for your trades, tests and backtests.
2️⃣0️⃣ : ❓ How to Automate this Strategy ❓ : 🤖 Automation : 'Third-Party Services'
It is possible to automate the signals of this strategy for any centralized or decentralized broker, as well as for messaging services: Discord, Telegram and Twitter.
All in an extremely simple and uncomplicated way through the tutorials available in PDF /VIDEO for our Titan Pro 👽 subscriber community.
With our tutorials in PDF and Video it will be possible to automate the signals of this strategy for the chosen service in an extremely simple way with less than 10 steps only.
Tradingview naturally doesn't count with native integration between brokers and tradingview.
But it is possible to use 'third party services' to do the integration and automation between Tradingview and your centralized or decentralized broker.
Here are the standard, available and recommended 'third party services' to automate the signals from the 'Quantitative THEMIS' strategy on the tradingview for your broker:
1) Wundertrading (Recommended):
2) 3commas:
3) Zignaly:
4) Aleeert.com (Recommended):
5) Alertatron:
Note! 'Third party services' cannot perform 'withdrawals' via their key 'API', they can only open positions, so your funds will always be 'safe' in your brokerage firm, being traded via the 'API', when they receive an entry and exit signal from this strategy.
2️⃣1️⃣ : ❓ How to Automate this Strategy ❓ : 🤖 Automation : 'Exchanges
You can automate this strategy for any of the brokers below, through your broker's 'API' by connecting it to the 'third party automation services' for tradingview available and mentioned in the menu above:
1) Binance (Recommended)
2) Bitmex
3) Bybit
4) KuCoin
5) Deribit
6) OKX
7) Coinbase
8) Huobi
9) Bitfinex
10) Bitget
11) Bittrex
12) Bitstamp
13) Gate. io
14) Kraken
15) Gemini
16) Ascendex
17) VCCE
2️⃣2️⃣ : ❓ How to Automate this Strategy ❓ : 🤖 Automation : 'Messaging Services'
You can also automate and monitor the signals of this strategy much more efficiently by sending them to the following popular messaging services:
1) Discord
2) Telegram
3) Twitter
2️⃣3️⃣ : ❓ How to Automate this Strategy ❓ : 🤖 Automation : '🧲🤖Copy-Trading'
It will also be possible to copy/replicate the entries and exits of this strategy to your broker in an extremely simple and agile way, through the available copy-trader services.
This way it will be possible to replicate the signals of this strategy at each entry and exit to your broker through the API connecting it to the integrated copy-trader services available through the tradingview automation services below:
1) Wundetrading:
2) Zignaly:
2️⃣4️⃣ : ❔ Why be a Titan Pro 👽❔
I believe that today I am at another level in 'pinescript' development.
I consider myself today a true unicorn as a pinescript developer, someone unique and very rare.
If you choose another tool or another pinescript service, this tool will be just another one, with no real results.
But if you join our Titan community, you will have access to a unique tool! And you will get real results!
I already earn money consistently with statistical and automated trading and as an expert pinescript developer.
I am here to evolve my skills as much as possible, and one day become a pinescript 'Wizard'.
So excellence, quality and professionalism will always be my north here.
You will never find a developer like me, and who will take so seriously such a revolutionary project as this one. A Maverick! ▬ The man never stops!
Here you will find the highest degree of sophistication and development in the market for 'pinescript'.
You will get the best of me and the best of pinescript possible.
Let me show you how a professional in my field does it.
Become a Titan Pro Member 👽 and get Full Access to this strategy and all the Automation Tutorials.
Be the Titan in your life!
2️⃣5️⃣ : ❔ Why be a Titan Aff 🛸❔
Get financial return for your referrals, Decentralize the World, and raise the collective consciousness.
2️⃣6️⃣ : 📋 Summary : ⚖️ Strategy: Titan Investments|Quantitative THEMIS|Pro|BINANCE:BTCUSDTP:4h
® Titan Investimentos | Quantitative THEMIS ⚖️ | Pro 👽 2.6 | Dev: © FilipeSoh 🧙 | 🤖 100% Automated : Discord, Telegram, Twitter, Wundertrading, 3commas, Zignaly, Aleeert, Alertatron, Uniswap-v3 | BINANCE:BTCUSDTPERP 4h
🛒 Subscribe this strategy ❗️ Be a Titan Member 🏛️
🛒 Titan Pro 👽 🏛️ Titan Pro 👽 Version with ✔️100% Integrated Automation 🤖 and 📚 Automation Tutorials ✔️100% available at: (PDF/VIDEO)
🛒 Titan Affiliate 🛸 🏛️ Titan Affiliate 🛸 (Subscription Sale) 🔥 Receive 50% commission
📋 Summary : QT THEMIS ⚖️
🕵️♂️ Check This Strategy..................................................................0
🦄 ® Titan Investimentos...............................................................1
👨💻 © Developer..........................................................................2
📚 Signal Automation Tutorials : (PDF/VIDEO).......................................3
👨🔧 Revision...............................................................................4
📊 Table : (BACKTEST)..................................................................5
📊 Table : (INFORMATIONS).............................................................6
⚙️ Properties : (TRADINGVIEW)........................................................7
📆 Backtest : (TRADINGVIEW)..........................................................8
⚠️ Risk Profile...........................................................................9
🟢 On 🔴 Off : (LONG/SHORT).......................................................10
📈 LONG : (ENTRY)....................................................................11
📉 SHORT : (ENTRY)...................................................................12
📈 LONG : (EXIT).......................................................................13
📉 SHORT : (EXIT)......................................................................14
🧩 (EI) External Indicator.............................................................15
📡 (QT) Quantitative...................................................................16
🎠 (FF) Forecast......................................................................17
🅱 (BB) Bollinger Bands................................................................18
🧃 (MAP) Moving Average Primary......................................................19
🧃 (MAP) Labels.........................................................................20
🍔 (MAQ) Moving Average Quaternary.................................................21
🍟 (MACD) Moving Average Convergence Divergence...............................22
📣 (VWAP) Volume Weighted Average Price........................................23
🪀 (HL) HILO..........................................................................24
🅾 (OBV) On Balance Volume.........................................................25
🥊 (SAR) Stop and Reverse...........................................................26
🛡️ (DSR) Dynamic Support and Resistance..........................................27
🔊 (VD) Volume Directional..........................................................28
🧰 (RSI) Relative Momentum Index.................................................29
🎯 (TP) Take Profit %..................................................................30
🛑 (SL) Stop Loss %....................................................................31
🤖 Automation Selected...............................................................32
📱💻 Discord............................................................................33
📱💻 Telegram..........................................................................34
📱💻 Twitter...........................................................................35
🤖 Wundertrading......................................................................36
🤖 3commas............................................................................37
🤖 Zignaly...............................................................................38
🤖 Aleeert...............................................................................39
🤖 Alertatron...........................................................................40
🤖 Uniswap-v3..........................................................................41
🧲🤖 Copy-Trading....................................................................42
♻️ ® No Repaint........................................................................43
🔒 Copyright ©️..........................................................................44
🏛️ Be a Titan Member..................................................................45
Nº Active Users..........................................................................46
⏱ Time Left............................................................................47
| 0 | 🕵️♂️ Check This Strategy
🕵️♂️ Version Demo: 🐄 Version with ❌non-integrated automation 🤖 and 📚 Tutorials for automation ❌not available
🕵️♂️ Version Pro: 👽 Version with ✔️100% Integrated Automation 🤖 and 📚 Automation Tutorials ✔️100% available at: (PDF/VIDEO)
| 1 | 🦄 ® Titan Investimentos
Decentralizing the World 🗺
Raising the Collective Conscience 🗺
🦄Site:
🦄TradingView: www.tradingview.com
🦄Discord:
🦄Telegram:
🦄Youtube:
🦄Twitter:
🦄Instagram:
🦄TikTok:
🦄Linkedin:
🦄E-mail:
| 2 | 👨💻 © Developer
🧠 Developer: @FilipeSoh🧙
📺 TradingView: www.tradingview.com
☑️ Linkedin:
✅ Fiverr:
✅ Upwork:
🎥 YouTube:
🐤 Twitter:
🤳 Instagram:
| 3 | 📚 Signal Automation Tutorials : (PDF/VIDEO)
📚 Discord: 🔗 Link: 🔒Titan Pro👽
📚 Telegram: 🔗 Link: 🔒Titan Pro👽
📚 Twitter: 🔗 Link: 🔒Titan Pro👽
📚 Wundertrading: 🔗 Link: 🔒Titan Pro👽
📚 3comnas: 🔗 Link: 🔒Titan Pro👽
📚 Zignaly: 🔗 Link: 🔒Titan Pro👽
📚 Aleeert: 🔗 Link: 🔒Titan Pro👽
📚 Alertatron: 🔗 Link: 🔒Titan Pro👽
📚 Uniswap-v3: 🔗 Link: 🔒Titan Pro👽
📚 Copy-Trading: 🔗 Link: 🔒Titan Pro👽
| 4 | 👨🔧 Revision
👨🔧 Start Of Operations: 01 Jan 2019 21:00 -0300 💡 Start Of Operations (Skin in the game) : Revision 1.0
👨🔧 Previous Review: 01 Jan 2022 21:00 -0300 💡 Previous Review : Revision 2.0
👨🔧 Current Revision: 01 Jan 2023 21:00 -0300 💡 Current Revision : Revision 2.6
👨🔧 Next Revision: 28 May 2023 21:00 -0300 💡 Next Revision : Revision 2.7
| 5 | 📊 Table : (BACKTEST)
📊 Table: true
🖌️ Style: label.style_label_left
📐 Size: size_small
📏 Line: defval
🎨 Color: #131722
| 6 | 📊 Table : (INFORMATIONS)
📊 Table: false
🖌️ Style: label.style_label_right
📐 Size: size_small
📏 Line: defval
🎨 Color: #131722
| 7 | ⚙️ Properties : (TradingView)
📊 Strategy Type: strategy.position_size != 1
📝💲 % Order Type: % of equity
📝💲 % Order Size: 100 %
🚀 Leverage: 1
| 8 | 📆 Backtest : (TradingView)
🗓️ Mon: true
🗓️ Tue: true
🗓️ Wed: true
🗓️ Thu: true
🗓️ Fri: true
🗓️ Sat: true
🗓️ Sun: true
📆 Range: custom
📆 Start: UTC 31 Oct 2008 00:00
📆 End: UTC 31 Oct 2030 23:45
📆 Session: 0000-0000
📆 UTC: UTC
| 9 | ⚠️ Risk Profile
✔️🆑 Conservative: 🎯 TP=2.7 % 🛑 SL=2.7 %
❌Ⓜ️ Moderate: 🎯 TP=2.8 % 🛑 SL=2.7 %
❌🅰 Aggressive: 🎯 TP=1.6 % 🛑 SL=6.9 %
| 10 | 🟢 On 🔴 Off : (LONG/SHORT)
🟢📈 LONG: true
🟢📉 SHORT: true
| 11 | 📈 LONG : (ENTRY)
📡 (QT) Long: true
🧃 (MAP) Long: false
🅱 (BB) Long: false
🍟 (MACD) Long: false
🅾 (OBV) Long: false
| 12 | 📉 SHORT : (ENTRY)
📡 (QT) Short: true
🧃 (MAP) Short: false
🅱 (BB) Short: false
🍟 (MACD) Short: false
🅾 (OBV) Short: false
| 13 | 📈 LONG : (EXIT)
🧃 (MAP) Short: true
| 14 | 📉 SHORT : (EXIT)
🧃 (MAP) Long: false
| 15 | 🧩 (EI) External Indicator
🧩 (EI) Connect your external indicator/filter: false
🧩 (EI) Connect your indicator here (Study mode only): close
🧩 (EI) Connect your indicator here (Study mode only): close
| 16 | 📡 (QT) Quantitative
📡 (QT) Quantitative: true
📡 (QT) Market: BINANCE:BTCUSDTPERP
📡 (QT) Dice: openai
| 17 | 🎠 (FF) Forecast
🎠 (FF) Include current unclosed current candle: true
🎠 (FF) Forecast Type: flat
🎠 (FF) Nº of candles to use in linear regression: 3
| 18 | 🅱 (BB) Bollinger Bands
🅱 (BB) Bollinger Bands: true
🅱 (BB) Type: EMA
🅱 (BB) Period: 20
🅱 (BB) Source: close
🅱 (BB) Multiplier: 2
🅱 (BB) Linewidth: 0
🅱 (BB) Color: #131722
| 19 | 🧃 (MAP) Moving Average Primary
🧃 (MAP) Moving Average Primary: true
🧃 (MAP) BarColor: false
🧃 (MAP) Background: false
🧃 (MAP) Type: SMA
🧃 (MAP) Source: open
🧃 (MAP) Period: 100
🧃 (MAP) Multiplier: 2.0
🧃 (MAP) Linewidth: 2
🧃 (MAP) Color P: #42bda8
🧃 (MAP) Color N: #801922
| 20 | 🧃 (MAP) Labels
🧃 (MAP) Labels: true
🧃 (MAP) Style BUY ZONE: shape.labelup
🧃 (MAP) Color BUY ZONE: #42bda8
🧃 (MAP) Style SELL ZONE: shape.labeldown
🧃 (MAP) Color SELL ZONE: #801922
| 21 | 🍔 (MAQ) Moving Average Quaternary
🍔 (MAQ) Moving Average Quaternary: true
🍔 (MAQ) BarColor: false
🍔 (MAQ) Background: false
🍔 (MAQ) Type: SMA
🍔 (MAQ) Source: close
🍔 (MAQ) Primary: 14
🍔 (MAQ) Secondary: 22
🍔 (MAQ) Tertiary: 44
🍔 (MAQ) Quaternary: 16
🍔 (MAQ) Linewidth: 0
🍔 (MAQ) Color P: #42bda8
🍔 (MAQ) Color N: #801922
| 22 | 🍟 (MACD) Moving Average Convergence Divergence
🍟 (MACD) Macd Type: EMA
🍟 (MACD) Signal Type: EMA
🍟 (MACD) Source: close
🍟 (MACD) Fast: 12
🍟 (MACD) Slow: 26
🍟 (MACD) Smoothing: 9
| 23 | 📣 (VWAP) Volume Weighted Average Price
📣 (VWAP) Source: close
📣 (VWAP) Period: 340
📣 (VWAP) Momentum A: 84
📣 (VWAP) Momentum B: 150
📣 (VWAP) Average Volume: 1
📣 (VWAP) Multiplier: 1
📣 (VWAP) Diviser: 2
| 24 | 🪀 (HL) HILO
🪀 (HL) Type: SMA
🪀 (HL) Function: Maverick🧙
🪀 (HL) Source H: high
🪀 (HL) Source L: low
🪀 (HL) Period: 20
🪀 (HL) Momentum: 26
🪀 (HL) Diviser: 2
🪀 (HL) Multiplier: 1
| 25 | 🅾 (OBV) On Balance Volume
🅾 (OBV) Type: EMA
🅾 (OBV) Source: close
🅾 (OBV) Period: 16
🅾 (OBV) Diviser: 2
🅾 (OBV) Multiplier: 1
| 26 | 🥊 (SAR) Stop and Reverse
🥊 (SAR) Source: close
🥊 (SAR) High: 1.8
🥊 (SAR) Mid: 1.6
🥊 (SAR) Low: 1.6
🥊 (SAR) Diviser: 2
🥊 (SAR) Multiplier: 1
| 27 | 🛡️ (DSR) Dynamic Support and Resistance
🛡️ (DSR) Source D: close
🛡️ (DSR) Source R: high
🛡️ (DSR) Source S: low
🛡️ (DSR) Momentum R: 0
🛡️ (DSR) Momentum S: 2
🛡️ (DSR) Diviser: 2
🛡️ (DSR) Multiplier: 1
| 28 | 🔊 (VD) Volume Directional
🔊 (VD) Type: SMA
🔊 (VD) Period: 68
🔊 (VD) Momentum: 3.8
🔊 (VD) Diviser: 2
🔊 (VD) Multiplier: 1
| 29 | 🧰 (RSI) Relative Momentum Index
🧰 (RSI) Type UP: EMA
🧰 (RSI) Type DOWN: EMA
🧰 (RSI) Source: close
🧰 (RSI) Period: 29
🧰 (RSI) Smoothing: 22
🧰 (RSI) Momentum R: 64
🧰 (RSI) Momentum S: 142
🧰 (RSI) Diviser: 2
🧰 (RSI) Multiplier: 1
| 30 | 🎯 (TP) Take Profit %
🎯 (TP) Take Profit: false
🎯 (TP) %: 2.2
🎯 (TP) Color: #42bda8
🎯 (TP) Linewidth: 1
| 31 | 🛑 (SL) Stop Loss %
🛑 (SL) Stop Loss: false
🛑 (SL) %: 2.7
🛑 (SL) Color: #801922
🛑 (SL) Linewidth: 1
| 32 | 🤖 Automation : Discord | Telegram | Twitter | Wundertrading | 3commas | Zignaly | Aleeert | Alertatron | Uniswap-v3
🤖 Automation Selected : Discord
| 33 | 🤖 Discord
🔗 Link Discord: discord.com
🔗 Link 📚 Automation: 🔒Titan Pro👽
📱💻 Discord ▬ Enter Long: 🔒Titan Pro👽
📱💻 Discord ▬ Exit Long: 🔒Titan Pro👽
📱💻 Discord ▬ Enter Short: 🔒Titan Pro👽
📱💻 Discord ▬ Exit Short: 🔒Titan Pro👽
| 34 | 🤖 Telegram
🔗 Link Telegram: telegram.org
🔗 Link 📚 Automation: 🔒Titan Pro👽
📱💻 Telegram ▬ Enter Long: 🔒Titan Pro👽
📱💻 Telegram ▬ Exit Long: 🔒Titan Pro👽
📱💻 Telegram ▬ Enter Short: 🔒Titan Pro👽
📱💻 Telegram ▬ Exit Short: 🔒Titan Pro👽
| 35 | 🤖 Twitter
🔗 Link Twitter: twitter.com
🔗 Link 📚 Automation: 🔒Titan Pro👽
📱💻 Twitter ▬ Enter Long: 🔒Titan Pro👽
📱💻 Twitter ▬ Exit Long: 🔒Titan Pro👽
📱💻 Twitter ▬ Enter Short: 🔒Titan Pro👽
📱💻 Twitter ▬ Exit Short: 🔒Titan Pro👽
| 36 | 🤖 Wundertrading : Binance | Bitmex | Bybit | KuCoin | Deribit | OKX | Coinbase | Huobi | Bitfinex | Bitget
🔗 Link Wundertrading: wundertrading.com
🔗 Link 📚 Automation: 🔒Titan Pro👽
📱💻 Wundertrading ▬ Enter Long: 🔒Titan Pro👽
📱💻 Wundertrading ▬ Exit Long: 🔒Titan Pro👽
📱💻 Wundertrading ▬ Enter Short: 🔒Titan Pro👽
📱💻 Wundertrading ▬ Exit Short: 🔒Titan Pro👽
| 37 | 🤖 3commas : Binance | Bybit | OKX | Bitfinex | Coinbase | Deribit | Bitmex | Bittrex | Bitstamp | Gate.io | Kraken | Gemini | Huobi | KuCoin
🔗 Link 3commas: 3commas.io
🔗 Link 📚 Automation: 🔒Titan Pro👽
📱💻 3commas ▬ Enter Long: 🔒Titan Pro👽
📱💻 3commas ▬ Exit Long: 🔒Titan Pro👽
📱💻 3commas ▬ Enter Short: 🔒Titan Pro👽
📱💻 3commas ▬ Exit Short: 🔒Titan Pro👽
| 38 | 🤖 Zignaly : Binance | Ascendex | Bitmex | Kucoin | VCCE
🔗 Link Zignaly: zignaly.com
🔗 Link 📚 Automation: 🔒Titan Pro👽
🤖 Type Automation: Profit Sharing
🤖 Type Provider: Webook
🔑 Key: 🔒Titan Pro👽
🤖 pair: BTCUSDTP
🤖 exchange: binance
🤖 exchangeAccountType: futures
🤖 orderType: market
🚀 leverage: 1x
% positionSizePercentage: 100 %
💸 positionSizeQuote: 10000 $
🆔 signalId: @Signal1234
| 39 | 🤖 Aleeert : Binance
🔗 Link Aleeert: aleeert.com
🔗 Link 📚 Automation: 🔒Titan Pro👽
📱💻 Aleeert ▬ Enter Long: 🔒Titan Pro👽
📱💻 Aleeert ▬ Exit Long: 🔒Titan Pro👽
📱💻 Aleeert ▬ Enter Short: 🔒Titan Pro👽
📱💻 Aleeert ▬ Exit Short: 🔒Titan Pro👽
| 40 | 🤖 Alertatron : Binance | Bybit | Deribit | Bitmex
🔗 Link Alertatron: alertatron.com
🔗 Link 📚 Automation: 🔒Titan Pro👽
📱💻 Alertatron ▬ Enter Long: 🔒Titan Pro👽
📱💻 Alertatron ▬ Exit Long: 🔒Titan Pro👽
📱💻 Alertatron ▬ Enter Short: 🔒Titan Pro👽
📱💻 Alertatron ▬ Exit Short: 🔒Titan Pro👽
| 41 | 🤖 Uniswap-v3
🔗 Link Alertatron: uniswap.org
🔗 Link 📚 Automation: 🔒Titan Pro👽
📱💻 Uniswap-v3 ▬ Enter Long: 🔒Titan Pro👽
📱💻 Uniswap-v3 ▬ Exit Long: 🔒Titan Pro👽
📱💻 Uniswap-v3 ▬ Enter Short: 🔒Titan Pro👽
📱💻 Uniswap-v3 ▬ Exit Short: 🔒Titan Pro👽
| 42 | 🧲🤖 Copy-Trading : Zignaly | Wundertrading
🔗 Link 📚 Copy-Trading: 🔒Titan Pro👽
🧲🤖 Copy-Trading ▬ Zignaly: 🔒Titan Pro👽
🧲🤖 Copy-Trading ▬ Wundertrading: 🔒Titan Pro👽
| 43 | ♻️ ® Don't Repaint!
♻️ This Strategy does not Repaint!: ® Signs Do not repaint❕
♻️ This is a Real Strategy!: Quality : ® Titan Investimentos
📋️️ Get more information about Repainting here:
| 44 | 🔒 Copyright ©️
🔒 Copyright ©️: Copyright © 2023-2024 All rights reserved, ® Titan Investimentos
🔒 Copyright ©️: ® Titan Investimentos
🔒 Copyright ©️: Unique and Exclusive Strategy. All rights reserved
| 45 | 🏛️ Be a Titan Members
🏛️ Titan Pro 👽 Version with ✔️100% Integrated Automation 🤖 and 📚 Automation Tutorials ✔️100% available at: (PDF/VIDEO)
🏛️ Titan Affiliate 🛸 (Subscription Sale) 🔥 Receive 50% commission
| 46 | ⏱ Time Left
Time Left Titan Demo 🐄: ⏱♾ | ⏱ : ♾ Titan Demo 🐄 Version with ❌non-integrated automation 🤖 and 📚 Tutorials for automation ❌not available
Time Left Titan Pro 👽: 🔒Titan Pro👽 | ⏱ : Pro Plans: 30 Days, 90 Days, 12 Months, 24 Months. (👽 Pro 🅼 Monthly, 👽 Pro 🆀 Quarterly, 👽 Pro🅰 Annual, 👽 Pro👾Two Years)
| 47 | Nº Active Users
Nº Active Subscribers Titan Pro 👽: 5️⃣6️⃣ | 1✔️ 5✔️ 10✔️ 100❌ 1K❌ 10K❌ 50K❌ 100K❌ 1M❌ 10M❌ 100M❌ : ⏱ Active Users is updated every 24 hours (Check on indicator)
Nº Active Affiliates Titan Aff 🛸: 6️⃣ | 1✔️ 5✔️ 10❌ 100❌ 1K❌ 10K❌ 50K❌ 100K❌ 1M❌ 10M❌ 100M❌ : ⏱ Active Users is updated every 24 hours (Check on indicator)
2️⃣7️⃣ : 📊 PERFORMANCE : 🆑 Conservative
📊 Exchange: Binance
📊 Pair: BINANCE: BTCUSDTPERP
📊 TimeFrame: 4h
📊 Initial Capital: 10000 $
📊 Order Type: % equity
📊 Size Per Order: 100 %
📊 Commission: 0.03 %
📊 Pyramid: 1
• ⚠️ Risk Profile: 🆑 Conservative: 🎯 TP=2.7 % | 🛑 SL=2.7 %
• 📆All years: 🆑 Conservative: 🚀 Leverage 1️⃣x
📆 Start: September 23, 2019
📆 End: January 11, 2023
📅 Days: 1221
📅 Bars: 7325
Net Profit:
🟢 + 1669.89 %
💲 + 166989.43 USD
Total Close Trades:
⚪️ 369
Percent Profitable:
🟡 64.77 %
Profit Factor:
🟢 2.314
DrawDrown Maximum:
🔴 -24.82 %
💲 -10221.43 USD
Avg Trade:
💲 + 452.55 USD
✔️ Trades Winning: 239
❌ Trades Losing: 130
✔️ Average Gross Win: + 12.31 %
❌ Average Gross Loss: - 9.78 %
✔️ Maximum Consecutive Wins: 9
❌ Maximum Consecutive Losses: 6
% Average Gain Annual: 499.33 %
% Average Gain Monthly: 41.61 %
% Average Gain Weekly: 9.6 %
% Average Gain Day: 1.37 %
💲 Average Gain Annual: 49933 $
💲 Average Gain Monthly: 4161 $
💲 Average Gain Weekly: 960 $
💲 Average Gain Day: 137 $
• 📆 Year: 2020: 🆑 Conservative: 🚀 Leverage 1️⃣x
• 📆 Year: 2021: 🆑 Conservative: 🚀 Leverage 1️⃣x
• 📆 Year: 2022: 🆑 Conservative: 🚀 Leverage 1️⃣x
2️⃣8️⃣ : 📊 PERFORMANCE : Ⓜ️ Moderate
📊 Exchange: Binance
📊 Pair: BINANCE: BTCUSDTPERP
📊 TimeFrame: 4h
📊 Initial Capital: 10000 $
📊 Order Type: % equity
📊 Size Per Order: 100 %
📊 Commission: 0.03 %
📊 Pyramid: 1
• ⚠️ Risk Profile: Ⓜ️ Moderate: 🎯 TP=2.8 % | 🛑 SL=2.7 %
• 📆 All years: Ⓜ️ Moderate: 🚀 Leverage 1️⃣x
📆 Start: September 23, 2019
📆 End: January 11, 2023
📅 Days: 1221
📅 Bars: 7325
Net Profit:
🟢 + 1472.04 %
💲 + 147199.89 USD
Total Close Trades:
⚪️ 362
Percent Profitable:
🟡 63.26 %
Profit Factor:
🟢 2.192
DrawDrown Maximum:
🔴 -22.69 %
💲 -9269.33 USD
Avg Trade:
💲 + 406.63 USD
✔️ Trades Winning: 229
❌ Trades Losing : 133
✔️ Average Gross Win: + 11.82 %
❌ Average Gross Loss: - 9.29 %
✔️ Maximum Consecutive Wins: 9
❌ Maximum Consecutive Losses: 8
% Average Gain Annual: 440.15 %
% Average Gain Monthly: 36.68 %
% Average Gain Weekly: 8.46 %
% Average Gain Day: 1.21 %
💲 Average Gain Annual: 44015 $
💲 Average Gain Monthly: 3668 $
💲 Average Gain Weekly: 846 $
💲 Average Gain Day: 121 $
• 📆 Year: 2020: Ⓜ️ Moderate: 🚀 Leverage 1️⃣x
• 📆 Year: 2021: Ⓜ️ Moderate: 🚀 Leverage 1️⃣x
• 📆 Year: 2022: Ⓜ️ Moderate: 🚀 Leverage 1️⃣x
2️⃣9️⃣ : 📊 PERFORMANCE : 🅰 Aggressive
📊 Exchange: Binance
📊 Pair: BINANCE: BTCUSDTPERP
📊 TimeFrame: 4h
📊 Initial Capital: 10000 $
📊 Order Type: % equity
📊 Size Per Order: 100 %
📊 Commission: 0.03 %
📊 Pyramid: 1
• ⚠️ Risk Profile: 🅰 Aggressive: 🎯 TP=1.6 % | 🛑 SL=6.9 %
• 📆 All years: 🅰 Aggressive: 🚀 Leverage 1️⃣x
📆 Start: September 23, 2019
📆 End: January 11, 2023
📅 Days: 1221
📅 Bars: 7325
Net Profit:
🟢 + 989.38 %
💲 + 98938.38 USD
Total Close Trades:
⚪️ 380
Percent Profitable:
🟢 84.47 %
Profit Factor:
🟢 2.156
DrawDrown Maximum:
🔴 -17.88 %
💲 -9182.84 USD
Avg Trade:
💲 + 260.36 USD
✔️ Trades Winning: 321
❌ Trades Losing: 59
✔️ Average Gross Win: + 5.75 %
❌ Average Gross Loss: - 14.51 %
✔️ Maximum Consecutive Wins: 21
❌ Maximum Consecutive Losses: 6
% Average Gain Annual: 295.84 %
% Average Gain Monthly: 24.65 %
% Average Gain Weekly: 5.69 %
% Average Gain Day: 0.81 %
💲 Average Gain Annual: 29584 $
💲 Average Gain Monthly: 2465 $
💲 Average Gain Weekly: 569 $
💲 Average Gain Day: 81 $
• 📆 Year: 2020: 🅰 Aggressive: 🚀 Leverage 1️⃣x
• 📆 Year: 2021: 🅰 Aggressive: 🚀 Leverage 1️⃣x
• 📆 Year: 2022: 🅰 Aggressive: 🚀 Leverage 1️⃣x
3️⃣0️⃣ : 🛠️ Roadmap
🛠️• 14/ 01 /2023 : Titan THEMIS Launch
🛠️• Updates January/2023 :
• 📚 Tutorials for Automation 🤖 already Available : ✔️
• ✔️ Discord
• ✔️ Wundertrading
• ✔️ Zignaly
• 📚 Tutorials for Automation 🤖 In Preparation : ⭕
• ⭕ Telegram
• ⭕ Twitter
• ⭕ 3comnas
• ⭕ Aleeert
• ⭕ Alertatron
• ⭕ Uniswap-v3
• ⭕ Copy-Trading
🛠️• Updates February/2023 :
• 📰 Launch of advertising material for Titan Affiliates 🛸
• 🛍️🎥🖼️📊 (Sales Page/VSL/Videos/Creative/Infographics)
🛠️• 28/05/2023 : Titan THEMIS update ▬ Version 2.7
🛠️• 28/05/2023 : BOT BOB release ▬ Version 1.0
• (Native Titan THEMIS Automation - Through BOT BOB, a bot for automation of signals, indicators and strategies of TradingView, of own code ▬ in validation.
• BOT BOB
Automation/Connection :
• API - For Centralized Brokers.
• Smart Contracts - Wallet Web - For Decentralized Brokers.
• This way users can automate any indicator or strategy of TradingView and Titan in a decentralized, secure and simplified way.
• Without having the need to use 'third party services' for automating TradingView indicators and strategies like the ones available above.
🛠️• 28/05/2023 : Release ▬ Titan Culture Guide 📝
3️⃣1️⃣ : 🧻 Notes ❕
🧻 • Note ❕ The "Demo 🐄" version, ❌does not have 'integrated automation', to automate the signals of this strategy and enjoy a fully automated system, you need to have access to the Pro version with '100% integrated automation' and all the tutorials for automation available. Become a Titan Pro 👽
🧻 • Note ❕ You will also need to be a "Pro User or higher on Tradingview", to be able to use the webhook feature available only for 'paid' profiles on the platform.
With the webhook feature it is possible to send the signals of this strategy to almost anywhere, in our case to centralized or decentralized brokerages, also to popular messaging services such as: Discord, Telegram or Twiter.
3️⃣2️⃣ : 🚨 Disclaimer ❕❗
🚨 • Disclaimer ❕❕ Past positive result and performance of a system does not guarantee its positive result and performance for the future!
🚨 • Disclaimer ❗❗❗ When using this strategy: Titan Investments is totally Exempt from any claim of liability for losses. The responsibility on the management of your funds is solely yours. This is a very high risk/volatility market! Understand your place in the market.
3️⃣3️⃣ : ♻️ ® No Repaint
This Strategy does not Repaint! This is a real strategy!
3️⃣4️⃣ : 🔒 Copyright ©️
Copyright © 2022-2023 All rights reserved, ® Titan Investimentos
3️⃣5️⃣ : 👏 Acknowledgments
I want to start this message in thanks to TradingView and all the Pinescript community for all the 'magic' created here, a unique ecosystem! rich and healthy, a fertile soil, a 'new world' of possibilities, for a complete deepening and improvement of our best personal skills.
I leave here my immense thanks to the whole community: Tradingview, Pinecoders, Wizards and Moderators.
I was not born Rich .
Thanks to TradingView and pinescript and all its transformation.
I could develop myself and the best of me and the best of my skills.
And consequently build wealth and patrimony.
Gratitude.
One more story for the infinite book !
If you were born poor you were born to be rich !
Raising🔼 the level and raising🔼 the ruler! 📏
My work is my 'debauchery'! Do better! 💐🌹
Soul of a first-timer! Creativity Exudes! 🦄
This is the manifestation of God's magic in me. This is the best of me. 🧙
You will copy me, I know. So you owe me. 💋
My mission here is to raise the consciousness and self-esteem of all Titans and Titanids! Welcome! 🧘 🏛️
The only way to accomplish great work is to do what you love ! Before I learned to program I was wasting my life!
Death is the best creation of life .
Now you are the new , but in the not so distant future you will gradually become the old . Here I stay forever!
Playing the game like an Athlete! 🖼️ Enjoy and Enjoy 🍷 🗿
In honor of: BOB ☆
1 name, 3 letters, 3 possibilities, and if read backwards it's the same thing, a palindrome. ☘
Gratitude to the oracles that have enabled me the 'luck' to get this far: Dal&Ni&Fer
3️⃣6️⃣ : 👮 House Rules : 📺 TradingView
House Rules : This publication and strategy follows all TradingView house guidelines and rules:
📺 TradingView House Rules: www.tradingview.com
📺 Script publication rules: www.tradingview.com
📺 Vendor requirements: www.tradingview.com
📺 Links/References rules: www.tradingview.com
3️⃣7️⃣ : 🏛️ Become a Titan Pro member 👽
🟩 Titan Pro 👽 🟩
3️⃣8️⃣ : 🏛️ Be a member Titan Aff 🛸
🟥 Titan Affiliate 🛸 🟥

Titan Investments|Quantitative THEMIS|Demo|BINANCE:BTCUSDTP:4hInvestment Strategy (Quantitative Trading)
| 🛑 | Watch "LIVE" and 'COPY' this strategy in real time:
🔗 Link: www.tradingview.com
Hello, welcome, feel free 🌹💐
Since the stone age to the most technological age, one thing has not changed, that which continues impress human beings the most, is the other human being!
Deep down, it's all very simple or very complicated, depends on how you look at it.
I believe that everyone was born to do something very well in life.
But few are those who have, let's use the word 'luck' .
Few are those who have the 'luck' to discover this thing.
That is why few are happy and successful in their jobs and professions.
Thank God I had this 'luck' , and discovered what I was born to do well.
And I was born to program. 👨💻
📋 Summary : Project Titan
0️⃣ : 🦄 Project Titan
1️⃣ : ⚖️ Quantitative THEMIS
2️⃣ : 🏛️ Titan Community
3️⃣ : 👨💻 Who am I ❔
4️⃣ : ❓ What is Statistical/Probabilistic Trading ❓
5️⃣ : ❓ How Statistical/Probabilistic Trading works ❓
6️⃣ : ❓ Why use a Statistical/Probabilistic system ❓
7️⃣ : ❓ Why the human brain is not prepared to do Trading ❓
8️⃣ : ❓ What is Backtest ❓
9️⃣ : ❓ How to build a Consistent system ❓
🔟 : ❓ What is a Quantitative Trading system ❓
1️⃣1️⃣ : ❓ How to build a Quantitative Trading system ❓
1️⃣2️⃣ : ❓ How to Exploit Market Anomalies ❓
1️⃣3️⃣ : ❓ What Defines a Robust, Profitable and Consistent System ❓
1️⃣4️⃣ : 🔧 Fixed Technical
1️⃣5️⃣ : ❌ Fixed Outputs : 🎯 TP(%) & 🛑SL(%)
1️⃣6️⃣ : ⚠️ Risk Profile
1️⃣7️⃣ : ⭕ Moving Exits : (Indicators)
1️⃣8️⃣ : 💸 Initial Capital
1️⃣9️⃣ : ⚙️ Entry Options
2️⃣0️⃣ : ❓ How to Automate this Strategy ❓ : 🤖 Automation : 'Third-Party Services'
2️⃣1️⃣ : ❓ How to Automate this Strategy ❓ : 🤖 Automation : 'Exchanges
2️⃣2️⃣ : ❓ How to Automate this Strategy ❓ : 🤖 Automation : 'Messaging Services'
2️⃣3️⃣ : ❓ How to Automate this Strategy ❓ : 🤖 Automation : '🧲🤖Copy-Trading'
2️⃣4️⃣ : ❔ Why be a Titan Pro 👽❔
2️⃣5️⃣ : ❔ Why be a Titan Aff 🛸❔
2️⃣6️⃣ : 📋 Summary : ⚖️ Strategy: Titan Investments|Quantitative THEMIS|Demo|BINANCE:BTCUSDTP:4h
2️⃣7️⃣ : 📊 PERFORMANCE : 🆑 Conservative
2️⃣8️⃣ : 📊 PERFORMANCE : Ⓜ️ Moderate
2️⃣9️⃣ : 📊 PERFORMANCE : 🅰 Aggressive
3️⃣0️⃣ : 🛠️ Roadmap
3️⃣1️⃣ : 🧻 Notes ❕
3️⃣2️⃣ : 🚨 Disclaimer ❕❗
3️⃣3️⃣ : ♻️ ® No Repaint
3️⃣4️⃣ : 🔒 Copyright ©️
3️⃣5️⃣ : 👏 Acknowledgments
3️⃣6️⃣ : 👮 House Rules : 📺 TradingView
3️⃣7️⃣ : 🏛️ Become a Titan Pro member 👽
3️⃣8️⃣ : 🏛️ Be a member Titan Aff 🛸
0️⃣ : 🦄 Project Titan
This is the first real, 100% automated Quantitative Strategy made available to the public and the pinescript community for TradingView.
You will be able to automate all signals of this strategy for your broker , centralized or decentralized and also for messaging services : Discord, Telegram or Twitter .
This is the first strategy of a larger project, in 2023, I will provide a total of 6 100% automated 'Quantitative' strategies to the pinescript community for TradingView.
The future strategies to be shared here will also be unique , never before seen, real 'Quantitative' bots with real, validated results in real operation.
Just like the 'Quantitative THEMIS' strategy, it will be something out of the loop throughout the pinescript/tradingview community, truly unique tools for building mutual wealth consistently and continuously for our community.
1️⃣ : ⚖️ Quantitative THEMIS : Titan Investments|Quantitative THEMIS|Demo|BINANCE:BTCUSDTP:4h
This is a truly unique and out of the curve strategy for BTC /USD .
A truly real strategy, with real, validated results and in real operation.
A unique tool for building mutual wealth, consistently and continuously for the members of the Titan community.
Initially we will operate on a monthly, quarterly, annual or biennial subscription service.
Our goal here is to build a great community, in exchange for an extremely fair value for the use of our truly unique tools, which bring and will bring real results to our community members.
With this business model it will be possible to provide all Titan users and community members with the purest and highest degree of sophistication in the market with pinescript for tradingview, providing unique and truly profitable strategies.
My goal here is to offer the best to our members!
The best 'pinescript' tradingview service in the world!
We are the only Start-Up in the world that will decentralize real and full access to truly real 'quantitative' tools that bring and will bring real results for mutual and ongoing wealth building for our community.
2️⃣ : 🏛️ Titan Community : 👽 Pro 🔁 Aff 🛸
Become a Titan Pro 👽
To get access to the strategy: "Quantitative THEMIS" , and future Titan strategies in a 100% automated way, along with all tutorials for automation.
Pro Plans: 30 Days, 90 Days, 12 Months, 24 Months.
👽 Pro 🅼 Monthly
👽 Pro 🆀 Quarterly
👽 Pro🅰 Annual
👽 Pro👾Two Years
You will have access to a truly unique system that is out of the curve .
A 100% real, 100% automated, tested, validated, profitable, and in real operation strategy.
Become a Titan Affiliate 🛸
By becoming a Titan Affiliate 🛸, you will automatically receive 50% of the value of each new subscription you refer .
You will receive 50% for any of the above plans that you refer .
This way we will encourage our community to grow in a fair and healthy way, because we know what we have in our hands and what we deliver real value to our users.
We are at the highest level of sophistication in the market, the consistency here and the results here speak for themselves.
So growing our community means growing mutual wealth and raising collective conscience.
Wealth must be created not divided.
And here we are creating mutual wealth on all ends and in all ways.
A non-zero sum system, where everybody wins.
3️⃣ : 👨💻 Who am I ❔
My name is FilipeSoh I am 26 years old, Technical Analyst, Trader, Computer Engineer, pinescript Specialist, with extensive experience in several languages and technologies.
For the last 4 years I have been focusing on developing, editing and creating pinescript indicators and strategies for Tradingview for people and myself.
Full-time passionate workaholic pinescript developer with over 10,000 hours of pinescript development.
• Pinescript expert ▬Tradingview.
• Specialist in Automated Trading
• Specialist in Quantitative Trading.
• Statistical/Probabilistic Trading Specialist - Mark Douglas Scholl.
• Inventor of the 'Classic Forecast' Indicators.
• Inventor of the 'Backtest Table'.
4️⃣ : ❓ What is Statistical/Probabilistic Trading ❓
Statistical/probabilistic trading is the only way to get a positive mathematical expectation regarding the market and consequently that is the only way to make money consistently from it.
I will present below some more details about the Quantitative THEMIS strategy, it is a real strategy, tested, validated and in real operation, 'Skin in the Game' , a consistent way to make money with statistical/probabilistic trading in a 100% automated.
I am a Technical Analyst , I used to be a Discretionary Trader , today I am 100% a Statistical Trader .
I've gotten rich and made a lot of money, and I've also lost a lot with 'leverage'.
That was a few years ago.
The book that changed everything for me was "Trading in The Zone" by Mark Douglas.
That's when I understood that the market is just a game of statistics and probability, like a casino!
It was then that I understood that the human brain is not prepared for trading, because it involves triggers and mental emotions.
And emotions in trading and in making trading decisions do not go well together, not in the long run, because you always have the burden of being wrong with the outcome of that particular position.
But remembering that the market is just a statistical game!
5️⃣ : ❓ How Statistical/Probabilistic Trading works ❓
Let's use a 'coin' as an example:
If we toss a 'coin' up 10 times.
Do you agree that it is impossible for us to know exactly the result of the 'plays' before they actually happen?
As in the example above, would you agree, that we cannot "guess" the outcome of a position before it actually happens?
As much as we cannot "guess" whether the coin will drop heads or tails on each flip.
We can analyze the "backtest" of the 10 moves made with that coin:
If we analyze the 10 moves and count the number of times the coin fell heads or tails in a specific sequence, we then have a percentage of times the coin fell heads or tails, so we have a 'backtest' of those moves.
Then on the next flip we can now assume a point or a favorable position for one side, the side with the highest probability .
In a nutshell, this is more or less how probabilistic statistical trading works.
As Statistical Traders we can never say whether such a Trader/Position we take will be a winner or a loser.
But still we can have a positive and consistent result in a "sequence" of trades, because before we even open a position, backtests have already been performed so we identify an anomaly and build a system that will have a positive statistical advantage in our favor over the market.
The advantage will not be in one trade itself, but in the "sequence" of trades as a whole!
Because our system will work like a casino, having a positive mathematical expectation relative to the players/market.
Design, develop, test models and systems that can take advantage of market anomalies, until they change.
Be the casino! - Mark Douglas
6️⃣ : ❓ Why use a Statistical/Probabilistic system ❓
In recent years I have focused and specialized in developing 100% automated trading systems, essentially for the cryptocurrency market.
I have developed many extremely robust and efficient systems, with positive mathematical expectation towards the market.
These are not complex systems per se , because here we want to avoid 'over-optimization' as much as possible.
As Da Vinci said: "Simplicity is the highest degree of sophistication".
I say this because I have tested, tried and developed hundreds of systems/strategies.
I believe I have programmed more than 10,000 unique indicators/strategies, because this is my passion and purpose in life.
I am passionate about what I do, completely!
I love statistical trading because it is the only way to get consistency in the long run!
This is why I have studied, applied, developed, and specialized in 100% automated cryptocurrency trading systems.
The reason why our systems are extremely "simple" is because, as I mentioned before, in statistical trading we want to exploit the market anomaly to the maximum, that is, this anomaly will change from time to time, usually we can exploit a trading system efficiently for about 6 to 12 months, or for a few years, that is; for fixed 'scalpers' systems.
Because at some point these anomalies will be identified , and from the moment they are identified they will be exploited and will stop being anomalies .
With the system presented here; you can even copy the indicators and input values shared here;
However; what I have to offer you is: it is me , our team , and our community !
That is, we will constantly monitor this system, for life , because our goal here is to create a unique , perpetual , profitable , and consistent system for our community.
Myself , our team and our community will keep this script periodically updated , to ensure the positive mathematical expectation of it.
So we don't mind sharing the current parameters and values , because the real value is also in the future updates that this system will receive from me and our team , guided by our culture and our community of real users !
As we are hosted on 'tradingview', all future updates for this strategy, will be implemented and updated automatically on your tradingview account.
What we want here is: to make sure you get gains from our system, because if you get gains , our ecosystem will grow as a whole in a healthy and scalable way, so we will be generating continuous mutual wealth and raising the collective consciousness .
People Need People: 3️⃣🅿
7️⃣ : ❓ Why the human brain is not prepared to do Trading ❓
Today my greatest skill is to develop statistically profitable and 100% automated strategies for 'pinescript' tradingview.
Note that I said: 'profitable' because in fact statistical trading is the only way to make money in a 'consistent' way from the market.
And consequently have a positive wealth curve every cycle, because we will be based on mathematics, not on feelings and news.
Because the human brain is not prepared to do trading.
Because trading is connected to the decision making of the cerebral cortex.
And the decision making is automatically linked to emotions, and emotions don't match with trading decision making, because in those moments, we can feel the best and also the worst sensations and emotions, and this certainly affects us and makes us commit grotesque mistakes!
That's why the human brain is not prepared to do trading.
If you want to participate in a fully automated, profitable and consistent trading system; be a Titan Pro 👽
I believe we are walking an extremely enriching path here, not only in terms of financial returns for our community, but also in terms of knowledge about probabilistic and automated statistical trading.
You will have access to an extremely robust system, which was built upon very strong concepts and foundations, and upon the world's main asset in a few years: Bitcoin .
We are the tip of the best that exists in the cryptocurrency market when it comes to probabilistic and automated statistical trading.
Result is result! Me being dressed or naked.
This is just the beginning!
But there is a way to consistently make money from the market.
Being the Casino! - Mark Douglas
8️⃣ : ❓ What is Backtest ❓
Imagine the market as a purely random system, but even in 'randomness' there are patterns.
So now imagine the market and statistical trading as follows:
Repeating the above 'coin' example, let's think of it as follows:
If we toss a coin up 10 times again.
It is impossible to know which flips will have heads or tails, correct?
But if we analyze these 10 tosses, then we will have a mathematical statistic of the past result, for example, 70 % of the tosses fell 'heads'.
That is:
7 moves fell on "heads" .
3 moves fell on "tails" .
So based on these conditions and on the generic backtest presented here, we could adopt " heads " as our system of moves, to have a statistical and probabilistic advantage in relation to the next move to be performed.
That is, if you define a system, based on backtests , that has a robust positive mathematical expectation in relation to the market you will have a profitable system.
For every move you make you will have a positive statistical advantage in your favor over the market before you even make the move.
Like a casino in relation to all its players!
The casino does not have an advantage over one specific player, but over all players, because it has a positive mathematical expectation about all the moves that night.
The casino will always have a positive statistical advantage over its players.
Note that there will always be real players who will make real, million-dollar bankrolls that night, but this condition is already built into the casino's 'strategy', which has a pre-determined positive statistical advantage of that night as a whole.
Statistical trading is the same thing, as long as you don't understand this you will keep losing money and consistently.
9️⃣ : ❓ How to build a Consistent system ❓
See most traders around the world perform trades believing that that specific position taken will make them filthy rich, because they simply believe faithfully that the position taken will be an undoubted winner, based on a trader's methodology: 'trading a trade' without analyzing the whole context, just using 'empirical' aspects in their system.
But if you think of trading, as a sequence of moves.
You see, 'a sequence' !
When we think statistically, it doesn't matter your result for this , or for the next specific trade , but the final sequence of trades as a whole.
As the market has a random system of results distribution , if your system has a positive statistical advantage in relation to the market, at the end of that sequence you'll have the biggest probability of having a winning bank.
That's how you do real trading!
And with consistency!
Trading is a long term game, but when you change the key you realize that it is a simple game to make money in a consistent way from the market, all you need is patience.
Even more when we are based on Bitcoin, which has its 'Halving' effect where, in theory, we will never lose money in 3 to 4 years intervals, due to its scarcity and the fact that Bitcoin is the 'discovery of digital scarcity' which makes it the digital gold, we believe in this thesis and we follow Satoshi's legacy.
So align Bitcoin with a probabilistic statistical trading system with a positive mathematical expectation of the market and 100% automated with the long term, and all you need is patience, and you will become rich.
In fact Bitcoin by itself is already a path, buy, wait for each halving and your wealth will be maintained.
No inflation, unlike fiat currencies.
This is a complete and extremely robust strategy, with the most current possible and 'not possible' techniques involved and applied here.
Today I am at another level in developing 100% automated 'quantitative' strategies.
I was born for this!
🔟 : ❓ What is a Quantitative Trading system ❓
In addition to having access to a revolutionary strategy you will have access to disruptive 100% multifunctional tables with the ability to perform 'backtests' for better tracking and monitoring of your system on a customized basis.
I would like to emphasize one thing, and that is that you keep this in mind.
Today my greatest skill in 'pinescript' is to build indicators, but mainly strategies, based on statistical and probabilistic trading, with a postive mathematical expectation in relation to the market, in a 100% automated way.
This with the goal of building a consistent and continuous positive equity curve through mathematics using data, converting it into statistical / probabilistic parameters and applying them to a Quantitative model.
Before becoming a Quantitative Trader , I was a Technical Analyst and a Discretionary Trader .
First as a position trader and then as a day trader.
Before becoming a Trader, I trained myself as a Technical Analyst , to masterly understand the shape and workings of the market in theory.
But everything changed when I met 'Mark Douglas' , when I got to know his works, that's when my head exploded 🤯, and I started to understand the market for good!
The market is nothing more than a 'random' system of distributing results.
See that I said: 'random' .
Do yourself a mental exercise.
Is there really such a thing as random ?
I believe not, as far as we know maybe the 'singularity'.
So thinking this way, to translate, the market is nothing more than a game of probability, statistics and pure mathematics.
Like a casino!
What happens is that most traders, whenever they take a position, take it with all the empirical certainty that such position will win or lose, and do not take into consideration the total sequence of results to understand their place in the market.
Understanding your place in the market gives you the ability to create and design systems that can exploit the present market anomaly, and thus make money statistically, consistently, and 100% automated.
Thinking of it this way, it is easy to make money from the market.
There are many ways to make money from the market, but the only consistent way I know of is through 'probabilistic and automated statistical trading'.
1️⃣1️⃣ : ❓ How to build a Quantitative Trading system ❓
There are some fundamental points that must be addressed here in order to understand what makes up a system based on statistics and probability applied to a quantitative model.
When we talk about 'discretionary' trading, it is a trading system based on human decisions after the defined 'empirical' conditions are met.
It is quite another thing to build a fully automated system without any human interference/interaction .
That said:
Building a statistically profitable system is perfectly possible, but this is a high level task , but with possible high rewards and consistent gains.
Here you will find a real "Skin In The Game" strategy.
With all due respect, but the vast majority of traders who post strategies on TradingView do not understand what they are doing.
Most of them do not understand the minimum complexity involved in the main variable for the construction of a real strategy, the mother variable: "strategy".
I say this by my own experience, because I have analyzed practically all the existing publications of TradingView + 200,000 indicators and strategies.
I breathe pinescript, I eat pinescript, I sleep pinescript, I bathe pinescript, I live TradingView.
But the main advantage for the TradingView users, is that all entry and exit orders made by this strategy can be checked and analyzed thoroughly, to validate and prove the veracity of this strategy, because this is a 100% real strategy.
Here there is a huge world of possibilities, but only one way to build a 'pinescript strategy' that will work correctly aligned to the real world with real results .
There are some fundamental points to take into consideration when building a profitable trading system:
The most important of these for me is: 'DrawDown' .
Followed by: 'Hit Rate' .
And only after that we use the parameter: 'Profit'.
See, this is because here, we are dealing with the 'imponderable' , and anything can happen in this scenario.
But there is one thing that makes us sleep peacefully at night, and that is: controlling losses .
That is, in other words: controlling the DrawDown .
The amateur is concerned with 'winning', the professional is concerned with conserving capital.
If we have the losses under control, then we can move on to the other two parameters: hit rate and profit.
See, the second most important factor in building a system is the hit rate.
I say this from my own experience.
I have worked with many systems with a 'low hit rate', but extremely profitable.
For example: systems with hit rates of 40 to 50%.
But as much as statistically and mathematically the profit is rewarding, operating systems with a low hit rate is always very stressful psychologically.
That's why there are two big reasons why when I build an automated trading system, I focus on the high hit rate of the system, they are
1 - To reduce psychological damage as much as possible .
2 - And more important , when we create a system with a 'high hit rate' , there is a huge intrinsic advantage here, that most statistic traders don't take in consideration.
That is: knowing more quickly when the system stops being functional.
The main advantage of a system with a high hit rate is: to identify when the system stops being functional and stop exploiting the market's anomaly.
Look: When we are talking about trading and random distribution of results on the market, do you agree that when we create a trading system, we are focused on exploring some anomaly of that market?
When that anomaly is verified by the market, it will stop being functional with time.
That's why trading systems, 'scalpers', especially for cryptocurrencies, need constant monitoring, quarterly, semi-annually or annually.
Because market movements change from time to time.
Because we go through different cycles from time to time, such as congestion cycles, accumulation , distribution , volatility , uptrends and downtrends .
1️⃣2️⃣ : ❓ How to Exploit Market Anomalies ❓
You see there is a very important point that must be stressed here.
As we are always trying to exploit an 'anomaly' in the market.
So the 'number' of indicators/tools that will integrate the system is of paramount importance.
But most traders do not take this into consideration.
To build a professional, robust, consistent, and profitable system, you don't need to use hundreds of indicators to build your setup.
This will actually make it harder to read when the setup stops working and needs some adjustment.
So focusing on a high hit rate is very important here, this is a fundamental principle that is widely ignored , and with a high hit rate, we can know much more accurately when the system is no longer functional much faster.
As Darwin said: "It is not the strongest or the most intelligent that wins the game of life, it is the most adapted.
So simple systems, as contradictory as it may seem, are more efficient, because they help to identify inflection points in the market much more quickly.
1️⃣3️⃣ : ❓ What Defines a Robust, Profitable and Consistent System ❓
See I have built, hundreds of thousands of indicators and 'pinescript' strategies, hundreds of thousands.
This is an extremely professional, robust and profitable system.
Based on the currency pairs: BTC /USDT
There are many ways and avenues to build a profitable trading setup/system.
And actually this is not a difficult task, taking in consideration, as the main factor here, that our trading and investment plan is for the long term, so consequently we will face scenarios with less noise.
He who is in a hurry eats raw.
As mentioned before.
Defining trends in pinescript is technically a simple task, the hardest task is to determine congestion zones with low volume and volatility, it's in these moments that many false signals are generated, and consequently is where most setups face their maximum DrawDown.
That's why this strategy was strictly and thoroughly planned, built on a very solid foundation, to avoid as much noise as possible, for a positive and consistent equity curve in each market cycle, 'Consistency' is our 'Mantra' around here.
1️⃣4️⃣ : 🔧 Fixed Technical
• Strategy: Titan Investments|Quantitative THEMIS|Demo|BINANCE:BTCUSDTP:4h
• Pair: BTC/USDTP
• Time Frame: 4 hours
• Broker: Binance (Recommended)
For a more conservative scenario, we have built the Quantitative THEMIS for the 4h time frame, with the main focus on consistency.
So we can avoid noise as much as possible!
1️⃣5️⃣ : ❌ Fixed Outputs : 🎯 TP(%) & 🛑SL(%)
In order to build a 'perpetual' system specific to BTC/USDT, it took a lot of testing, and more testing, and a lot of investment and research.
There is one initial and fundamental point that we can address to justify the incredible consistency presented here.
That fundamental point is our exit via Take Profit or Stop Loss percentage (%).
🎯 Take Profit (%)
🛑 Stop Loss (%)
See, today I have been testing some more advanced backtesting models for some cryptocurrency systems.
In which I perform 'backtest of backtest', i.e. we use a set of strategies each focused on a principle, operating individually, but they are part of something unique, i.e. we do 'backtests' of 'backtests' together.
What I mean is that we do a lot of backtesting around here.
I can assure you, that always the best output for a trading system is to set fixed output values!
In other words:
🎯 Take Profit (%)
🛑 Stop Loss (%)
This happens because statistically setting fixed exit structures in the vast majority of times, presents a superior result on the capital/equity curve, throughout history and for the vast majority of setups compared to other exit methods.
This is due to a mathematical principle of simplicity, 'avoiding more noise'.
Thus whenever the Quantitative THEMIS strategy takes a position it has a target and a defined maximum stop percentage.
1️⃣6️⃣ : ⚠️ Risk Profile
The strategy, currently has 3 risk profiles ⚠️ patterns for 'fixed percentage exits': Take Profit (%) and Stop Loss (%) .
They are: ⚠️ Rich's Profiles
✔️🆑 Conservative: 🎯 TP=2.7 % 🛑 SL=2.7 %
❌Ⓜ️ Moderate: 🎯 TP=2.8 % 🛑 SL=2.7 %
❌🅰 Aggressive: 🎯 TP=1.6 % 🛑 SL=6.9 %
You will be able to select and switch between the above options and profiles through the 'input' menu of the strategy by navigating to the "⚠️ Risk Profile" menu.
You can then select, test and apply the Risk Profile above that best suits your risk management, expectations and reality , as well as customize all the 'fixed exit' values through the TP and SL menus below.
1️⃣7️⃣ : ⭕ Moving Exits : (Indicators)
The strategy currently also has 'Moving Exits' based on indicator signals.
These are Moving Exits (Indicators)
📈 LONG : (EXIT)
🧃 (MAO) Short : true
📉 SHORT : (EXIT)
🧃 (MAO) Long: false
You can select and toggle between the above options through the 'input' menu of the strategy by navigating to the "LONG : Exit" and "SHORT : Exit" menu.
1️⃣8️⃣ : 💸 Initial Capital
By default the "Initial Capital" set for entries and backtests of this strategy is: 10000 $
You can set another value for the 'Starting Capital' through the tradingview menu under "properties" , and edit the value of the "Initial Capital" field.
This way you can set and test other 'Entry Values' for your trades, tests and backtests.
1️⃣9️⃣ : ⚙️ Entry Options
By default the 'order size' set for this strategy is 100 % of the 'initial capital' on each new trade.
You can set and test other entry options like : contracts , cash , % of equity
You should make these changes directly in the input menu of the strategy by navigating to the menu "⚙️ Properties : TradingView" below.
⚙️ Properties : (TradingView)
📊 Strategy Type: strategy.position_size != 1
📝💲 % Order Type: % of equity
📝💲 % Order Size: 100
Leverage: 1
So you can define and test other 'Entry Options' for your trades, tests and backtests.
2️⃣0️⃣ : ❓ How to Automate this Strategy ❓ : 🤖 Automation : 'Third-Party Services'
It is possible to automate the signals of this strategy for any centralized or decentralized broker, as well as for messaging services: Discord, Telegram and Twitter.
All in an extremely simple and uncomplicated way through the tutorials available in PDF /VIDEO for our Titan Pro 👽 subscriber community.
With our tutorials in PDF and Video it will be possible to automate the signals of this strategy for the chosen service in an extremely simple way with less than 10 steps only.
Tradingview naturally doesn't count with native integration between brokers and tradingview.
But it is possible to use 'third party services' to do the integration and automation between Tradingview and your centralized or decentralized broker.
Here are the standard, available and recommended 'third party services' to automate the signals from the 'Quantitative THEMIS' strategy on the tradingview for your broker:
1) Wundertrading (Recommended):
2) 3commas:
3) Zignaly:
4) Aleeert.com (Recommended):
5) Alertatron:
Note! 'Third party services' cannot perform 'withdrawals' via their key 'API', they can only open positions, so your funds will always be 'safe' in your brokerage firm, being traded via the 'API', when they receive an entry and exit signal from this strategy.
2️⃣1️⃣ : ❓ How to Automate this Strategy ❓ : 🤖 Automation : 'Exchanges
You can automate this strategy for any of the brokers below, through your broker's 'API' by connecting it to the 'third party automation services' for tradingview available and mentioned in the menu above:
1) Binance (Recommended)
2) Bitmex
3) Bybit
4) KuCoin
5) Deribit
6) OKX
7) Coinbase
8) Huobi
9) Bitfinex
10) Bitget
11) Bittrex
12) Bitstamp
13) Gate. io
14) Kraken
15) Gemini
16) Ascendex
17) VCCE
2️⃣2️⃣ : ❓ How to Automate this Strategy ❓ : 🤖 Automation : 'Messaging Services'
You can also automate and monitor the signals of this strategy much more efficiently by sending them to the following popular messaging services:
1) Discord
2) Telegram
3) Twitter
2️⃣3️⃣ : ❓ How to Automate this Strategy ❓ : 🤖 Automation : '🧲🤖Copy-Trading'
It will also be possible to copy/replicate the entries and exits of this strategy to your broker in an extremely simple and agile way, through the available copy-trader services.
This way it will be possible to replicate the signals of this strategy at each entry and exit to your broker through the API connecting it to the integrated copy-trader services available through the tradingview automation services below:
1) Wundetrading:
2) Zignaly:
2️⃣4️⃣ : ❔ Why be a Titan Pro 👽❔
I believe that today I am at another level in 'pinescript' development.
I consider myself today a true unicorn as a pinescript developer, someone unique and very rare.
If you choose another tool or another pinescript service, this tool will be just another one, with no real results.
But if you join our Titan community, you will have access to a unique tool! And you will get real results!
I already earn money consistently with statistical and automated trading and as an expert pinescript developer.
I am here to evolve my skills as much as possible, and one day become a pinescript 'Wizard'.
So excellence, quality and professionalism will always be my north here.
You will never find a developer like me, and who will take so seriously such a revolutionary project as this one. A Maverick! ▬ The man never stops!
Here you will find the highest degree of sophistication and development in the market for 'pinescript'.
You will get the best of me and the best of pinescript possible.
Let me show you how a professional in my field does it.
Become a Titan Pro Member 👽 and get Full Access to this strategy and all the Automation Tutorials.
Be the Titan in your life!
2️⃣5️⃣ : ❔ Why be a Titan Aff 🛸❔
Get financial return for your referrals, Decentralize the World, and raise the collective consciousness.
2️⃣6️⃣ : 📋 Summary : ⚖️ Strategy: Titan Investments|Quantitative THEMIS|Demo|BINANCE:BTCUSDTP:4h
® Titan Investimentos | Quantitative THEMIS ⚖️ | Demo 🐄 2.6 | Dev: © FilipeSoh 🧙 | 🤖 100% Automated : Discord, Telegram, Twitter, Wundertrading, 3commas, Zignaly, Aleeert, Alertatron, Uniswap-v3 | BINANCE:BTCUSDTPERP 4h
🛒 Subscribe this strategy ❗️ Be a Titan Member 🏛️
🛒 Titan Pro 👽 🔗 🏛️ Titan Pro 👽 Version with ✔️100% Integrated Automation 🤖 and 📚 Automation Tutorials ✔️100% available at: (PDF/VIDEO)
🛒 Titan Affiliate 🛸 🔗 🏛️ Titan Affiliate 🛸 (Subscription Sale) 🔥 Receive 50% commission
📋 Summary : QT THEMIS ⚖️
🕵️♂️ Check This Strategy..................................................................0
🦄 ® Titan Investimentos...............................................................1
👨💻 © Developer..........................................................................2
📚 Signal Automation Tutorials : (PDF/VIDEO).......................................3
👨🔧 Revision...............................................................................4
📊 Table : (BACKTEST)..................................................................5
📊 Table : (INFORMATIONS).............................................................6
⚙️ Properties : (TRADINGVIEW)........................................................7
📆 Backtest : (TRADINGVIEW)..........................................................8
⚠️ Risk Profile...........................................................................9
🟢 On 🔴 Off : (LONG/SHORT).......................................................10
📈 LONG : (ENTRY)....................................................................11
📉 SHORT : (ENTRY)...................................................................12
📈 LONG : (EXIT).......................................................................13
📉 SHORT : (EXIT)......................................................................14
🧩 (EI) External Indicator.............................................................15
📡 (QT) Quantitative...................................................................16
🎠 (FF) Forecast......................................................................17
🅱 (BB) Bollinger Bands................................................................18
🧃 (MAP) Moving Average Primary......................................................19
🧃 (MAP) Labels.........................................................................20
🍔 (MAQ) Moving Average Quaternary.................................................21
🍟 (MACD) Moving Average Convergence Divergence...............................22
📣 (VWAP) Volume Weighted Average Price........................................23
🪀 (HL) HILO..........................................................................24
🅾 (OBV) On Balance Volume.........................................................25
🥊 (SAR) Stop and Reverse...........................................................26
🛡️ (DSR) Dynamic Support and Resistance..........................................27
🔊 (VD) Volume Directional..........................................................28
🧰 (RSI) Relative Momentum Index.................................................29
🎯 (TP) Take Profit %..................................................................30
🛑 (SL) Stop Loss %....................................................................31
🤖 Automation Selected...............................................................32
📱💻 Discord............................................................................33
📱💻 Telegram..........................................................................34
📱💻 Twitter...........................................................................35
🤖 Wundertrading......................................................................36
🤖 3commas............................................................................37
🤖 Zignaly...............................................................................38
🤖 Aleeert...............................................................................39
🤖 Alertatron...........................................................................40
🤖 Uniswap-v3..........................................................................41
🧲🤖 Copy-Trading....................................................................42
♻️ ® No Repaint........................................................................43
🔒 Copyright ©️..........................................................................44
🏛️ Be a Titan Member..................................................................45
Nº Active Users..........................................................................46
⏱ Time Left............................................................................47
| 0 | 🕵️♂️ Check This Strategy
🕵️♂️ Version Demo: 🐄 Version with ❌non-integrated automation 🤖 and 📚 Tutorials for automation ❌not available
🕵️♂️ Version Pro: 👽 Version with ✔️100% Integrated Automation 🤖 and 📚 Automation Tutorials ✔️100% available at: (PDF/VIDEO)
| 1 | 🦄 ® Titan Investimentos
Decentralizing the World 🗺
Raising the Collective Conscience 🗺
🦄Site:
🦄TradingView: www.tradingview.com
🦄Discord:
🦄Telegram:
🦄Youtube:
🦄Twitter:
🦄Instagram:
🦄TikTok:
🦄Linkedin:
🦄E-mail:
| 2 | 👨💻 © Developer
🧠 Developer: @FilipeSoh🧙
📺 TradingView: www.tradingview.com
☑️ Linkedin:
✅ Fiverr:
✅ Upwork:
🎥 YouTube:
🐤 Twitter:
🤳 Instagram:
| 3 | 📚 Signal Automation Tutorials : (PDF/VIDEO)
📚 Discord: 🔗 Link: 🔒Titan Pro👽
📚 Telegram: 🔗 Link: 🔒Titan Pro👽
📚 Twitter: 🔗 Link: 🔒Titan Pro👽
📚 Wundertrading: 🔗 Link: 🔒Titan Pro👽
📚 3comnas: 🔗 Link: 🔒Titan Pro👽
📚 Zignaly: 🔗 Link: 🔒Titan Pro👽
📚 Aleeert: 🔗 Link: 🔒Titan Pro👽
📚 Alertatron: 🔗 Link: 🔒Titan Pro👽
📚 Uniswap-v3: 🔗 Link: 🔒Titan Pro👽
📚 Copy-Trading: 🔗 Link: 🔒Titan Pro👽
| 4 | 👨🔧 Revision
👨🔧 Start Of Operations: 01 Jan 2019 21:00 -0300 💡 Start Of Operations (Skin in the game) : Revision 1.0
👨🔧 Previous Review: 01 Jan 2022 21:00 -0300 💡 Previous Review : Revision 2.0
👨🔧 Current Revision: 01 Jan 2023 21:00 -0300 💡 Current Revision : Revision 2.6
👨🔧 Next Revision: 28 May 2023 21:00 -0300 💡 Next Revision : Revision 2.7
| 5 | 📊 Table : (BACKTEST)
📊 Table: true
🖌️ Style: label.style_label_left
📐 Size: size_small
📏 Line: defval
🎨 Color: #131722
| 6 | 📊 Table : (INFORMATIONS)
📊 Table: false
🖌️ Style: label.style_label_right
📐 Size: size_small
📏 Line: defval
🎨 Color: #131722
| 7 | ⚙️ Properties : (TradingView)
📊 Strategy Type: strategy.position_size != 1
📝💲 % Order Type: % of equity
📝💲 % Order Size: 100 %
🚀 Leverage: 1
| 8 | 📆 Backtest : (TradingView)
🗓️ Mon: true
🗓️ Tue: true
🗓️ Wed: true
🗓️ Thu: true
🗓️ Fri: true
🗓️ Sat: true
🗓️ Sun: true
📆 Range: custom
📆 Start: UTC 31 Oct 2008 00:00
📆 End: UTC 31 Oct 2030 23:45
📆 Session: 0000-0000
📆 UTC: UTC
| 9 | ⚠️ Risk Profile
✔️🆑 Conservative: 🎯 TP=2.7 % 🛑 SL=2.7 %
❌Ⓜ️ Moderate: 🎯 TP=2.8 % 🛑 SL=2.7 %
❌🅰 Aggressive: 🎯 TP=1.6 % 🛑 SL=6.9 %
| 10 | 🟢 On 🔴 Off : (LONG/SHORT)
🟢📈 LONG: true
🟢📉 SHORT: true
| 11 | 📈 LONG : (ENTRY)
📡 (QT) Long: true
🧃 (MAP) Long: false
🅱 (BB) Long: false
🍟 (MACD) Long: false
🅾 (OBV) Long: false
| 12 | 📉 SHORT : (ENTRY)
📡 (QT) Short: true
🧃 (MAP) Short: false
🅱 (BB) Short: false
🍟 (MACD) Short: false
🅾 (OBV) Short: false
| 13 | 📈 LONG : (EXIT)
🧃 (MAP) Short: true
| 14 | 📉 SHORT : (EXIT)
🧃 (MAP) Long: false
| 15 | 🧩 (EI) External Indicator
🧩 (EI) Connect your external indicator/filter: false
🧩 (EI) Connect your indicator here (Study mode only): close
🧩 (EI) Connect your indicator here (Study mode only): close
| 16 | 📡 (QT) Quantitative
📡 (QT) Quantitative: true
📡 (QT) Market: BINANCE:BTCUSDTPERP
📡 (QT) Dice: openai
| 17 | 🎠 (FF) Forecast
🎠 (FF) Include current unclosed current candle: true
🎠 (FF) Forecast Type: flat
🎠 (FF) Nº of candles to use in linear regression: 3
| 18 | 🅱 (BB) Bollinger Bands
🅱 (BB) Bollinger Bands: true
🅱 (BB) Type: EMA
🅱 (BB) Period: 20
🅱 (BB) Source: close
🅱 (BB) Multiplier: 2
🅱 (BB) Linewidth: 0
🅱 (BB) Color: #131722
| 19 | 🧃 (MAP) Moving Average Primary
🧃 (MAP) Moving Average Primary: true
🧃 (MAP) BarColor: false
🧃 (MAP) Background: false
🧃 (MAP) Type: SMA
🧃 (MAP) Source: open
🧃 (MAP) Period: 100
🧃 (MAP) Multiplier: 2.0
🧃 (MAP) Linewidth: 2
🧃 (MAP) Color P: #42bda8
🧃 (MAP) Color N: #801922
| 20 | 🧃 (MAP) Labels
🧃 (MAP) Labels: true
🧃 (MAP) Style BUY ZONE: shape.labelup
🧃 (MAP) Color BUY ZONE: #42bda8
🧃 (MAP) Style SELL ZONE: shape.labeldown
🧃 (MAP) Color SELL ZONE: #801922
| 21 | 🍔 (MAQ) Moving Average Quaternary
🍔 (MAQ) Moving Average Quaternary: true
🍔 (MAQ) BarColor: false
🍔 (MAQ) Background: false
🍔 (MAQ) Type: SMA
🍔 (MAQ) Source: close
🍔 (MAQ) Primary: 14
🍔 (MAQ) Secondary: 22
🍔 (MAQ) Tertiary: 44
🍔 (MAQ) Quaternary: 16
🍔 (MAQ) Linewidth: 0
🍔 (MAQ) Color P: #42bda8
🍔 (MAQ) Color N: #801922
| 22 | 🍟 (MACD) Moving Average Convergence Divergence
🍟 (MACD) Macd Type: EMA
🍟 (MACD) Signal Type: EMA
🍟 (MACD) Source: close
🍟 (MACD) Fast: 12
🍟 (MACD) Slow: 26
🍟 (MACD) Smoothing: 9
| 23 | 📣 (VWAP) Volume Weighted Average Price
📣 (VWAP) Source: close
📣 (VWAP) Period: 340
📣 (VWAP) Momentum A: 84
📣 (VWAP) Momentum B: 150
📣 (VWAP) Average Volume: 1
📣 (VWAP) Multiplier: 1
📣 (VWAP) Diviser: 2
| 24 | 🪀 (HL) HILO
🪀 (HL) Type: SMA
🪀 (HL) Function: Maverick🧙
🪀 (HL) Source H: high
🪀 (HL) Source L: low
🪀 (HL) Period: 20
🪀 (HL) Momentum: 26
🪀 (HL) Diviser: 2
🪀 (HL) Multiplier: 1
| 25 | 🅾 (OBV) On Balance Volume
🅾 (OBV) Type: EMA
🅾 (OBV) Source: close
🅾 (OBV) Period: 16
🅾 (OBV) Diviser: 2
🅾 (OBV) Multiplier: 1
| 26 | 🥊 (SAR) Stop and Reverse
🥊 (SAR) Source: close
🥊 (SAR) High: 1.8
🥊 (SAR) Mid: 1.6
🥊 (SAR) Low: 1.6
🥊 (SAR) Diviser: 2
🥊 (SAR) Multiplier: 1
| 27 | 🛡️ (DSR) Dynamic Support and Resistance
🛡️ (DSR) Source D: close
🛡️ (DSR) Source R: high
🛡️ (DSR) Source S: low
🛡️ (DSR) Momentum R: 0
🛡️ (DSR) Momentum S: 2
🛡️ (DSR) Diviser: 2
🛡️ (DSR) Multiplier: 1
| 28 | 🔊 (VD) Volume Directional
🔊 (VD) Type: SMA
🔊 (VD) Period: 68
🔊 (VD) Momentum: 3.8
🔊 (VD) Diviser: 2
🔊 (VD) Multiplier: 1
| 29 | 🧰 (RSI) Relative Momentum Index
🧰 (RSI) Type UP: EMA
🧰 (RSI) Type DOWN: EMA
🧰 (RSI) Source: close
🧰 (RSI) Period: 29
🧰 (RSI) Smoothing: 22
🧰 (RSI) Momentum R: 64
🧰 (RSI) Momentum S: 142
🧰 (RSI) Diviser: 2
🧰 (RSI) Multiplier: 1
| 30 | 🎯 (TP) Take Profit %
🎯 (TP) Take Profit: false
🎯 (TP) %: 2.2
🎯 (TP) Color: #42bda8
🎯 (TP) Linewidth: 1
| 31 | 🛑 (SL) Stop Loss %
🛑 (SL) Stop Loss: false
🛑 (SL) %: 2.7
🛑 (SL) Color: #801922
🛑 (SL) Linewidth: 1
| 32 | 🤖 Automation : Discord | Telegram | Twitter | Wundertrading | 3commas | Zignaly | Aleeert | Alertatron | Uniswap-v3
🤖 Automation Selected : Discord
| 33 | 🤖 Discord
🔗 Link Discord:
🔗 Link 📚 Automation: 🔒Titan Pro👽
📱💻 Discord ▬ Enter Long: 🔒Titan Pro👽
📱💻 Discord ▬ Exit Long: 🔒Titan Pro👽
📱💻 Discord ▬ Enter Short: 🔒Titan Pro👽
📱💻 Discord ▬ Exit Short: 🔒Titan Pro👽
| 34 | 🤖 Telegram
🔗 Link Telegram:
🔗 Link 📚 Automation: 🔒Titan Pro👽
📱💻 Telegram ▬ Enter Long: 🔒Titan Pro👽
📱💻 Telegram ▬ Exit Long: 🔒Titan Pro👽
📱💻 Telegram ▬ Enter Short: 🔒Titan Pro👽
📱💻 Telegram ▬ Exit Short: 🔒Titan Pro👽
| 35 | 🤖 Twitter
🔗 Link Twitter:
🔗 Link 📚 Automation: 🔒Titan Pro👽
📱💻 Twitter ▬ Enter Long: 🔒Titan Pro👽
📱💻 Twitter ▬ Exit Long: 🔒Titan Pro👽
📱💻 Twitter ▬ Enter Short: 🔒Titan Pro👽
📱💻 Twitter ▬ Exit Short: 🔒Titan Pro👽
| 36 | 🤖 Wundertrading : Binance | Bitmex | Bybit | KuCoin | Deribit | OKX | Coinbase | Huobi | Bitfinex | Bitget
🔗 Link Wundertrading:
🔗 Link 📚 Automation: 🔒Titan Pro👽
📱💻 Wundertrading ▬ Enter Long: 🔒Titan Pro👽
📱💻 Wundertrading ▬ Exit Long: 🔒Titan Pro👽
📱💻 Wundertrading ▬ Enter Short: 🔒Titan Pro👽
📱💻 Wundertrading ▬ Exit Short: 🔒Titan Pro👽
| 37 | 🤖 3commas : Binance | Bybit | OKX | Bitfinex | Coinbase | Deribit | Bitmex | Bittrex | Bitstamp | Gate.io | Kraken | Gemini | Huobi | KuCoin
🔗 Link 3commas:
🔗 Link 📚 Automation: 🔒Titan Pro👽
📱💻 3commas ▬ Enter Long: 🔒Titan Pro👽
📱💻 3commas ▬ Exit Long: 🔒Titan Pro👽
📱💻 3commas ▬ Enter Short: 🔒Titan Pro👽
📱💻 3commas ▬ Exit Short: 🔒Titan Pro👽
| 38 | 🤖 Zignaly : Binance | Ascendex | Bitmex | Kucoin | VCCE
🔗 Link Zignaly:
🔗 Link 📚 Automation: 🔒Titan Pro👽
🤖 Type Automation: Profit Sharing
🤖 Type Provider: Webook
🔑 Key: 🔒Titan Pro👽
🤖 pair: BTCUSDTP
🤖 exchange: binance
🤖 exchangeAccountType: futures
🤖 orderType: market
🚀 leverage: 1x
% positionSizePercentage: 100 %
💸 positionSizeQuote: 10000 $
🆔 signalId: @Signal1234
| 39 | 🤖 Aleeert : Binance
🔗 Link Aleeert:
🔗 Link 📚 Automation: 🔒Titan Pro👽
📱💻 Aleeert ▬ Enter Long: 🔒Titan Pro👽
📱💻 Aleeert ▬ Exit Long: 🔒Titan Pro👽
📱💻 Aleeert ▬ Enter Short: 🔒Titan Pro👽
📱💻 Aleeert ▬ Exit Short: 🔒Titan Pro👽
| 40 | 🤖 Alertatron : Binance | Bybit | Deribit | Bitmex
🔗 Link Alertatron:
🔗 Link 📚 Automation: 🔒Titan Pro👽
📱💻 Alertatron ▬ Enter Long: 🔒Titan Pro👽
📱💻 Alertatron ▬ Exit Long: 🔒Titan Pro👽
📱💻 Alertatron ▬ Enter Short: 🔒Titan Pro👽
📱💻 Alertatron ▬ Exit Short: 🔒Titan Pro👽
| 41 | 🤖 Uniswap-v3
🔗 Link Alertatron:
🔗 Link 📚 Automation: 🔒Titan Pro👽
📱💻 Uniswap-v3 ▬ Enter Long: 🔒Titan Pro👽
📱💻 Uniswap-v3 ▬ Exit Long: 🔒Titan Pro👽
📱💻 Uniswap-v3 ▬ Enter Short: 🔒Titan Pro👽
📱💻 Uniswap-v3 ▬ Exit Short: 🔒Titan Pro👽
| 42 | 🧲🤖 Copy-Trading : Zignaly | Wundertrading
🔗 Link 📚 Copy-Trading: 🔒Titan Pro👽
🧲🤖 Copy-Trading ▬ Zignaly: 🔒Titan Pro👽
🧲🤖 Copy-Trading ▬ Wundertrading: 🔒Titan Pro👽
| 43 | ♻️ ® Don't Repaint!
♻️ This Strategy does not Repaint!: ® Signs Do not repaint❕
♻️ This is a Real Strategy!: Quality : ® Titan Investimentos
📋️️ Get more information about Repainting here:
| 44 | 🔒 Copyright ©️
🔒 Copyright ©️: Copyright © 2023-2024 All rights reserved, ® Titan Investimentos
🔒 Copyright ©️: ® Titan Investimentos
🔒 Copyright ©️: Unique and Exclusive Strategy. All rights reserved
| 45 | 🏛️ Be a Titan Members
🏛️ Titan Pro 👽 Version with ✔️100% Integrated Automation 🤖 and 📚 Automation Tutorials ✔️100% available at: (PDF/VIDEO)
🏛️ Titan Affiliate 🛸 (Subscription Sale) 🔥 Receive 50% commission
| 46 | ⏱ Time Left
Time Left Titan Demo 🐄: ⏱♾ | ⏱ : ♾ Titan Demo 🐄 Version with ❌non-integrated automation 🤖 and 📚 Tutorials for automation ❌not available
Time Left Titan Pro 👽: 🔒Titan Pro👽 | ⏱ : Pro Plans: 30 Days, 90 Days, 12 Months, 24 Months. (👽 Pro 🅼 Monthly, 👽 Pro 🆀 Quarterly, 👽 Pro🅰 Annual, 👽 Pro👾Two Years)
| 47 | Nº Active Users
Nº Active Subscribers Titan Pro 👽: 5️⃣6️⃣ | 1✔️ 5✔️ 10✔️ 100❌ 1K❌ 10K❌ 50K❌ 100K❌ 1M❌ 10M❌ 100M❌ : ⏱ Active Users is updated every 24 hours (Check on indicator)
Nº Active Affiliates Titan Aff 🛸: 6️⃣ | 1✔️ 5✔️ 10❌ 100❌ 1K❌ 10K❌ 50K❌ 100K❌ 1M❌ 10M❌ 100M❌ : ⏱ Active Users is updated every 24 hours (Check on indicator)
2️⃣7️⃣ : 📊 PERFORMANCE : 🆑 Conservative
📊 Exchange: Binance
📊 Pair: BINANCE: BTCUSDTPERP
📊 TimeFrame: 4h
📊 Initial Capital: 10000 $
📊 Order Type: % equity
📊 Size Per Order: 100 %
📊 Commission: 0.03 %
📊 Pyramid: 1
• ⚠️ Risk Profile: 🆑 Conservative: 🎯 TP=2.7 % | 🛑 SL=2.7 %
• 📆All years: 🆑 Conservative: 🚀 Leverage 1️⃣x
📆 Start: September 23, 2019
📆 End: January 11, 2023
📅 Days: 1221
📅 Bars: 7325
Net Profit:
🟢 + 1669.89 %
💲 + 166989.43 USD
Total Close Trades:
⚪️ 369
Percent Profitable:
🟡 64.77 %
Profit Factor:
🟢 2.314
DrawDrown Maximum:
🔴 -24.82 %
💲 -10221.43 USD
Avg Trade:
💲 + 452.55 USD
✔️ Trades Winning: 239
❌ Trades Losing: 130
✔️ Average Gross Win: + 12.31 %
❌ Average Gross Loss: - 9.78 %
✔️ Maximum Consecutive Wins: 9
❌ Maximum Consecutive Losses: 6
% Average Gain Annual: 499.33 %
% Average Gain Monthly: 41.61 %
% Average Gain Weekly: 9.6 %
% Average Gain Day: 1.37 %
💲 Average Gain Annual: 49933 $
💲 Average Gain Monthly: 4161 $
💲 Average Gain Weekly: 960 $
💲 Average Gain Day: 137 $
• 📆 Year: 2020: 🆑 Conservative: 🚀 Leverage 1️⃣x
• 📆 Year: 2021: 🆑 Conservative: 🚀 Leverage 1️⃣x
• 📆 Year: 2022: 🆑 Conservative: 🚀 Leverage 1️⃣x
2️⃣8️⃣ : 📊 PERFORMANCE : Ⓜ️ Moderate
📊 Exchange: Binance
📊 Pair: BINANCE: BTCUSDTPERP
📊 TimeFrame: 4h
📊 Initial Capital: 10000 $
📊 Order Type: % equity
📊 Size Per Order: 100 %
📊 Commission: 0.03 %
📊 Pyramid: 1
• ⚠️ Risk Profile: Ⓜ️ Moderate: 🎯 TP=2.8 % | 🛑 SL=2.7 %
• 📆 All years: Ⓜ️ Moderate: 🚀 Leverage 1️⃣x
📆 Start: September 23, 2019
📆 End: January 11, 2023
📅 Days: 1221
📅 Bars: 7325
Net Profit:
🟢 + 1472.04 %
💲 + 147199.89 USD
Total Close Trades:
⚪️ 362
Percent Profitable:
🟡 63.26 %
Profit Factor:
🟢 2.192
DrawDrown Maximum:
🔴 -22.69 %
💲 -9269.33 USD
Avg Trade:
💲 + 406.63 USD
✔️ Trades Winning: 229
❌ Trades Losing : 133
✔️ Average Gross Win: + 11.82 %
❌ Average Gross Loss: - 9.29 %
✔️ Maximum Consecutive Wins: 9
❌ Maximum Consecutive Losses: 8
% Average Gain Annual: 440.15 %
% Average Gain Monthly: 36.68 %
% Average Gain Weekly: 8.46 %
% Average Gain Day: 1.21 %
💲 Average Gain Annual: 44015 $
💲 Average Gain Monthly: 3668 $
💲 Average Gain Weekly: 846 $
💲 Average Gain Day: 121 $
• 📆 Year: 2020: Ⓜ️ Moderate: 🚀 Leverage 1️⃣x
• 📆 Year: 2021: Ⓜ️ Moderate: 🚀 Leverage 1️⃣x
• 📆 Year: 2022: Ⓜ️ Moderate: 🚀 Leverage 1️⃣x
2️⃣9️⃣ : 📊 PERFORMANCE : 🅰 Aggressive
📊 Exchange: Binance
📊 Pair: BINANCE: BTCUSDTPERP
📊 TimeFrame: 4h
📊 Initial Capital: 10000 $
📊 Order Type: % equity
📊 Size Per Order: 100 %
📊 Commission: 0.03 %
📊 Pyramid: 1
• ⚠️ Risk Profile: 🅰 Aggressive: 🎯 TP=1.6 % | 🛑 SL=6.9 %
• 📆 All years: 🅰 Aggressive: 🚀 Leverage 1️⃣x
📆 Start: September 23, 2019
📆 End: January 11, 2023
📅 Days: 1221
📅 Bars: 7325
Net Profit:
🟢 + 989.38 %
💲 + 98938.38 USD
Total Close Trades:
⚪️ 380
Percent Profitable:
🟢 84.47 %
Profit Factor:
🟢 2.156
DrawDrown Maximum:
🔴 -17.88 %
💲 -9182.84 USD
Avg Trade:
💲 + 260.36 USD
✔️ Trades Winning: 321
❌ Trades Losing: 59
✔️ Average Gross Win: + 5.75 %
❌ Average Gross Loss: - 14.51 %
✔️ Maximum Consecutive Wins: 21
❌ Maximum Consecutive Losses: 6
% Average Gain Annual: 295.84 %
% Average Gain Monthly: 24.65 %
% Average Gain Weekly: 5.69 %
% Average Gain Day: 0.81 %
💲 Average Gain Annual: 29584 $
💲 Average Gain Monthly: 2465 $
💲 Average Gain Weekly: 569 $
💲 Average Gain Day: 81 $
• 📆 Year: 2020: 🅰 Aggressive: 🚀 Leverage 1️⃣x
• 📆 Year: 2021: 🅰 Aggressive: 🚀 Leverage 1️⃣x
• 📆 Year: 2022: 🅰 Aggressive: 🚀 Leverage 1️⃣x
3️⃣0️⃣ : 🛠️ Roadmap
🛠️• 14/ 01 /2023 : Titan THEMIS Launch
🛠️• Updates January/2023 :
• 📚 Tutorials for Automation 🤖 already Available : ✔️
• ✔️ Discord
• ✔️ Wundertrading
• ✔️ Zignaly
• 📚 Tutorials for Automation 🤖 In Preparation : ⭕
• ⭕ Telegram
• ⭕ Twitter
• ⭕ 3comnas
• ⭕ Aleeert
• ⭕ Alertatron
• ⭕ Uniswap-v3
• ⭕ Copy-Trading
🛠️• Updates February/2023 :
• 📰 Launch of advertising material for Titan Affiliates 🛸
• 🛍️🎥🖼️📊 (Sales Page/VSL/Videos/Creative/Infographics)
🛠️• 28/05/2023 : Titan THEMIS update ▬ Version 2.7
🛠️• 28/05/2023 : BOT BOB release ▬ Version 1.0
• (Native Titan THEMIS Automation - Through BOT BOB, a bot for automation of signals, indicators and strategies of TradingView, of own code ▬ in validation.
• BOT BOB
Automation/Connection :
• API - For Centralized Brokers.
• Smart Contracts - Wallet Web - For Decentralized Brokers.
• This way users can automate any indicator or strategy of TradingView and Titan in a decentralized, secure and simplified way.
• Without having the need to use 'third party services' for automating TradingView indicators and strategies like the ones available above.
🛠️• 28/05/2023 : Release ▬ Titan Culture Guide 📝
3️⃣1️⃣ : 🧻 Notes ❕
🧻 • Note ❕ The "Demo 🐄" version, ❌does not have 'integrated automation', to automate the signals of this strategy and enjoy a fully automated system, you need to have access to the Pro version with '100% integrated automation' and all the tutorials for automation available. Become a Titan Pro 👽
🧻 • Note ❕ You will also need to be a "Pro User or higher on Tradingview", to be able to use the webhook feature available only for 'paid' profiles on the platform.
With the webhook feature it is possible to send the signals of this strategy to almost anywhere, in our case to centralized or decentralized brokerages, also to popular messaging services such as: Discord, Telegram or Twiter.
3️⃣2️⃣ : 🚨 Disclaimer ❕❗
🚨 • Disclaimer ❕❕ Past positive result and performance of a system does not guarantee its positive result and performance for the future!
🚨 • Disclaimer ❗❗❗ When using this strategy: Titan Investments is totally Exempt from any claim of liability for losses. The responsibility on the management of your funds is solely yours. This is a very high risk/volatility market! Understand your place in the market.
3️⃣3️⃣ : ♻️ ® No Repaint
This Strategy does not Repaint! This is a real strategy!
3️⃣4️⃣ : 🔒 Copyright ©️
Copyright © 2022-2023 All rights reserved, ® Titan Investimentos
3️⃣5️⃣ : 👏 Acknowledgments
I want to start this message in thanks to TradingView and all the Pinescript community for all the 'magic' created here, a unique ecosystem! rich and healthy, a fertile soil, a 'new world' of possibilities, for a complete deepening and improvement of our best personal skills.
I leave here my immense thanks to the whole community: Tradingview, Pinecoders, Wizards and Moderators.
I was not born Rich .
Thanks to TradingView and pinescript and all its transformation.
I could develop myself and the best of me and the best of my skills.
And consequently build wealth and patrimony.
Gratitude.
One more story for the infinite book !
If you were born poor you were born to be rich !
Raising🔼 the level and raising🔼 the ruler! 📏
My work is my 'debauchery'! Do better! 💐🌹
Soul of a first-timer! Creativity Exudes! 🦄
This is the manifestation of God's magic in me. This is the best of me. 🧙
You will copy me, I know. So you owe me. 💋
My mission here is to raise the consciousness and self-esteem of all Titans and Titanids! Welcome! 🧘 🏛️
The only way to accomplish great work is to do what you love ! Before I learned to program I was wasting my life!
Death is the best creation of life .
Now you are the new , but in the not so distant future you will gradually become the old . Here I stay forever!
Playing the game like an Athlete! 🖼️ Enjoy and Enjoy 🍷 🗿
In honor of: BOB ☆
1 name, 3 letters, 3 possibilities, and if read backwards it's the same thing, a palindrome. ☘
Gratitude to the oracles that have enabled me the 'luck' to get this far: Dal&Ni&Fer
3️⃣6️⃣ : 👮 House Rules : 📺 TradingView
House Rules : This publication and strategy follows all TradingView house guidelines and rules:
📺 TradingView House Rules: www.tradingview.com
📺 Script publication rules: www.tradingview.com
📺 Vendor requirements: www.tradingview.com
📺 Links/References rules: www.tradingview.com
3️⃣7️⃣ : 🏛️ Become a Titan Pro member 👽
🟩 Titan Pro 👽 🟩
3️⃣8️⃣ : 🏛️ Be a member Titan Aff 🛸
🟥 Titan Affiliate 🛸 🟥

The Gral : Alpha Scalping Demo (Atom)You want to make money. This bot will allow you to do it.
We know how it can be challenging, frustrating, struggling to make money especially in bear market. Save your energy, your emotions, your nerves! Alpha Scalping will allow you to sleep better and make money while you sleep!
We tested hundreds of indicators, strategies, mt4 ea and bots since 2010, today we will start to release a series of successful bots and automatic strategies for you, some of them will be free, some of them will be paid (monthly subscriptions)
We will also indicate how to connect the Alpha Scalping to your Binance or FTX account so you can trade automatically.
Enjoy, subscribe and stay tuned!
NB : This bot is a demo only, it will work only on ATOMUSDTPERP
Bot for ALGOUSDTPERP :

The Gral : Alpha Scalping Demo (Algo) You want to make money. This bot will allow you to do it.
We know how it can be challenging, frustrating, struggling to make money especially in bear market. Save your energy, your emotions, your nerves! Alpha Scalping will allow you to sleep better and make money while you sleep!
We tested hundreds of indicators, strategies, mt4 ea and bots since 2010, today we will start to release a series of successful bots and automatic strategies for you, some of them will be free, some of them will be paid (monthly subscriptions)
We will alsoindicate how to connect the Alpha Scalping to your Binance or FTX account so you can trade automatically.
Enjoy, subscribe and stay tuned!
NB : This bot is a demo only, it will work only on ALGOUSDTPERP
Bot for ATOMUSDTPERP :
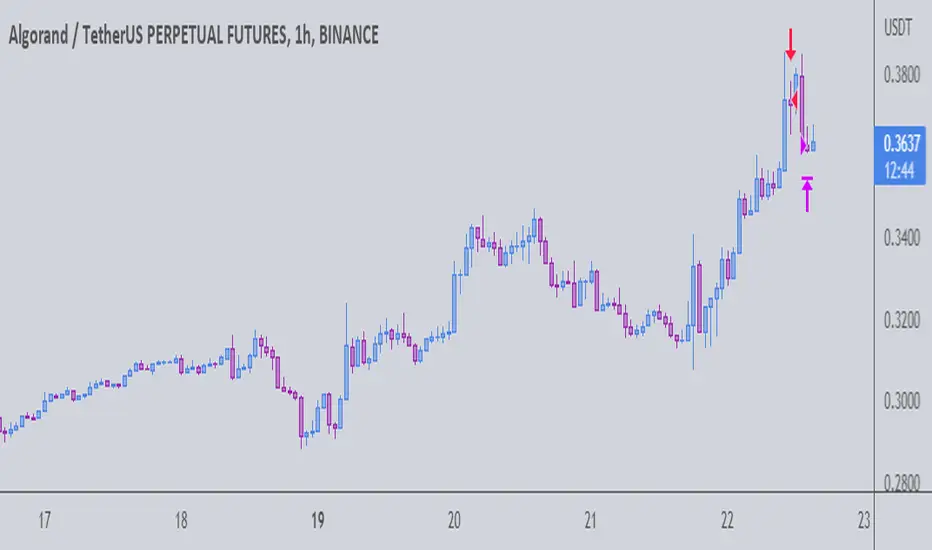
3C MACD & RSI Scalper no repaintThis is not a set and forget strategy. It needs constant tweaking to maintain a high winrate. Also what works on one pair can be horrible on another.
This strategy works best on the 1 min or 5 min TF but also works well on the 15 min. Haven't done any testing in higher TF's as im only interested in scalping.
If enabled you can retrive data on the MACD and RSI from any timeframe.
The strategy do not repaint.
You can filter on sessions as well as days. Often trading during say only the EU times and not trading during weekends yields better results. This is because weekeds and eg. the Asia Sessions are alot less volatile.
You do not need a 3c subscription to run this strategy as the bot turns on and off the bot itself.
Instructions for the 3commas connector:
1. First, you need to prepare 3commas Long/Short bots that will only listen to custom TV signals.
2. Inputs for the 3commas bot can be found at the end of the user inputs.
3. Once you have entered the required details into the inputs, turn on 3commas comments. They should appear on the chart (looks messy).
4. Now you can add the alert where you should paste the 3commas Webhook URL: 3commas.io
5. For the alert message text insert the placeholder {{strategy.order.comment}} and delete the rest. 6. Once the alert is saved, you can turn off those 3commas comments to have a clearer chart.
7. With a new alert, the bot and trade should launch.
Long or Short trades are determined with a crossing of the fast MA over the slow MA for Long and the opposite for Short. Trades should only happen close to the crossovers.
You can select from various different MA's and of course lenghts. I often find that using HEMA as the fast MA and DEMA as the slow give more trades while also maintaining a high winrate.
Then for Long we use the MACD indicator where we look for high peaks in negative values for Long and vice versa for Shorts. These should be significantly higher than other peaks (or if you will lower peaks for a Long).
The key is to detect high peaks on the histogram, which we will try to achieve by checking if the last 2 values were higher than X bars back. If you want to make it even more specific, then you can turn on the additional checkbox which compares the current value to the average value of X bars back, and if it is greater than, say, 72% the value of the average then it's ok to enter the trade.
The RSI filter, sets the maximum RSI threshold for a long position and the minimum for a short. By default and what i recomend is that you enter Longs when RSI is above 50 and shorts when RSI are below 50.
-You can set confirmation of the trade direction with RSI, i.e. for Long the RSI must rise a specified number of bars back, vice versa for Short.
Enabling the pullback filter is great to avoid Longing tops and Shorting bottoms.
Whats ahead. I really want to incorporate RSI divergencies, but haven't figured out how yet. Any other ideas would be greatly appreciated.
Have a look at my other strategies. They are similar to this but works abit differently.
The 3 strike line and the engulfing candles are not something that has an impact on the script yet, and might never be. But i do like to turn them on for a visual to see if the trade the strategy opened is a good one.

Bjorgum Double Tap█ OVERVIEW
Double Tap is a pattern recognition script aimed at detecting Double Tops and Double Bottoms. Double Tap can be applied to the broker emulator to observe historical results, run as a trading bot for live trade alerts in real time with entry signals, take profit, and stop orders, or to simply detect patterns.
█ CONCEPTS
How Is A Pattern Defined?
Doubles are technical formations that are both reversal patterns and breakout patterns. These formations typically have a distinctive “M” or a “W” shape with price action breaking beyond the neckline formed by the center of the pattern. They can be recognized when a pivot fails to break when tested for a second time and the retracement that follows breaks beyond the key level opposite. This can trap entrants that were playing in the direction of the prior trend. Entries are made on the breakout with a target projected beyond the neckline equal to the height of the pattern.
Pattern Recognition
Patterns are recognized through the use of zig-zag; a method of filtering price action by connecting swing highs and lows in an alternating fashion to establish trend, support and resistance, or derive shapes from price action. The script looks for the highest or lowest point in a given number of bars and updates a list with the values as they form. If the levels are exceeded, the values are updated. If the direction changes and a new significant point is made, a new point is added to the list and the process starts again. Meanwhile, we scan the list of values looking for the distinctive shape to form as previously described.
█ STRATEGY RESULTS
Back Testing
Historical back testing is the most common method to test a strategy due in part to the general ease of gathering quick results. The underlying theory is that any strategy that worked well in the past is likely to work well in the future, and conversely, any strategy that performed poorly in the past is likely to perform poorly in the future. It is easy to poke holes in this theory, however, as for one to accept it as gospel, one would have to assume that future results will match what has come to pass. The randomness of markets may see to it otherwise, so it is important to scrutinize results. Some commonly used methods are to compare to other markets or benchmarks, perform statistical analysis on the results over many iterations and on differing datasets, walk-forward testing, out-of-sample analysis, or a variety of other techniques. There are many ways to interpret the results, so it is important to do research and gain knowledge in the field prior to taking meaningful conclusions from them.
👉 In short, it would be naive to place trust in one good backtest and expect positive results to continue. For this reason, results have been omitted from this publication.
Repainting
Repainting is simply the difference in behaviour of a strategy in real time vs the results calculated on the historical dataset. The strategy, by default, will wait for confirmed signals and is thus designed to not repaint. Waiting for bar close for entires aligns results in the real time data feed to those calculated on historical bars, which contain far less data. By doing this we align the behaviour of the strategy on the 2 data types, which brings significance to the calculated results. To override this behaviour and introduce repainting one can select "Recalculate on every tick" from the properties tab. It is important to note that by doing this alerts may not align with results seen in the strategy tester when the chart is reloaded, and thus to do so is to forgo backtesting and restricts a strategy to forward testing only.
👉 It is possible to use this script as an indicator as opposed to a full strategy by disabling "Use Strategy" in the "Inputs" tab. Basic alerts for detection will be sent when patterns are detected as opposed to complex order syntax. For alerts mid-bar enable "Recalculate on every tick" , and for confirmed signals ensure it is disabled.
█ EXIT ORDERS
Limit and Stop Orders
By default, the strategy will place a stop loss at the invalidation point of the pattern. This point is beyond the pattern high in the case of Double Tops, or beneath the pattern low in the case of Double Bottoms. The target or take profit point is an equal-legs measurement, or 100% of the pattern height in the direction of the pattern bias. Both the stop and the limit level can be adjusted from the user menu as a percentage of the pattern height.
Trailing Stops
Optional from the menu is the implementation of an ATR based trailing stop. The trailing stop is designed to begin when the target projection is reached. From there, the script looks back a user-defined number of bars for the highest or lowest point +/- the ATR value. For tighter stops the user can look back a lesser number of bars, or decrease the ATR multiple. When using either Alertatron or Trading Connector, each change in the trail value will trigger an alert to update the stop order on the exchange to reflect the new trail price. This reduces latency and slippage that can occur when relying on alerts only as real exchange orders fill faster and remain in place in the event of a disruption in communication between your strategy and the exchange, which ensures a higher level of safety.
👉 It is important to note that in the case the trailing stop is enabled, limit orders are excluded from the exit criteria. Rather, the point in time that the limit value is exceeded is the point that the trail begins. As such, this method will exit by stop loss only.
█ ALERTS
Five Built-in 3rd Party Destinations
The following are five options for delivering alerts from Double Tap to live trade execution via third party API solutions or chat bots to share your trades on social media. These destinations can be selected from the input menu and alert syntax will automatically configure in alerts appropriately to manage trades.
Custom JSON
JSON, or JavaScript Object Notation, is a readable format for structuring data. It is used primarily to transmit data between a server and a web application. In regards to this script, this may be a custom intermediary web application designed to catch alerts and interface with an exchange API. The JSON message is a trade map for an application to read equipped with where its been, where its going, targets, stops, quantity; a full diagnostic of the current state and its previous state. A web application could be configured to follow the messages sent in this format and conduct trades in sync with alerts running on the TV server.
Below is an example of a rendered JSON alert:
{
"passphrase": "1234",
"time": "2022-05-01T17:50:05Z",
"ticker": "ETHUSDTPERP",
"plot": {
"stop_price": 2600.15,
"limit_price": 3100.45
},
"strategy": {
"position_size": 0.1,
"order_action": "buy",
"market_position": "long",
"market_position_size": 0,
"prev_market_position": "flat",
"prev_market_position_size": 0
}
}
Trading Connector
Trading Connector is a third party fully autonomous Chrome extension designed to catch alert webhooks from TradingView and interface with MT4/MT5 to execute live trades from your machine. Alerts to Trading Connector are simple; just select the destination from the input drop down menu, set your ticker in the "TC Ticker" box in the "Alert Strings" section and enter your URL in the alert window when configuring your alert.
Alertatron
Alertatron is an automated algo platform for cryptocurrency trading that is designed to automate your trading strategies. Although the platform is currently restricted to crypto, it offers a versatile interface with high flexibility syntax for complex market orders and conditions. To direct alerts to Alertatron, select the platform from the 3rd party drop down, configure your API key in the ”Alertatron Key” box and add your URL in the alert message box when making alerts.
3 Commas
3 Commas is an easy and quick to use click-and-go third party crypto API solution. Alerts are simple without overly complex syntax. Messages are simply pasted into alerts and executed as alerts are triggered. There are 4 boxes at the bottom of the "Inputs" tab where the appropriate messages to be placed. These messages can be copied from 3 Commas after the bots are set up and pasted directly into the settings menu. Remember to select 3 Commas as a destination from the third party drop down and place the appropriate URL in the alert message window.
Discord
Some may wish to share their trades with their friends in a Discord chat via webhook chat bot. Messages are configured to notify of the pattern type with targets and stop values. A bot can be configured through the integration menu in a Discord chat to which you have appropriate access. Select Discord from the 3rd party drop down menu and place your chat bot URL in the alert message window when configuring alerts.
👉 For further information regarding alert setup, refer to the platform specific instructions given by the chosen third party provider.
█ IMPORTANT NOTES
Setting Alerts
For alert messages to be properly delivered on order fills it is necessary to place the following placeholder in the alert message box when creating an alert.
{{strategy.order.alert_message}}
This placeholder will auto-populate the alert message with the appropriate syntax that is designated for the 3rd party selected in the user menu.
Order Sizing and Commissions
The values that are sent in alert messages are populated from live metrics calculated by the strategy. This means that the actual values in the "Properties" tab are used and must be set by the user. The initial capital, order size, commission, etc. are all used in the calculations, so it is important to set these prior to executing live trades. Be sure to set the commission to the values used by the exchange as well.
👉 It is important to understand that the calculations on the account size take place from the beginning of the price history of the strategy. This means that if historical results have inflated or depleted the account size from the beginning of trade history until now, the values sent in alerts will reflect the calculated size based on the inputs in the "Properties" tab. To start fresh, the user must set the date in the "Inputs" tab to the current date as to remove trades from the trade history. Failure to follow this instruction can result in an unexpected order size being sent in the alert.
█ FOR PINECODERS
• With the recent introduction of matrices in Pine, the script utilizes a matrix to track pivot points with the bars they occurred on, while tracking if that pivot has been traded against to prevent duplicate detections after a trade is exited.
• Alert messages are populated with placeholders ; capability that previously was only possible in alertcondition() , but has recently been extended to `strategy.*()` functions for use in the `alert_message` argument. This allows delivery of live trade values to populate in strategy alert messages.
• New arguments have been added to strategy.exit() , which allow differentiated messages to be sent based on whether the exit occurred at the stop or the limit. The new arguments used in this script are `alert_profit` and `alert_loss` to send messages to Discord

Heikin Ashi+RSI+EMA Strategy 2.0 v4 [Cryptocurrency] by GodtrixHi,
I know a lot of people are looking for a more sophisticated and customizable strategy tool, I'm facing the same problem too, so I created one for myself and decided to share it for free trials and if you think this tool do what you wanted, you can contact me for the subscription "Premium" version.
I'll keep it simple with point forms, if you have any further inquiries or questions, please feel free to message me. Thank you.
Best profit plan with this strategy is you trade on Future leverage while you hold on to your coin, so that when price goes up, your coin value goes up, and at the same time, you trade with your leverage to earn even more, easily doubling up your total profit.
Benefits:
Fully customizable and you can easily personalized it and FINE TUNE it according to the market or coin you trading on.
The strategy is based on REAL PRACTICAL trading skills, so it works in real-world.
I fixed the "repainting" issue so the backtest it shows you IS ACCURATE when you run for real-time.
We all know one indicator is not going to help you win your trades, so this strategy combines ALL three: EMA for long+short term trend, HA for short term trend, RSI for entry/exit
This strategy is designed for LONG trade (Buy low, Sell high), not for SHORT trade.
This is not day trading, it is more to mid-term trading, where there's only few trades per month
Mainly is coded to work with 3Commas bot auto trading, so you only need to key in your Bot ID & Email Token.
Bot trading NOTE:
You need to replace the Alert Message with this: {{strategy.order.alert_message}}
One Alert will work for both Buy and Sell Order
If you using other Bot service, you can enter Custom Command too, so it works on any bot service.
Lastly,
regarding the setting advice, I would say you try playing with different settings and your objective is to achieve a backtest result that has:
1) Profitable is > 80%
2) Losing trades is nearly 0 or below 25% of your winning trades. Trick is using far stop loss %
3) Net Profit be almost same or more than "Buy & Hold Profit"
If you interested in our subscription version, message me for price.
Best Luck & a million dollar profit to you,
Godtrix BITSTAMP:BTCUSD BINANCE:DOTUSDT

BNB botThis bot I use in a study version on BnB. this is strategy version. so far seems to do very well from my testing on real live. I use 20% of my crypto lot o 5x levrage on 3 min chart.
the aim of this bot is to make 4 % each time.
There is no repaint
for other alts need to modify setting especialy length
for take profit -here i strategy it use that at each take profit you take out 25% and go forward
this bot similar other bots i put before (look at my scripts to see /compare) as buy is by low scaner ,exit is differnt system
len and factor and pivots MTF control exit
after i finish my study version test on live setup . i will put it to public
so this is part of the strategy of that bot design maily for BnB
money managmet is key for victory so this strategy is only helper for you . plan your move carfully when you put real money to it
