Pattern Recognition Pullback StrategyThis script has been designed for use in botting Crypto spot / futures.
The intended use is send signals to a 3commas bot setup for the exchange. The bot uses candle measuring percentile nearest rank filters and range
breakouts to decide if the market is trending. When the market is trending it will look for pullbacks below a moving average and buy in the trend direction on a pullback discount.
With this script you will not be able to send tradingview signals, that is because it is a payed service and for security reasons I am the only one with access to making signals from this script. I will be uploading a second script which is the profit calculator. This way you can toy around to find your preferred settings for the bot and see the results it could have made.
I provided a user manual:
drive.google.com
"bot" için komut dosyalarını ara

Oasis Trading Group Automated Trading BotThe Oasis Trading Group Automated Trading Bot is designed to follow trend and alert the user to potential Buy and Sell Entry Points. It is also equip with Take Profits, Automatic Support and Resistance, and Alerts for when price is breaking or bouncing off these Support and Resistance Levels. It also has a built in Stop Loss that will conservatively keep the user in the trade as long as possible.
The Bot is mainly focused on following trend strength and volatility, when the criteria is met for an entry it will trigger a Buy/Sell and then give Take Profit points that will act as suggestions for the user to take partial profit while letting the rest of the trade ride.
The Bot works best on Heikin Ashi Candles but they are not required. Because it is a trend bot, the higher time frames will be stronger.
Finally, the Oasis Trading Group Bot is equip with many different alerts for the user to fully automate their trading experience through TradingView Alerts.
For Access or Questions: Private message us. Thank you.

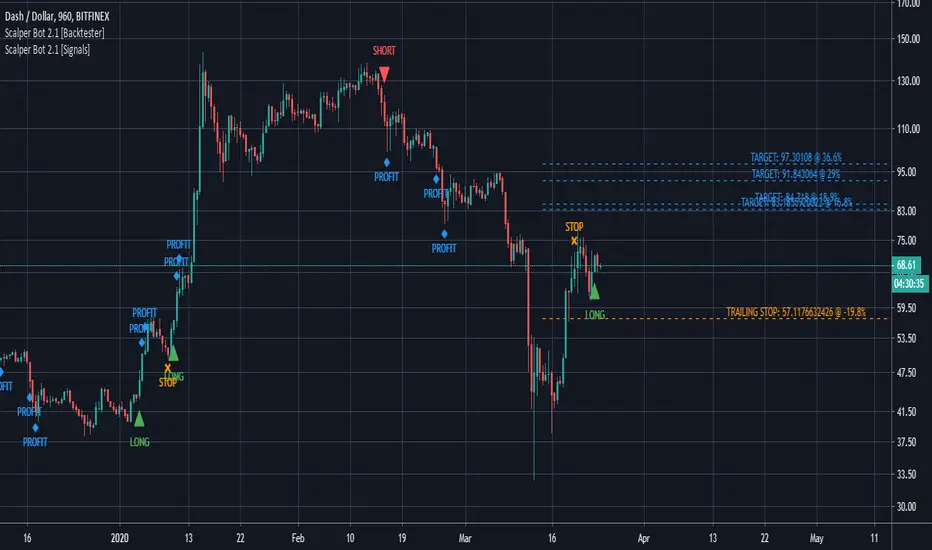
Scalper Bot [Signals]Scalper Bot is a scalping strategy, looking for market turning points between support and resistance pivots
Scalper Bot is developed for Crypto markets. It has not been tested on forex or any other markets, however it is not limited to Crypto markets.
It can also be used on any trading pair, on any exchange and in any time frame.
Scalper Bot comes complete with 3 alerts:
- LONG: LONG indicates that the market could potentially go up
- SHORT: SHORT indicates that the market could potentially go down
- CLOSE: CLOSE is a trailing stop loss and indicates that the market is no longer moving in the anticipated direction and that the current position should be closed. The same CLOSE signal is used for both LONG and SHORT
When setting up alerts, LONG and SHORT alerts should be set up to give an alert on ONCE PER BAR CLOSE, whereas the CLOSE alert should be set to ONCE PER BAR
Scalper Bot is a margin trading script, and caution should be exercised when using margin trading
Commission in the backtester is set to 0% as each exchange and each trading pair has its own commission structure. Be sure to change this value for backtesting purposes to the required commission.
---INVITE-ONLY SCRIPT---
This is an invite-only script, if you would like to try out this bot, send me a message
Multi-TF Harmonic + UT Bot + RSI Scanner [Final Fixed]Overview This indicator is an all-in-one dashboard designed to monitor 4 key timeframes (5m, 15m, 1H, 4H) simultaneously on a single chart. It seeks Confluence by combining the Counter-trend strategy of Harmonic Patterns with the Trend-following strategy of the UT Bot, backed by RSI momentum analysis.
Core Logic
Harmonic Patterns: Detects Gartley, Bat, Butterfly, Crab, Deep Crab, and Cypher patterns. It highlights when the price enters the Potential Reversal Zone (PRZ).
UT Bot: Identifies the current trend direction (Buy/Sell) using ATR Trailing Stop logic with Heikin Ashi smoothing.
RSI: Monitors Overbought (>70) and Oversold (<30) levels.
Signal Conditions
LONG ENTRY: Bullish Pattern + Price in PRZ + UT Bot Buy Trend.
SHORT ENTRY: Bearish Pattern + Price in PRZ + UT Bot Sell Trend.
WATCH: Price is in PRZ, but the trend has not yet aligned with the pattern direction.
How to Use Simply apply this indicator to any chart. The dashboard (default: Bottom Left) will display the status for 5m, 15m, 1H, and 4H timeframes without needing to switch charts.

martingle trading bot⚙️ Martingle Trading Bot — Complete Description
The Martingle Trading Bot is a fully automated volatility-band visualization system that demonstrates the principles of breakout-based market logic combined with martingale-style position scaling. It is designed purely for educational, analytical, and backtesting visualization purposes on TradingView.
This tool shows how a simple mathematical band system can be used to define intraday breakout regions, evaluate sequential trade logic, and visualize how martingale-style compounding affects a trade sequence when price fluctuates around daily reference levels.
🧠 Conceptual Overview
The system works on a simple yet powerful market observation: markets oscillate within short-term ranges and occasionally break out beyond expected volatility envelopes. To capture and visualize these events, the Martingle Trading Bot uses a daily reset mechanism that defines a reference price, builds trading bands around it, and triggers theoretical buy/sell signals when price exceeds certain thresholds.
📅 1️⃣ Daily Reference Price (Central Core)
Every trading day begins with a reference price — typically the daily open. This reference acts as the neutral center for the system’s calculations. The indicator resets this reference daily and adjusts when target zones are hit, maintaining realistic adaptive logic.
📊 2️⃣ Dynamic Bands and Target Zones
From the reference price, the indicator constructs two key structures:
- Primary Band Range – defines the immediate trading zone using the “band range.”
- Target Band Range – extends beyond the primary band to define logical take-profit zones.
Price action beyond these regions indicates directional expansion and potential breakout strength.
📈 3️⃣ Breakout Logic (Trade Signal Simulation)
- When price crosses the upper band → bullish breakout condition.
- When price crosses the lower band → bearish breakout condition.
Each breakout is visualized on the chart and represents a theoretical position change.
🧮 4️⃣ Martingale Position Scaling
When a breakout occurs against the prior position, the system multiplies or increments position size based on user-defined settings. This models martingale-style compounding and resets when a target is reached. It helps illustrate how scaling affects drawdown and recovery potential.
💹 5️⃣ Virtual PnL Tracking
The indicator keeps virtual stats of profit/loss, win rate, and trade count. These metrics are illustrative only — no live or guaranteed results are implied.
🧭 6️⃣ Visual Chart Elements
Buy/Sell labels, take-profit labels, quantities, and color-coded zones appear on the chart to clearly display trade logic and band structure.
⚙️ 7️⃣ User Inputs
- Band Range
- Target Distance
- Initial Quantity
- Martingle Quantity
- Gap Detection Point
- Label Display Toggles
- Optional end-of-day reset
🧩 8️⃣ Use Cases
Ideal for traders, developers, and educators who want to study breakout systems, risk progression, and position scaling.
⚠️ 9️⃣ Risk Disclosure
This is not a live trading bot. It does not execute trades or guarantee profit. Martingale logic carries significant risk — consecutive losses can exponentially increase exposure. Use for study purposes only.
📜 License and Credits
Developed by @algo_coders.
Licensed under the Mozilla Public License 2.0 (MPL 2.0).
Uses internal bar-counting functions for session management.
🧠 Summary
The Martingle Trading Bot combines volatility envelopes, daily resets, and martingale scaling to visualize compounding risk behavior. It is an educational research tool for understanding probability-based trading concepts — not financial advice or a trading signal provider.

OKX Signal BOT - Strategy Scanner & Orderer
Hello traders,
With the OKX Signal BOT - Strategy Scanner & Orderer, you can now design your own strategy, scan over 20 cryptocurrencies, and send orders for futures trades on the OKX exchange.
How to Use:
🌐 First, log into your account on the OKX exchange and create a signal bot.
📝 While creating the signal bot, note down the webhook URL and signal token variables given to you; they'll be needed later.
🔍 Select the trading pairs that the bot will work on.
📈 Add this indicator to your chart.
⚙️ Adjust the values of the indicators you will use in your strategy.
📊 Set your entry conditions and indicator setups according to your preference.
🚀 Decide which condition will generate a LONG signal and which will generate a SHORT signal.
🔗 Then, link these conditions with either an AND or OR connector.
🛠️ This also serves as a strategy designer.
🆔 Paste the signal token value you got from OKX into the OKX Signal ID section in the indicator.
➕ Add the cryptocurrency pairs you added to the bot on OKX to this design tool as well.
💾 Save and exit.
🚨 Set an alarm and paste the webhook URL link you got from OKX.
Congratulations, you can now send signals from Tradingview to the OKX exchange without needing any other platform.
Warnings:
⚠️ Works only for futures trades.
📈 Make your leverage settings through the exchange.
🛑 It is recommended to set take profit and stop loss through the exchange.
🚫 If too many alarms are triggered, Tradingview may stop your alarms.
💡 Ensure that the coins you add in the symbol section are from the OKX exchange.
🔍 For futures trades, make sure the symbols end with ".P".
🎉 Enjoy using it!

Pattern Recognition Pullback Strategy profit calculatorThis script has been designed for use in botting Crypto spot / futures.
The intended use is send signals to a 3commas bot setup for the exchange. The bot uses candle measuring percentile nearest rank filters and range
breakouts to decide if the market is trending. When the market is trending it will look for pullbacks below a moving average and buy in the trend direction on a pullback discount. This is the profit calculator part of the script
With this script you will not be able to send tradingview signals, that is because it is a payed premium service and for security reasons I am the only one with access to making signals from this script.
I provided a user manual:
drive.google.com

Grid Bot AutoThis script is an auto-adjusting grid bot simulator. This is an improved version of the original Grid Bot Simulator. The grid bot is best used for ranging/choppy markets. Prices are divided into grids, or trade zones, that will trigger signals each time a new zone is entered. During ranging markets, each transaction is followed by a “take profit.” As the market starts to trend, transactions are stacked (compare to DCA ), until the market consolidates. No signals are triggered above the Upper Limit or Below the Lower Limit. Unlike the previous version, the upper and lower limits are calculated automatically. Grid levels are determined by four factors: Smoothing, Laziness, Elasticity, and Grid Intervals.
Smoothing:
A moving average (or linear regression) is applied to each close price as a basis. Options for smoothing are Linear Regression, Simple Moving Average, Exponential Moving Average, Volume-Weighted Moving Average, Triple-Exponential Moving Average.
Laziness:
Laziness is the percentage change required to reach the next level. If laziness is 1.5, the price must move up or down by 1.5% before the grid will change. This concept is based on Alex Grover’s Efficient Trend Step. This allows the grids to be based on even price levels, as opposed to jagged moving averages.
Elasticity:
Elasticity is the degree of “stickiness” to the current price trend. If the smoothing line remains above (or below) the current grid center without reverting but still not enough to reach the next grid level, the grid line will start to curve toward the next grid level. Elasticity is added to (or subtracted from) the gridline by a factor of minimum system ticks for the current pair. Elasticity of zero will keep the gridlines horizontal. If elasticity is too high, the grid will distort.
Grid Intervals:
Grid intervals are the percentage of space between each grid.
Laziness = 4%, Elasticity = 0. Price must move at least 4% before reaching the next level. With zero elasticity, gridlines are straight.
Laziness = 5%, Elasticity = 100. For each bar at a new grid level, the grid will start “curve” toward the next price level (up if price is greater than the middle grid, down if less than middle grid). Elasticity is calculated by the user-inputted “Elasticity” multiplied by the minimum tick for the current pair (ELSTX = syminfo.mintick * iELSTX)
Try experimenting with different combinations of the Smoothing Length, Smoothing Type, Laziness, Elasticity, and Grid Intervals to find the optimum settings for each chart. Lower-priced pairs (e.g. XRP/ADA/DODGE) will require lower Elasticity. Also note that different exchanges may have different minimum tick values. For example, minimum tick for BITMEX:XBTUSD and BYBIT:BTCUSD is .5, but BINANCE:BTCUSDT and COINBASE:BTCUSD is .01.
s3.tradingview.com
DODGEUSDT, 5min. Laziness: 4%, Elasticity 2.5
Number of Grids: 2. Laziness: 3.75%. Elasticity: 150. Grid Interval 2%.
Settings Overview
Smoothing Length : Smoothing period
Smoothing Type : Linear Regression, Simple Moving Average, Exponential Moving Average, Volume-Weighted Moving Average, Triple-Exponential Moving Average
Laziness : Percentage required for price to move until it reaches the next level. If price does not reach the next level (up or down), the grid will remain the same as previous grid (because it’s lazy).
Elasticity : Amount of curvature toward the next grid, based on the current price trend. As elasticity increases, gridlines will curve up or down by a factor of the number of ticks since the last grid change.
Grid Interval : Percent between grid levels.
Number of Grids : Number of grids to show.
Cooldown : Number of bars to wait to prevent consecutive signals.
Grid Line Transparency : Lower transparencies brighten the gridlines; higher transparencies dim the gridlines. To hide the gridlines completely, enter 100.
Fill Transparency: Lower transparencies brighten the fill box; higher transparencies dim the fill box. To hide the fill box completely, enter 100.
Signal Size : Make signal triangles large or small.
Reset Buy/Sell Index When Grids Change : When a new grid is formed, resetting the index may prevent false signals (experimental)
Use Highs/Lows for Signals : If enabled, signals are triggered as soon as the price touches the next zone. If disabled, signals are triggered after bar closes. Enable this for “Once Per Bar alerts. Disable for “Once Per Bar Close” alerts.
Show Min Tick : If checked, syminfo.mintick is displayed in upper-righthand corner. Useful for estimating Laziness.
Reverse Fill Colors : Default fill for fill boxes is green after buy and red after sell. Check this box to reverse.
Note: The Grid Bot Simulator scripts are experimental and works in progress. Please feel free to comment or contact me if you have suggestions/complaints.

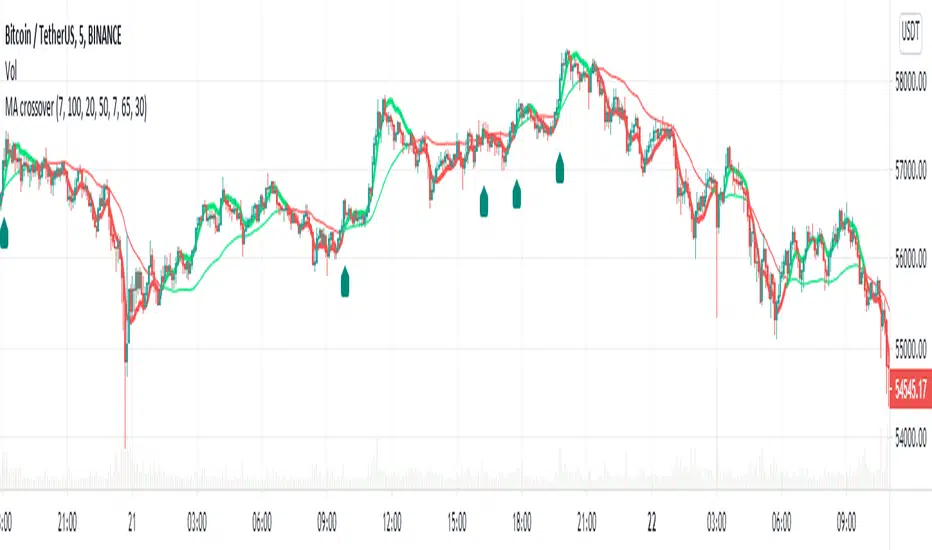
MA Crossover Alerts for Small Quick Profits on 3commas/DCA botDear fellow 3commas users,
This is a the most basic Moving Average crossover technique generating Buy Alerts.
This is especially written for those of you who want to link this basic crossover strategy with your 3commas DCA bot .
Buy Alerts
Moving averages available:
- Simple Moving Average (SMA)
- Exponential Moving Average (EMA)
- Weighted Moving Average (WMA)
- Hull Moving Average (HullMA)
- Volume Weighted Moving Average (VMWA)
- Running Moving Average (RMA)
- Triple Exponential Moving Average (TEMA)
Recommended settings for using with 3commas DCA bot:
Interval:
3m to 15m
3commas bot setup:
- TP/TTP: 0.3%/0.1%,
- Base Order: Your choice ,
- Safety Order: 1.2 * Base order
- Safety Order Volume Scale: 1.2,
- Safety Order Step Scale: 1.5,
- Max Active Deals: Your choice ,
- Price Deviation to Open Safety Order (% from initial order): 0.2%,
- Max Safety Trades Count: 7,
- Simulatenous Deals per Same Pair: 3
> Create Alert with Buy Alert and link it to your bot "Message for deal start signal"
Detect Sequential Trading - Bot DetectorDetect Sequential Trading - Bot Detector.
This tool requires access to volume data .
There are many trading bots out there, that trade 24/7 .
The detector can be used to understand how the bots are configured - to push the market up or down .
Alerts can be set to fire whenever a bot pattern is detected .
They must be configured to run Once per Bar .
It works well with range charts (1R) .
It would work best on 1 second charts or tick charts (currently, TradingView's alert system doesn't work with second charts).
The alternative would be 1 minute charts .
It can be used on higher timeframes but may be less effective.

UT Bot Pro Max (Maks Edition)Script v2.0
UT Bot Pro Max is an advanced, high-precision evolution of the well-known UT Bot indicator.
This version is fully rebuilt into a complete decision-making system that evaluates trend structure, volatility conditions, momentum signals, and entry quality.
It is designed for traders who want clear, structured signals supported by objective filters and transparent reasoning.
1. Core Engine: ATR-Based Trailing Logic
At the heart of the system is an ATR dynamic trailing stop.
It is responsible for:
detecting trend reversals
identifying breakout conditions
switching between long and short bias
determining signal strength
Unlike simple ATR lines, this engine adapts to momentum expansion and contraction, forming the backbone for every signal.
2. Three-Tier Signal Structure
Each signal is classified into one of three levels based on the number of confirmations:
Strong Signals
ATR breakout
trend filter (price relative to EMA200)
RSI filter (oversold/overbought context)
This is the highest-quality confirmation and is suitable for full-size entries.
Medium Signals
ATR breakout
trend filter
(no RSI filter)
This represents a valid trend continuation but with slightly reduced confirmation.
Weak Signals
ATR breakout only
(no trend filter, no RSI filter)
This is an early-stage impulse which can evolve into a stronger move.
The multi-level classification allows the trader to size positions rationally and avoid over-committing during uncertain market conditions.
3. Move-Since-Entry Tracking
When a new long or short position is detected, the indicator records the entry price and automatically tracks the percentage movement from that point.
This offers:
real-time monitoring of open trade performance
objective context for managing exits
clear visualization of progress since entry
4. Smart State-Change Alerts
Instead of simple “BUY” or “SELL” messages, the script sends highly structured alerts whenever the internal state changes.
Each alert includes:
the symbol and timeframe
signal direction and strength
recommended position size based on signal tier
ATR values
RSI value and its state
trend context (bullish, bearish, neutral)
distance from ATR trailing stop
movement since entry
previous state reference (optional)
This makes it ideal for automated systems, algorithmic routing, or Telegram-based signal delivery.
5. Professional On-Chart Status Table
The indicator displays a refined information panel containing:
current signal state (Strong / Medium / Weak / Hold)
ATR signal direction
trend filter result
RSI value and condition
distance to trailing stop (percentage)
current position (long / short / flat)
entry recommendation based on signal strength
ATR value and additional context in expanded mode
There is also a compact mode optimized specifically for mobile trading.
6. Optional Heikin Ashi Mode
The indicator can operate using Heikin Ashi close values for traders who prefer smooth, noise-reduced visualizations.
The internal logic is recalculated automatically.
7. Trend-Colored Candles
An optional feature allows candle coloring based on price position relative to the ATR stop line, highlighting bullish and bearish phases directly on the chart.
What This Indicator Provides
Accurate, context-aware entry signals
Scalable position sizing through multi-tier structure
Objective trend confirmation
Breakout detection with volatility adaptation
Continuous tracking of open position performance
Detailed real-time explanations through alerts
A complete visual dashboard consolidating all key metrics
UT Bot Pro Max (Maks Edition) is built as a practical tool for daily trading.
It is suitable for scalping, day trading, swing trading, automated alerts, and mobile workflows.

RSI SFP + flexi TP/SL + WT JSON bot RSI SFP + Smart TP/SL + Auto-Trading JSON for WunderTrading
Precision reversal detection for fully automated long/short execution
RSI SFP is a next-generation reversal detection engine combining market structure (Swing Failure Pattern) with RSI divergence confirmation.
It is designed for professional users who require fast, non-repainting, and broker-integrated signals that can be used for automation.
This Invite-Only script offers:
🔷 Core Features
✔ Real-time SFP detection (no candle close required)
The algorithm triggers as soon as price touches previous swing high/low and RSI forms a confirmed divergence.
Ideal for users who want the earliest, most reactive entries.
✔ RSI Divergence Engine
Bullish RSI divergence at prior lows
Bearish RSI divergence at prior highs
Adjustable divergence threshold (RSI difference)
Ultra-low latency decision logic
✔ Smart TP/SL Automation
TP = ±1% fixed profit from entry (configurable)
SL based on swing structure or user-defined %
TP/SL displayed visually on the chart
No repainting once triggered
✔ Full Backtesting Module
Tracks wins/losses across last N trades
Displays monthly statistics (last 4 months)
Tracks estimated P&L using user leverage model
Built-in visual tags for every TP / SL hit
✔ Integrated Auto-Trading for WunderTrading
When enabled, the indicator automatically sends structured JSON signals through TradingView alerts.
Supported actions:
Enter Long
Enter Short
Exit All
Each entry includes:
Market order
Position size based on capital & leverage
Exchange-level TP & SL placement
Your bot on WunderTrading can mirror the exact chart signals in real time.
🔷 Use Cases
Full automation using TradingView → Webhook → WunderTrading
Intraday reversal trading
Swing trading
Multi-exchange automated bot execution
Reversal scalping with tight stops
🔷 Important Notes
This indicator does not repaint after signal confirmation.
Real-time signals may flash while the candle is forming (normal for non-close divergence detection).
Only Invite-Only users can access the script.
No source code is shared.
If you want access, please message me directly on TradingView.
A full setup guide, alerts template, and WT bot configuration are included for subscribers.
🇨🇳 中文版(专业销售版)
RSI SFP + 智能 TP/SL + WunderTrading 自动交易 JSON 引擎
专为自动化反转交易打造的实时 SFP + RSI 背离策略
RSI SFP 指标将 Swing Failure Pattern(SFP 假突破结构)与 RSI 背离进行整合,
用于捕捉极早期的反转机会。
本脚本专为需要 实时、无重绘、可自动化执行 的专业交易者设计。
这是一个 Invite-Only(仅邀请)脚本,专供订阅用户授权使用。
🔷 核心功能
✔ 实时信号(不需要 K 线收盘)
只要价格触及前高/前低 + RSI 背离确认,
立即给出 Long / Short 反转信号,属于极短延迟结构逻辑。
✔ 高级 RSI 背离系统
价格 vs RSI 顶背离
价格 vs RSI 底背离
最小 RSI 差值可调
精准且稳定,不重绘
✔ 智能 TP / SL 自动管理
固定 TP = ±1%(可调)
SL 支持 swing 结构或固定百分比
图表上自动绘制 TP/SL 虚线
信号一旦触发后不重绘
✔ 强大回测统计系统
可追踪最近 N 笔交易
最近 4 个月的月度统计
盈亏汇总表(含杠杆模型)
每次 TP/SL 都自动标注在图表上
✔ 内置 WunderTrading 自动化 JSON
启用后,指标会自动通过 TradingView Alerts → Webhook
向 WT 机器人发送标准化 JSON:
开多(Enter Long)
开空(Enter Short)
全部平仓(Exit All)
并自动包含:
市价下单
杠杆
手数
TP/SL 自动挂单
完全同步图表上的信号。
🔷 适用人群
想要全自动交易(TV → WT → 交易所)
反转交易 / SFP 策略
日内 / 轻量级高频反转
Swing 反转捕捉
需要稳定 TP/SL 的量化用户
🔷 注意事项
信号不会在收盘后重绘,但在 K 线形成中可能闪烁(实时逻辑正常现象)
脚本为 Invite-Only 私密指标,源码不会公开
订阅用户可随时获得使用授权
提供详细 WT 机器人设置教程
如需访问权限,请通过 TradingView 私信联系我。
订阅用户将获得完整的使用指南与设置模板。

DCA Bot v7 - Cryptosa Nostra 1.0Technical Overview: Adaptive RSI DCA Bot
This is a sophisticated DCA (Dollar Cost Averaging) indicator designed for accumulating assets and managing portfolio distribution. It does not trade on simple RSI crosses. Instead, it combines multi-zone RSI analysis with ATR-based volatility triggers to execute staggered, dynamically-sized trades.
Its core feature is a "learning" engine that adapts its own settings over time. This "brain" can be trained on historical data and then applied to your real-time portfolio holdings via a "Live Override" feature.
Core Logic: How It Works
A trade is only executed when two conditions are met simultaneously:
The RSI Condition: The RSI must be inside one of the four pre-defined zones.
The Price Condition: The price must cross a "trigger line" (the green or red line) that is dynamically calculated based on volatility.
1. The Four RSI Zones
This script uses four distinct zones to determine the intent to trade:
Deep Buy Zone (Default: RSI <= 35 & Downtrend): This is the primary "value" buy signal. It only activates if the RSI is deeply oversold and the price is below the 200-period Trend MA.
Reload Buy Zone (Default: RSI 40-50 & Uptrend): This is a "buy the dip" signal. It looks for minor pullbacks during an established uptrend (price above the 200-period Trend MA).
Profit-Taking Zone (Default: RSI 70-80): Triggers a standard, small sell when the market is overbought.
Euphoria Zone (Default: RSI >= 80): Triggers a larger, more aggressive sell during extreme "blow-off" tops.
2. Dynamic Trade Sizing
The amount to buy or sell is not fixed. It scales dynamically based on how high or low the RSI is:
Buy Sizing: Spends a higher percentage of available cash when RSI is at its lowest (e.g., 35) and a smaller percentage when it's at the top of the reload zone (e.g., 50).
Sell Sizing: Sells a smaller percentage of holdings when RSI just enters the overbought zone (e.g., 70) and a much larger percentage when it's in the euphoria zone (e.g., 80+).
3. The "Adaptive Brain" (ATR Multipliers)
This is the script's learning mechanism. The green/red trigger lines are calculated as: Last Trade Price +/- (ATR * Multiplier).
This "Multiplier" is the brain. It adapts based on trade performance.
After a successful trade (as defined by profit_target_multiplier), the bot gets more confident and reduces the multiplier. This places the next trigger line closer to the price, making it more aggressive.
After a losing trade (as defined by loss_limit_multiplier), the bot gets more cautious and increases the multiplier. This places the next trigger line further away, making it more patient.
How to Use This Indicator
This script is designed to be "trained" on historical data to provide relevant signals for today.
To Train the Brain: In the settings, go to "1. Backtest Settings". Set the "Start Date (For Learning)" to a date in the past (e.g., 6 months or 1 year ago). The script will run a simulation from that date, allowing its Adaptive Multipliers (the "brain") to adjust to the market's volatility.
To See Live Signals: In "2. Live Portfolio Override", check the box "Override Backtest Balance?" and enter your real current coin and USD holdings.
Result: The "Live Status" table (top-right) will now display signals from the trained brain but will calculate the "Potential Buy %" and "Potential Sell %" based on your real portfolio. The "Buy Multi" and "Sell Multi" fields show you the brain's current learned values.

BTCUSDTPERP MEGABOT 60min [ALERTS VERSION]BINANCE:BTCUSDTPERP
Hello, this is my alerts version of BTCUSDTPERP MEGABOT 60min
THIS BOT IS ONLY FOR BTCUSDTPERP ON BINANCEFUTURES !!!!!!!!!!!!!!!!!!!!!!!!!!!!!!!!!!!!!!!!!
This configs are only for this pair on this market,
It depends of volume , and others indicator
Bot is making amazing results at configs
TP - 4.5%
SL - 7%
Strategy using 4 indicators :
ADX
RSI
VOLUME
MACD
ADX - makes a solid view to trend without any scam wick :
Long only on green bars
Shorts only on red bars
That's helps my strategy to define a right trend
there is also a orange option for unidentified trends
RSI - value helps strategy to stop trade in right time
When RSI is overbought strategy don't open new longs
also when RSI is oversold strategy don't open new shorts
Volume - volume is the most important indicator for the strategy,
to avoid open trades on flat chart, new trades are open after a strong volume
wicks
MACD - this indicator is for define the trend
So the way this bot is working is simple
when every arguments are confirmed , then strategy open trades
Enjoy !!!

Simple and Sinister Scalp BotThis is a dollar cost averaging bot with additional buy algo to ensure you are buying support levels on the time period of your chart.
Signals Generated Based On
RSI
Volume
Cost Basis
Simple Moving Averages
It buys when there is a signal to buy and requires that the price is below your cost basis.
The bot is smart enough to track number of open signals and cost basis.
It features a safety shut off feature based on simple moving averages. This prevents you from opening new trades during market declines. The options are
No Filter
Safe
Safer
Safest
This does not generate a signal to sell based on an algorithm. This generates a sell signal based on your cost basis and open entries. It will not generate a sell signal unless it hit your target profit. The script will continue to DCA down until you are out of the hole. You can configure the Take Profit from the options menu.
The script generates labels in realtime and calculates current position profit and what your profit would have been if you used the bot from the start of the year with the settings set as they are in the options menu.
Authors Notes:
This was designed to work for both stocks and crypto.
Best time period to use it on varies depending on the ticker. Because it displays how much profit would be made in realtime, please adjust the settings/chart period and see what settings work best for that stock/crpto symbol. Please note that past performance does not dictate future results.

UT Bot AlertsUT Bot indicator was initially developer by @Yo_adriiiiaan
The idea of original code belongs @HPotter
These are v4 alerts for my previously published strategy:
Original script:

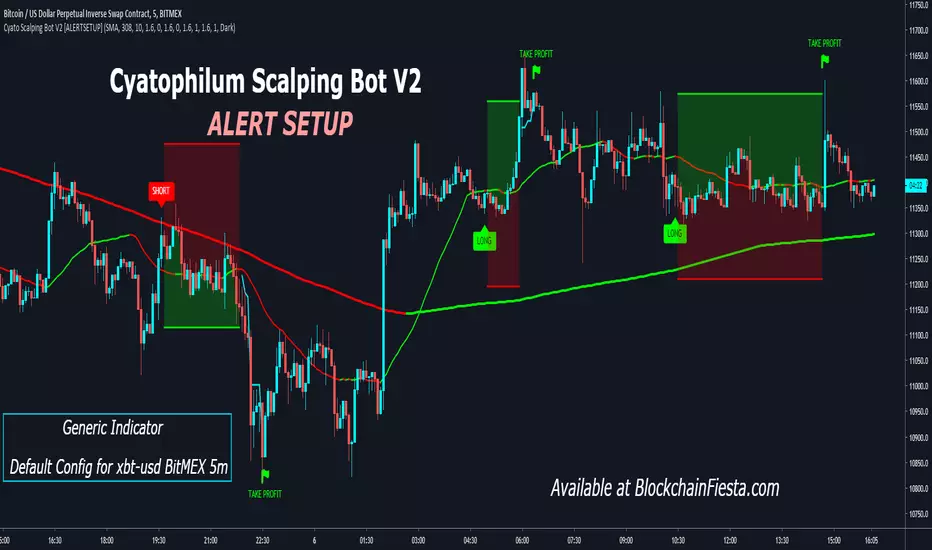
Cyatophilum Scalping Bot V2 [ALERTSETUP]Alert Setup version of Cyatophilum Scalping Bot V2.
Improved version of Cyatophilum Scalping Bot
Default settings for BITMEX:XBTUSD 5m
2% stop loss
2% trailing take profit
Release Notes: Added SMA, EMA and TEMA to the Trend Detector options.
ck - Inner Bars Indicator with Alerts and Trailing Stop v1*** Please check out the matching Strategy to accompany this Indicator to allow you to fully backtest! ***
Inner Bar trading strategy is where the "inside" bar (or candle to the right) within a pair is smaller and within the high to low range of the prior bar, as this pattern tends to be somewhat predictable; especially in "chop" or sideways trading, it is useful to have in your tool box.
Features include:
Complimentary strategy you can add as well as the indicator to backtest and tune your settings before live trading
Trailing Stoploss to wring every cent from a trade
Clear Alert labels have been coded in for use with trading bots, 3commas is recommended.
Enable/Disable Shorts in addition to Longs
Visual chart shapes - Pink Triangle = Long, Purple Triangle = Short, Thin Green Arrow = Profit, Thin Red Arrow = Loss
Realtime Deal Status - Plotlines include Yellow = Entry Price, Green = Trailing Stop Profit, Red - Hard Stoploss
A further feature is that you can disable Shorts (therefore only Longing) for use with exchanges
that only allow you to Long, such as Binance & Coinbase.
Additionally, this Indicator will close a trade before opening the next, so a single exchange
account (BitMEX for example) is all that is required versus having separate accounts to long or
short on the same chart.
This strategy is intended to use $100 of capital, traded at 2.5% per order with 10x lev on Bitmex.
If you like my work, please use my referral links (you will receive discounts!)
3commas trading bots (now with Bitmex support and a lot more!) - 3commas.io
BitMEX - www.bitmex.com
If you have any comments or suggestions, please message me via TradingView.
Based on the core "Inner Bars" concept found at:
backtest-rookies.com
with original inspiration/idea from babypips.com

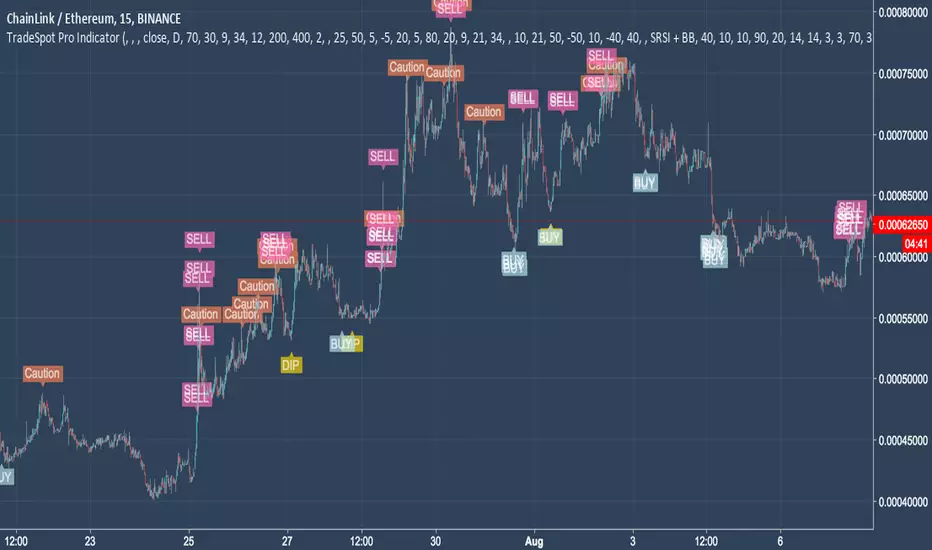
TradeSpot Pro || All Purpose Advanced Trading Indicator & AlertsTradeSpot Pro Indicator
Version: 1.0
TradeSpot Community Website
TradeSpot is a community of traders that specialise in using automated bots to execute spot & margin trading, you can join up via the above link where you too can discuss cryptocurrency, general trading, investments and get informed on the latest botting tools to enhance your day to day trading.
For an in-depth explanation and briefing on what this indicator is capable of, please contact me directly.
Features
Inclusion of all 4 highly regarded indicators previously used by the indicator and combined into one cross-functional powerhouse script sporting different strategies eg. EMA, RMI, RSI, BB based signals (and more!
Neat presentable UI for easily displaying the quality of your current settings.
Incredible customisation, one of the most heavily parameterised scripts on TradingView - this is not a plug and play solution but rather a script you can learn and tweak to really fine tune your strategy, ultimately improving results.
Big list of features listed on the community Discord server that will be developed and added to the indictor in good time (and a backtesting script!).
Combine indicators, a heavily asked for feature finally here - being able to match the signals between included indicators to create an even more robust trading signal.
Scripted with a full array of custom and alerts and more coming for use in manual trading endeavours to never miss a trade or for use with automated bot solutions that can be seen on the community site.
Access
Discord Server
For trial access please follow the link the server above and use the '!trial' command on the chat channel. If you don't use Discord please private message me on here.
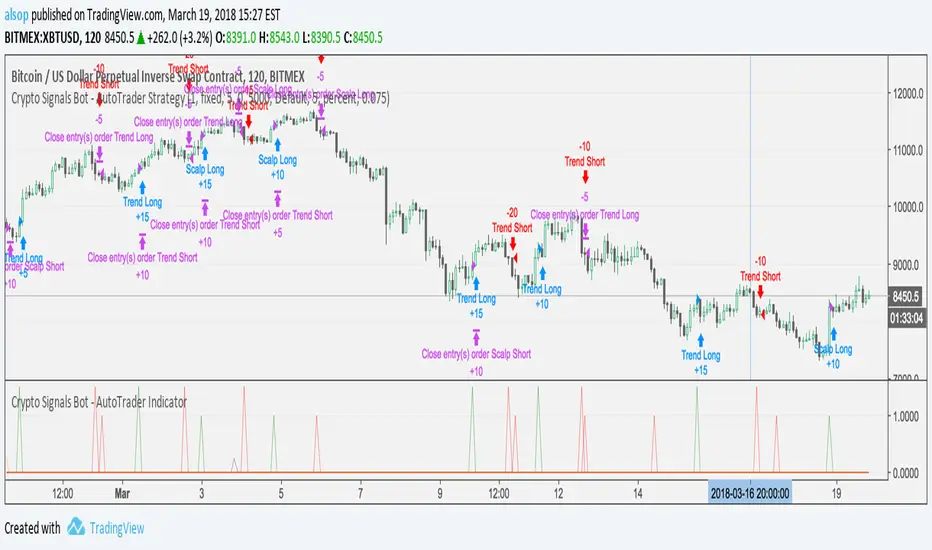
Crypto Signals Bot - AutoTrader IndicatorVery excited to release our new fully automated trading bot specifically for Bitcoin.
We use this system with AutoView to trade on Bitmex and it is specifically designed for Bitcoin on the 2 Hour charts.
It includes everything you will need:
AutoTrader Strategy
AutoTrader Indicator
All Alerts Syntax for AutoView
This has been producing amazing results and is a fully automated trading system that will take buys (long) and sells (short) on Bitcoin with supported crypto exchanges.
To signup, go to this URL: www.cryptosignalsbot.com
CODY BOT – Breakout SignalsCODY BOT is a minimalist, high-probability breakout indicator designed to keep your chart clean while highlighting actionable trading opportunities.
Unlike traditional indicators that generate too many signals, CODY BOT only alerts you to strong directional moves following consolidation, helping you focus on high-quality entries.
Key Features:
Detects breakouts above recent highs and below recent lows.
Filters weak moves using minimum candle body size.
Includes a cooldown period to prevent signal spam.
Clean and intuitive visual signals with large arrows for easy interpretation.
Optional customization for consolidation lookback bars, minimum candle size, and arrow visibility.
Alerts built-in for server-side and mobile notifications.
How to Use:
Look for BUY arrows when price breaks above consolidation highs.
Look for SELL arrows when price breaks below consolidation lows.
Combine with your preferred risk management and trend confirmation strategies.

VWAP SESSION BUY SELL STRATEGY (INDICATOR) (PDK1977)VWAP SESSION BUY SELL STRATEGY (INDICATOR) (PDK1977)
This indicator combines the proven UT Bot breakout engine but with VWAP directional filtering and ATR-based take profit levels.
It delivers clean, high-probability trend entries and automatic volatility-calibrated exits.
How it works:
Buy only when price is above VWAP
Sell only when price is below VWAP
UT Bot confirms momentum with ATR-based trailing logic
ATR Take Profit gives consistent exits based on volatility
Bars turn green/red only while in a trade, back to normal after TP
Best For:
Intraday and swing trading
Indices, FX, crypto, and high-volume stocks but also for Forex with right TF and settings
Traders who want clean signals and minimal noise
2. Trade Checklist:
Use this before every entry. Quick, simple, reliable.
BUY Checklist:
Price confirmed above VWAP
Label prints BUY
Enter on Buy label (on bar close)
→ Hold until ATR TP hits
SELL Checklist:
Price below VWAP
Label prints SELL
Enter on Sell label
→ Hold until ATR TP hits
Avoid Entries When:
Price is chopping tightly around VWAP
Major news events are about to release
Volume is extremely low
ATR is shrinking rapidly (market compression)
3. Risk-Management Guide
This is tailored to how your system actually behaves.
1. Use ATR TP as Primary Exit:
The system automatically calculates a TP based on volatility:
High volatility → larger TP
Low volatility → smaller TP
This keeps trades consistent and avoids lingering too long.
2. Stop-Loss Recommendation
This strategy is designed for TP-only exits, but if you want a SL:
Recommended Stop-Loss:
Use ATR’s opposite trail, OR
Use 1 × ATR behind your entry candle
This matches the system's internal logic.
3. Position Sizing
Since this system enters during momentum expansions, use:
1–2% max risk per trade
Reduce risk during high-impact news sessions
4. Understand VWAP Environment
Different VWAP conditions require different expectations:
Strong Trend (price far from VWAP)
Higher TP probability
Fewer whipsaws
Excellent continuation setups
Chop Zone (price flips above/below VWAP)
Do NOT trade
Signals lose edge
Wait for a clean break + UT confirmation
5. Choose Correct VWAP Reset for your trading and session
This dramatically improves results.
Market Recommended VWAP Reset
US Stocks New York Session
Indices Daily
Forex London or New York
Crypto Daily or None
4. Final Tips for Best Performance
✔ Enter only in the direction of VWAP
✔ Don’t chase signals far away from entry candle
✔ Avoid trading right into major support/resistance
✔ ATR TP will handle exits mostly
Disclaimer
This script is provided for educational and informational purposes only.
It does not constitute financial advice, investment advice, trading advice, or any form of recommendation to buy or sell any financial instrument. The auto take no responsibility for loss or error in the script.

Reddington Trading Bot Adaptive Signals# Reddington Trading Bot Adaptive Signals — mashup disclosure & user guide
## What it is
**Reddington Trading Bot Adaptive Signals** is a **manual trading** overlay that aggregates multiple entry logics (Supertrend, Bollinger, MACD, Counter-Trend, Scalp) behind a single, adaptive filter stack (EMA trend, ADX strength, ATR regime, volume, RSI band, sessions, candle confirmation).
When a setup passes all gates, the script **marks the bar** with a label (e.g., `ST Long ####`) and plots **Entry / SL / TP / Half-TP** reference lines for discretionary execution.
> This is an **indicator**, not an autostrategy. It does not place orders or manage positions.
---
## Mashup disclosure — what’s combined and why
This script is a **mashup** designed to reduce false positives by requiring **confluence** across trend, momentum, volatility, and liquidity:
* **Trend filter (EMAs)** — `ema_short > ema_long` for longs and vice versa for shorts.
*Why:* prevents fighting the dominant direction.
* **Supertrend direction** — uses `ta.supertrend()` to pick continuation states.
*Why:* captures impulse while controlling whipsaw.
* **Bollinger context** — upper/lower band interaction for breakout/overshoot logic.
*Why:* detects expansion and extreme deviations.
* **MACD cross (12/26/9)** — confirms momentum turns with `ta.macd`.
*Why:* times transitions into continuation.
* **RSI band** — between configurable overbought/oversold levels.
*Why:* avoids chasing exhaustion.
* **ADX strength (manual DI+/DI− → DX → RMA)** — trend quality gate.
*Why:* filters out chop when trend quality is weak.
* **ATR regime window** — ATR between low/high multiples of its baseline.
*Why:* trades when volatility is “tradable”, not too thin or too wild.
* **Volume filter** — volume ≥ SMA(volume, N).
*Why:* favors liquid conditions and cleaner ticks.
* **Session gate (Asia/EU/US)** — run only in chosen UTC windows.
*Why:* aligns with hours of depth, fewer fake breaks.
* **Candle confirmation** — simple **bar-over-bar**/**bar-under-bar** check.
*Why:* a last safety check to avoid immediate reversals.
The **strength** of the mashup is that each module covers a blind spot of the others, so a signal only prints when *trend + momentum + volatility + liquidity* line up.
---
## Non-repaint & timing notes
* The script **does not** use `request.security()`; all logic is computed on the active chart TF with standard Pine series semantics.
* Conditions can evolve **intra-bar**. For conservative usage, **confirm on bar close** before executing.
* Plotted levels (Entry/SL/TP/Half-TP) are reference guides; fills depend on your execution and venue slippage.
---
## Inputs (concise)
* **Supertrend multiplier**; **ADX threshold**; ATR low/high multiples; **RSI overbought/oversold**.
* **Sessions**: enable/disable Asia, Europe, America (UTC).
* Internal periods are **auto-scaled** from a 300-sec base via `timeframe.in_seconds()`, adapting the signal windows to your chart TF.
---
## Entry families (built-in)
* **ST (Supertrend continuation)**
Long: ST up + EMA short>long + below BB upper + ADX>th + volume/ATR/RSI ok + candle confirm + session.
Short: symmetric.
* **BB (Bollinger context)**
Long: close > BB upper + quality gates; Short: close < BB lower + quality gates.
* **MACD (momentum cross)**
Cross up/down with quality gates and candle confirm.
* **CT (Counter-trend poke)**
Long: close < BB lower with distance to middle > 1% and RSI<50; Short: mirror.
*Use sparingly; relies on strong quality gates to avoid catching knives.*
* **SC (Scalp EMA5/EMA10 cross)**
With mid-RSI, ADX>20, and all quality gates.
**Position state** is tracked internally (series vars) so that once in a trade, the script monitors **SL**, **Half-TP**, and **TP** hits and prints corresponding labels.
---
## On-chart visuals
* **Entry/SL/TP/Half-TP** lines (cross style), visible **only while a position is tracked**.
* **Bar labels** on entry (` Long/Short ####`), on SL/TP/Half events.
* A small **session/ticker/TF tag** on the last bar.
---
## How to trade it (suggested checklist)
1. **Wait for the label** (e.g., `ST Long …`) and check that all quality filters are green (they are enforced inside the code).
2. Execute **at your discretion** (market/limit); the script’s **Entry** level is the reference (close or your own limit).
3. Place **SL/TP** according to the printed levels; optionally scale at **Half-TP**.
4. Prefer **bar-close confirmation** on faster TFs to reduce intra-bar noise.
5. Respect your own risk rules (position sizing, max daily loss, news filter).
---
## Recommended timeframes & markets
* Designed for **intraday** use (e.g., **5m–15m**) where volume and sessions matter.
* Works on crypto perpetuals/spot and liquid FX/CFD symbols; threshold tuning may be required per venue.
---
## Limitations & tips
* It’s **one** layer of confirmation; don’t force trades in flat liquidity or into major news.
* CT/Scalp entries are more sensitive to noise; if you prefer higher selectivity, raise **ADX threshold** and narrow **ATR window**.
* Because conditions can change **within a bar**, **alerts** are best set to trigger **on bar close** if you add `alertcondition()` hooks (not included in this base).
---
## Disclaimer
This script is for **educational purposes only** and does **not** constitute financial advice, investment recommendation, solicitation, or an offer to buy/sell any instrument. Trading involves risk; past results do not guarantee future performance. You are solely responsible for your trading decisions and outcomes.
