DCA Bot for ProfitViewThe base for this strategy is the "Backtesting 3commas DCA Bot v2" script by rouxam. I have made some additions, edits, and fixes, as well as tailored it for usage with ProfitView.
The strategy works in such a way that you select one or multiple rules together, in order to determine when a trade should be initiated.
The selectable rules are:
RSI-7: Initiate trading when the 7 period RSI goes below a specified threshold.
Technicals: This is essentially the TradingView screener strength. A multitude of technical indicators combined that range from Strong Sell - Sell - Buy - Strong Buy.
QFL: Find a support/resistance line on a specified timeframe, and initiate trading only when the price is below a certain point from this line.
Once the deal start rule is met, trading will initiate, and a series of additional orders will be placed and spaced out according to the order settings set in the indicator. These orders includes Take Profit, Stoploss, Trailing Take Profit, and specified additional entry orders to DCA your way into a position.
The indicator is set up so that by hooking this up to ProfitView, all of the signals should automatically be replicated to your assigned exchange, along with discord/telegram notifications for when the deals start and end, and the resulting pnl.
If you want to use it for spot markets, while technically possible, you will need to significantly edit the PV Alert syntax that i have supplied below.
Run this on your testnet of choice, it is likely that there are undiscovered issues at this point.
The strategy currently only works with 'Longs' at the time of publishing, but may be subject to change.
==ProfitView Setup==
!!Important!!
The assigned PV Alert name must contain the keyword 'Long', fex "DCA Long"
Uncheck the Once per Bar advanced filter option on the PV Alert you use for this.
Copy/Paste the text into the PV Alert: pastebin.com
"bot" için komut dosyalarını ara

RSI Average Swing BotThis is a modified RSI version using as a source a big length(50 candles) and an average of all types of sources for candle calculations such as ohlc4, close, high, open, hlc3 and hl2.
In this case we are going to use a 0-1 scale for an easier calculation, where 0.5 is going to be our middle point.
Above 0.5 we consider a bullish possibility.
Below 0.5 we consider a bearish possibility.
I made a small example bot using that initial logic, together with 2 exit points for long or short positions.
If there are any questions, let me know !

Joint Conditions Strategy Suite + TradingConnector alerts bot"Please give us combined alerts with the possibility of having several conditions in place to trigger the alert." - was the top voted request from users under one of the recent blogposts by TradingView.
Ask and you shall receive ;)
TradingView is a great platform, with unmatched set of functionalities, yet this particular combo of features indeed seems not to be in place. Fortunately, TradingView is also very open platform, thanks to PineScript coding language, which enables developing combos like the requried one and plenty of other magic.
I have already published numerous "educational" scripts, showing how to code indicators and alerts with PineScript, but... this is not one of them. This one is for real. READY FOR USE on real markets, also by the non-coding traders. Just take my script, set parameters with dropdowns, backtest the strategy, fire the alerts and execute them.
HOW TO USE IT
In "Settings" popup I tried to mimic the CreateAlert popup dropdowns for selecting logic. Let's say you want to enter Long position at Stochastic KxD crossover. In first line of Long Entry conditions set "StochK" + "Crossing Up" + "StochD". Last field doesn't matter because in 3rd dropdown something else than "value" was selected. In second line you could set "maB" + "Greater Than" + "maC" to filter out those entries which are in direction of the uptrend. And yeah, add ADX>25 to make sure the market is actually moving: "ADX" + "Greater Than" + "value" + "25". All condition lines must be TRUE (or skipped) for the entry to be triggered. Toghether with an alert.
The same for Short entries. Combinations are limitless.
INDICATORS AND MTF (MULTI-TIMEFRAME)
In those dropdowns you can select candle values like open/close/high/low/ohlc4, but also some most popular indicators, which I have pre-built into this script: RSI, various Moving Averages, ADX-DMI, Stochastic and Bollinger Bands for start. You can configure parameters of those indicators also in "Settings" popup, in "Indicator Definitions" section. What's important, you can use any of these indicators from higher timeframe, setting MTF multiplier. So if you applied this indicator to 1h chart, but want to use rsi(close,14) from 4h chart, set MTF to 4. If you want to use current timeframe indicators, keep MTF at 1, which is a default setting here.
Note for coders: to keep focus of this script on joining conditions, entire logic for those indicators has been moved to external library, also open source. I encourage you to dig into the code and see how it's done. I love the addition of libraries concept in PineScript.
CUSTOM INDICATOR
Following the "openness" spirit of my master - which is TradingView itself - my work is also open, in 2 ways:
1. This script is open source. So you can grab it, modify or add any functionalities you want. I cannot and don't want to stop you from doing that. I'm asking for only one favor - please mention this source script in your credits.
2. You can import the plot (series) from any other indicator on TradingView. In Settings popup of my script, scroll down to "Indicator Definitions" section, and select the series of your choice in the first dropdown. Now it is ready to use in conditions dropdowns on top of the Settings popup.
Let me give you an example of that last scenario. Take another script of mine, "Pivot Points on SR lines DEMO". You can find it in "Indicators & Strategies" library or here: (). Attach it to your chart. Now come back to THIS script, open Settings popup and in "Custom Indicator aka Imported Source" select "Pivot Points on SR lines: ...". The way it works - it detects if a pivot point happened on Support/Resistance line from the past and returns 1 for PivotLow and -1 for Pivot High. Now in first Long Entry condition set: "custom indicator" + "Greater Than" + "value" + "0" and long entries will be marked on every pivot low noticed on Support/Resistance line.
ALERTS
Last but not least - the alerts. This script produces alerts on the entries calculated by strategy logic, as marked on the chart by the backtester. Moreover, syntax of those alerts is already prepared and fully compatible with TradingConnector - alerts executing tool (bot), if you want to auto-execute those trades. Apart from installing the tool, you need to set
up the alerts in TradingView, here is how:
open CreateAlert popup
in first dropdown select "Joint Conditions Strategy Template"
in second dropdown select "alert() function calls only"
And that's all. You only need to set one alert for the whole script, not one for Longs and one for Shorts as it was in the past. Also, you don't need to setup closing alerts, because stop-loss/take-profit/trailing-stop information is embedded in the entry alert so your broker receives it as early as possible. Alerts sent will look like this: "long sl=40 tp=80", which is exactly what TradingConnector expects.
Phew, that's all folks. If you think I should add something to this template (maybe other indicators?) please let me know in comments or via DM. Happy trading!
P.S. Pyramiding is not supported in this script.
Disclaimer : I'm not saying above combination of conditions will make you money. Actually none of this can be considered financial advice. It is only a software tool. Use it wisely, be aware of the risk and do your own research!

CRYPTO TRADING BOT - 1min SCALPING LONG/SHORTHOW IT WORKS
The core concept behind the script is the determination of the current market mood in sense of creating a trendline indicator using EMA / SMA .
By using this trend indication alongside RSI / MACD value range, we are able to enter/exit the market in both directions: LONG and SHORT .
In case of confirmed false signals, we try to catch up the next good opportunity to minimise loss and to close the current trade.
If the chance for a good countertrade is given at this point, the market is going to be entered reversely.
Should the market move incredibly fast against our trade direction, we use proven Stop-loss targets, to bring our children into safety.
As many others, we could tell you now, that we used state-of-the-art machine learning algorithms
as well as highly sophisticated methods to gain our results.
As a fact, we started with an idea, using simple and common trading tools/indicators,
as a solid ground. We did not want to reinvent the wheel and it paid off.
GET A WORKING SCRIPT
The algorithm we are using has initially been created with a self-developed backtesting software.
To be able to deliver gas to our engine, we have bought a huge amount of OHLCV data for the 1min chart.
After many exhausting and frustrating weeks of our workflow-rotation (develop, fail, fix, test, repeat)
we finally got confirmation for all of our conditions/expectations, so we translated our algorithm into pine-code.
THE RESULTS
Since we have been using our Pine-Strategy alongside our backtesting software , we checked all the results provided by TradingView
and our tool to be 100% sure every outcome, every entry and every exit is exactly the same.
We did this for several months and since 2021 June we have been using it with real Alerts, coped to our binance account.
Below, you will find how the performance for the previous months looked like (every trade was made with 100% of the capital, of course using proper stop loss and take profit):
September 2020: 15.18%
October 2020: 36.17%
November 2020: 15.12%
December 2020: 48.58%
January 2021: 150.10%
February 2021: 45.96%
March 2021: 46.48%
April 2021: 4.96%
May 2021: 43.48%
June 2021: -28.99%
Juli 2021: 15.63%
August 2021 (so far): 11.57%
Accumulated Profit: 1,979.01%
To prove our results, we will link an excel sheet for every trade that was made within this timerange.
Link: docs.google.com
ABOUT US
We are two good friends, both incredibly interested in mathematics, software engineering, AI and algorithmics. After getting introduced into the crypto space
by a common friend, we started figuring out that there is a pattern behind every big or small move which happens in an asset.
This is where the passion for creating a CRYPTO TRADING BOT began. It was our goal, to create this script for the 1min Timeframe, so the software can react quickly when a
big or small move is happening - this is why it is called a SCALPING SCRIPT .
We are incredibly proud of this script and would like to share it with this amazing community - just hit us up on TradingView!

Moon Bot StrategyThis is an experimental strategy that trades based on the Moon Cycles
Works best on 4hr, tested mostly on BTC but maybe you can find other assets that also return profitably
Important: With much power comes much responsibility, use it wisely
0.1% Commission Included in results
Study Version:

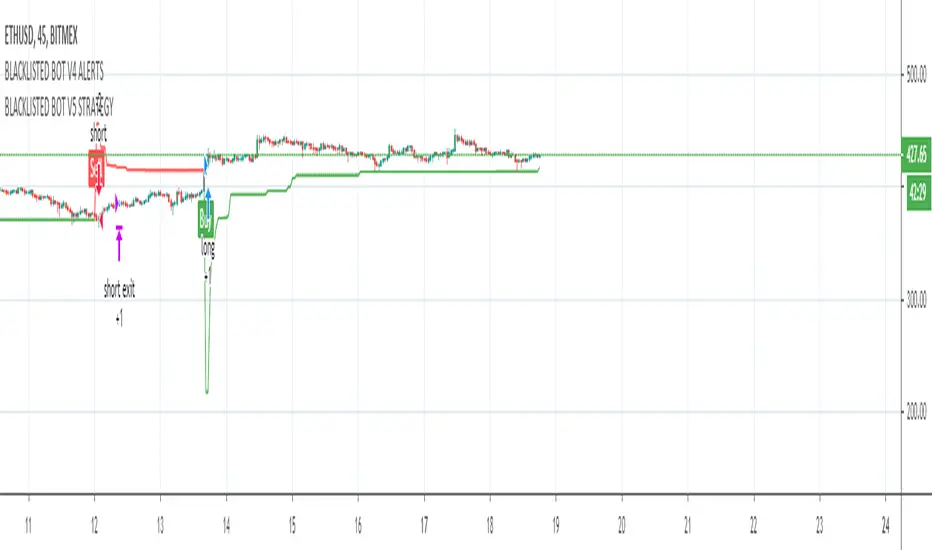
BLACKLISTED BOT V3 STRATEGYStudy used for the Blacklisted Trading Bot
This script uses a variation of ATR and Moving averages giving an alert for a fully automated trading solution.
Fine tuned parameters vary per coin which will be provided for the user after permission is granted.
To gain access to this strategy feel free to contact me directly using a private message.
hamster-bot CCI_PSARTrending strategy using indicators:
Commodity Channel Index (CCI) www.tradingview.com(CCI)
Parabolic SAR (SAR) www.tradingview.com(SAR)
The trend is determined by PSAR indicator on the higher timeframe.
Signals of buy/sell by CCI indicator

[B] hamster-bot ZZ Breakout reversal strategyAttention! This is a beta version of the strategy script >> <<
A backtest should only be done if you understand how the options work. Otherwise, do a test in the release version

BTC crypto bot indicator 3 MIN - PhilMEXBTC Crypto bot indicator
Can be used on all BTC USD / XBT USD
Must be used on 3 minutes timeframe only
Signals are pretty accurate and this code has no repaint.
Hope this help for your trading and Bitmex.
Some updates may come soon.

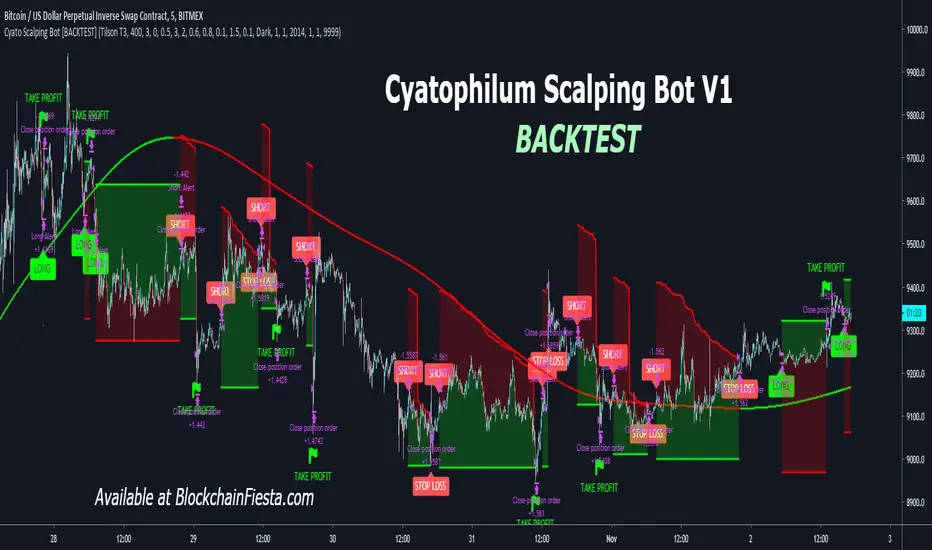
Cyatophilum Scalping Bot [BACKTEST]This indicator triggers Short or/and Long entries and exits.
Example with a Long trade:
The integrated stop loss will trigger an alert to exit the trade.
It is possible that a trend reverses during a trade.
In this case, the "LONG EXIT" alert will trigger at the same
time as the "SHORT ENTRY".
The Trend Detector feature, using EMA or Tilson T3 will filter trades that are against the main trend and thus increase profitability.
BONUS FEATURE
Trailing Take Profit with configurable % deviation.
SAMPLE USE CASES
ETH/BTC
ETH/USD
FOREX: GBP/USD
FOREX: XAU/USD
BTC/USDT
LTC/BTC
XRP/BTC
Read More
> Get access to the Cyatophilum Indicators <
Moving Average Cross and/or Bbands botHello TradingView and world!
This is one of our latest concepts for an actual bot builder. This script comes with a bunch of features that we're hoping will alleviate a lot of the stress and confusion around using and building strategies here on TV. Especially if the end-goal is to automate the strategies using Autoview.
This is a combination of 2 strategies, and gives you full control of each component within the script.
The 2 strategies are:
2 Moving Averages == if close is greater than moving average and moving average 1 is greater than moving average 2
Bolling Bands == if close is less than lower or greater than upper
Features / Settings included :
- Ability to change settings from a commodity market (default) to an altcoin or forex market.
- Backtest time period selector component
- Heiken Ashi Candles on/off
- Moving Average Strategy on/off
- Bollinger Bands Strategy on/off
- Both Moving Average settings can be adjusted
- Bollinger Bands length and multiplier can be adjusted.
- Pyramiding Greater Than, Equal To, or Less Than
- Trailing Stop with the ability to set a price in which the Trailing Stop activate
- Take Profit on/off and editable
- Stop Loss on/off and editable
- Margin Call on/off dependent on Leverage which is editable
- If pyramiding is used, the strategy will calculate and display your average on the chart
- Profit and Loss visuals added to the chart
You can watch a video here on how all the settings can be used and work together.
www.youtube.com
You can learn more about Autoview here:
autoview.with.pink
Get your invite and join us in slack here:
slack.with.pink


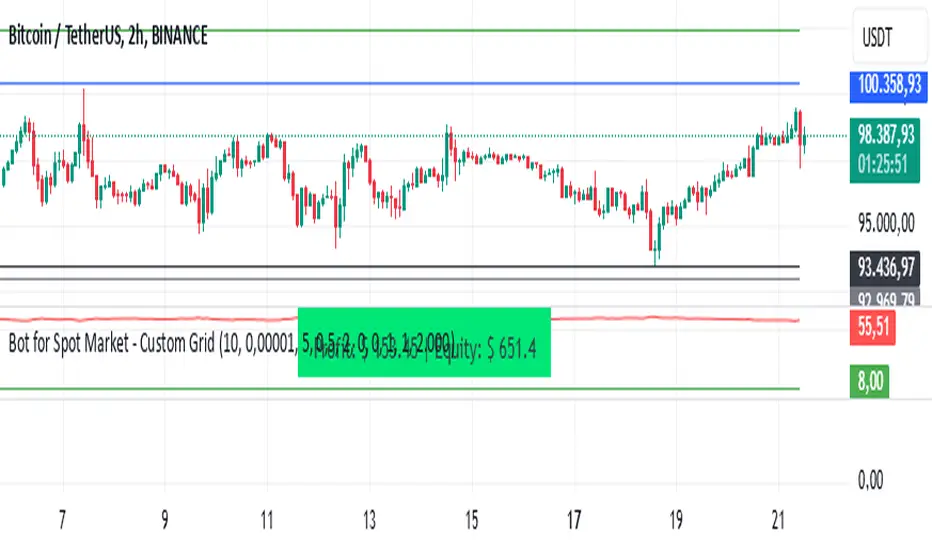
Bot for Spot Market - Custom GridThis script is designed to create a trading bot for the spot market, specifically for buying and selling bitcoins profitably. Recommended for timeframes above two hours. Here are the main functions and features of the script:
Strategy Setup: The bot is set up with a custom grid strategy, defining parameters like pyramiding (allowed number of simultaneous trades), margin requirements, commission, and initial capital.
Order Requirements: It calculates the order price and amount based on the minimum requirements set by the exchange and rounds them appropriately.
Entry Conditions: The bot makes new entries if the closing price falls a certain percentage below the last entry price. It continues to make entries until the closing price rises a certain percentage above the average entry price.
Targets and Plots:
It calculates and plots the target profit level.
It plots the average entry price and the last entry price.
It plots the next entry price based on the defined conditions.
It plots the maximum number of orders allowed based on equity and the number of open orders.
Timerange: The bot can start trading from a specific date and time defined by the user.
Entries: It places orders if the timerange conditions are met. It also places new orders if the closing price is below the last entry price by a defined percentage.
Profit Calculation: The script calculates open profit or loss for the open positions.
Exit Conditions: It closes all positions if the open profit is positive and the closing price is above the target profit level.
Performance Table: The bot maintains and displays statistics like the number of open and closed trades, net profit, and equity in a table format.
The script is customizable, allowing users to adjust parameters like initial capital, commission, order values, and profit targets to fit their specific trading needs and exchange requirements.
Bot go_up DD_long/shortHello!
This strategy is based on the double bottom pattern - for entering a long position / double top-short
A double bottom pattern is formed when two price bottoms are relatively at the same level and the top acts as resistance. This pattern appears at the end of a downtrend and signals a reversal.
A double top is a bearish reversal pattern that signals the end of an uptrend. It is formed by two price highs forming at the same level and a notch line that acts as local support.
As history and practice show, the double bottom pattern works better. Moreover, in a bull market.
You can include only long or only short. BUT while there is a long, a short position will not be opened, in fact, with a long as well.
You can use reverse trade, one coin at a time.
DESCRIPTION:
// LOGIC ENTRY:
Period for short and long positions-to search for double bottom as well as double top. the more, the less false.
Change liong and short-channel width for pattern search separately for long and short.
General shift-the overall width of the channel, which changes equally at once for long and short
By default, quiet settings for tf 5 minutes are applied!
You can choose the settings you like.
// AMOUNT(USDT) FIRST ORDER AND > % NEXT
In the first column, indicate the amount, in the second, how many percent the next order will be more than the previous one.
// EXIT SETTINGS
Closing a trade by RSI when it reaches the level specified in the settings (but in the negative, the trade will never be closed, even if the condition is triggered)
Using a percentage to exit a trade + stop loss. (Put a stop order 1000+ on the market can be anything, especially if you use spot trading)
PS: in order to use the RSI output at a certain level, put a checkmark on the desired one, and also check the percentage box and indicate a take on the percentage 10-20 +)
// MARTINGALE GRID
If there is a check mark, then the grid is used.
Use all signals?
If yes, then there will be no limit on inputs from logic
If the checkbox is not checked, then you can limit the entries from the strategy logic by the specified percentage.
Grid, the next order, when decreasing by a certain percentage, an order when decreasing by the percentage that will be specified (after entering from the logic, when the next signal appears, the grid will be counted from the beginning)
PS: orders are not automatically placed, if the conditions are triggered, then the entry is only at the next bar (within the TV, it is not possible to add orders immediately, but most often, in case of straits, for the better)
// FILTER SETTINGS
The filter consists of a series of popular, averaged oscillators
//DATA RANGE
You can see the results for the selected period
//
CALCULATION OF ORDERS AND MARGIN (FOR INFO ONLY)
The number of orders is the number of entries (you must always have the same number of orders in the arguments and in the properties !!)
- in the aruments for understanding, in the properties - it does not matter how much it will cost there, so many inputs will be!)
-leverage is created to calculate the margin
When you change these parameters, you will understand how much money is required in general and what maximum drawdown can be allowed
Green line-take, lower-stop-order.
To use algo trading, in fact, you need to use a script, in the service through which you will transmit a signal through webhooks, you need to select the amount.
{{strategy.order.contracts}}
ОПИСАНИЕ НА РУССКОМ
//ЛОГИКА ВХОДА:
Период для шорт и лонг позиций, сдвиг для шорта лонга, также общий
По умолчанию применены спокойные настройки для тф. 5 минут.
Вы можете самостоятельно подбирать настройки, основываясь на прошлые результаты
//СУММА ВХОДА В ЮЗДТ +МАРТИНГЕЙЛ:
В первой графе указываете сумму , во второй -на сколько процентов следующий ордер будет больше предыдущего.
//НАСТРОЙКИ ВЫХОДА ИЗ СДЕЛКИ
Закрытие сделки по RSI, когда достигнет уровня, указанного в настройках ( но в минус сделка не будет закрыта никогда, даже если условие сработало)
Использование процента для выхода из сделки+ стоп приказ.( Ставьте стоп-приказ 1000+ на рынке может быть всякое, тем более, если используете спотовую торговлю)
ПС: для того, чтобы использовать выход по RSI по определенному уровню, поставьте галочку на нужный , а также поставьте галочку по проценту и укажите тейк по проценту 10-20+)
//НАСТРОЙКИ СЕТКИ
Если стоит галочка-то сетка используется.
Использовать все сигналы?
Если да, то лимита по входам от логики не будет
Если не стоит галочка, то можно ограничить входы от логики стратегии, на указанный процент.
Сетка, следующий ордер, при снижении на определенный процент-след ордер при снижении на тот процент, который будет указан ( после входа от логики , при появлении следующего сигнала сетка будет считаться с начала)
ПС: ордера автоматически не ставятся, если сработали условия, то вход, только на следующем баре ( в рамках ТВ, нет возможности добавить сразу ордера, но чаще всего, при проливах-к лучшему)
//НАСТРОЙКИ ФИЛЬТРА
Фильтр состоит из серии популярных, усредненных осцилляторов.
//
БЭКТЕСТИНГ
Можете посмотреть результаты за выбранный промежуток
//
ПИРАМИДИНГ (исключительно для расчета)
Количество ордеров-это количество входов ( у вас всегда должно быть одинаковое количество ордеров в агрументах и в свойствах!!)
-в аргументах для понимания, в свойствах -важно, сколько там будет стоить-столько входов и будет!)
-плечо создано для расчета маржи
При изменение данных параметров Вы будете понимать сколько потребуется средств в общем и какую максимальную просадку можно допустить
Зеленая линия-тейк, нижняя-стоп-приказ.
Для использования алго-трейдинга, собственно так и нужно использовать скрипт, в сервисе, через который Вы будете передавать сигнал через веб-хуки , Вам нужно выбрать количество.
{{strategy.order.contracts}}
Удачных трейдов, друзья!

[3Commas] DCA Bot TesterDCA Bot Tester
🔷What it does: A tool designed to simulate the behavior of a Dollar Cost Averaging (DCA) strategy based on input signals from a source indicator. Additionally, it enables you to send activation signals to 3Commas Bots via TradingView webhooks.
🔷Who is it for: This tool is ideal for those who want a visual representation and strategy report of how a DCA Bot would perform under specific conditions. By adjusting the parameters, you can assess whether the strategy aligns with your risk/reward expectations before implementation, helping you save time and protect your capital.
🔷How does it work: The tool leverages a pyramiding function to simulate price averaging, mimicking how a DCA Bot operates. It calculates volume-based averaging and, upon reaching the target, closes the positions. Conversely, if the target isn't reached, a Stop Loss is triggered, potentially resulting in significant losses if improperly configured.
🔷Why It’s Unique
Easy visualization of DCA Bot entry and exit points according to user preferences.
DCA Bot Summary table same as the one shown in the new 3Commas interface.
Use plots from other indicators as Entry Trigger Source, with a small modification of the code.
Option to Review message format before sending Signals to 3Commas. Compatibility with Multi-Pair, and futures contract pairs.
Option to filter signals by session and day according to the user’s timezone.
👉 Before continuing with the explanation of the tool, please take a few minutes to read this information, paying special attention to the risks of using DCA strategies.
DCA Bot: What is it, how does it work, and what are its advantages and risks?
A DCA Bot is an automated tool designed to simplify and optimize your trading operations, particularly in cryptocurrencies. Based on the concept of Dollar Cost Averaging (DCA) , this bot implements scaled strategies that allow you to distribute your investments intelligently. The key lies in dividing your capital into multiple orders, known as base orders and safety orders, which are executed at different price levels depending on market conditions.
These bots are highly customizable, meaning you can adapt them to your goals and trading style, whether you're operating Long (expecting a price increase) or Short (expecting a price decrease). Their primary purpose is to reduce the impact of entries that move against the estimated direction and ensure you achieve a more favorable average price.
🔸 Key Features of DCA Bots
Customizable configuration: DCA bots allow you to adjust the size of your initial investment, the number of safety orders, and the price levels at which these orders execute. These orders can be equal or incremental, depending on your risk tolerance.
Scaled safety orders: If the asset's price moves against your position, the bot executes safety orders at strategic levels to average your entry price and increase your chances of closing in profit.
Automatic Take Profit: When the predefined profit level is reached, the bot closes the position, ensuring net gains by averaging all entries made using the DCA strategy.
Stop Loss option: To protect your capital, you can set a stop loss level that limits losses if the market moves drastically against your position.
Flexibility: Bots can integrate with 3Commas technical indicators or external signals from TradingView, allowing you to trade in any trend, whether bullish or bearish.
Support for multiple assets: You can trade cryptocurrency pairs and exchanges compatible with 3Commas, offering a wide range of possibilities to diversify your strategies.
✅ Advantages of DCA Bots
Time-saving automation: DCA bots eliminate the need for constant market monitoring, executing your trades automatically and efficiently based on predefined settings.
Favorable averages in volatile markets: By averaging your entries, the bot can offer more competitive prices even under adverse market conditions. This increases your chances of recovering a position and closing it profitably.
Advanced capital management: With customizable settings, you can adjust the size of base and safety orders to optimize capital usage and reduce risk.
Additional protection: The ability to set a stop loss ensures your losses are limited, safeguarding your capital in extreme scenarios.
⚠️ Risks of Using a DCA Bot
Requires significant capital: Safety orders can accumulate quickly if the price moves against your position. This issue is compounded if increasing amounts are used for safety orders, which can immobilize large portions of capital in adverse markets.
Markets lacking clear direction: During consolidation periods or erratic movements, the bot may generate unrealized losses and make position recovery difficult.
Opportunity cost: Investing in an asset that doesn't show favorable behavior can prevent you from seizing opportunities in other markets.
Emotional pressure: Large investments in advanced stages of the DCA strategy can cause stress, especially if an asset takes too long to reach your take profit level.
Dependence on market recovery: DCA assumes that the price will eventually move in your favor, which does not always happen, especially in assets without solid fundamentals.
📖 Key Considerations for Effectively Using a DCA Bot
Use small amounts for your base and safety orders: Setting small initial orders not only limits capital usage but also allows you to manage multiple bots simultaneously, maximizing portfolio diversification.
Capital management: Define a clear budget and never risk more than you are willing to lose. This is essential for maintaining sustainable operations.
Select assets with strong fundamentals: Apply DCA to assets you understand and that have solid fundamentals and a proven historical growth record. Additionally, analyze each cryptocurrency's fundamentals: What problem does it solve? Does it have a clear use case? Is it viable in the long term? These questions will help you make more informed decisions.
Diversification: Do not concentrate all your capital on a single asset or strategy. Spread your risk across multiple bots or assets.
Monitor regularly: While bots are automated and eliminate the need to monitor the market constantly, it is essential to monitor the bots themselves to ensure they are performing as expected. This includes reviewing their performance and making adjustments if market conditions change. Remember, the goal is to automate trades, but active bot management is crucial to avoid surprises.
A DCA Bot is a powerful tool for traders looking to automate their strategies and reduce the impact of market fluctuations. However, like any tool, its success depends on how it is configured and used. By applying solid capital management principles, carefully selecting assets, and using small amounts in your orders, you can maximize its potential and minimize risks.
🔷FEATURES & HOW TO USE
🔸Strategy: Here you must select the type of signal you are going to analyze and send signals to the DCA Bot, either Long for buy signals or Short for sell signals. This must match the Bot created in 3Commas.
🔸Add a Source Indicator for Entry Triggers
Tradingview allows us to use indicator plots as a source in other indicators, we will use this functionality so that the buy or sell signals of an indicator are processed by the DCA Bot Tester.
In this EXAMPLE we will use a simple strategy that uses a Donchian Channel (DC) and an Exponential Moving Average (EMA).
Trigger to buy or long signal will be when: the price closes above the previous upper level and the average of the upper and lower level (basis) is greater than the EMA.
Trigger sell or short signal will be when: the price closes below the previous lower level and the average of the upper and lower level (basis) is less than the EMA.
trigger_buy = ta.crossover (close,upper ) and basis > ema and barstate.isconfirmed
trigger_sell = ta.crossunder(close,lower ) and basis < ema and barstate.isconfirmed
Then we create the plots that will be used as input source in the DCA Bot Tester indicator.
When a buy condition is given the plot "🟢 Trigger Buy" will have a value of 1 otherwise it will remain at 0.
When a sell condition is given the plot "🔴 Trigger Sell" will have a value of -1 otherwise it will remain at 0.
plot(trigger_buy ? 1 : 0 , '🟢 Trigger Buy' , color = na, display = display.data_window)
plot(trigger_sell? -1 : 0 , '🔴 Trigger Sell', color = na, display = display.data_window)
Here you have the complete code so you can use it and do tests. Basically you just have to define the buy or sell conditions of your preferred indicator or strategy and then create the plots with the same format that will be used in DCA Bot Tester.
//@version=6
indicator(title="Simple Strategy Example", overlay= false)
// Indicator and Signal Triggers
length = input.int(10, title = "DC Length" , display = display.none)
length_ema = input.int(50, title = "EMA Length", display = display.none)
lower = ta.lowest (length)
upper = ta.highest(length)
ema = ta.ema (close, length_ema)
basis = math.avg (upper, lower)
plot(basis, "Basis", color = color.orange, display = display.all-display.status_line)
plot(upper, "Upper", color = color.blue , display = display.all-display.status_line)
plot(lower, "Lower", color = color.blue , display = display.all-display.status_line)
plot(ema , "EMA" , color = color.red , display = display.all-display.status_line)
candlecol = open < close ? color.teal : color.red
plotcandle(open, high, low, close, title='Candles', color = candlecol, wickcolor = candlecol, bordercolor = candlecol, display = display.pane)
trigger_buy = ta.crossover (close,upper ) and basis > ema and barstate.isconfirmed
trigger_sell = ta.crossunder(close,lower ) and basis < ema and barstate.isconfirmed
plotshape(trigger_buy ?close:na, title="Label Buy" , style=shape.labelup , location= location.belowbar, color=color.green, text="B", textcolor=color.white, display=display.pane)
plotshape(trigger_sell?close:na, title="Label Sell", style=shape.labeldown, location= location.abovebar, color=color.red , text="S", textcolor=color.white, display=display.pane)
// ――――――――――――――――――――――――――――――――――――――――――――――――――――――――――――――――――――――――――――――――――――――――――――――――――――――――――――――――――――
// 👇 Plots to be used in the DCA Bot Indicator as source triggers.
// ――――――――――――――――――――――――――――――――――――――――――――――――――――――――――――――――――――――――――――――――――――――――――――――――――――――――――――――――――――
plot(trigger_buy ? 1 : 0 , '🟢 Trigger Buy' , color = na, display = display.data_window)
plot(trigger_sell? -1 : 0 , '🔴 Trigger Sell', color = na, display = display.data_window)
To use the example code
Open the Pine Editor, paste the code and then click Add to chart.
Then in the Plot Entry Trigger Source option, we will select 🟢 Trigger Buy, as the plot that will give us the buy signals when it is worth 1, otherwise for the sell signals you must change the value to -1 in the Plot Entry Trigger Value and remember to change the strategy mode to Short.
🔸DCA Settings: Here you need to configure the DCA values of the strategy, you can see the meaning of each value in the Settings Section. Once you are satisfied with the tests configure the 3Commas DCA Bot with the same values so that the Summary Table matches the 3Commas Table. Pay close attention to the Total Volume that the Bot will use, according to the amount of Safety Orders you are going to execute, and that all the values in the table adapt to your risk tolerance.
🔸DCA Bot Deal Start: Once you create the Bot in 3Commas with the same settings it will give you a Deal Start Message, you must copy and paste it in this section, verify that it is the same in the summary table, this is used to be sent through tradingview alerts to the Bot and it can process the signals.
🔸DCA Bot Multi-Pair: A Multi-Pair Bot allows you to manage several pairs with a single bot, but you must specify which pair it will run on. You must activate it if you want to use the signals in a DCA Bot Multi-pair. In the text box you must enter (using the 3Commas format) the symbol for each pair before you create the alert so that the bot understands which pair to work on.
In the following image we would be configuring the indicator to send a signal to activate the bot in the BTCUSDT pair using the given format it would be USDT_BTC, but if we wanted to send a signal in another pair we must change the pair in the chart and also in the configuration, an example with ETHUSDT would be USDT_ETH. After this we could create the alert, and the Mult-Pair Bot would detect it correctly.
🔸Strategy Tester Filters: This is useful if you want to test the strategy's result on a certain time window, the indicator will only enter this range. If disabled it will use all historical data available on the chart. If you are going to use the tool to send signals, make sure to disable the Use Custom Test Period. If you want the entries to only run at a certain time and day, in that case make sure that the timezone matches the one you are using in the chart.
🔸Properties: Adjust your initial capital and exchange commission appropriately to achieve realistic results.
🔸Create alerts to trigger the DCA Bot
Check that the message is the same as the one indicated by the DCA Bot.
In the case of Multi-Pair, enable the option to add the symbol with the correct format.
When creating an alert, select Any alert() function call.
Enter the any name of the alert.
Open the Notifications tab and enable Webhook URL
Paste Webhook URL provided by 3Commas looking in the section How to use TradingView custom signals.
Done, alerts will be sent with the correct format automatically to 3Commas.
🔷 INDICATOR SETTINGS
🔸3Commas DCA Bot Settings
Strategy: Select the direction of the strategy to test Long or Short, this must be the same as the Bot created in 3Commas, so that the signals are processed properly.
DCA Bot Deal Start: Copy and paste the message for the deal start signal of the DCA Bot you created in 3Commas. This is the message that will be sent with the alert to the Bot, you must verify that it is the same as the 3Commas bot so that it can process properly so that it executes and starts the trade.
DCA Bot Multi-Pair: A Multi-Pair Bot allows you to manage several pairs with a single bot, but you must specify which pair it will run on.
DCA Bot Summary Table: Here you can activate the display of table as well as change the size, position, text color and background color.
🔸Source Indicator Settings
Plot Entry Trigger Source: Select a Plot for Entries of the Source Indicator. This refers to the Long or Short entry signal that the indicator will use as BO (Base Order).
Plot Entry Trigger Value: Value of the Source Indicator to Deal Start Condition Trigger. The default value is 1, this means that when a signal is given for example Long in the source indicator, we will use 1 or for Short -1 if there is no signal it will be 0 so it will not execute any entry, please review the example code and adjust the indicator you are going to use in the same way.
🔸DCA Settings
Base Order: The Base Order is the first order the bot will create when starting a new deal.
Safety Order: Enter the amount of funds your safety orders will use to average the cost of the asset being traded.Safety orders are also known as Dollar Cost Averaging and help when prices move in the opposite direction to your bot's take profit target.
Safety Orders Deviation %: Enter the percentage difference in price to create the first Safety Order. All Safety Orders are calculated from the price the initial Base Order was filled on the exchange account.
Safety Orders Max Count: This is the total number of Safety Orders the bot is allowed to use per deal that is opened. All Safety Orders created by the bot are placed as Limit Orders on the exchange's order book.
Safety Orders Volume Scale: The Safety Order Volume Scale is used to multiply the amount of funds used by the last Safety Order that was created. Using a larger amount of funds for Safety Orders allows your bot to be more aggressive at Dollar Cost Averaging the price of the asset being traded.
Safety Orders Step Scale: The Safety Order Step Scale is used to multiply the Price Deviation percentage used by the last Safety Order placed on the exchange account. Using a larger value here will reduce the amount of Safety Orders your bot will require to cover a larger move in price in the opposite direction to the active deal's take profit target.
Take Profit %: The Take Profit section offers tools for flexible management of target parameters: automatic profit upon reaching one or more target levels in percentage.
Stop Loss % | Use SL: To enable Stop Loss, please check the "Use SL" box. This is the percentage that price needs to move in the opposite direction to close the deal at a loss. This must be greater than the sum of the deviations from the safety orders.
🔸Strategy Tester Filters
Use Custom Test Period: When enabled signals only works in the selected time window.. If disabled it will use all historical data available on the chart.
Test Start and End: Once the Custom Test Period is enabled, here you select the start and end date that you want to analyze.
Session Filter | Days | Background: Here you can choose a time zone in which signals will be sent or your strategy will be tested, as well as the days and a background of it. It is important that you use the same timezone as your chart so that it matches.
👨🏻💻💭 If this tool helps you, don’t forget to give it a boost! Feel free to share in the comments how you're using it or if you have any questions.
_________________________________________________________________
The information and publications within the 3Commas TradingView account are not meant to be and do not constitute financial, investment, trading, or other types of advice or recommendations supplied or endorsed by 3Commas and any of the parties acting on behalf of 3Commas, including its employees, contractors, ambassadors, etc.

3Commas Multicoin Scalper PRO [SwissAlgo]Introduction
Are you tired of tracking dozens of cryptocurrency charts and placing orders manually on your Exchange?
The 3Commas Multicoin Scalper PRO is an automated trading system designed to simultaneously identify and execute potential trading setups on multiple cryptocurrencies on your preferred Exchange (Binance, Bybit, OKX, Gate.io, Bitget) via 3Commas integration.
It analyzes price action, volume, momentum, volatility, and trend patterns across 180+ USDT Perpetual coins divided into 17 crypto categories , providing real-time signals directly to your 3Commas bots for automated trade execution. This indicator aims to identify potential trend-following and contrarian setups in both bull and bear markets.
-------------------------------------
What it Does
The 3Commas Multicoin Scalper PRO is a technical analysis tool that monitors multiple cryptocurrency pairs simultaneously and connects with 3Commas for signal delivery and execution.
Here's how the strategy works:
🔶 Technical Analysis : Analyzes price action, volume, momentum, volatility, and trend patterns across multiple USDT Perpetual Futures contracts simultaneously.
🔶 Pattern Detection : Identifies specific candle patterns and technical confluences that suggest potential trading setups across all USDT.P contracts of the selected categories
🔶 Signal Generation : When technical criteria are met at bar close, the indicator creates deal-start signals for the relevant pairs.
🔶 3Commas Integration : Packages these signals and delivers them to 3Commas through TradingView alerts, allowing 3Commas bots to receive specific pair information ('Deal-Start' signals).
🔶 Category Management : Each TradingView alert monitors an entire category (approximately 11 pairs), allowing selective activation of different crypto categories.
🔶 Visual Feedback : Provides color-coded candles and backgrounds to visualize technical conditions, with optional pivot points and trend visualization.
Candle types:
Signals:
-------------------------------------
Quick Start Guide
1. Setup 3Commas Bots : Configure two DCA bots in 3Commas (All USDT pairs) - one for LONG positions and one for SHORT positions.
2. Define Trading Parameters : Set your budget for each trade and adjust your preferred sensitivity within the indicator settings.
3. Create Category Alerts : Set up one TradingView alert for each crypto category you want to trade.
That's it! Once configured, the system automatically sends signals to your 3Commas bots when predefined trading setups are detected across coins in your selected/activated categories. The indicator scans all coins at bar close (for example, every hour on the 1H timeframe) and triggers trade execution only for those showing technical confluences.
Important : The more categories you activate by setting TradingView alerts, the more signals your 3Commas bots will receive. Consider your total capital when enabling multiple categories. More details about the setup process are provided below (see paragraph "Detailed Setup & Configuration")
-------------------------------------
Built-in Backtesting
The 3Commas Multicoin Scalper PRO includes backtesting visualization for each coin. When viewing any USDT Perpetual pair on your chart, you can visualize how the strategy would have performed historically on that specific asset.
Color-coded candles and signal markers show past trading setups, helping you evaluate which coins responded best to the strategy. This built-in backtesting capability can support your selection of assets/categories to trade before deploying real capital.
As backtesting results are hypothetical and do not guarantee future performance, your research and analysis are essential for selecting the crypto categories/coins to trade.
The default strategy settings are: Start Capital 1.000$, leverage 25X, Commissions 0.1% (average Taker Fee on Exchanges for average users), Order Amount 200$ for Longs/150$ for Shorts, Slippage 4
-------------------------------------
Key Features
🔶 Multi-Exchange Support : Compatible with BINANCE, BYBIT, BITGET, GATEIO, and OKX USDT Perpetual markets (USDT.P)
🔶 Wide Asset Coverage : Simultaneously analyzes 180+ cryptocurrencies across 17 specialized crypto categories
🔶 Custom Category Option : Create your watchlist with up to 10 custom USDT Perpetual pairs
🔶 3Commas Integration : Seamlessly connects with 3Commas bots to automate trade entries and exits
🔶 Dual Strategy Approach : Identifies both "trend following" and "contrarian" potential setups
🔶 Confluence-Based Signals : Uses a combination of multiple technical factors - price spikes, price momentum, volume spikes, volume momentum, trend analysis, and volatility spikes - to generate potential trading setups
🔶 Risk Management : Adjustable sensitivity/risk levels, leverage settings, and budget allocation for each trade
🔶 Visual Indicators : Color-coded candles and trading signals provide visual feedback on market conditions
🔶 Trend Indication : Background colors showing ongoing uptrends/downtrends
🔶 Pivot Points & Daily Open : Optional display of pivot points and daily open price for additional context
🔶 Liquidity Analysis : Optional display of high/low liquidity timeframes throughout the trading week
🔶 Trade Control : Configurable limit for the maximum number of signals sent to 3Commas for execution (per bar close and category)
Available Exchanges
Categories
Custom Category
Trend following/contrarian signals
-------------------------------------
Methodology
The 3Commas Multicoin Scalper PRO utilizes a multi-faceted approach to identify potential trading setups:
1. Price Action Analysis : Detects abnormal price movements by comparing the current candle's range to historical averages and standard deviations, helping identify potential "pump and dump" scenarios or new-trends start
2. Price Momentum : Evaluates the relative strength of bullish vs. bearish price movements over time, indicating the build-up of buying or selling pressure.
3. Volume Analysis: Identifies unusual volume spikes by comparing current volume to historical averages, signaling strong market interest in a particular direction.
4. Volume Momentum : Measures the ratio of bullish to bearish volume, revealing the dominance of buyers or sellers over time.
5. Trend Analysis : Combines EMA slopes, RSI, and Stochastic RSI to determine overall trend direction and strength.
6. Volatility : Monitors the ATR (Average True Range) to detect periods of increased market volatility, which may indicate potential breakouts or reversals
7. Candle Wick Analysis : Evaluates upper and lower wick percentages to detect potential rejection patterns and reversals.
8. Pivot Point Analysis : Uses pivot points (PP, R1-R3, S1-S3) for identifying key support/resistance areas and potential breakout/breakdown levels.
9. Daily Open Reference: Analyzes price action relative to the daily open for potential setups related to price movement vs. the opening price
10. Market Timing/Liquidity : Evaluates high/low liquidity periods, specific days/times of heightened risk, and potential market manipulation timeframes.
11. Boost Factors : Applies additional weight to certain confluence patterns to adjust global scores
These factors are combined into a "Global Score" ranging from -1 to +1 , applied at bar close to the newly formed candles.
Scores above predefined thresholds (configurable via the Sensitivity Settings) indicate strong bullish or bearish conditions and trigger signals based on predefined patterns. The indicator then applies additional filters to generate specific "Trend Following" and "Contrarian" trading signals. The identified signals are packaged and sent to 3Commas for execution.
Pivot Points
Daily open
Market Trend
Liquidity patterns by weekday
-------------------------------------
Who This Strategy Is For?
The 3Commas Multicoin Scalper PRO may benefit:
Crypto Traders seeking to automate their trading across multiple coins simultaneously
3Commas Users looking to enhance their bot performance with advanced technical signals
Busy Traders who want to monitor many market opportunities without constant chart-watching
Multi-strategy traders interested in both trend-following and reversal trading approaches
Traders of Various Experience Levels from intermediate traders wanting to save time to advanced traders seeking to scale their operations
Perpetual Futures Traders on major exchanges (Binance, Bybit, OKX, Gate.io, Bitget)
Swing and Scalp Traders seeking to identify short to medium-term profit opportunities
-------------------------------------
Visual Indicators
The indicator provides visual feedback through:
1. Candlestick Colors :
* Lime: Strong bullish candle (High positive score)
* Blue: Moderate bullish candle (Medium positive score)
* Red: Strong bearish candle (High negative score)
* Purple: Moderate bearish candle (Medium negative score)
* Pale Green/Red: Mild bullish/bearish candle
2. Signal Markers :
* ↗: Trend Following Long signal
* ↘: Trend Following Short signal
* ⤴: Contrarian Long signal
* ⤵: Contrarian Short signal
3. Optional Elements :
* Pivot Points: Daily support/resistance levels (R1-R3, S1-S3, PP)
* Daily Open: Reference price level for the current trading day
* Trend Background: Color-coded background suggesting potential ongoing uptrend/downtrend
* Liquidity Highlighting: Background colors indicating typical high/low market liquidity periods
4. TradingView Strategy Plots and Backtesting Data : Standard performance metrics showing entry/exit points, equity curves, and trade statistics, based on the signals generated by the script.
-------------------------------------
Detailed Setup & Configuration
The indicator features a user-friendly input panel organized in sequential steps to guide you through the complete setup process. Tooltips for each step provide additional information to help you understand the actions required to get the strategy running.
Informative tables provide additional details and instructions for critical setup steps such as 3Commas bot configuration and TradingView alert creation (to activate trading on specific categories).
1. Choose Exchange, Crypto Category & Sensitivity
* Select your USDT Perpetual Exchange (BINANCE, BYBIT, BITGET, GATEIO, or OKX) - i.e. the same Exchange connected in your 3Commas account
* Browse and choose your preferred crypto category, or define your watchlist
* Choose from three sensitivity levels: Default, Aggressive, or Test Mode (test mode is designed to generate way more signals, a potentially helpful feature when you are testing the indicator and alerts)
2. Setup 3Commas Bots and integrate them with the algo
* Create both LONG and SHORT DCA Bots in 3Commas
* Configure bots to accept signals for 'All USDT Pairs' with "TradingView Custom Signal" as deal start condition
* Enter your Bot IDs and Email Token in the indicator settings
* Set a maximum budget for LONG and SHORT trades
* Choose whether to allow LONG trades, SHORT trades, or both, according to your preference and market analysis
* Set maximum trades per bar/category (i.e. the max. number of simultaneous signals that the algo may send to your 3Commas bots for execution at every bar close - every hour if you set the 1H timeframe)
* Access the detailed setup guide table for step-by-step 3Commas configuration instructions
3Commas integration
3. Choose Visuals
* Toggle various optional visual elements to add to the chart: category metrics, fired alerts, coin metrics, daily open, pivot points
* Select a color theme: Dark or Light
4. Activate Trading via Alerts
* Create TradingView alerts for each category you want to trade
* Set alert condition to "3Commas Multicoin Scalper" with "Any alert() function call"
* Set the content of the message filed to: {{Message}}, deleting the default content shown in this text field, to enable proper 3Commas integration (any other text than {{Message}}, would break the delivery trading signals from Tradingview to 3Commas)
* View the alerts setup instruction table for visual guidance on this critical step
Alerts
Fired Alerts
Important Configuration Notes
Ensure that the TradingView chart's exchange matches your selected exchange in the indicator settings and your 3Commas bot settings.
You must configure the same leverage in both the script and your 3Commas bots
Your 3Commas bots must be configured for All USDT pairs
You must enter the exact Bot IDs and Email Token from 3Commas (these remain confidential - no one, including us, has access to them)
If you activate multiple categories without sufficient capital, 3Commas will display " insufficient funds " errors - align your available capital with the number of categories you activate (each deal will use the budget amount specified in user inputs)
You are free to set your Take Profit % / trailing on 3Commas
We recommend not to use DCA orders (i.e. set the number of DCA orders at zero)
Legend of symbols
-------------------------------------
FAQs
General Questions
❓ Q: What is Global Score? A: The Global Score serves as a foundation for signal generation. When a candle's score exceeds certain thresholds (defined by your Risk Level setting), it becomes a candidate for signal generation. However, not all high-scoring candles generate trading signals - the indicator applies additional pattern recognition and contextual filters. For example, a strongly positive score (lime candle) in an established uptrend may trigger a "Trend Following" signal, while a strongly negative score (red candle) in a downtrend might generate a "Trend Following Short" signal. Similarly, contrarian signals are generated when specific reversal patterns occur alongside appropriate Global Score values, often involving wick analysis and pivot point interactions. This multi-layer approach helps filter out false positives and identify higher-probability trading setups.
❓ Q: What's the difference between "Trend following" and "Contrarian" signals in the script? A: "Trend Following" signals follow the identified trends while "Contrarian" signals anticipate potential trend reversals.
❓ Q: Why can't I configure all the parameters? A: We've designed the solution to be plug-and-play to prevent users from getting lost in endless configurations. The preset values have been tested against their trade-offs in terms of financial performance, average trade duration, and risk levels.
❓ Q: Why don't I see any signals on my chart? A: Make sure you're viewing a USDT Perpetual pair from your selected exchange that belongs to the crypto category you've chosen to analyze. For example, if you've selected the "Top Major Coins" category with Binance as your exchange, you need to view a chart of one of those specific pairs (like BINANCE:BTCUSDT.P) to see signals. If you switch exchanges, for example from Binance to Bybit, you need to pull a Bybit pair on the chart to see backtesting data and signals.
❓ Q: Does this indicator guarantee profits? A: No. Trading cryptocurrencies involves significant risk, and past performance is not indicative of future results. This indicator is a tool to help you identify potential trading setups, but it does not and cannot guarantee profits.
❓ Q: Does this indicator repaint or use lookahead bias? A: No. All trading signals generated by this indicator are based only on completed price data and do not repaint. The system is designed to ensure that backtesting results reflect as closely as possible what you should experience in live trading.
While reference levels like pivot points are kept stable throughout the day using lookahead on, the actual buy and sell signals are calculated using only historical data (lookahead off) that would have been available at that moment in time. This ensures reliability and consistency between backtesting and real-time trading performance.
Technical Setup
❓ Q: What exchanges are supported? A: The strategy supports BINANCE, BYBIT, BITGET, GATEIO, and OKX USDT Perpetual markets (i.e. all the Exchanges you can connect to your 3Commas account for USDT Perpetual trading, excluding Coinbase Perpetual that offers UDSC pairs, instead of USDT).
❓ Q: What timeframe should I use? A: The indicator is optimized for the 1-hour (1H) timeframe but may run on any timeframe.
❓ Q: How many coins can I trade at once? A: You can trade all coins within each selected category (up to 11 coins per category in standard categories). You can activate multiple categories by setting up multiple alerts.
❓ Q: How many alerts do I need to set up? A: You need to set up one alert for each crypto category you want to trade. For example, if you want to trade both the "Top Major Coins" and the "DeFi" categories, you'll need to create two separate alerts, one for each category. We recommend starting with one category, testing the results carefully, monitoring performance daily, and perhaps activating additional categories in a second stage.
❓ Q: Are there any specific risk management features built into the indicator? A: Yes, the indicator includes risk management features: adjustable maximum trades per hour/category, the ability to enable/disable long or short signals depending on market conditions, customizable trade size for both long and short positions, and different sensitivity/risk level settings.
❓ Q: What happens if 3Commas can't execute a signal? A: If 3Commas cannot execute a signal (due to insufficient funds, bot offline, etc.), the trade will be skipped. The indicator will continue sending signals for other valid setups, but it doesn't retry failed signals.
❓ Q: Can I run this indicator on multiple charts at once? A: Yes, but it's not necessary. The indicator analyzes all coins in your selected categories regardless of which chart you apply it to. For optimal resource usage, apply it to a single chart of a USDT Perpetual pair from your selected exchange. To stop trading a category delete the alert created for that category.
❓ Q: How frequently does the indicator scan for new signals? A: The indicator scans all coins in your selected categories at the close of each bar (every hour if you selected the 1H timeframe).
3Commas Integration
❓ Q: Do I need a 3Commas account? A: Yes, a 3Commas account with active DCA bots (both LONG and SHORT) is required for automated trade execution. A paid subscription is needed, as multipair Bots and multiple simultaneous deals are involved.
❓ Q: How do I set the leverage? A: Set the leverage identically in both the indicator settings and your 3Commas DCA bots (the max supported leverage is 50x). Always be careful about leverage, as it amplifies both profits and losses.
❓ Q: Where do I find my 3Commas Bot IDs and Email Token? A: Open your 3Commas DCA bot and scroll to the "Messages" section. You'll find the Bot ID and Email Token within any message (e.g., "Start Deal").
Display Settings
❓ Q: What does the Sensitivity setting do? A: It adjusts the sensitivity of signal generation. "Default" provides a balanced approach with moderate signal frequency. "Aggressive" lowers the thresholds for signal generation, potentially increasing trade frequency but may include more noise. "Test Mode" is the most sensitive setting, useful for testing alert configurations but not recommended for live trading. Higher risk levels may generate more signals but with potentially lower average quality, while lower risk levels produce fewer but potentially better signals.
❓ Q: What does "Show fired alerts" do? A: The "Show fired alerts" option displays a label on your chart showing which signals have been fired and sent to 3Commas during the most recent candle closes. This visual indicator helps you confirm that your alerts are working properly and shows which coins from your selected category have triggered signals. It's useful when setting up and testing the system, allowing you to verify that signals are being sent to 3Commas as expected and their frequency over time.
❓ Q: What does "Show coin/token metrics" do? A: This toggle displays detailed technical metrics for the specific coin/token currently shown on your chart. When enabled, it shows statistics for the last closed candle for that coin.
❓ Q: What does "Show most liquid days/times" do? A: This toggle displays color-coded background highlighting to indicate periods of varying market liquidity throughout the trading week. Green backgrounds show generally higher liquidity periods (typically weekday trading hours), yellow highlights potentially manipulative periods (often Sunday/Monday overnight), and gray indicates low liquidity periods (when major markets are closed or during late hours).
⚠️ Disclaimer
This indicator is for informational and educational purposes only and does not constitute financial advice. Trading cryptocurrencies involves significant risk, including the potential loss of all invested capital, and past performance is not indicative of future results.
Always conduct your own thorough research (DYOR) and understand the risks involved before making any trading decisions. Trading with leverage significantly amplifies both potential profits and losses - exercise extreme caution when using leverage and never risk more than you can afford to lose.
The Bot ID and Email Token information are transmitted directly from TradingView to 3Commas via secure connections. No third party or entity will ever have access to this data (including the Author). Do not share your 3Commas credentials with anyone.
This indicator is not affiliated with, endorsed by, or sponsored by TradingView or 3Commas.

Crypto Punk [Bot] (Zeiierman)█ Overview
The Crypto Punk (Zeiierman) is a trading strategy designed for the dynamic and volatile cryptocurrency market. It utilizes algorithms that incorporate price action analysis and principles inspired by Geometric Brownian Motion (GBM). The bot's core functionality revolves around analyzing differences in high and low prices over various timeframes, estimating drift (trend) and volatility, and applying this information to generate trading signals.
█ How to use the Crypto Punk Bot
Utilize the Crypto Punk Bot as a technical analysis tool to enhance your trading strategy. The signals generated by the bot can serve as a confirmation of your existing approach to entering and exiting the market. Additionally, the backtest report provided by the bot is a valuable resource for identifying the optimal settings for the specific market and timeframe you are trading in.
One method is to use the bot's signals to confirm entry points around key support and resistance levels.
█ Key Features
Let's explain how the core features work in the strategy.
⚪ Strategy Filter
The strategy filter plays a vital role in the entries and exits. By setting this filter, the bot can identify higher or lower price points at which to execute trades. Opting for higher values will make the bot target more long-term extreme points, resulting in fewer but potentially more significant signals. Conversely, lower values focus on short-term extreme points, offering more frequent signals focusing on immediate market movements.
How is it calculated?
This filter identifies significant price points within a specified dynamic range by applying linear regression to the absolute deviation of the range, smoothing out fluctuations, and determining the trend direction. The algorithm then normalizes the data and searches for extreme points.
⚪ External AI filter
The external AI filter allows traders to incorporate two external sources as signal filters. This feature is particularly useful for refining their signal accuracy with additional data inputs.
External sources can include any indicator applied to your TradingView chart that produces a plot as an output, such as a moving average, RSI, supertrend, MACD, etc. Traders can use these indicators of their choice to set filters for screening signals within the strategy.
This approach offers traders increased flexibility to select filters that align with their trading style. For instance, one trader might prefer to take trades when the price is above a moving average, while another might opt for trades when the MACD is below the MACD signal line. These external filters enable traders to choose options that best fit their trading strategies. See the example below. Note that the input sources for the External AI filter can be any indicator applied to the chart, and the input source per se does not make this strategy unique. The AI filter takes the selected input source and applies our function to it. So, if a trader selects RSI as an input filter, RSI is not unique, but how the source is computed within the AI functions is.
How is it calculated?
Once the external filters are selected and enabled within the settings panel, our AI function is applied to enhance the filter's ability to execute trades, even when the set conditions of the filter are not met. For instance, if a trader wants to take trades only when the price is above a moving average, the AI filter can actually execute trades even if the price is below the moving average.
The filter works by combining k-nearest Neighbors (KNN) with Geometric Brownian Motion (GBM) involves first using GBM to model the historical price trends of an asset, identifying patterns of drift and volatility. KNN is then applied to compare the current market conditions with historical instances, identifying the closest matches based on similar market behaviors. By examining the drift values of these nearest historical neighbors, KNN predicts the current trend's direction.
The AI adaptability value is a setting that determines how flexible the AI algorithm is when applying the external AI filter. Setting the adaptability to 10 indicates minimal adaptability, suggesting that the bot will strictly adhere to the set filter criteria. On the other hand, a higher adaptability value grants the algorithm more leeway to "think outside the box," allowing it to consider signals that may not strictly meet the filter criteria but are deemed viable trading opportunities by the AI.
█ Examples
In this example, the RSI is used to filter out signals when the RSI is below the smoothing line, indicating that prices are declining.
Note that the external filter is specifically designed to work with either 'LONG ONLY' or 'SHORT ONLY' modes; it does not apply when the bot is set to trade on 'BOTH' modes. For 'LONG ONLY' positions, the filter criteria are met when source 1 is greater than source 2 (source 1 >= source 2). Conversely, for 'SHORT ONLY' positions, the filter criteria require source 1 to be less than source 2 (source 1 <= source 2).
Examples of Filter Usage:
Long Signals: To receive long signals when the closing price is higher than a moving average, set Source 1 to the 'close' price and Source 2 to a moving average value. This setup ensures that signals are generated only when the closing price exceeds the moving average, indicating a potential upward trend.
█ Settings
⚪ Set Timeframe
Choosing the correct entry and exit timeframes is crucial for the bot's performance. The general guideline is to select a timeframe that is higher than the one currently displayed on the trading chart but still relatively close in duration. For instance, if trading on a 1-minute chart, setting the bot's Timeframe to 5 minutes is advisable.
⚪ Entry
Traders have the flexibility to configure the bot according to their trading strategy, allowing them to choose whether the bot should engage in long positions only, short positions only or both. This customization ensures that the bot aligns with the trader's market outlook and risk tolerance.
⚪ Pyramiding
Pyramiding functionality is available to enhance the bot's trading strategy. If the current position experiences a drawdown by a specified number of points, the bot is programmed to add new positions to the existing one, potentially capitalizing on lower prices to average down the entry cost. To utilize this feature, access the settings panel, navigate to 'Properties,' and look for 'Pyramiding' to specify the number of times the bot can re-enter the market (e.g., setting it to 2 allows for two additional entries).
⚪ Risk Management
The bot incorporates several risk management methods, including a regular stop loss, trailing stop, and risk-reward-based stop loss and exit strategies. These features assist traders in managing their risk.
Stop Loss
Trailing Stop
⚪ Trading on specific days
This feature allows trading on specific days by setting which days of the week the bot can execute trades on. It enables traders to tailor their strategies according to market behavior on particular days.
⚪ Alerts
Alerts can be set for entry, exit, and risk management. This feature allows traders to automate their trading strategy, ensuring timely actions are taken according to predefined criteria.
█ How is Crypto Punk calculated?
The Crypto Punk Bot is a trading bot that utilizes a combination of price action analysis and elements inspired by Geometric Brownian Motion (GBM) to generate buy and sell signals for cryptocurrencies. The bot focuses on analyzing the difference between high and low prices over various timeframes, alongside estimates of drift (trend) and volatility derived from GBM principles.
Timeframe Analysis for Price Action
The bot examines multiple timeframes (e.g., daily, weekly) to identify the range between the highest and lowest prices within each period. This range analysis helps in understanding market volatility and the potential for significant price movements. The algorithm calculates the trading range by applying maximum and minimum functions to the set of prices over your selected timeframe. It then subtracts these values to determine the range's width. This method offers a quantitative measure of the asset's price volatility for the specified period.
Estimating Drift (Trend)
The bot estimates the drift component, which reflects the underlying trend or expected return of the cryptocurrency. The algorithm does this by estimating the drift (trend) using Geometric Brownian Motion (GBM), which involves determining an asset's average rate of return over time, reflecting the asset's expected direction of movement.
Estimating Volatility
Volatility is estimated by calculating the standard deviation of the logarithmic returns of the cryptocurrency's price over the same timeframe used for the drift calculation. Geometric Brownian Motion (GBM) involves measuring the extent of variation or dispersion in the returns of an asset over time. In the context of GBM, volatility quantifies the degree to which the price of an asset is expected to fluctuate around its drift.
Combining Drift and Volatility for Signal Generation
The bot uses the calculated drift and volatility to understand the current market conditions. A higher drift coupled with manageable volatility may indicate a strong upward trend, suggesting a potential buy signal. Conversely, a low or negative drift with increasing volatility might suggest a weakening market, triggering a sell signal.
█ Strategy Properties
This script backtest is done on the 1 hour chart Bitcoin, using the following backtesting properties:
Balance (default): 10 000 (default base currency)
Order Size: 10% of the equity
Commission: 0.05 %
Slippage: 500 ticks
Stop Loss: Risk Reward set to 1
These parameters are set to provide an accurate representation of the backtesting environment. It's important to recognize that default settings may vary for several reasons outlined below:
Order Size: The standard is set at one contract to facilitate compatibility with a wide range of instruments, including futures.
Commission: This fee is subject to fluctuation based on the specific market and financial instrument, and as such, there isn't a standard rate that will consistently yield accurate outcomes.
We advise users to customize the Script Properties in the strategy settings to match their personal trading accounts and preferred platforms. This adjustment is crucial for obtaining practical insights from the deployed strategies.
-----------------
Disclaimer
The information contained in my Scripts/Indicators/Ideas/Algos/Systems does not constitute financial advice or a solicitation to buy or sell any securities of any type. I will not accept liability for any loss or damage, including without limitation any loss of profit, which may arise directly or indirectly from the use of or reliance on such information.
All investments involve risk, and the past performance of a security, industry, sector, market, financial product, trading strategy, backtest, or individual's trading does not guarantee future results or returns. Investors are fully responsible for any investment decisions they make. Such decisions should be based solely on an evaluation of their financial circumstances, investment objectives, risk tolerance, and liquidity needs.
My Scripts/Indicators/Ideas/Algos/Systems are only for educational purposes!
Ücretli komut dosyası

RT-Runner BotRunner Bot is a trend following tool designed to highlight when price shifts from normal back and forth rotation into stronger directional moves. It is built to help traders focus on higher quality trend legs, stay patient during chop, and avoid forcing trades when conditions are not aligned.
Blurring The Lines - Indicator vs Bot
Rainbow Trends set out to combine some of the ideas behind automated trading bots with the flexibility of trading indicators. After years of development, Runner Bot was built as an "indicator bot" that can be applied across multiple assets and multiple timeframes from the same interface.
How It Works
This tool aims to identify points where large market players - the "whales" - may be more likely to reverse the trend. It generates BOTTOM signals when its conditions suggest a potential market bottom has formed, and TOP signals when it detects that a potential top has been reached.
These signals are plotted directly on the chart so traders can visually review where Runner Bot has flagged prior tops and bottoms and compare them with their own levels, structure, and risk management.
How It Changes With Timeframe
Runner Bot identifies trend reversals based on the selected timeframe. The same logic can be applied across intraday, swing, and macro views, but its behavior will naturally change:
For macro level reversals, many traders focus on higher timeframes such as H4 to H12.
If you are scalping, you can switch to much lower timeframes, but keep in mind that bottoms detected on shorter intervals are less reliable at predicting a true long term bottom.
Choosing the timeframe intentionally is important: higher timeframes tend to highlight larger structural tops and bottoms, while lower timeframes are more sensitive to short term noise.
Tuning The Bot
Runner Bot was built to be relatively turnkey, but it does allow users to tune it for specific timeframes and assets.
To adjust the sensitivity of the TOP/BOTTOM prints, adjust the first two values in the settings column:
Decreasing these values (negative adjustments) will generally increase the number of TOP/BOTTOM signals the bot will fire.
Increasing these values will do the opposite and make TOP/BOTTOM signals less common.
This lets traders decide whether they want Runner Bot to be more selective (fewer, higher conviction style signals) or more frequent (more signals for active traders).
The trader also has the option to toggle the signals On/Off as desired. Some traders prefer to only plot TOPs and not BOTTOMs, or only BOTTOMs and not TOPs, depending on their strategy.
Limitations Of The Tool
Under the hood, Runner Bot uses internal algorithms working together to analyze price action. It can be applied across multiple timeframes, but like any tool, it has its sweet spots:
On higher ranges like 12H to 1D, you will mostly see TOP signals, which can be useful for monitoring extended moves.
On ultra low timeframes under 15 minutes, market noise can increase and short term bottoms are less reliable as long term turning points.
Fine tuning your settings to match your strategy, asset, and timeframe is recommended rather than relying on one configuration for every situation.
Preferred Settings
Over time, a few configurations have become common starting points:
H4 - A core timeframe to start catching both Tops and Bottoms across TradFi, Crypto, and Commodities.
H2/H4 Combo - Monitoring Bottoms on H2 and taking profits on H4 has been a popular combination among Rainbow Theory traders. H2 can provide earlier entries, while H4 offers a more conservative, lagging exit.
1D/H24 - Helpful for macro Tops in both TradFi and Crypto when combined with other higher timeframe context.
These are not rules, but practical examples of how some traders choose to deploy Runner Bot.
Automating Alerts
Runner Bot can also be connected to standard TradingView alerts so TOP and BOTTOM signals do not need to be watched manually on every bar.
A typical alert setup:
Symbol - Set to the asset you are charting.
Condition - Set to Runner Bot (this will use the settings you currently have on the chart).
Condition detail - Use the alert() function calls only so the tool can send alerts when TOP or BOTTOM signals fire.
Interval - Same as chart (this locks alerts to the timeframe you set them up on).
Once alerts are configured, TradingView can notify you according to your alert preferences whenever Runner Bot detects a new TOP or BOTTOM based on your current settings.
Important Note
Runner Bot is intended to provide additional context around tops, bottoms, and broader trend behavior. It is not a standalone signal generator and should always be used together with your own analysis, testing, and risk management. Historical Runner Bot signals and past market reversals do not guarantee future results.
🐋 Tight lines and happy trading!
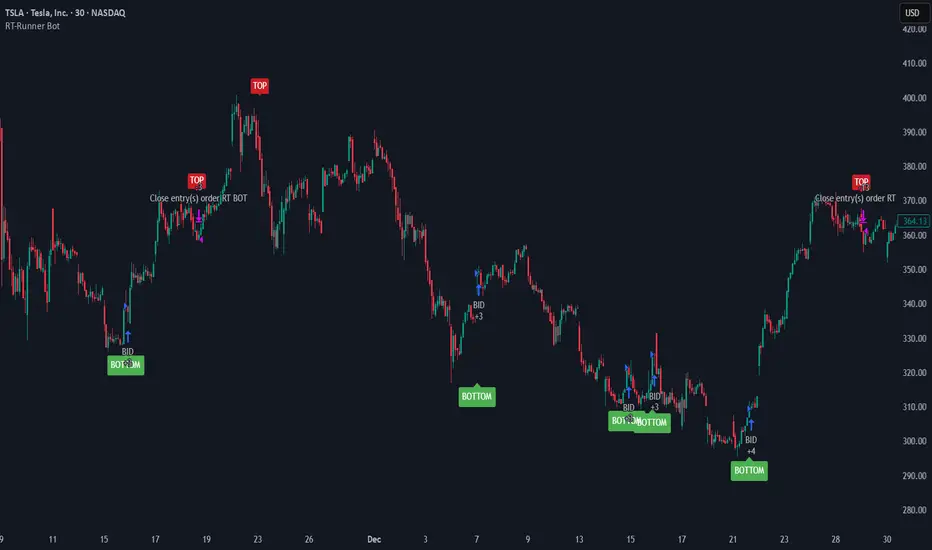
3Commas Bot DCA Backtester & Signals FREEThis is a DCA Strategy backtester + signals, built to emulate the 3Commas DCA bots. It uses your choice of 4 different buy signals, 2 of which can be adjusted in the settings. Everything is customizable so you can backtest specific settings with different buy signals and find the best performing strategy for your risk tolerance and capital. It can be used to backtest strategies on stocks as well, but just make sure your base order is larger than the share price for the entire backtesting range or it will not calculate properly.
You can use this template to code your own buy signals and then backtest them as a DCA strategy if you know some basic pine script.
The indicator shows all of your backtesting orders on the chart. The red line is your take profit level, the blue line is your average price level, the white line is your first order and the green lines are your average down orders. If you enable a stop loss in the settings your stop loss will be shown as an orange line once all of your average down orders have been hit, it will not be set until price has dipped below your covered trading range.
These levels update when things change during backtesting so you can visualize your strategy and how it would perform as well as see if your percentage deviation is large enough to cover dips. When backtesting trades are taken, the chart will show where they were taken(in backtesting) along with info on those trades such as the number each order is, the size of that order and the percentage deviation that order is from the initial buy.
SENDING SIGNALS TO 3COMMAS
Tradingview cannot sync this backtester to 3Commas and with the way alerts are setup for strategies on Tradingview, the best option for you to give signals to your bot would be to use this backtester to figure out what trigger you want to use and then setup that indicator separately to send alerts to your bot. All of the indicators used for signals in this backtester are available for free and can be configured to match this backtester and send alerts to 3Commas for you. Just make sure you set your alerts to once per bar close and don’t use less than a 15 second timeframe because then you could trigger the Tradingview threshold for alerts and get your alerts shut off.
You can also use this backtester with your own buy triggers if you know a little pine script. Just make copy of the script and code in your own buy signals and see how it backtests.
INFO PANEL FOR ANALYZING YOUR STRATEGY
The right hand side of the screen will show an info panel that shows a lot of different information so you can quickly see your bot settings and how it performed right on the screen.
In the top right corner you will see in purple your bot settings. These include your stoploss % if turned on, take profit %, average down order %, average down order % multiplier, volume multiplier, max number of orders allowed and size of your base order.
The top section of the first column “Current Trade” shows these stats: the open trade’s average price, the open trade’s take profit price, the open trade’s PNL, how far price is from your open tarde’s take profit level in percentage, your open position size and number of open orders.
The bottom section of the first column “Overall Performance” shows these stats: total number of trades taken during backtesting range, the largest amount of trades that were open at one time during backtesting, the max drawdown, the average number of bars per trade, gross profit, net profit, percent profit from your initial capital, current portfolio value and your initial capital.
CUSTOMIZABLE OPTIONS TO FIND THE PERFECT STRATEGY
Stoploss On/Off
This will turn your stoploss on or off. By default it is set to off and will not affect anything unless turned on.
Stoploss Percentage
This is the percentage below your final average down order price that will be set as a stoploss to keep your account from going too far in the red on big dips.
Take Profit Percentage - This is the percentage of profit you want the trade to hit before taking profit on your entire DCA trade. This level updates everytime you average down.
Average Down Percentage - This is the percentage that price has to drop from your initial order to initiate your first safety order. If the Average Down Percent Multiplier is set to 1 then this percentage will be the same for every average down order.
Average Down Percentage Multiplier - This multiplies your Average Down Percentage so each safety order needs a larger percentage deviation than the previous one. This keeps your buys closer together at the beginning and further apart when you hit more orders so you can extend your trading range but still be aggressive when price is going sideways.
Volume Multiplier Per New Order - This multiplies the size of each trade based on your base order. If you set it to a 2x multiplier then each average down order will be 2 times the size of the last one. So for example, a $100 base order with a 2x multiplier would have these values for the first 3 average down orders: 200, 400, 800.
Size Of Base Order - This is the size of your first position entry and will be used as a starting point for the volume multiplier. If your base order is $100 then it will buy $100 worth of whatever crypto you are backtesting this on. If you are looking at stock charts, you need to make sure your base order is higher than the share price across the entire backtesting range or it will not perform correctly.
Max Number Of Orders - This is the maximum number of orders the bot can take, including your base order. Adjust this to suit the amount of capital you are willing to allocate to your bot based on how much money it will require to run according to your bot settings.
TIPS ON HOW TO USE FOR BEST RESULTS
If you don’t have a lot of capital to work with, then use longer timeframes with a reasonable take profit percentage so that you don’t need a lot of average down orders. You can also try keeping the volume multiplier close to 1.
You can use the 3Commas dca bot settings page to see how much capital you will need for your strategy if you match it to the settings you have on this indicator. You can also check to see how much of a percentage deviation your bot is covering to make sure you have a reasonable range to trade in and orders to cover big dips. You can also check your coverage by seeing how far down the chart the green lines cover, which are your average down orders.
Make sure the initial capital in the properties tab of the settings has enough to cover all of your orders otherwise you will get unrealistic backtesting results. Also, make sure you leave the order size in the properties tab on contracts so it calculates your trades correctly. The only settings you need to touch in the properties tab is the initial capital. Unless you are trading somewhere that has lower commission fees, then you can change that to match, but leave all the other settings as is for it to function properly.
Increasing the volume multiplier will make your average price and take profit target follow the price action a lot closer as price falls, but it can also lead to having very large orders very quickly once you get into the 1.5-3x multiple range. Try using a high volume multiplier with less safety orders and you will get better results, however you need to have money on the sidelines to add on major dips to keep your bot turning a profit. Be very careful with this as greed and impatience will hurt your overall performance. This bot is meant to make money with lots of small wins so don’t get greedy and make sure you have enough money to cover large dips. If you are being aggressive with your bot, then I recommend only using 25% or less of your portfolio to trade aggressively and then use the smart trade feature on 3commas to add chunks of funds to your trades when price dips below your last safety order. Or if you want it to run without any supervision, then use lower volume multipliers and have lots of safety orders that can cover entire bear markets and still keep buying lower.
It’s a good idea to have some capital on the sidelines that you can add in when price dips quickly. This will help lower your average price and allow your bot to get out in profit quicker. 3Commas bot has a smart trade feature that will allow you to track your average price when adding extra funds and it will automatically update your other orders which is very convenient. Look at the longer timeframes when price dips and only add chunks at major areas where price is very likely to bounce. Or you can be aggressive when trading and add to your position when price dips and is at a likely bounce zone to maximize profits.
Only trade coins that have a good amount of liquidity as the larger your orders get, the harder it will be to sell if there isn’t much liquidity. Also, beware of how large your first order is as it will usually be a market order and can move the market if there is not much liquidity.
Since this bot takes a lot of trades and performs best when taking small profits consistently, you will need to factor in exchange fees. The bot is set to .5% commission(you can change this) on the buy and sell orders as most exchanges charge that amount. Some exchanges offer no fee trading on certain coins so be sure to look around for those so you can keep the commissions and maximize profits.
I strongly encourage you to try out a lot of different setting combinations across multiple different coins and do it across a few months to see how it would have performed under various market conditions. This will help you get a better idea of how much of a percentage deviation you’ll need to be able to cover to keep your bot running and making constant profits. You can also use the deep backtesting feature of the strategy panel to see how it would have done, but just beware that the info panel of the indicator will not reflect deep backtesting results, only the normal backtesting range.
MARKETS
This backtester can be used on any market including crypto, stocks, forex & futures. You just need to make sure your base order is larger than the share price when using this on things besides crypto.
TIMEFRAMES
This backtester can be used on all timeframes.

Gyspy Bot Trade Engine - V1.2B - Strategy 12-7-25 - SignalLynxGypsy Bot Trade Engine (MK6 V1.2B) - Ultimate Strategy & Backtest
Brought to you by Signal Lynx | Automation for the Night-Shift Nation 🌙
1. Executive Summary & Architecture
Gypsy Bot (MK6 V1.2B) is not merely a strategy; it is a massive, modular Trade Engine built specifically for the TradingView Pine Script environment. While most strategies rely on a single dominant indicator (like an RSI cross or a MACD flip) to generate signals, Gypsy Bot functions as a sophisticated Consensus Algorithm.
The engine calculates data from up to 12 distinct Technical Analysis Modules simultaneously on every bar closing. It aggregates these signals into a "Vote Count" and only executes a trade entry when a user-defined threshold of concurring signals is met. This "Voting System" acts as a noise filter, requiring multiple independent mathematical models—ranging from volume flow and momentum to cyclical harmonics and trend strength—to agree on market direction before capital is committed.
Beyond entries, Gypsy Bot features a proprietary Risk Management suite called the Dump Protection Team (DPT). This logic layer operates independently of the entry modules, specifically scanning for "Moon" (Parabolic) or "Nuke" (Crash) volatility events to force-exit positions, overriding standard stops to preserve capital during Black Swan events.
2. ⚠️ The Philosophy of "Curve Fitting" (Must Read)
One must be careful when applying Gypsy Bot to new pairs or charts.
To be fully transparent: Gypsy Bot is, by definition, a very advanced curve-fitting engine. Because it grants the user granular control over 12 modules, dozens of thresholds, and specific voting requirements, it is extremely easy to "over-fit" the data. You can easily toggle switches until the backtest shows a 100% win rate, only to have the strategy fail immediately in live markets because it was tuned to historical noise rather than market structure.
To use this engine successfully, you must adopt a specific optimization mindset:
Ignore Raw Net Profit: Do not tune for the highest dollar amount. A strategy that makes $1M in the backtest but has a 40% drawdown is useless.
Prioritize Stability: Look for a high Profit Factor (1.5+), a high Percent Profitable, and a smooth equity curve.
Regular Maintenance is Mandatory: Markets shift regimes (e.g., from Bull Trend to Crab Range). Parameters that worked perfectly in 2021 may fail in 2024. Gypsy Bot settings should be reviewed and adjusted at regular intervals (e.g., quarterly) to ensure the voting logic remains aligned with current market volatility.
Timeframe Recommendations:
Gypsy Bot is optimized for High Time Frame (HTF) trend following. It generally produces the most reliable results on charts ranging from 1-Hour to 12-Hours, with the 4-Hour timeframe historically serving as the "sweet spot" for most major cryptocurrency assets.
3. The Voting Mechanism: How Entries Are Generated
The heart of the Gypsy Bot engine is the ActivateOrders input (found in the "Order Signal Modifier" settings).
The engine constantly monitors the output of all enabled Modules.
Long Votes: GoLongCount
Short Votes: GoShortCount
If you have 10 Modules enabled, and you set ActivateOrders to 7:
The engine will ONLY trigger a Buy Entry if 7 or more modules return a valid "Buy" signal on the same closed candle.
If only 6 modules agree, the trade is rejected.
This allows you to mix "Leading" indicators (Oscillators) with "Lagging" indicators (Moving Averages) to create a high-probability entry signal that requires momentum, volume, and trend to all be in alignment.
4. Technical Deep Dive: The 12 Modules
Gypsy Bot allows you to toggle the following modules On/Off individually to suit the asset you are trading.
Module 1: Modified Slope Angle (MSA)
Logic: Calculates the geometric angle of a moving average relative to the timeline.
Function: It filters out "lazy" trends. A trend is only considered valid if the slope exceeds a specific steepness threshold. This helps avoid entering trades during weak drifts that often precede a reversal.
Module 2: Correlation Trend Indicator (CTI)
Logic: Based on John Ehlers' work, this measures how closely the current price action correlates to a straight line (a perfect trend).
Function: It outputs a confidence score (-1 to 1). Gypsy Bot uses this to ensure that we are not just moving up, but moving up with high statistical correlation, reducing fake-outs.
Module 3: Ehlers Roofing Filter
Logic: A sophisticated spectral filter that combines a High-Pass filter (to remove long-term drift) with a Super Smoother (to remove high-frequency noise).
Function: It attempts to isolate the "Roof" of the price action. It is excellent at catching cyclical turning points before standard moving averages react.
Module 4: Forecast Oscillator
Logic: Uses Linear Regression forecasting to predict where price "should" be relative to where it is.
Function: When the Forecast Oscillator crosses its zero line, it indicates that the regression trend has flipped. We offer both "Aggressive" and "Conservative" calculation modes for this module.
Module 5: Chandelier ATR Stop
Logic: A volatility-based trend follower that hangs a "leash" (ATR multiple) from the highest high (for longs) or lowest low (for shorts).
Function: Used here as an entry filter. If price is above the Chandelier line, the trend is Bullish. It also includes a "Bull/Bear Qualifier" check to ensure structural support.
Module 6: Crypto Market Breadth (CMB)
Logic: This is a macro-filter. It pulls data from multiple major tickers (BTC, ETH, and Perpetual Contracts) across different exchanges.
Function: It calculates a "Market Health" percentage. If Bitcoin is rising but the rest of the market is dumping, this module can veto a trade, ensuring you don't buy into a "fake" rally driven by a single asset.
Module 7: Directional Index Convergence (DIC)
Logic: Analyzes the convergence/divergence between Fast and Slow Directional Movement indices.
Function: Identifies when trend strength is expanding. A buy signal is generated only when the positive directional movement overpowers the negative movement with expanding momentum.
Module 8: Market Thrust Indicator (MTI)
Logic: A volume-weighted breadth indicator. It uses Advance/Decline data and Up/Down Volume data.
Function: This is one of the most powerful modules. It confirms that price movement is supported by actual volume flow. We recommend using the "SSMA" (Super Smoother) MA Type for the cleanest signals on the 4H chart.
Module 9: Simple Ichimoku Cloud
Logic: Traditional Japanese trend analysis using the Tenkan-sen and Kijun-sen.
Function: Checks for a "Kumo Breakout." Price must be fully above the Cloud (for longs) or below it (for shorts). This is a classic "trend confirmation" module.
Module 10: Simple Harmonic Oscillator
Logic: Analyzes the harmonic wave properties of price action to detect cyclical tops and bottoms.
Function: Serves as a counter-trend or early-reversal detector. It tries to identify when a cycle has bottomed out (for buys) or topped out (for sells) before the main trend indicators catch up.
Module 11: HSRS Compression / Super AO
Logic: Two options in one.
HSRS: Hirashima Sugita Resistance Support. Detects volatility compression (squeezes) relative to dynamic support/resistance bands.
Super AO: A combination of the Awesome Oscillator and SuperTrend logic.
Function: Great for catching explosive moves that result from periods of low volatility (consolidation).
Module 12: Fisher Transform (MTF)
Logic: Converts price data into a Gaussian normal distribution.
Function: Identifies extreme price deviations. This module uses Multi-Timeframe (MTF) logic to look at higher-timeframe trends (e.g., looking at the Daily Fisher while trading the 4H chart) to ensure you aren't trading against the major trend.
5. Global Inhibitors (The Veto Power)
Even if 12 out of 12 modules vote "Buy," Gypsy Bot performs a final safety check using Global Inhibitors. If any of these are triggered, the trade is blocked.
Bitcoin Halving Logic:
Hardcoded dates for past and projected future Bitcoin halvings (up to 2040).
Trading is inhibited or restricted during the chaotic weeks immediately surrounding a Halving event to avoid volatility crushes.
Miner Capitulation:
Uses Hash Rate Ribbons (Moving averages of Hash Rate).
If miners are capitulating (Shutting down rigs due to unprofitability), the engine flags a "Bearish" regime and can flip logic to Short-only or flat.
ADX Filter (Flat Market Protocol):
If the Average Directional Index (ADX) is below a specific threshold (e.g., 20), the market is deemed "Flat/Choppy." The bot will refuse to open trend-following trades in a flat market.
CryptoCap Trend:
Checks the total Crypto Market Cap chart. If the broad market is in a downtrend, it can inhibit Long entries on individual altcoins.
6. Risk Management & The Dump Protection Team (DPT)
Gypsy Bot separates "Entry Logic" from "Risk Management Logic."
Dump Protection Team (DPT)
This is a specialized logic branch designed to save the account during Black Swan events.
Nuke Protection: If the DPT detects a volatility signature consistent with a flash crash, it overrides all other logic and forces an immediate exit.
Moon Protection: If a parabolic pump is detected that violates statistical probability (Bollinger deviations), DPT can force a profit take before the inevitable correction.
Advanced Adaptive Trailing Stop (AATS)
Unlike a static trailing stop (e.g., "trail by 5%"), AATS is dynamic.
Penthouse Level: If price is at the top of the HSRS channel (High Volatility), the stop loosens to allow for wicks.
Dungeon Level: If price is compressed at the bottom, the stop tightens to protect capital.
Staged Take Profits
TP1: Scalp a portion (e.g., 10%) to cover fees and secure a win.
TP2: Take the bulk of profit.
TP3: Leave a "Runner" position with a loose trailing stop to catch "Moon" moves.
7. Recommended Setup Guide
When applying Gypsy Bot to a new chart, follow this sequence:
Set Timeframe: 4 Hours (4H).
Reset: Turn OFF Trailing Stop, Stop Loss, and Take Profits. (We want to see raw entry performance first).
Tune DPT: Adjust "Dump/Moon Protection" inputs first. These have the highest impact on net performance.
Tune Module 8 (MTI): This module is a heavy filter. Experiment with the MA Type (SSMA is recommended).
Select Modules: Enable/Disable modules 1-12 based on the asset's personality (Trending vs. Ranging).
Voting Threshold: Adjust ActivateOrders. A lower number = More Trades (Aggressive). A higher number = Fewer, higher conviction trades (Conservative).
Final Polish: Re-enable Stop Losses, Trailing Stops, and Staged Take Profits to smooth the equity curve and define your max risk per trade.
8. Technical Specs
Engine Version: Pine Script V6
Repainting: This strategy uses Closed Candle data for all Risk Management and Entry decisions. This ensures that Backtest results align closely with real-time behavior (no repainting of historical signals).
Alerts: This script generates Strategy alerts. If you require visual-only alerts, see the source code header for instructions on switching to "Study" (Indicator) mode.
Disclaimer:
This script is a complex algorithmic tool for market analysis. Past performance is not indicative of future results. Use this tool to assist your own decision-making, not to replace it.
9. About Signal Lynx
Automation for the Night-Shift Nation 🌙
Signal Lynx focuses on helping traders and developers bridge the gap between indicator logic and real-world automation. The same RM engine you see here powers multiple internal systems and templates, including other public scripts like the Super-AO Strategy with Advanced Risk Management.
We provide this code open source under the Mozilla Public License 2.0 (MPL-2.0) to:
Demonstrate how Adaptive Logic and structured Risk Management can outperform static, one-layer indicators
Give Pine Script users a battle-tested RM backbone they can reuse, remix, and extend
If you are looking to automate your TradingView strategies, route signals to exchanges, or simply want safer, smarter strategy structures, please keep Signal Lynx in your search.
License: Mozilla Public License 2.0 (Open Source).
If you make beneficial modifications, please consider releasing them back to the community so everyone can benefit.

G-Bot v3Overview:
G-Bot is an invite-only Pine Script tailored for traders seeking a precise, automated breakout strategy. This closed-source script integrates with 3Commas via API to execute trades seamlessly, combining classic indicators with proprietary logic to identify high-probability breakouts. G-Bot stands out by filtering market noise through a unique confluence of signals, offering adaptive risk management, and employing advanced alert deduplication to ensure reliable automation. Its purpose-built design delivers actionable signals for traders prioritizing consistency and efficiency in trending markets.
What It Does and How It Works:
G-Bot generates trade signals by evaluating four key market dimensions—trend, price action, momentum, and volume—on each 60-minute bar. The script’s core components and their roles are:
Trend Detection (EMAs): Confirms trend direction by checking if the 5-period EMA is above (bullish) or below (bearish) the 6-period EMA, with the price positioned accordingly (above the 5-period EMA for longs, below for shorts). The tight EMA pairing is optimized for the 60-minute timeframe to capture sustained trends while minimizing lag.
Price Action Trigger (Swing Highs/Lows): Identifies breakouts when the price crosses above the previous swing high (for longs) or below the previous swing low (for shorts), using a period lookback to focus on recent price pivots. This ensures entries align with significant market moves.
Momentum Filter (RSI): Validates breakouts by requiring RSI to fall within moderated ranges. These ranges avoid overbought/oversold extremes, prioritizing entries with balanced momentum to enhance trade reliability.
Volume Confirmation (3-period SMA): Requires volume to exceed its 3-period SMA, confirming that breakouts are driven by strong market participation, reducing the risk of false moves.
Risk Management (14-period ATR): Calculates stop-loss distances (ATR) and trailing stops (ATR and ATR-point offset) to align trades with current volatility, protecting capital and locking in profits.
These components work together to create a disciplined system: the EMAs establish trend context, swing breaks confirm price momentum, RSI filters for optimal entry timing, and volume ensures market conviction. This confluence minimizes false signals, a critical advantage for hourly breakout trading.
Why It’s Original and Valuable:
G-Bot’s value lies in its meticulous integration of standard indicators into a non-standard, automation-focused system. Its unique features include:
Curated Signal Confluence: Unlike generic breakout scripts that rely on single-indicator triggers (e.g., EMA crossovers), G-Bot requires simultaneous alignment of trend, price action, momentum, and volume. This multi-layered approach, reduces noise and prioritizes high-conviction setups, addressing a common flaw in simpler strategies.
Proprietary Alert Deduplication: G-Bot employs a custom mechanism to prevent redundant alerts, using a 1-second minimum gap and bar-index tracking. This ensures signals are actionable and compatible with 3Commas’ high-frequency automation, a feature not found in typical Pine Scripts.
Adaptive Position Sizing: The script calculates trade sizes based on user inputs (1-5% equity risk, max USD cap, equity threshold) and ATR-derived stop distances, ensuring positions reflect both account size and market conditions. This dynamic approach enhances risk control beyond static sizing methods.
3Commas API Optimization: G-Bot generates JSON-formatted alerts with precise position sizing and exit instructions, enabling seamless integration with 3Commas bots. This level of automation, paired with detailed Telegram alerts for monitoring, streamlines the trading process.
Visual Clarity: On-chart visuals—green triangles for long entries, red triangles for shorts, orange/teal lines for swing levels, yellow circles for price crosses—provide immediate insight into signal triggers, allowing traders to validate setups without accessing the code.
G-Bot is not a repackaging of public code but a specialized tool that transforms familiar indicators into a robust, automated breakout system. Its originality lies in the synergy of its components, proprietary alert handling, and trader-centric automation, justifying its invite-only status.
How to Use:
Setup: Apply G-Bot to BITGET’s BTCUSDT.P chart on a 60-minute timeframe.
3Commas Configuration: Enter your 3Commas API Secret Key and Bot UUID in the script’s input settings to enable webhook integration.
Risk Parameters: Adjust Risk % (1-5%), Max Risk ($), and Equity Threshold ($) to align position sizing with your account and risk tolerance.
Webhook Setup: Configure 3Commas to receive JSON alerts for automated trade execution. Optionally, connect Telegram for detailed signal notifications.
Monitoring: Use on-chart visuals to track signals:
Green triangles (below bars) mark long entries; red triangles (above bars) mark shorts.
Orange lines show swing highs; teal lines show swing lows.
Yellow circles indicate price crosses; purple crosses highlight volume confirmation.
Testing: Backtest G-Bot in a demo environment to validate performance and ensure compatibility with your trading strategy.
Setup Notes : G-Bot is a single, self-contained script for BTCUSDT.P on 60-minute charts, with all features accessible via user inputs. No additional scripts or passwords are required, ensuring compliance with TradingView’s single-publication rule.
Disclaimer: Trading involves significant risks, and past performance is not indicative of future results. Thoroughly test G-Bot in a demo environment before deploying it in live markets.
Full setup support will be provided

Scalper Bot [SMRT Algo]The SMRT Algo Bot is a trading strategy designed for use on TradingView, enabling traders to backtest and refine their strategies with precision. This bot is built to provide key performance metrics through TradingView’s strategy tester feature, offering insights such as net profit, maximum drawdown, profit factor, win rate, and more.
The SMRT Algo Bot is versatile, allowing traders to execute either pro-trend or contrarian strategies, each with customizable parameters to suit individual trading styles.
Traders can automate the bot to their brokerage platform via webhooks and use third-party software to facilitate this.
Core Features:
Backtesting Capabilities: The SMRT Algo Bot leverages TradingView’s powerful strategy tester, allowing traders to backtest their strategies over historical data. This feature is crucial for assessing the viability of a strategy before deploying it in live markets. By providing metrics such as net profit, maximum drawdown, profit factor, and win rate, traders can gain a comprehensive understanding of their strategy's performance, helping them to make informed decisions about potential adjustments or optimizations.
Advanced Take Profit and Stop Loss Methods: The SMRT Algo Bot offers multiple methods for setting Take Profit (TP) and Stop Loss (SL) levels, providing flexibility to match different market conditions and trading strategies.
Take Profit Methods:
- Normal (Percent-based): Traders can set their TP levels as a percentage. This method adjusts the TP dynamically based on market volatility, allowing for more responsive profit-taking in volatile markets.
- Donchian Channel: Alternatively, the bot can use the Donchian Channel to set TP levels, which is particularly useful in trend-following strategies. The Donchian Channel identifies the highest high and lowest low over a specified period, providing a clear target for profit-taking when prices reach extreme levels.
Stop Loss Methods:
- Percentage-Based Stop Loss: This method allows traders to set a fixed percentage of the entry price as the stop loss. It provides a straightforward, static risk management approach that is easy to implement.
- Normal (Percent-based): Traders can set their SL levels as a percentage. This method adjusts the SL dynamically based on market volatility, allowing for more responsive profit-taking in volatile markets.
- ATR Multiplier: Similar to the TP method, the SL can also be set using a multiple of the ATR.
Pro-Trend and Contrarian Strategies: The SMRT Algo Bot is designed to execute either pro-trend or contrarian trading strategies, though only one can be active at any given time.
Pro-Trend Strategy: This strategy aligns with the prevailing market trend, aiming to capitalize on the continuation of current price movements. It is particularly effective in trending markets, where momentum is expected to carry the price further in the direction of the trend.
Contrarian Strategy: In contrast, the contrarian strategy seeks to exploit potential reversals or corrections, trading against the prevailing trend. This approach is more suitable in overextended markets where a pullback is anticipated. Traders can switch between these strategies based on their market outlook and trading style.
Dashboard Display: A dashboard located in the bottom right corner of the TradingView interface provides real-time updates on the bot’s performance metrics. This includes key statistics such as net profit, drawdown, profit factor, and win rate, specific to the current instrument being tested. This immediate access to performance data allows traders to quickly assess the effectiveness of the strategy and make necessary adjustments on the fly.
Input Settings:
Reverse Signals: If turned on, buy trades will be shown as sell trades, etc.
Show Signal (Bar Color): Shows the signal bar as a green candle for buy or red candle for sell.
RSI: Used as a filter for one of the conditions for trade. Can be turned on/off by clicking on the checkbox.
Timeframe: Affects the timeframe of RSI filter.
Length: Length of RSI used in measurement.
First Cross: Whether or not to factor in the first RSI cross in the calculation.
Buy/Sell (Above/Below): Look for trades if RSI is above or below these values.
EMA: Used as a trend filter for one of the conditions for trade. Can be turned on/off by clicking on the checkbox.
Timeframe: Affects the timeframe of EMA filter.
Fast Length: Value for the fast EMA.
Middle Length: Value for the middle EMA
Slow Length: Value for the slow EMA.
ADX: Used as a volatility filter for one of the conditions for trade. Can be turned on/off by clicking on the checkbox.
Threshold: Threshold value for ADX.
ADX Smoothing: Smoothing value for the ADX
DI Length: DI length value for the ADX.
Donchian Channel Length: This value affects the length value of the DC. Used in TP calculation.
Close Trade On Opposite Signal: If true, the current trade will close if an opposite trade appears.
RSI: If turned on, it will also use the RSI to exit the trade (overextended zones).
Take Profit Option: Choose between normal (percentage-based) and Donchian Channel options.
Stop Loss Option: Choose between normal (percentage-based) and Donchian Channel options.
The SMRT Algo Bot’s components are designed to work together seamlessly, creating a comprehensive trading solution. Whether using the ATR multiplier for dynamic adjustments or the Donchian Channel for trend-based targets, these methods ensure that trades are managed effectively from entry to exit. The ability to switch between pro-trend and contrarian strategies offers adaptability, enabling traders to optimize their approach based on market behavior. The real-time dashboard ties everything together, providing continuous feedback that informs strategic adjustments.
Unlike basic or open-source bots, which often lack the flexibility to adapt to different market conditions, the SMRT Algo Bot provides a robust and dynamic trading solution. The inclusion of multiple TP and SL methods, particularly the ATR and Donchian Channel, adds significant value by offering traders tools that can be finely tuned to both volatile and trending markets.
The SMRT Algo Suite, which the SMRT Algo Bot is a part of, offers a comprehensive set of tools and features that extend beyond the capabilities of standard or open-source indicators, providing significant additional value to users.
What you also get with the SMRT Algo Suite:
Advanced Customization: Users can customize various aspects of the indicator, such as toggling the confirmation signals on or off and adjusting the parameters of the MA Filter. This customization enhances the adaptability of the tool to different trading styles and market conditions.
Enhanced Market Understanding: The combination of pullback logic, dynamic S/R zones, and MA filtering offers traders a nuanced understanding of market dynamics, helping them make more informed trading decisions.
Unique Features: The specific combination of pullback logic, dynamic S/R, and multi-level TP/SL management is unique to SMRT Algo, offering features that are not readily available in standard or open-source indicators.
Educational and Support Resources: As with other tools in the SMRT Algo suite, this indicator comes with comprehensive educational resources and access to a supportive trading community, as well as 24/7 Discord support.
The educational resources and community support included with SMRT Algo ensure that users can maximize the indicators’ potential, offering guidance on best practices and advanced usage.
SMRT Algo believe that there is no magic indicator that is able to print money. Indicator toolkits provide value via their convenience, adaptability and uniqueness. Combining these items can help a trader make more educated; less messy, more planned trades and in turn hopefully help them succeed.
RISK DISCLAIMER
Trading involves significant risk, and most day traders lose money. All content, tools, scripts, articles, and educational materials provided by SMRT Algo are intended solely for informational and educational purposes. Past performance is not indicative of future results. Always conduct your own research and consult with a licensed financial advisor before making any trading decisions.

3Commas DCA Backtester + TBO3Commas DCA bot users rejoice! Have you ever wanted to know how your 3Commas DCA bot would have performed with slightly different settings? Or a different deal start condition? Another safety trade? We've combined the logic of 3Commas DCA Bots with TradingView's powerful strategy backtester to FINALLY help 3Commas users backtest their bot settings.
There are several things to be aware of with this strategy:
There is no bot assistant in TradingView, so you'll have to enter in your funds for bot trading in the "Initial capital" section in the Properties tab of the settings.
Even though you can use simultaneous deals with this strategy, there is no way on TradingView to collectively backtest multiple trading pairs with a single instance of this strategy.
We have created all of the available deal start conditions natively available in 3Commas DCA Bots PLUS the TBO and its trigger symbols (Open Long, Close Long, Cross Up, Breakout, Open Short, Close Short, Cross Down, Breakdown). The strategy uses ASAP (as soon as possible) by default.
3Commas DCA Bots use a built-in AND logic for the deal start conditions, meaning that deals will only start when ALL deal start conditions are true. This logic is included in the strategy, however we also provided the option to use OR logic, which will trigger a deal if any of the selected deal start conditions have been met.
Use your own indicators by selecting the "external" option under deal start conditions.
Cooldown between deals cannot use seconds as this is a limitation in TradingView (the strategy will only run on the current timeframe you are viewing), so this has been changed to "next bar."
Customize your backtests in our look back section. Select a specific start and end date for your back test results.
Use the strategy to send alerts directly to your 3Commas bots by providing your bot ID numbers and your email token (found in the JSON code when viewing your bot's overall settings).
Some things to keep in mind while using the back tester:
Enable Buy & Hold Equity to compare your bot strategy and settings.
The back tester can't guarantee future results based on past performance.
Stop losses will result in poor performance. Take advantage of DCA strategy and use safety trades.
Settings for the strategy shown are:
Bot type: Long
Take Profit type: % Quote
Base order: 25
Safety order: 50
Deal Start Conditions:
Custom - OR
TBO Breakout
15m Strong Buy
1h Strong Buy
4h Strong Buy
Target Profit: 4
Max Active Safety Trades: 2
Price deviation in %: 8
Safety order volume scale: 2
Safety order step scale: 2
Simultaneous deals per same pair: 3
Lookback:
2020-05-11
9999-01-01
