Long‑only Swing/ScalpThis is a basic scalper stategy for algos or crypto bots, tested on BNB, not the best backtest but you can tweak and get better results. Take profit at 1% and Sl at 2% , adjust those settings first to see different back test resutls.
"bot" için komut dosyalarını ara

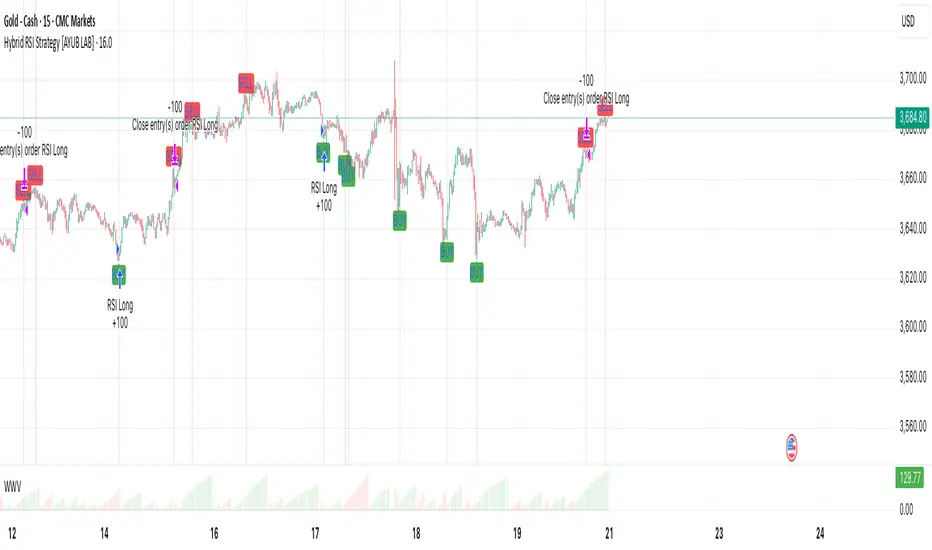
Hybrid RSI Strategy [Heifereum ]This is a hybrid script that combines visual RSI indicator signals with an optional backtestable trading strategy.
BUY Entry: When RSI crosses above the oversold level (default 30)
SELL Exit: When RSI crosses below the overbought level (default 70)
Timeframe: Works best on trending assets (crypto, forex, indices) in 5min to 1H
Backtest Toggle: Turn ON/OFF live testing using the Enable Backtest Mode? setting
Visual Cues: Buy/Sell labels, background coloring, and alerts ready for webhook automation
Use this strategy to visually explore RSI dynamics, run performance backtests, or hook up to external bots via alerts.
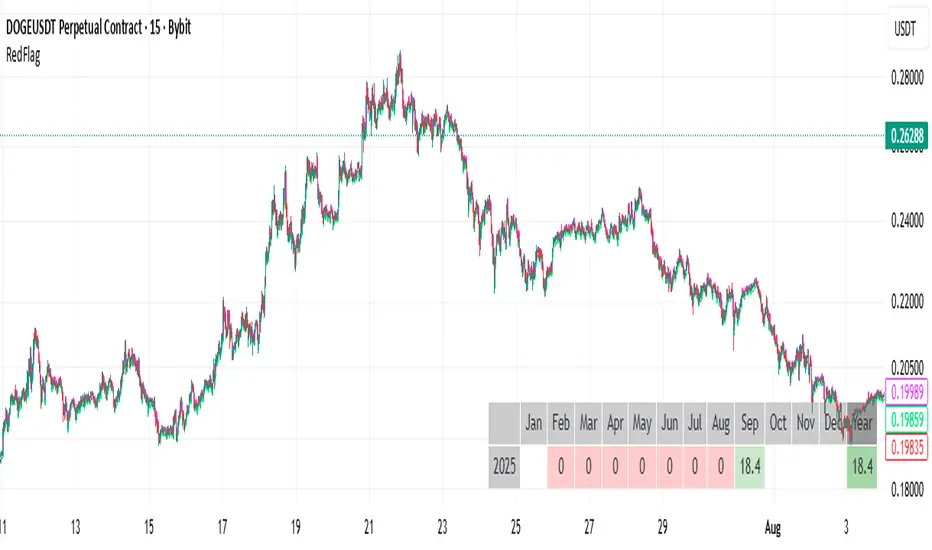
RedFlagCounter-trend strategy
Condition to open a long position:
Buys if the price drops by a specified percentage from the previous candle’s close. Only one purchase can be made within a single candle.
Condition to close a position:
Places a separate individual closing limit order for each purchase, or uses one common take-profit order for the whole position.
⚠️ Attention : Stop-loss is not implemented in the current first version of the strategy.
Options description:
Drop_percent , % — Percentage drop in price from the From point
From — The reference point on the closed candle from which the Drop_percent is calculated (Open, Close, High, Low)
Tp , % — Take-profit level as a percentage
Count — Number of allowed additional purchases (scaling in)
Each_tp — Mode switch:
True — a separate take-profit is placed for each purchase
False — one common take-profit is placed based on the average entry price of the position
hh ema 2 (No TP)hi, my first strategy. Only btc. it will be idea for btc. and it can use for bot system.

Trend MasterOverview
The Strategy is a trend-following trading system designed for forex, stocks, or other markets on TradingView. It uses pivot points to identify support and resistance levels, combined with a 200-period Exponential Moving Average (EMA) to filter trades. The strategy enters long or short positions based on trend reversals during specific trading sessions (London or New York). It incorporates robust risk management, including position sizing based on risk percentage or fixed amount, trailing stop-losses, breakeven moves, and weekly/monthly profit/loss limits to prevent overtrading.
This script is ideal for traders who want a semi-automated approach with visual aids like colored session backgrounds, support/resistance lines, and a performance dashboard. It supports backtesting from a custom start date and can limit trades to one per session for discipline. Alerts are built-in for entries, exits, and stop-loss adjustments, making it compatible with automated trading bots.
Key Benefits:
Trend Reversal Detection: Spots higher highs/lows and lower highs/lows to confirm trend changes.
Session Filtering: Trades only during high-liquidity sessions to avoid choppy markets.
Risk Control: Automatically calculates position sizes to risk only a set percentage or dollar amount per trade.
Performance Tracking: Displays a table of weekly or monthly P&L (profit and loss) with color-coded heatmaps for easy review.
Customizable: Adjust trade direction, risk levels, take-profit ratios, and more via inputs.
The strategy uses a 1:1.2 risk-reward ratio by default but can be tweaked.
How It Works
Trend Identification:
The script calculates pivot highs and lows using left (4) and right (2) bars to detect swing points.
It identifies patterns like Higher Highs (HH), Higher Lows (HL), Lower Highs (LH), and Lower Lows (LL) to determine the trend direction (uptrend if above resistance, downtrend if below support).
Support (green dotted lines) and resistance (red dotted lines) are drawn dynamically and update on trend changes.
Bars are colored blue (uptrend) or black (downtrend) for visual clarity.
Entry Signals:
Long Entry: Price closes above the 200 EMA, trend shifts from down to up (e.g., breaking resistance), during an active session (London or NY), and no trade has been taken that session (if enabled).
Short Entry: Price closes below the 200 EMA, trend shifts from up to down (e.g., breaking support), during an active session, and no prior trade that session.
Trades can be restricted to "Long Only," "Short Only," or "Both."
Entries are filtered by a start date (e.g., from January 2022) and optional month-specific testing.
Position Sizing and Risk:
Risk per trade: Either a fixed dollar amount (e.g., $500) or percentage of equity (e.g., 1%).
Quantity is calculated as: Risk Amount / (Entry Price - Stop-Loss Price).
This ensures you never risk more than intended, regardless of market volatility.
Stop-Loss (SL) and Take-Profit (TP):
SL for Longs: Set below the recent support level, adjustable by a "reduce value" (e.g., tighten by 0-90%) and gap (e.g., add a buffer).
SL for Shorts: Set above the recent resistance level, with similar adjustments.
TP: Based on risk-reward ratio (default 1.2:1), so if SL is 100 pips away, TP is 120 pips in profit.
Visual boxes show SL (red) and TP (green) on the chart for the next 4 bars after entry.
Trade Management:
Trailing SL: Automatically moves SL to the new support (longs) or resistance (shorts) if it tightens the stop without increasing risk.
Breakeven Move: If enabled, SL moves to entry price once profit reaches a set ratio of initial risk (default 1:1). For example, if risk was 1%, SL moves to breakeven at 1% profit.
One Trade Per Session: Prevents multiple entries in the same London or NY session to avoid overtrading.
Sessions include optional weekend inclusion and are highlighted (blue for London, green for NY).
Risk Limits (Weekly/Monthly):
Monitors P&L for the current week or month.
Stops trading if losses hit a limit (e.g., -3%) or profits reach a target (e.g., +7%).
Resets at the start of each new week/month.
Alerts notify when limits are hit.
Exits:
Trades exit at TP, SL, or manually via alerts.
No time-based exits; relies on price action.
Performance Dashboard:
A customizable table (position, size, colors) shows P&L percentages for each week/month in a grid.
Rows = Years, Columns = Weeks (1-52) or Months (1-12).
Color scaling: Green for profits (darker for bigger wins), red for losses (darker for bigger losses).
Yearly totals in the last column.
Helps visualize strategy performance over time without manual calculations.
Input Parameters Explained
Here's a breakdown of the main inputs for easy customization:
Trade Direction: "Both" (default), "Long Only," or "Short Only" – Controls allowed trade types.
Test Only Selected Month: If true, backtests only the specified month from the start year.
Start Year/Month: Sets the backtest start date (default: Jan 2022).
Include Weekends: If true, sessions can include weekends (rarely useful for forex).
Only One Trade Per Session: Limits to one entry per London/NY session (default: true).
Risk Management Time Frame: "Weekly" or "Monthly" – For P&L limits.
Enable Limits: Toggle weekly/monthly stop trading on loss/profit thresholds.
Loss Limit (%)/Profit Target (%): Stops trading if P&L hits these (e.g., -3% loss or +7% profit).
London/New York Session: Enable/disable, with time ranges (e.g., London: 0800-1300 UTC).
Left/Right Bars: For pivot detection (default: 4 left, 2 right) – Higher values smooth signals.
Support/Resistance: Toggle lines, colors, style, width.
Change Bar Color: Colors bars based on trend.
TP RR: Take-profit risk-reward (default: 1.2).
Stoploss Reduce Value: Tightens SL (negative values widen it, 0-0.9 range).
Stoploss Gap: Adds a buffer to SL (e.g., 0.1% away from support).
Move to Breakeven: Enables SL move to entry at a profit ratio (default: true, 1:1).
Use Risk Amount $: If true, risks fixed $ (e.g., 500); else, % of equity (default: 1%).
EMA 3: The slow EMA period (default: 200) for trend filter.
Performance Display: Toggle table, location (e.g., Bottom Right), size, colors, scaling for heatmaps.
Setup and Usage Tips
Add to Chart: Copy the script into TradingView's Pine Editor, compile, and add to your chart.
Backtesting: Use the Strategy Tester tab. Adjust inputs and test on historical data.
Live Trading: Connect alerts to a broker or bot (e.g., via webhook). The script sends JSON-formatted alerts for entry, exit, SL moves, and limits.
Best Markets: Works well on crypto pairs like SOLUSD or RUNEUSD on 4H timeframes.
Risk Warning: This is not financial advice. Always use demo accounts first. Past performance doesn't guarantee future results. Commission is set to 0.05% by default – adjust for your broker.
Customization: Experiment with EMA length or RR ratio for your style.

Signalgo Strategy ISignalgo Strategy I: Technical Overview
Signalgo Strategy I is a systematically engineered TradingView strategy script designed to automate, test, and manage trend-following trades using multi-timeframe price/volume logic, volatility-based targets, and multi-layered exit management. This summary covers its operational structure, user inputs, entry and exit methodology, unique technical features, and practical application.
Core Logic and Workflow
Multi-Timeframe Data Synthesis
User-Defined Timeframe: The user chooses a timeframe (e.g., 1H, 4H, 1D, etc.), on which all strategy signals are based.
Cross-Timeframe Inputs: The strategy imports closing price, volume, and Average True Range (ATR) for the selected interval, independently from the chart’s native timeframe, enabling robust multi-timeframe analysis.
Price Change & Volume Ratio: It calculates the percent change of price per bar and computes a volume ratio by comparing current volume to its 20-bar moving average—enabling detection of true “event” moves vs. normal market noise.
Hype Filtering
Anti-Hype Mechanism: An entry is automatically filtered out if abnormal high volume occurs without corresponding price movement, commonly observed during manipulation or announcement periods. This helps isolate genuine market-driven momentum.
User Inputs
Select Timeframe: Choose which interval drives signal generation.
Backtest Start Date: Specify from which date historical signals are included in the strategy (for precise backtests).
Take-Profit/Stop-Loss Configuration: Internally, risk levels are set as multiples of ATR and allow for three discrete profit targets.
Entry Logic
Trade Signal Criteria:
Price change magnitude in the current bar must exceed a fixed sensitivity threshold.
Volume for the bar must be significantly elevated compared to average, indicating meaningful participation.
Anti-hype check must not be triggered.
Bullish/Bearish Determination: If all conditions are met and price change direction is positive, a long signal triggers. If negative, a short signal triggers.
Signal Debouncing: Ensures a signal triggers only when a new condition emerges, avoiding duplicate entries on flat or choppy bars.
State Management: The script tracks whether an active long or short is open to avoid overlapping entries and to facilitate clean reversals.
Exit Strategy
Take-Profits: Three distinct profit targets (TP1, TP2, TP3) are calculated as fixed multiples of the ATR-based stop loss, adapting dynamically to volatility.
Reversals: If a buy signal appears while a short is open (or vice versa), the existing trade is closed and reversed in a single step.
Time-Based Exit: If, 49 bars after entry, the trade is in-profit but hasn’t reached TP1, it exits to avoid stagnation risk.
Adverse Move Exit: The position is force-closed if it suffers a 10% reversal from entry, acting as a catastrophic stop.
Visual Feedback: Each TP/SL/exit is plotted as a clear, color-coded line on the chart; no hidden logic is used.
Alerts: Built-in TradingView alert conditions allow automated notification for both entries and strategic exits.
Distinguishing Features vs. Traditional MA Strategies
Event-Based, Not Just Slope-Based: While classic moving average strategies enter trades on MA crossovers or slope changes, Signalgo Strategy I demands high-magnitude price and volume confirmation on the chosen timeframe.
Volume Filtering: Very few MA strategies independently filter for meaningful volume spikes.
Real Market Event Focus: The anti-hype filter differentiates organic market trends from manipulated “high-volume, no-move” sessions.
Three-Layer Exit Logic: Instead of a single trailing stop or fixed RR, this script manages three profit targets, time-based closures, and hard adverse thresholds.
Multi-Timeframe, Not Chart-Dependent: The “main” analytical interval can be set independently from the current chart, allowing for in-depth cross-timeframe backtests and system runs.
Reversal Handling: Automatic handling of signal reversals closes and flips positions precisely, reducing slippage and manual error.
Persistent State Tracking: Maintains variables tracking entry price, trade status, and target/stop levels independently of chart context.
Trading Application
Strategy Sandbox: Designed for robust backtesting, allowing users to simulate performance across historical data for any major asset or interval.
Active Risk Management: Trades are consistently managed for both fixed interval “stall” and significant loss, not just via trailing stops or fixed-day closes.
Alert Driven: Can power algorithmic trading bots or notify discretionary traders the moment a qualifying market event occurs.


MACD StrategyOverview
The "MACD Strategy" is a straightforward trading strategy tested for BTCUSDT Futures on the 1-minute timeframe, leveraging the Moving Average Convergence Divergence (MACD) indicator to identify momentum-based buy and sell opportunities. Developed with input from expert trading analyst insights, this strategy combines technical precision with risk management, making it suitable for traders of all levels on platforms like TradingView. It focuses on capturing trend reversals and momentum shifts, with clear visual cues and automated alerts for seamless integration with trading bots (e.g., Bitget webhooks).
#### How It Works
This strategy uses the MACD indicator to generate trading signals based on momentum and trend direction:
- **Buy Signal**: Triggered when the MACD line crosses above the signal line, and the MACD histogram turns positive (above zero). This suggests increasing bullish momentum.
- **Sell Signal**: Triggered when the MACD line crosses below the signal line, and the MACD histogram turns negative (below zero), indicating growing bearish momentum.
Once a signal is detected, the strategy opens a position (long for buy, short for sell) with a position size calculated based on your risk tolerance. It includes a stop-loss to limit losses and a take-profit to lock in gains, both dynamically adjusted using the Average True Range (ATR) for adaptability to market volatility.
#### Key Features
- **MACD-Based Signals**: Relies solely on MACD for entry points, plotted in a separate pane for clear momentum analysis.
- **Risk Management**: Automatically calculates position size based on a percentage of your account balance and sets stop-loss and take-profit levels using ATR multipliers and a risk:reward ratio.
- **Visual Feedback**: Plots entry, stop-loss, and take-profit lines on the chart with labeled markers for easy tracking.
- **Alerts**: Includes Bitget webhook-compatible alerts for automated trading, notifying you of buy and sell signals in real-time.
#### Input Parameters
- **Account Balance**: Default 10000 – Set your initial trading capital to determine position sizing.
- **MACD Fast Length**: Default 12 – The short-term EMA period for MACD sensitivity.
- **MACD Slow Length**: Default 26 – The long-term EMA period for MACD calculation.
- **MACD Signal Length**: Default 9 – The smoothing period for the signal line.
- **Risk Per Trade (%)**: Default 3.0 – The percentage of your account balance risked per trade (e.g., 3% of 10000 = 300).
- **Risk:Reward Ratio**: Default 3.0 – The ratio of potential profit to risk (e.g., 3:1 means risking 1 to gain 3).
- **SL Multiplier**: Default 1.0 – Multiplies ATR to set the stop-loss distance (e.g., 1.0 x ATR).
- **TP Multiplier**: Default 3.0 – Multiplies ATR to set the take-profit distance, adjusted by the risk:reward ratio.
- **Line Length (bars)**: Default 25 – Duration in bars for displaying trade lines on the chart.
- **Label Position**: Default 'left' – Position of text labels (left or right) relative to trade lines.
- **ATR Period**: Default 14 – The number of periods for calculating ATR to measure volatility.
#### How to Use
1. **Add to Chart**: Load the "MACD Strategy" as a strategy and the "MACD Indicator" as a separate indicator on your TradingView chart (recommended for BTCUSDT Futures on the 1-minute timeframe).
2. **Customize Settings**: Adjust the input parameters based on your risk tolerance and market conditions. For BTCUSDT Futures, consider reducing `Risk Per Trade (%)` during high volatility (e.g., 1%) or increasing `SL Multiplier` for wider stops.
3. **Visual Analysis**: Watch the main chart for trade entry lines (green for buy, red for sell), stop-loss (red), and take-profit (green) lines with labels. Use the MACD pane below to confirm momentum shifts.
4. **Set Alerts**: Create alerts in TradingView for "Buy Signal" and "Sell Signal" to automate trades via Bitget webhooks.
5. **Backtest and Optimize**: Test the strategy on historical BTCUSDT Futures 1-minute data to fine-tune parameters. The short timeframe requires quick execution, so monitor closely for slippage or latency.
#### Tips for Success
- **Market Conditions**: This strategy performs best in trending markets on the 1-minute timeframe. Avoid choppy conditions where MACD crossovers may produce false signals.
- **Risk Management**: Start with the default 3% risk per trade and adjust downward (e.g., 1%) during volatile periods like BTCUSDT news events. The 3:1 risk:reward ratio targets consistent profitability.
- **Timeframe**: Optimized for 1-minute charts; switch to 5-minute or 15-minute for less noise if needed.
- **Confirmation**: Cross-check MACD signals with price action or support/resistance levels for higher accuracy on BTCUSDT Futures.
#### Limitations
- This strategy relies solely on MACD, so it may lag in fast-moving or sideways markets. Consider adding a secondary filter (e.g., RSI) if needed.
- Stop-loss and take-profit are ATR-based and may need adjustment for BTCUSDT Futures’ high volatility, especially during leverage trading.
#### Conclusion
The "MACD Strategy" offers a simple yet effective way to trade momentum shifts using the MACD indicator, tested for BTCUSDT Futures on the 1-minute timeframe, with robust risk management and visual tools. Whether you’re scalping crypto futures or exploring short-term trends, this strategy provides a solid foundation for automated or manual trading. Share your feedback or customizations in the comments, and happy trading!

Range FinderRange Finder Strategy for TradingView
Overview
The Range Finder Strategy is a sophisticated trading system designed for forex and cryptocurrency markets, leveraging dynamic range detection, wick-based rejection patterns, and EMA confluence to execute high-probability trades. This strategy identifies key price ranges using pivot points and triggers trades when price rejects from these boundaries with significant wick formations, aligning with the broader market trend as confirmed by EMA crossovers. It incorporates robust risk management, customizable parameters, and visual aids for clear trade visualization, making it suitable for both manual and automated trading on platforms like Bitget via webhook alerts.
Strategy Components
1. Dynamic Range Detection
Pivot Points: The strategy identifies range boundaries using pivot highs and lows, calculated with a user-defined Pivot Length (default: 5 bars left/right). These pivots mark significant swing points, defining the upper (range high) and lower (range low) boundaries of the price range.
Visualization: The range high is plotted as an orange line, and the range low as a purple line, using a broken line style (plot.style_linebr) to show only confirmed pivot levels, providing a clear visual of the trading range.
2. Wick-Based Rejection Pattern
Wick Detection: The strategy looks for rejection candles at the range boundaries, characterized by significant wicks. A wick is considered valid if its size is at least the user-defined Wick to Body Ratio (default: 1.1, or 10% larger than the candle body).
Sell Signal: Triggered when the high exceeds the range high, the candle closes bearish (close < open), and the upper wick meets the ratio requirement.
Buy Signal: Triggered when the low falls below the range low, the candle closes bullish (close > open), and the lower wick meets the ratio requirement.
Purpose: These wicks indicate strong rejection at key levels, often signaling a reversal back into the range, providing high-probability entry points.
3. EMA Trend Confirmation
EMA Calculation: Uses two Exponential Moving Averages (EMAs) calculated on a user-selectable timeframe (default: 5-minute):
EMA 200: Long-term trend indicator (plotted in red).
EMA 50: Short-term trend indicator (plotted in green).
Crossover Logic:
A bullish trend is confirmed when the EMA 50 crosses above the EMA 200 (ema_trend_up = true).
A bearish trend is confirmed when the EMA 50 crosses below the EMA 200 (ema_trend_down = true).
Confluence Requirement: Trades are only executed when the wick rejection aligns with the EMA trend (e.g., sell signals require close < ema200 and bearish trend; buy signals require close > ema200 and bullish trend).
4. Risk Management
Position Sizing: Calculated based on the user-defined Account Balance (default: $10,000) and Risk Per Trade (default: 2%). The position size is determined as risk_amount / stop_distance, where stop_distance is derived from the Average True Range (ATR, default period: 14).
Stop Loss (SL): Set using an ATR-based multiplier (SL Multiplier, default: 9.0). For sells, SL is placed above the high; for buys, below the low.
Take Profit (TP): Set using an ATR-based multiplier (TP Multiplier, default: 6.0) scaled by the Risk:Reward Ratio (default: 6.0), ensuring a favorable reward-to-risk profile.
Example: For a $10,000 account with 2% risk, if ATR is 0.5, the position size is 400 units, with SL and TP dynamically adjusted to market volatility.
5. Trade Execution
Sell Entry: Triggered on a wick rejection above the range high, with bearish EMA confluence (ema_trend_down and close < ema200). Enters a short position with calculated SL and TP.
Buy Entry: Triggered on a wick rejection below the range low, with bullish EMA confluence (ema_trend_up and close > ema200). Enters a long position with calculated SL and TP.
Exit Logic: Uses strategy.exit to set SL and TP levels, closing trades when either is hit.
6. Visual Feedback
Lines and Labels: Upon trade entry, the strategy plots:
Red SL line and label (e.g., "SL: 123.45").
Green TP line and label (e.g., "TP: 120.00").
Entry line (red for sell, green for buy) labeled with "Sell (Range Rejection)" or "Buy (Range Rejection)".
Customization: Users can adjust the Line Length (default: 25 bars) for how long lines persist and Label Position (left or right) for optimal chart visibility.
7. Alert Conditions
Webhook Integration: Generates alerts for Bitget webhook integration, providing JSON-formatted messages with trade details (action, contracts, market position, size, price, symbol, and timestamp).
Usage: Traders can set up automated trading by connecting these alerts to trading bots or platforms supporting webhooks.

8/30 SMA Pullback + ATR Exits (Crypto)A tryout using LLM to see if it can apply to bots using SMA pullbacks with ATR exits for crypto

NADY 45M ADX-RSI StrategyADX-RSI Scalping Strategy for Gold (XAUUSD) – Pine Script v5
This script is a powerful scalping & swing trading strategy that combines the strength of ADX (Average Directional Index) and RSI (Relative Strength Index), along with a Moving Average trend filter, designed specifically for XAUUSD (Gold/USD) but can be adapted to other assets.
Core Logic:
🔹 Trend Strength Filter (ADX):
Trades are allowed only when ADX > 20, ensuring signals occur during strong trends.
Custom-coded ADX calculation for precision (no lagging built-in functions).
🔹 RSI Overbought/Oversold Signals:
Buy when RSI is deeply oversold (<20).
Sell when RSI is overbought (>85).
Exit conditions are also governed by RSI reversals (RSI > 75 for closing longs, RSI < 25 for closing shorts).
🔹 Trend Confirmation with Moving Average (MA):
A 300-period SMA ensures only trades in the direction of the larger trend.
Avoids false signals during sideways markets.
🔹 Risk Filters:
No overtrading: Trades are allowed only when all three conditions (ADX, RSI, MA) align.
Session visual filter (background color highlights signal bars).
Features Included:
✅ Precise ADX Calculation
✅ Configurable RSI & MA lengths
✅ Clean Buy/Sell Entry & Exit logic
✅ Alerts Ready (Webhook-compatible for bots)
✅ Visuals: MA line, background highlights, ADX Threshold line.
Best Timeframes:
45M
Recommended Pairing:
XAUUSD (Gold/USD)
Works well with trending assets, can adapt to Forex Majors with slight tweaks.
Customization Parameters:
MA Length (default 300)
RSI Length (default 2)
ADX Length (default 14)
ADX Threshold (default 20)
Backtest Insights:
High accuracy during strong trends.
Works best during London & US sessions.
Filters out sideways, low-volatility zones effectively.

Test Bot: Bearish Buy / Bullish SellFor testing the connection between TradingView and your brokerage. Use with a demo account if possible.

Fusion Trend Pulse V2SCRIPT TITLE
Adaptive Fusion Trend Pulse V2 - Multi-Regime Strategy
DETAILED DESCRIPTION FOR PUBLICATION
🚀 INNOVATION SUMMARY
The Adaptive Fusion Trend Pulse V2 represents a breakthrough in algorithmic trading by introducing real-time market regime detection that automatically adapts strategy parameters based on current market conditions. Unlike static indicator combinations, this system dynamically adjusts its behavior across trending, choppy, and volatile market environments, providing a sophisticated multi-layered approach to market analysis.
🎯 CORE INNOVATIONS JUSTIFYING PROTECTED STATUS
1. Adaptive Market Regime Engine
Trending Market Detection: Uses ADX >25 with directional movement analysis
Volatile Market Classification: ATR-based volatility regime scoring (>1.2 threshold)
Choppy Market Identification: ADX <20 combined with volatility patterns
Dynamic Parameter Adjustment: All thresholds adapt based on detected regime
2. Multi-Component Fusion Algorithm
McGinley Dynamic Trend Baseline: Self-adjusting moving average that adapts to price velocity
Adaptive RMI (Relative Momentum Index): Enhanced RSI with momentum period adaptation
Zero-Lag EMA Smoothed CCI: Custom implementation reducing lag while maintaining signal quality
Hull MA Gradient Analysis: Slope strength normalized by ATR for trend confirmation
Volume Spike Detection: Regime-adjusted volume confirmation (0.8x-1.3x multipliers)
3. Intelligence Layer Features
Cooldown System: Prevents overtrading with regime-specific waiting periods (1-3 bars)
Performance Tracking: Real-time adaptation based on recent trade outcomes
Multi-Exchange Alert Integration: JSON-formatted alerts for automated trading
Comprehensive Dashboard: 16-metric real-time performance monitoring
📊 TECHNICAL SPECIFICATIONS
Market Regime Detection Philosophy:
The system continuously monitors market structure through volatility analysis and directional strength measurements. Rather than applying fixed thresholds, it creates dynamic response profiles that adjust the strategy's sensitivity, timing, and filtering based on the current market environment.
Adaptive Parameter Concept:
All strategy components modify their behavior based on regime classification. Volume requirements become more or less stringent, momentum thresholds shift to match market character, and exit timing adjusts to prevent whipsaws in different market conditions.
Entry Conditions (Both Long/Short):
McGinley trend alignment (close vs trend line)
Hull MA slope confirmation with ATR-normalized strength
Adaptive CCI above/below regime-specific thresholds
RMI momentum confirmation (>50 for long, <50 for short)
Volume spike exceeding regime-adjusted threshold
Regime-specific additional filters
Exit Strategy:
Dual take-profit system (2% and 4% default, customizable)
Momentum weakness detection (CCI reversal)
Trend breakdown (close below/above McGinley line)
Regime-specific urgency multipliers for faster exits in choppy markets
🎛️ USER CUSTOMIZATION OPTIONS
Core Parameters:
RMI Length & Momentum periods
CCI smoothing length
McGinley Dynamic length
Hull MA period for gradient analysis
Volume spike detection (length & multiplier)
Take profit levels (separate for long/short)
Adaptive Settings:
Market regime detection period (21 bars default)
Adaptation period for performance tracking (60 bars)
Volatility adaptation toggle
Trend strength filtering toggle
Momentum sensitivity multiplier (0.5-2.0 range)
Dashboard & Alerts:
Dashboard position (4 corners)
Dashboard size (Small/Normal/Large)
Transparency settings (0-100%)
Custom alert messages for bot integration
Date range filtering
🏆 UNIQUE VALUE PROPOSITIONS
1. Market Intelligence: First Pine Script strategy to implement comprehensive regime detection with parameter adaptation - most strategies use static settings regardless of market conditions.
2. Fusion Methodology: Combines 5+ distinct technical approaches (trend-following, momentum, volatility, volume, regime analysis) in a cohesive adaptive framework rather than simple indicator stacking.
3. Performance Optimization: Built-in learning system tracks recent performance and adjusts sensitivity - providing evolution rather than static rule-following.
4. Professional Integration: Enterprise-ready with JSON alert formatting, multi-exchange compatibility, and comprehensive performance tracking suitable for institutional use.
5. Visual Intelligence: Advanced dashboard provides 16 real-time metrics including regime classification, signal strength, and performance analytics - far beyond basic P&L displays.
🔧 TECHNICAL IMPLEMENTATION HIGHLIGHTS
Primary Applications:
Swing Trading: 4H-1D timeframes with regime-adapted entries
Algorithmic Trading: Automated execution via webhook alerts
Portfolio Management: Multi-timeframe analysis across different market conditions
Risk Management: Regime-aware position sizing and exit timing
Target Markets:
Cryptocurrency pairs (high volatility adaptation)
Forex majors (trending market optimization)
Stock indices (choppy market handling)
Commodities (volatile regime management)
🎯 WHY THIS ISN'T JUST AN INDICATOR MASHUP
Integrated Adaptation Framework: Unlike scripts that simply combine multiple indicators with static settings, this system creates a unified intelligence layer where each component influences and adapts to the others. The McGinley trend baseline doesn't just provide signals - it dynamically adjusts its sensitivity based on market regime detection. The momentum components modify their thresholds based on trend strength analysis.
Feedback Loop Architecture: The strategy incorporates a closed-loop learning system where recent performance influences future parameter selection. This creates evolution rather than static rule application. Most indicator combinations lack this adaptive learning capability.
Contextual Decision Making: Rather than treating each signal independently, the system uses contextual analysis where the same technical setup may generate different responses based on the current market regime. A momentum signal in a trending market triggers different behavior than the identical signal in choppy conditions.
Unified Risk Management: The regime detection doesn't just affect entries - it creates a comprehensive risk framework that adjusts exit timing, cooldown periods, and position management based on market character. This holistic approach distinguishes it from simple indicator stacking.
Custom Implementation Depth: Each component uses proprietary implementations (custom McGinley calculation, zero-lag CCI smoothing, enhanced RMI) rather than standard built-in functions, creating a cohesive algorithmic ecosystem rather than disconnected indicator outputs.
Custom Functions:
mcginley(): Proprietary implementation of McGinley Dynamic MA
rmi(): Enhanced Relative Momentum Index with custom parameters
zlema(): Zero-lag EMA for CCI smoothing
Regime classification algorithms with multi-factor analysis
Performance Optimizations:
Efficient variable management with proper scoping
Minimal repainting through careful historical referencing
Optimized calculations to prevent timeout issues
Memory-efficient tracking systems
Alert System:
JSON-formatted messages for API integration
Dynamic symbol/exchange substitution
Separate entry/exit/TP alert conditions
Customizable message formatting
⚡ WHY THIS REQUIRES PROTECTION
This strategy represents months of research into adaptive trading systems and market regime analysis. The specific combination of:
Proprietary regime detection algorithms
Custom adaptive parameter calculations
Multi-indicator fusion methodology
Performance-based learning system
Professional-grade implementation
Creates intellectual property that provides genuine competitive advantage. The methodology is not available in existing open-source scripts and represents original research into algorithmic trading adaptation.
🎯 EDUCATIONAL VALUE
Users gain exposure to:
Advanced market regime analysis techniques
Adaptive parameter optimization concepts
Multi-timeframe indicator fusion
Professional strategy development practices
Automated trading integration methods
The comprehensive dashboard and parameter explanations serve as a learning tool for understanding how professional algorithms adapt to changing market conditions.
CATEGORY SELECTION
Primary: Strategy
Secondary: Trend Analysis
SUGGESTED TAGS
adaptive, trend, momentum, regime, strategy, alerts, dashboard, mcginley, rmi, cci, professional
MANDATORY DISCLAIMER
Disclaimer: This strategy is for educational and informational purposes only. It does not constitute financial advice. Trading cryptocurrencies involves substantial risk, and past performance is not indicative of future results. Always backtest and forward-test before using on a live account. Use at your own risk.

safa bot alertGood trading for everying and stuff that very gfood and stuff please let me puibisjertpa 9uihthsi fuckitgn code

✅ BACKTEST: UT Bot + RSIRSI levels widened (60/40) — more signals.
Removed ATR volatility filter (to let trades fire).
Added inputs for TP and SL using ATR — fully dynamic.
Cleaned up conditions to ensure alignment with market structure.

Yuri Garcia Smart Money Strategy FULL (COMPLIANT)Yuri Garcia Smart Money Strategy FULL (Slope Divergence)
This script is not a mashup of random indicators. It is an original, coherent strategy that blends multiple institutional-grade tools to form a unified Smart Money trading system. Each component contributes to precise trade filtering, context, and confirmation — no element is decorative or redundant.
🔍 Strategy Logic: How It Works
This strategy integrates the following tools, each with a clearly defined role:
1. Volume Cluster Zones (Orange bands)
Identifies strong buy/sell areas using the highest volume nodes over a rolling window. These act as dynamic points of control where Smart Money is likely active.
2. HTF Zones (4H) (Purple band)
Defines institutional zones by using the 20-bar high/low on the 4-hour chart. These set the outer bounds for valid entries, ensuring alignment with larger market structure.
3. Wick Pullback Filter (Orange circle 🔶)
Detects exhaustion or absorption near zones. Used to confirm genuine rejection after liquidity sweeps or traps.
4. Cumulative Delta Confirmation (Red square 🟥)
Analyzes whether buyers or sellers are dominant using delta volume. Trades only trigger when volume confirms the intended direction.
5. Slope-Based Delta Divergence (Optional)
Detects hidden reversals between price and delta. This prevents late entries and provides early insight into potential trap reversals.
6. Liquidity Grab Detection (Blue diamond 🔷)
Marks smart money stop hunts — temporary price breaks beyond highs/lows, followed by reversal. Used as a confluence tool.
7. ATR-Based Dynamic Risk Control
The strategy uses ATR to calculate SL/TP dynamically. This allows position sizing to adjust to volatility, reducing overexposure in high-momentum conditions.
🎯 Entry Criteria
All the following conditions must be met:
✅ Price is inside a Volume Cluster Zone
✅ Price is within the HTF Institutional Zone
✅ Wick Pullback confirms reaction
✅ Delta confirms strength of buyers/sellers
✅ (Optional) Slope-based divergence signals hidden shift
✅ (Optional) Liquidity grab occurs
Only then will the strategy trigger an entry.
📈 Visual Legend (Symbols on Chart)
Symbol Description
🟣 Purple Zone HTF Support/Resistance zone (4H context)
🟠 Orange Zone Volume cluster from top 3 volume nodes
🔶 Orange Circle Wick Pullback confirmation
🟥 Red Square Delta Confirmation
🔷 Blue Diamond Liquidity Grab indicator
🔵 Blue X Price is inside HTF Zone
🔻 Red Triangle SHORT entry signal
🔺 Green Triangle LONG entry signal
These visuals make it easier to read the chart intuitively while understanding each condition’s role.
⚙️ Strategy Settings Justification
Default Qty: 2% of equity (sustainable risk)
RRR: 2.0 (adaptive to volatility)
ATR Multiplier: 2.0 for SL/TP
Commission: 0.1% used
Slippage: 2 points for realism
Minimum Trades for Testing: Designed to generate over 100 trades under normal backtest conditions
Dataset: Supports BTC, GOLD, Forex, Indices with realistic volatility and volume
These settings reflect a realistic use case for average retail traders and avoid overfitting or unrealistic returns.
📌 How to Use
Apply on 15-minute or 1-hour timeframe.
Wait for full alignment of all entry conditions.
Confirm visually or use included alerts for manual or bot execution.
SL and TP are automatically handled.
🚫 Important Notes
This script is original, not a remix or mashup of unrelated indicators.
Each component was designed to work in harmony, enhancing trade quality and confidence.
No external scripts are required to function.
Alert messages are pre-formatted for both manual and webhook use.

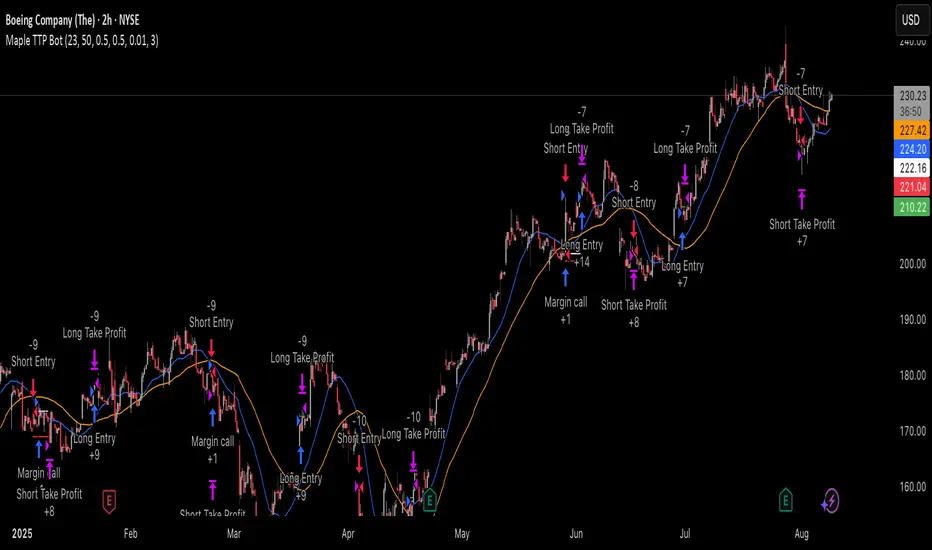
Trailing TP Bot • Crossover-based Trend Strategy using two simple moving averages (SMAs)
• Includes Take Profit and optional Trailing Take Profit
• Trades both long and short
• No pyramiding, i.e., one position at a time
World-Class Crypto Strategy version 9 - BTC/ETH/SOL/XRP + MLScript intended to mirror BlackRock strategies and be used with fully integrated trading bot

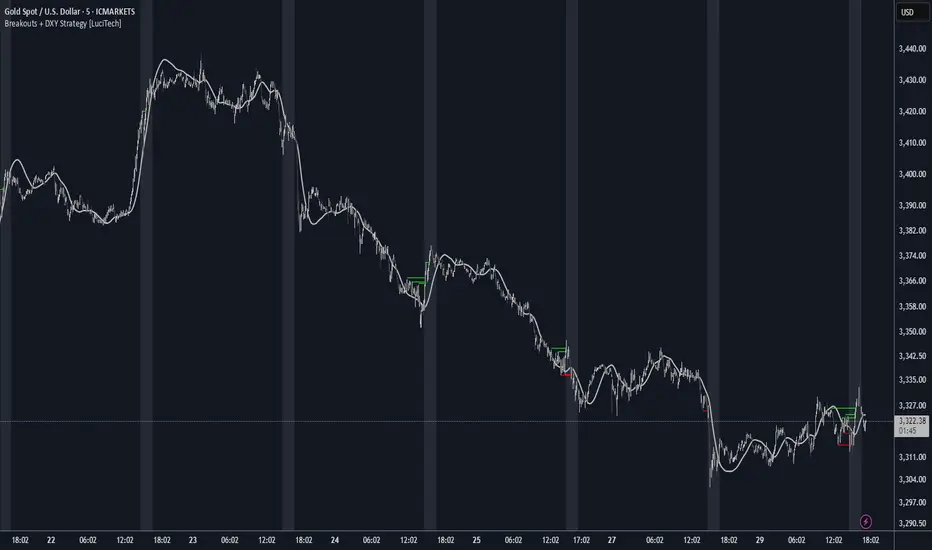
Breakouts With DXY Filter Strategy [LuciTech]This advanced breakout strategy combines pivot-based breakout detection with an innovative DXY (US Dollar Index) inverse correlation filter to enhance trade selection quality. The strategy identifies breakouts from recent pivot highs and lows while using DXY movements as a confirmation filter, based on the principle that USD strength/weakness often inversely correlates with other asset movements.
Key Features
Core Breakout Logic
- Pivot-Based Detection: Identifies breakouts above recent pivot highs (bullish) and below recent pivot lows (bearish)
- Customizable Lookback: Adjustable pivot length for different market conditions
- Visual Breakout Lines: Optional display of breakout levels with customizable colors
DXY Inverse Correlation Filter
- Smart USD Filter: Uses DXY movements to confirm breakout signals
- Inverse Logic: Long signals require DXY bearishness, short signals require DXY bullishness
- Threshold Control: Minimum DXY movement percentage required for signal confirmation
- Real-time DXY Data: Pulls live DXY data for accurate correlation analysis
Moving Average Filter
- Multiple MA Types: Support for SMA, EMA, WMA, VWMA, and HMA
- Trend Confirmation: Only takes trades in the direction of the selected moving average
- Customizable Parameters: Adjustable length and source for the moving average
Advanced Risk Management
- Multiple Stop Loss Types:
- ATR-based stops with customizable multiplier
- Candle-based stops using previous candle levels
- Fixed point-based stops
- Risk-Reward Optimization: Configurable risk-reward ratios (1:1 to 1:10)
- Breakeven Function: Automatic stop loss adjustment to breakeven after specified R-multiple
- Position Sizing: Percentage-based risk management with automatic position calculation
Time-Based Trading
- Session Filter: Trade only during specified time windows
- London Time Zone: Uses Europe/London timezone for consistency
- Visual Session Highlighting: Optional background fill for active trading hours
Alert System
- Webhook Integration: JSON-formatted alerts for automated trading
- Telegram Support: Pre-formatted messages for Telegram bot integration
- Multiple Formats: Standard, Telegram, and Concise Telegram alert options
- Real-time Notifications: Instant alerts on breakout signals
How It Works
1. Breakout Detection: The script continuously monitors for closes above recent pivot highs or below recent pivot lows
2. DXY Confirmation: When a breakout occurs, the script checks if DXY is moving in the opposite direction with sufficient momentum
3. MA Filter: If enabled, ensures the breakout aligns with the overall trend direction
4. Time Filter: Validates that the signal occurs within the specified trading hours
5. Risk Calculation: Automatically calculates position size based on the defined risk percentage and stop loss distance
6. Trade Execution: Places trades with predetermined stop loss and take profit levels
Unique Advantages
- Multi-Timeframe Approach: Combines asset-specific breakouts with broader USD market sentiment
- False Breakout Reduction: DXY filter helps eliminate breakouts that lack fundamental backing
- Comprehensive Risk Management: Multiple stop loss methods and automatic position sizing
- High Customization: Extensive parameters for different trading styles and market conditions
- Professional Alert System: Ready for automated trading integration
Strategy Chameleon [theUltimator5]Have you ever looked at an indicator and wondered to yourself "Is this indicator actually profitable?" Well now you can test it out for yourself with the Strategy Chameleon!
Strategy Chameleon is a versatile, signal-agnostic trading strategy designed to adapt to any external indicator or trading system. Like a chameleon changes colors to match its environment, this strategy adapts to match any buy/sell signals you provide, making it the ultimate backtesting and automation tool for traders who want to test multiple strategies without rewriting code.
🎯 Key Features
1) Connects ANY external indicator's buy/sell signals
Works with RSI, MACD, moving averages, custom indicators, or any Pine Script output
Simply connect your indicator's signal output to the strategy inputs
2) Multiple Stop Loss Types:
Percentage-based stops
ATR (Average True Range) dynamic stops
Fixed point stops
3) Advanced Trailing Stop System:
Percentage trailing
ATR-based trailing
Fixed point trailing
4) Flexible Take Profit Options:
Risk:Reward ratio targeting
Percentage-based profits
ATR-based profits
Fixed point profits
5) Trading Direction Control
Long Only - Bull market strategies
Short Only - Bear market strategies
Both - Full market strategies
6) Time-Based Filtering
Optional trading session restrictions
Customize active trading hours
Perfect for day trading strategies
📈 How It Works
Signal Detection: The strategy monitors your connected buy/sell signals
Entry Logic: Executes trades when signals trigger during valid time periods
Risk Management: Automatically applies your chosen stop loss and take profit levels
Trailing System: Dynamically adjusts stops to lock in profits
Performance Tracking: Real-time statistics table showing win rate and performance
⚙️ Setup Instructions
0) Add indicator you want to test, then add the Strategy to your chart
Connect Your Signals:
imgur.com
Go to strategy settings → Signal Sources
1) Set "Buy Signal Source" to your indicator's buy output
2) Set "Sell Signal Source" to your indicator's sell output
3) Choose table position - This simply changes the table location on the screen
4) Set trading direction preference - Buy only? Sell only? Both directions?
imgur.com
5) Set your preferred stop loss type and level
You can set the stop loss to be either percentage based or ATR and fully configurable.
6) Enable trailing stops if desired
imgur.com
7) Configure take profit settings
8) Toggle time filter to only consider specific time windows or trading sessions.
🚀 Use Cases
Test various indicators to determine feasibility and/or profitability.
Compare different signal sources quickly
Validate trading ideas with consistent risk management
Portfolio Management
Apply uniform risk management across different strategies
Standardize stop loss and take profit rules
Monitor performance consistently
Automation Ready
Built-in alert conditions for automated trading
Compatible with trading bots and webhooks
Easy integration with external systems
⚠️ Important Notes
This strategy requires external signals to function
Default settings use 10% of equity per trade
Pyramiding is disabled (one position at a time)
Strategy calculates on bar close, not every tick
🔗 Integration Examples
Works perfectly with:
RSI strategies (connect RSI > 70 for sells, RSI < 30 for buys)
Moving average crossovers
MACD signal line crosses
Bollinger Band strategies
Custom oscillators and indicators
Multi-timeframe strategies
📋 Default Settings
Position Size: 10% of equity
Stop Loss: 2% percentage-based
Trailing Stop: 1.5% percentage-based (enabled)
Take Profit: Disabled (optional)
Trade Direction: Both long and short
Time Filter: Disabled

Strategi FVG 09:31 (Pro)FVG 09:31 Strategy (Pro)
In short, this is an automated trading strategy (bot) for TradingView designed to execute buy or sell orders based on a Fair Value Gap (FVG) pattern. The strategy is highly specific, as it only triggers on the 1-minute timeframe and looks for an FVG that forms precisely at 09:32 AM New York time.
Main Purpose of the Strategy
The primary goal of this script is to identify and capitalize on short-term price imbalances, known as Fair Value Gaps (FVGs). It operates during a specific, high-volatility window right after the U.S. stock market opens, often referred to by traders as the "Silver Bullet" session. By automating the detection and execution, it aims to trade these fleeting opportunities with precision.
How the Strategy Works
The strategy follows a clear, step-by-step logical flow on your chart.
1. Time & Timeframe Restriction
1-Minute Timeframe: The strategy is hard-coded to work only on the 1-minute (1m) chart. A warning label will appear on your chart if you apply it to any other timeframe.
Specific Time Window: The core logic activates only between 09:32 and 09:33 AM New York time. It searches for an FVG pattern formed by the three candles from 09:29, 09:30, and 09:31, with the pattern confirmation happening on the close of the 09:31 candle.
2. Fair Value Gap (FVG) Detection
An FVG is a three-candle pattern that signals a price imbalance.
Bullish FVG (Potential Buy): Occurs when the low of the first candle is higher than the high of the third candle. The space between these two prices is the FVG zone.
Bearish FVG (Potential Sell): Occurs when the high of the first candle is lower than the low of the third candle. The space between these two prices is the FVG zone.
If this pattern is detected at the target time, the strategy draws a colored box on the chart to visualize the FVG zone (aqua for bullish, fuchsia for bearish).
3. Entry Logic
The strategy provides two user-selectable methods for entering a trade:
Retracement (Immediate Entry): The strategy will open a position with a market order as soon as the price retraces back into the identified FVG zone.
For a Bullish FVG, a Long (buy) position is opened when the price drops to touch the upper boundary of the FVG.
For a Bearish FVG, a Short (sell) position is opened when the price rises to touch the lower boundary of the FVG.
Limit Order (Pending Entry): The strategy places a pending limit order at the edge of the FVG zone.
For a Bullish FVG, a Buy Limit order is placed at the upper boundary of the FVG.
For a Bearish FVG, a Sell Limit order is placed at the lower boundary of the FVG.
Order Expiration: If the limit order is not filled within a specified number of candles (default is 15), it is automatically canceled to avoid chasing a stale setup.
4. Exit Logic
Once a position is active, the strategy automatically manages the exit by setting a Take Profit (TP) and Stop Loss (SL) level. You can choose between two types:
Ticks (Fixed Points): You define a fixed profit target and loss limit in ticks (the smallest price movement). For example, a 200-tick TP and a 100-tick SL.
Last Swing (Dynamic Levels): The TP and SL are set dynamically based on the most recent swing high or swing low.
For a Long position: Take Profit is set at the last swing high; Stop Loss is at the last swing low.
For a Short position: Take Profit is set at the last swing low; Stop Loss is at the last swing high.
5. Daily Management
At the start of each new trading day, the script performs a reset. All variables, including any FVG data from the previous day, are cleared. This ensures the strategy only acts on fresh signals from the current day and cancels any pending orders from the day before.
Explanation of Settings (Inputs)
Here is what each user-configurable setting does:
Entry Type: Choose your preferred entry method: Retracement or Limit Order.
Order Expiration (Candles): Applies only to the Limit Order type. Sets how many candles an unfilled order will remain active before being canceled.
Stop Loss Type: Choose Ticks for a fixed-distance stop loss or Last Swing for a dynamic level.
Take Profit Type: Choose Ticks for a fixed-distance profit target or Last Swing for a dynamic level.
Pivot Lookback (SL/TP Swing): Defines how many candles the script looks back to identify the most recent swing high/low for the Last Swing SL/TP type.
Contract Size: The quantity or lot size for each trade.
Take Profit (in Ticks): The profit target distance if using the Ticks type.
Stop Loss (in Ticks): The maximum loss distance if using the Ticks type.

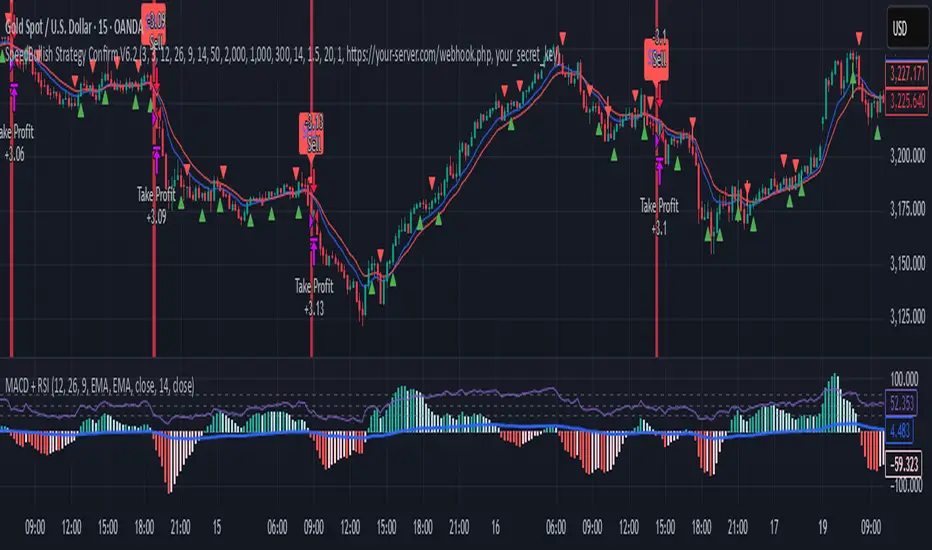
SpeedBullish Strategy Confirm V6.2SpeedBullish Strategy Confirm V6.2
SpeedBullish V6.2 is an advanced price-action + indicator-based strategy designed to confirm trend strength and signal entries with high precision. This version builds on the W/M pattern structure and adds dynamic filtering with EMA, MACD Histogram, RSI, ATR, and Volume.
✅ Signal Conditions
🔹 Buy Signal:
Price above EMA10 or EMA15
MACD Histogram crosses above 0
RSI > 50
(Optional) Higher low via Pivot Low
(Optional) ATR > ATR SMA * Multiplier
(Optional) Volume > SMA * Multiplier
🔻 Sell Signal:
Price below EMA10 or EMA15
MACD Histogram crosses below 0
RSI < 50
(Optional) Lower high via Pivot High
(Optional) Confirmed high volatility and volume
⚙️ Strategy Features
MACD Histogram for momentum shift detection
RSI filtering for momentum confirmation
EMA10/15 for trend direction
ATR-based volatility filter
Volume confirmation filter
Dynamic TP/SL + Trailing Stop
Webhook Integration for MT5 auto-trade
Visual signal markers + background highlight
🔔 Alerts
Alerts are sent in JSON format via alert() with the current symbol, action (buy/sell), and price. Webhook endpoint and secret key are configurable.
📈 How to Use
Attach the strategy to any symbol and timeframe
Customize filters and confirmations to fit your market conditions
Enable webhook alerts for integration with your MT5 Expert Advisor or trading bot
Backtest and optimize before live deployment