"bot" için komut dosyalarını ara

EMA Cross Strategy v5 (30 lots) (15 min candle only)- safe flip🚀 EMA Cross Strategy v5 (30 Lots) (15 min candle only)— Safe Flip Edition
Fully Automated | Fast | Reliable | Battle-tested
Welcome to a clean, powerful, and automation-friendly EMA crossover system.
This strategy is built for traders who want consistent trend-based entries without the risk of unwanted pyramiding or doubled positions.
🔥 How It Works
This strategy uses a fast EMA (10) crossing a slow EMA (20) to detect trend shifts:
Bullish Crossover → LONG (30 lots)
Bearish Crossover → SHORT (30 lots)
Every opposite signal safely flips the position by first closing the current trade, then opening a fresh position of exactly 30 lots.
No doubling.
No runaway position size.
No surprises.
Just clean, mechanical trend-following.
📈 Why This Strategy Stands Out
Unlike basic EMA crossbots, this version:
✔ Prevents unintended pyramiding
✔ Never over-allocates capital
✔ Works perfectly with webhook-based automation
✔ Produces stable, systematic entries
✔ Executes directional flips with precision
🔍 Backtest Highlights (1-Year)
(Backtests will vary by instrument/timeframe)
1,500+ trades executed
Profit factor above 1.27
Strong trend performance
Balanced long/short behavior
No margin calls
Consistent trade execution
This strategy thrives in trending markets and maintains strict discipline even in choppy conditions.
⚙️ Automation Ready
Designed for automated execution via webhook and API setups on supported platforms.
Just connect, run, and let the bot follow the rules without hesitation.
No emotions.
No overtrading.
No fear or greed.
Pure logic.

BTC EMA 5-9 Flip Strategy AutobotThis strategy is designed for fast and accurate trend-following trades on Bitcoin.
It uses a crossover between EMA 5 and EMA 9 to detect instant trend reversals and automatically flips between Long and Short positions.
How the strategy works
EMA 5 crossing above EMA 9 → Long
EMA 5 crossing below EMA 9 → Short
Automatically closes the opposite trade during a flip
Executes trades only on candle close
Prevents double entries with internal position-state logic
Fully compatible with automated trading via webhooks (Delta Exchange)
Why this strategy works
EMA 5–9 is extremely responsive for BTC’s volatility
Captures trend reversals early
Works best on 15-minute timeframe
Clean, simple logic without over-filtering reduces missed opportunities
Performs well in both uptrends and downtrends
Automation Ready
This strategy includes alert conditions and webhook-ready JSON for automated execution.
This is a fast-reacting BTC bot designed for intraday and swing crypto trend trading.

Moving Average Band StrategyOverview
The Moving Average Band Strategy is a fully customizable breakout and trend-continuation system designed for traders who need both simplicity and control.
The strategy creates adaptive bands around a user-selected moving average and executes trades when price breaks out of these bands, with advanced risk-management settings including optional Risk:Reward targets.
This script is suitable for intraday, swing, and positional traders across all markets — equities, futures, crypto, and forex.
Key Features
✔ Six Moving Average Types
Choose the MA that best matches your trading style:
SMA
EMA
WMA
HMA
VWMA
RMA
✔ Dynamic Bands
Upper Band built from MA of highs
Lower Band built from MA of lows
Adjustable band offset (%)
Color-coded band fill indicating price position
✔ Configurable Strategy Preferences
Toggle Long and/or Short trades
Toggle Risk:Reward Take-Profit
Adjustable Risk:Reward Ratio
Default position sizing: % of equity (configurable via strategy settings)
Entry Conditions
Long Entry
A long trade triggers when:
Price crosses above the Upper Band
Long trades are enabled
No existing long position is active
Short Entry
A short trade triggers when:
Price crosses below the Lower Band
Short trades are enabled
No existing short position is active
Clear entry markers and price labels appear on the chart.
Risk Management
This strategy includes a complete set of risk-controls:
Stop-Loss (Fixed at Entry)
Long SL: Lower Band
Short SL: Upper Band
These levels remain constant for the entire trade.
Optional Risk:Reward Take-Profit
Enabled/disabled using a toggle switch.
When enabled:
Long TP = Entry + (Risk × Risk:Reward Ratio)
Short TP = Entry – (Risk × Risk:Reward Ratio)
When disabled:
Exits are handled by reverse crossover signals.
Exit Conditions
Long Exit
Stop-Loss Hit (touch-based)
Take-Profit Hit (if enabled)
Reverse Band Crossover (if TP disabled)
Short Exit
Stop-Loss Hit (touch-based)
Take-Profit Hit (if enabled)
Reverse Band Crossover (if TP disabled)
Exit markers and price labels are plotted automatically.
Visual Tools
To improve clarity:
Upper & Lower Band (blue, adjustable width)
Middle Line
Dynamic band fill (green/red/yellow)
SL & TP line plotting when in position
Entry/Exit markers
Price labels for all executed trades
These are built to help users visually follow the strategy logic.
Alerts Included
Every trading event is covered:
Long Entry
Short Entry
Long SL / TP / Cross Exit
Short SL / TP / Cross Exit
Combined Alert for webhook/automation (JSON-formatted)
Perfect for algo trading, Discord bots, or automation platforms.
Best For
This strategy performs best in:
Trending markets
Breakout environments
High-momentum instruments
Clean intraday swings
Works seamlessly on:
Stocks
Index futures
Commodities
Crypto
Forex
⚠️ Important Disclaimer
This script is for educational purposes only.
Trading involves risk. Backtest results are not indicative of future performance.
Always validate settings and use proper position sizing.

Qullamagi EMA Breakout Autotrade (Crypto Futures L+S)Title: Qullamagi EMA Breakout – Crypto Autotrade
Overview
A crypto-focused, Qullamagi-style EMA breakout strategy built for autotrading on futures and perpetual swaps.
It combines a 5-MA trend stack (EMA 10/20, SMA 50/100/200), volatility contraction boxes, volume spikes and an optional higher-timeframe 200-MA filter. The script supports both long and short trades, partial take profit, trailing MA exits and percent-of-equity position sizing for automated crypto futures trading.
Key Features (Crypto)
Qullamagi MA Breakout Engine – trades only when price is aligned with a strong EMA/SMA trend and breaks out of a tight consolidation range. Longs use: Close > EMA10 > EMA20 > SMA50 > SMA100 > SMA200. Shorts are the mirror condition with all MAs sloping in the trend direction.
Strict vs Loose Modes – Strict (Daily) is designed for cleaner swing trades on 1H–4H (full MA stack, box+ATR and volume filters, optional HTF filter). Loose (Intraday) focuses on 10/20/50 alignment with relaxed filters for more frequent 15m–30m signals.
Volatility & Volume Filters for Crypto – ATR-based box height limit to detect volatility contraction, wide-candle filter to avoid chasing exhausted breakouts, and a volume spike condition requiring current volume to exceed an SMA of volume.
Higher-Timeframe Trend Filter (Optional) – uses a 200-period SMA on a higher timeframe (default: 1D). Longs only when HTF close is above the HTF 200-SMA, shorts only when it is below, helping avoid trading against dominant crypto trends.
Autotrade-Oriented Trade Management – position size as % of equity, initial stop anchored to a chosen MA (EMA10 / EMA20 / SMA50) with optional buffer, partial take profit at a configurable R-multiple, trailing MA exit for the remainder, and an optional cooldown after a full exit.
Markets & Timeframes
Best suited for BTC, ETH and major altcoin futures/perpetuals (Binance, Bybit, OKX, etc.).
Strict preset: 1H–4H charts for classic Qullamagi-style trend structure and fewer fake breakouts.
Loose preset: 15m–30m charts for higher trade frequency and more active intraday trading.
Always retune ATR length, box length, volume multiplier and position size for each symbol and exchange.
Strategy Logic (Quick Summary)
Long (Strict): MA stack in bullish alignment with all MAs sloping up → tight volatility box (ATR-based) → volume spike above SMA(volume) × multiplier → breakout above box high (close or intrabar) → optional HTF close above 200-SMA.
Short: Mirror logic: bearish MA stack, tight box, volume spike and breakdown below box low with optional HTF downtrend.
Best Practices for Crypto
Backtest on each symbol and timeframe you plan to autotrade, including commissions and slippage.
Start on higher timeframes (1H/4H) to learn the behavior, then move to 15m–30m if you want more signals.
Use the higher-timeframe filter when markets are strongly trending to reduce counter-trend trades.
Keep position-size percentage conservative until you fully understand the drawdowns.
Forward-test / paper trade before connecting to live futures accounts.
Webhook / Autotrade Integration
Designed to work with TradingView webhooks and external crypto trading bots.
Alert messages include structured fields such as: EVENT=ENTRY / SCALE_OUT / EXIT, SIDE=LONG / SHORT, STRATEGY=Qullamagi_MA.
Map each EVENT + SIDE combination to your bot logic (open long/short, partial close, full close, etc.) on your preferred exchange.
Important Notes & Disclaimer
Crypto markets are highly volatile and can change regime quickly. Backtest and forward-test thoroughly before using real capital. Higher timeframes generally produce cleaner MA structures and fewer fake breakouts.
This strategy is for educational and informational purposes only and does not constitute financial advice. Trading leveraged crypto products involves substantial risk of loss. Always do your own research, manage risk carefully, and never trade with money you cannot afford to lose.

NQ Scalping WMAThis indicator plots two Weighted Moving Averages (WMAs) derived from the high and close to visualize short-term momentum extremes on NQ (Nasdaq futures). I built it for myself for scalping reversals on the 1-minute timeframe.
The area between the upper WMA (“Top-Source”) and lower WMA (“Bot-Source”) is filled with contextual color: green when price is above the top WMA, red when price is below the bottom WMA, and neutral gray otherwise. This makes it easy to spot overextensions, potential snap-back zones, and quick mean-reversion opportunities. Inputs include WMA length, line color, and separate sources for top/bottom WMAs, allowing fast tuning for changing intraday volatility.
The original code I used to make this is from PlayBit EMA by FFriZz

Relative Performance Binary FilterDescription:
This indicator monitors the relative performance of 30 selected crypto assets and generates a binary signal for each: 1 if the asset’s price has increased above a user-defined threshold over a specified lookback period, 0 otherwise. The script produces a JSON-formatted output suitable for webhooks, allowing you to send the signals to external applications like Google Sheets.
Key Features:
Configurable lookback period, price source, and performance threshold.
Supports confirmed or real-time bar data.
Monitors 30 crypto assets simultaneously.
Produces a one-line JSON output with batch grouping for easy webhook integration.
Includes an optional visual sum plot showing how many assets are above the threshold at any time.
Use Cases:
Automate performance tracking across multiple crypto assets.
Feed binary signals into external dashboards, trading bots, or Google Sheets.
Quickly identify which assets are outperforming a set threshold.

Multi EMA + Indicators + Mini-Dashboard + Reversals v6📘 Multi EMA + Indicators + Mini-Dashboard + Reversals v6
🧩 Overview
This indicator is a multi-EMA setup that combines trend, momentum, and reversal analysis in a single visual framework.
It integrates four exponential moving averages (EMAs), key oscillators (RSI, MACD, Stochastic, CCI), volatility filtering (ATR), and a dynamic mini-dashboard that summarizes all signals in real time.
Its purpose is to help traders visually confirm trend alignment, filter valid entries, and identify possible trend continuation or reversal points.
It can display buy/sell arrows, detect reversal candles, and issue alerts when trading conditions are met.
⚙️ Core Components
1. Moving Averages (EMA Setup)
EMA1 (fast) and EMA2 (medium) define the short-term trend and trigger bias.
When the price is above both EMAs → bullish bias.
When below → bearish bias.
EMA3 and EMA4 act as trend filters. Their slopes (up or down) confirm overall momentum and help validate signals.
Each EMA has customizable lengths, sources, and colors for up/down trends.
This “EMA stack” is the foundation of the setup — a structured trend-following framework that adapts to market speed and volatility.
2. Momentum and Confirmation Filters
Each indicator can be individually enabled or disabled for flexibility.
RSI: confirms direction (above/below 50).
MACD: detects momentum crossover (MACD > Signal for bullish confirmation).
Stochastic: identifies trend continuation (K > D for longs, K < D for shorts).
CCI: adds trend bias above/below a threshold.
ATR Filter: filters out small, low-volatility candles to reduce noise.
You can activate only the filters that fit your trading plan — for instance, trend traders often use RSI and MACD, while scalpers may rely on Stochastic and ATR.
3. Reversal Detection
The indicator includes an optional Reversal Section that independently detects potential turning points.
It combines multiple configurable criteria:
Candlestick patterns (Bullish Hammer, Shooting Star).
Large Candle filter — detects unusually large bars (relative to close).
Price-to-EMA distance — identifies overextended moves that might revert.
RSI Divergence — detects potential momentum shifts.
RSI Overbought/Oversold zones (70/30 by default).
Doji Candles — sign of indecision.
A bullish or bearish reversal signal appears when enough selected criteria are met.
All sub-modules can be toggled on/off individually, giving you full control over sensitivity.
4. Signal Logic
Buy and sell signals are triggered when EMA alignment and the chosen confirmations agree:
Buy Signal
→ Price above EMA1 & EMA2
→ Confirmations (RSI/MACD/Stoch/CCI/ATR) pass
→ Trend filters (EMA3/EMA4) point upward
Sell Signal
→ Price below EMA1 & EMA2
→ Confirmations align bearishly
→ Trend filters (EMA3/EMA4) slope downward
Reversal signals can appear independently, even against the current EMA trend, depending on your settings.
5. Visual Dashboard
A mini-dashboard appears near the chart showing:
Current trade bias (LONG / SHORT / NEUTRAL)
EMA3 and EMA4 trend directions (↑ / ↓)
Quick visual bars (🟩 / 🟥) for each filter: RSI, MACD, Stoch, ATR, CCI, EMA filters
Reversal criteria status (Doji, RSI divergence, candle size, etc.)
This panel gives you a compact overview of all indicator states at a glance.
The color of the panel changes dynamically — green for bullish, red for bearish, gray for neutral.
6. Alerts
Built-in alerts allow automation or notifications:
Buy Alert
Sell Alert
Reversal Buy
Reversal Sell
You can connect these alerts to TradingView notifications or external bots for semi-automated execution.
💡 How to Use
✅ Trend-Following Setup
Focus on trades in the direction of EMA1 & EMA2.
Confirm with EMA3 & EMA4 trending in the same direction.
Use RSI/MACD/Stoch filters to ensure momentum supports the trade.
Avoid entries when ATR filter indicates low volatility.
🔄 Reversal Setup
Enable the Reversal section for potential tops/bottoms.
Look for reversal buy signals near support zones or after strong downtrends.
Use RSI divergence or Doji + Hammer signals as confirmation.
Combine with key chart areas (supply/demand or previous swing levels).
⚖️ Combination Approach
Trade continuation signals when all EMAs are aligned and filters are green.
Trade reversals only when at a key area (support/resistance) and confirmed by reversal conditions.
Always check higher-timeframe bias before entering a trade.
🧭 Practical Tips
Use different EMA sets for different timeframes:
9/21/50/100 for swing or trend trades.
5/13/34/89 for intraday scalping.
Turn off filters you don’t use to reduce lag.
Always validate signals with price structure, not just indicator alignment.
Practice in replay mode before live trading.
🗺️ Key Chart Confluence (Highly Recommended)
Although the indicator provides structured signals, its best use is in confluence with:
Support and resistance levels
Supply/demand zones
Trendlines and channels
Liquidity pools
Volume clusters
Signals aligned with strong key areas on the chart tend to have greater reliability than isolated indicator triggers.
I use EMA 1 - 20 Open ; EMA 2 - 20 Close ; EMA 3 - 50 ; EMA 4 - 200 or 100 , but that's me...
⚠️ Important Disclaimer
This indicator is a technical tool, not a guarantee of results.
Trading involves risk, and no signal is ever 100% accurate.
Every trader should develop a personal strategy, use proper risk management, and adapt settings to their instrument and timeframe.
Always combine indicator signals with key chart areas, higher-timeframe context, and your own analysis before taking a trade.

Addikro_V1📌 Description – Trend+Entry+Risk Indicator
This indicator combines statistically proven trading concepts into a complete trading framework:
✅ Trend Filter (EMA200)
All trades follow the higher-timeframe trend. Trend direction is clearly visualized.
✅ Entry Signals (you can choose):
EMA Crossover (EMA50 crossing EMA200) — classic trend-following entry
Breakout of recent highs/lows (20-bar range) — optionally only valid after a pullback to EMA50
✅ ATR-Based Risk Management:
Dynamic Stop Loss (SL) and Take Profit (TP1/TP2) levels using ATR
The last entry is saved — SL/TP lines stay visible on the chart
Optional position size suggestion based on % risk of account
✅ Smart Filters for Higher Accuracy:
RSI filter: e.g., only long if RSI > 50
Volume filter: signal only if volume is above SMA × multiplier
✅ Fixed Chart HUD (Table Overlay):
Displays live information anchored to the chart (does not move with candles)
Shows: Trend direction, entry mode, RSI, ATR, SL/TP multiplier, position size suggestion
Position can be set: top-left / top-right / bottom-left / bottom-right
✅ Signals & Alerts:
Visual arrows on the chart for long/short signals
Custom alert conditions included (works with mobile, email, webhook, bots)
🎯 Why this indicator works
It follows the same logic used by many successful systematic and hedge fund strategies:
Trend direction + statistically solid entries + strict risk management → no repainting, no guessing, no emotion.

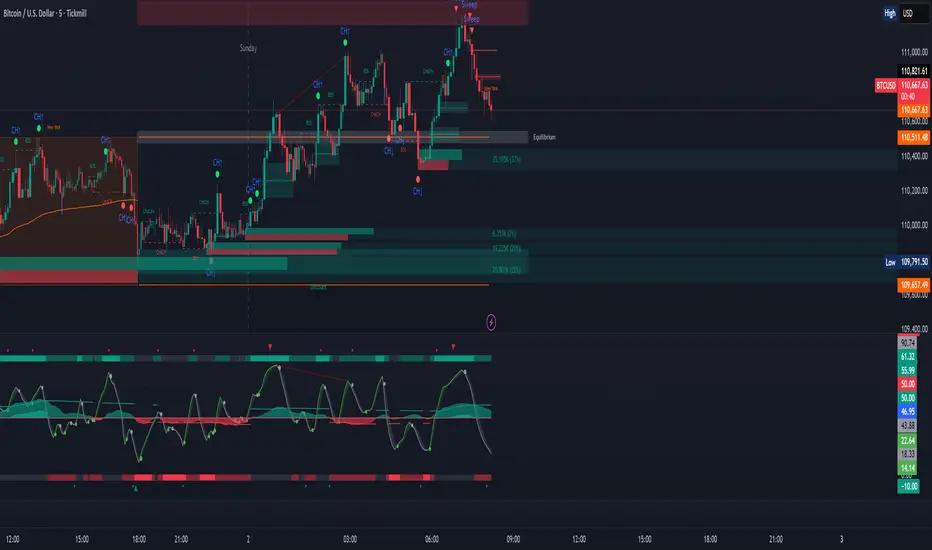
ICT Sweep + CHoCH + FVG Alerts
### 🔥 ICT Sweep + CHoCH + FVG Alerts
Script designed to automate ICT entry confirmations using:
• Liquidity Sweep (Buy/Sell Stops taken)
• Change of Character (CHoCH)
• Fair Value Gap (FVG) confirmation
### ✅ Conditions
**Long signal when:**
1. Bearish liquidity sweep
2. Bullish CHoCH
3. Bullish FVG forms and gets respected
**Short signal when:**
1. Bullish liquidity sweep
2. Bearish CHoCH
3. Bearish FVG forms and gets respected
### 🎯 Purpose
This script helps traders detect smart-money setup entries based on ICT logic and receive alerts in real time.
### 📡 Alerts
Supports webhook automation for bots, signal servers, or trading platforms.
*This script does not place trades automatically, alerts only.*
### ⚠️ Disclaimer
This tool is for educational purposes.
Always backtest and use proper risk management.
Trend Catch STFR - whipsaw Reduced### Summary of the Setup
This trading system combines **SuperTrend** (a trend-following indicator based on ATR for dynamic support/resistance), **Range Filter** (a smoothed median of the last 100 candles to identify price position relative to a baseline), and filters using **VIX Proxy** (a volatility measure: (14-period ATR / 14-period SMA of Close) × 100) and **ADX** (Average Directional Index for trend strength). It's designed for trend trading with volatility safeguards.
- **Entries**: Triggered only in "tradeable" markets (VIX Proxy ≥ 15 OR ADX ≥ 20) when SuperTrend aligns with direction (green for long, red for short), price crosses the Range Filter median accordingly, and you're not already in that position.
- **Exits**: Purely price-based—exit when SuperTrend flips or price crosses back over the Range Filter median. No forced exits from low volatility/trend.
- **No Trade Zone**: Blocks new entries if both VIX Proxy < 15 AND ADX < 20, but doesn't affect open positions.
- **Overall Goal**: Enter trends with confirmed strength/volatility, ride them via price action, and avoid ranging/choppy markets for new trades.
This creates a filtered trend-following strategy that prioritizes quality entries while letting winners run.
### Advantages
- **Reduces Noise in Entries**: The VIX Proxy and ADX filters ensure trades only in volatile or strongly trending conditions, avoiding low-momentum periods that often lead to false signals.
- **Lets Winners Run**: Exits based solely on price reversal (SuperTrend or Range Filter) allow positions to stay open during temporary lulls in volatility/trend, potentially capturing longer moves.
- **Simple and Balanced**: Combines trend (SuperTrend/ADX), range (Filter), and volatility (VIX Proxy) without overcomplicating—easy to backtest and adapt to assets like stocks, forex, or crypto.
- **Adaptable to Markets**: The "OR" logic for VIX/ADX provides flexibility (e.g., enters volatile sideways markets if ADX is low, or steady trends if VIX is low).
- **Risk Control**: Implicitly limits exposure by blocking entries in calm markets, which can preserve capital during uncertainty.
### Disadvantages
- **Whipsaws in Choppy Markets**: As you noted, SuperTrend can flip frequently in ranging conditions, leading to quick entries/exits and small losses, especially if the Range Filter isn't smoothing enough noise.
- **Missed Opportunities**: Strict filters (e.g., requiring VIX ≥ 15 or ADX ≥ 20) might skip early-stage trends or low-volatility grinds, reducing trade frequency and potential profits in quiet bull/bear markets.
- **Lagging Exits**: Relying only on price flips means you might hold losing trades longer if volatility drops without a clear reversal, increasing drawdowns.
- **Parameter Sensitivity**: Values like VIX 15, ADX 20, or Range Filter's 100-candle lookback need tuning per asset/timeframe; poor choices could amplify whipsaws or over-filter.
- **No Built-in Risk Management**: Lacks explicit stops/targets, so it relies on user-added rules (e.g., ATR-based stops), which could lead to oversized losses if not implemented.
### How to Use It
This system can be implemented in platforms like TradingView (via Pine Script), Python (e.g., with TA-Lib or Pandas), or MT4/5. Here's a step-by-step guide, assuming TradingView for simplicity—adapt as needed. (If coding in Python, use libraries like pandas_ta for indicators.)
1. **Set Up Indicators**:
- Add SuperTrend (default: ATR period 10, multiplier 3—adjust as suggested in prior tweaks).
- Create Range Filter: Use a 100-period SMA of (high + low)/2, smoothed (e.g., via EMA if desired).
- Calculate VIX Proxy: Custom script for (ATR(14) / SMA(close, 14)) * 100.
- Add ADX (period 14, standard).
2. **Define Rules in Code/Script**:
- **Long Entry**: If SuperTrend direction < 0 (green), close > RangeFilterMedian, (VIX Proxy ≥ 15 OR ADX ≥ 20), and not already long—buy on bar close.
- **Short Entry**: If SuperTrend direction > 0 (red), close < RangeFilterMedian, (VIX Proxy ≥ 15 OR ADX ≥ 20), and not already short—sell short.
- **Exit Long**: If in long and (SuperTrend > 0 OR close < RangeFilterMedian)—sell.
- **Exit Short**: If in short and (SuperTrend < 0 OR close > RangeFilterMedian)—cover.
- Monitor No Trade Zone visually (e.g., plot yellow background when VIX < 15 AND ADX < 20).
3. **Backtest and Optimize**:
- Use historical data on your asset (e.g., SPY on 1H chart).
- Test metrics: Win rate, profit factor, max drawdown. Adjust thresholds (e.g., ADX to 25) to reduce whipsaws.
- Forward-test on demo account to validate.
4. **Live Trading**:
- Apply to a chart, set alerts for entries/exits.
- Add risk rules: Position size 1-2% of capital, stop-loss at SuperTrend line.
- Monitor manually or automate via bots—avoid overtrading; use on trending assets.
For the adjustments I suggested earlier (e.g., ADX 25, 2-bar confirmation), integrate them into entries only—test one at a time to isolate improvements. If whipsaws persist, combine 2-3 tweaks.

Scalp BTC/ETH — Reversal & Continuation (v1, Pine v6)Scalp BTC/ETH — Reversal & Continuation (1m à 10m)
Cet indicateur détecte des opportunités de micro-scalping sur futures (BTC/ETH) basées sur deux mécaniques courtes validées par structure de prix :
A) Reversal de pression (contre-mouvement contrôlé)
Détection d’une sur-extension brutale suivie d’une absorption sur la bougie suivante.
Objectif : capturer la première respiration après un excès de prix (rejet court).
B) Continuation courte (momentum + reprise)
Détection de 3 bougies directionnelles consécutives suivies d’un pullback léger, puis signal sur la reprise du mouvement initial.
Gestion intégrée (scénario standard TP dynamique)
TP1 → 50% de la position à un gain fixe (% adaptable au timeframe)
Stop déplacé au Break-Even sur le restant
Sortie finale sur bougie inverse significative
(correction ≥ X% du corps précédent) ou timeout (max bars en trade)
Scalp BTC/ETH — Reversal & Continuation (1m to 10m)
This indicator detects short-term futures scalping setups on BTC & ETH using two mechanical price-action models designed for fast execution:
A) Reversal Compression (counter-move entry)
Identifies a sharp impulse (overextension) followed by absorption / failure to extend on the next candle.
Objective: capture the first corrective pullback after exhaustion.
B) Controlled Continuation (momentum follow-through)
Identifies 3 consecutive trend candles, then a shallow pullback, and triggers an entry on the resumption of the main leg.
Built-in trade logic (dynamic TP structure)
TP1 → scale out 50% of the position at a fixed percentage (auto-scaled per timeframe)
Stop moved to Break-Even after TP1
Final exit on either:
• a meaningful opposite candle (≥ X% correction of prior body), or
• a timeout (max bars in trade)
Technical characteristics
Designed for 1m / 3m / 5m / 7m / 10m
No repainting (bar-close confirmed logic)
Works for both LONG & SHORT
Built-in alert events:
ENTRY_LONG / ENTRY_SHORT / TP1 / EXIT_STOP / EXIT_INVERSE / EXIT_TIMEOUT
Suitable for manual execution, semi-automation (alerts) or full bot integration (webhook JSON)
Purpose
Provide a repeatable, rule-based, non-subjective framework to harvest micro-moves with controlled risk, without relying on lagging indicators or long-term prediction.
(A Strategy / backtesting version is planned as a next iteration.)

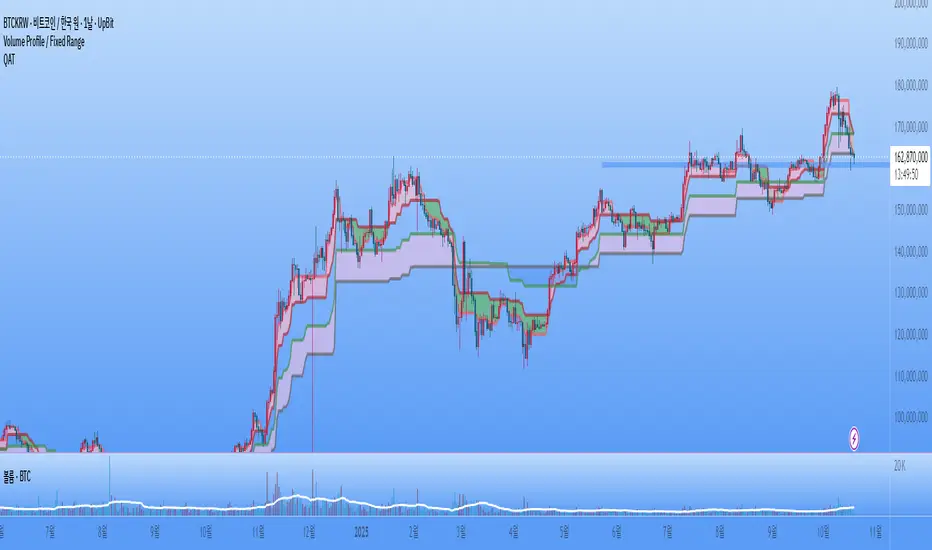
Quadruple AlphaTrendKivancOzbilgi's 'Alpha Trend' indicator has been developed as 'Quadruple Alpha Trend'.
It has been extended to AlphaTrend1,2,3,4, and each line allows users to freely choose colors.
Each of the AT1 to 2 and AT3 to 4 was again color-transformed at the crossing point, respectively.
We believe that the value of AT can compensate a lot for all the shortcomings of a regular moving average.
It can show the support and resistance of the low and high points at each horizontal section and
pressed neck point at the same time
Draw a horizontal line type.
These advantages make it easy to visually break through and collapse support and resistance on the monthly, weekly, and daily charts
It makes it possible to distinguish. I think it's an excellent indicator design by Kivanc Ozbilgi.
The most similar indicator to this one is the "UT BOT", which is close to the moving average in terms of support and resistance
Because it gives a euphemism, the value of "Alpha Trend" as an index that includes horizontal support and resistance
Very highly appreciated. If you have any issues or need to develop further, please leave a note.
Short Only Bot (3Commas Webhook Uyumlu)Short işlem açmaya ce 3commans ile uyumlu hacim odaklı indikatör. halka açık herkes kullanabilir.

Algo Trading Signals - Buy/Sell System# 📊 Algo Trading Signals - Dynamic Buy/Sell System
## 🎯 Overview
**Algo Trading Signals** is a sophisticated intraday trading indicator designed for algorithmic traders and active day traders. This system generates precise buy and sell signals based on a dynamic box breakout strategy with intelligent position management, add-on entries, and automatic target adjustment.
The indicator creates a reference price box during a specified time window (default: 9:15 AM - 9:45 AM IST) and generates high-probability signals when price breaks out of this range with confirmation.
---
## ✨ Key Features
### 📍 **Smart Signal Generation**
- **Primary Entry Signals**: Clear buy/sell signals on confirmed breakouts above/below the reference box
- **Confirmation Bars**: Reduces false signals by requiring multiple bar confirmation before entry
- **Cooldown System**: Prevents overtrading with configurable cooldown periods between trades
- **Add-On Positions**: Automatically identifies optimal pullback entries for scaling into positions
### 📦 **Dynamic Reference Box**
- Creates a high/low range during your chosen time window
- Automatically updates after each successful trade
- Visual box display with color-coded boundaries (red=resistance, green=support)
- Mid-level reference line for market structure analysis
### 🎯 **Intelligent Position Management**
- **Automatic Target Calculation**: Sets profit targets based on average move distance
- **Add-On System**: Up to 3 additional entries on optimal pullbacks
- **Position Tracking**: Monitors active trades and remaining add-on capacity
- **Auto Box Shift**: Adjusts reference box after target hits for continued trading
### 📊 **Visual Clarity**
- **Color-Coded Labels**:
- 🟢 Green for BUY signals
- 🔴 Red for SELL signals
- 🔵 Blue for ADD-ON buys
- 🟠 Orange for ADD-ON sells
- ✓ Yellow for Target hits
- **TP Level Lines**: Dotted lines showing current profit targets
- **Hover Tooltips**: Detailed information on entry prices, targets, and add-on numbers
### 📈 **Real-Time Statistics**
Live performance dashboard showing:
- Total buy and sell signals generated
- Number of add-on positions taken
- Take profit hits achieved
- Current trade status (LONG/SHORT/None)
- Cooldown timer status
### 🔔 **Comprehensive Alerts**
Built-in alert conditions for:
- Primary buy entry signals
- Primary sell entry signals
- Add-on buy positions
- Add-on sell positions
- Buy take profit hits
- Sell take profit hits
---
## 🛠️ Configuration Options
### **Time Settings**
- **Box Start Hour/Minute**: Define when to begin tracking the reference range
- **Box End Hour/Minute**: Define when to lock the reference box
- **Default**: 9:15 AM - 9:45 AM (IST) - Perfect for Indian market opening range
### **Trade Settings**
- **Target Points (TP)**: Average move distance for profit targets (default: 40 points)
- **Breakout Confirmation Bars**: Number of bars to confirm breakout (default: 2)
- **Cooldown After Trade**: Bars to wait after closing position (default: 3)
- **Add-On Distance Points**: Minimum pullback for add-on entry (default: 40 points)
- **Max Add-On Positions**: Maximum additional positions allowed (default: 3)
### **Display Options**
- Toggle buy/sell signal labels
- Show/hide trading box visualization
- Show/hide TP level lines
- Show/hide statistics table
---
## 💡 How It Works
### **Phase 1: Box Formation (9:15 AM - 9:45 AM)**
The indicator tracks the high and low prices during your specified time window to create a reference box representing the opening range.
### **Phase 2: Breakout Detection**
After the box is locked, the system monitors for:
- **Bullish Breakout**: Price closes above box high for confirmation bars
- **Bearish Breakout**: Price closes below box low for confirmation bars
### **Phase 3: Signal Generation**
When confirmation requirements are met:
- Entry signal is generated with clear visual label
- Target price is calculated (Entry ± Target Points)
- Position tracking activates
- Cooldown timer starts
### **Phase 4: Position Management**
During active trade:
- **Add-On Logic**: If price pulls back by specified distance but stays within favorable range, additional entry signal fires
- **Target Monitoring**: Continuously checks if price reaches TP level
- **Box Adjustment**: After TP hit, box automatically shifts to new range for next opportunity
### **Phase 5: Trade Exit & Reset**
On target hit:
- Position closes with TP marker
- Statistics update
- Box repositions for next setup
- Cooldown activates
- System ready for next signal
---
## 📌 Best Use Cases
### **Ideal For:**
- ✅ Intraday breakout trading strategies
- ✅ Algorithmic trading systems (via alerts/webhooks)
- ✅ Opening range breakout (ORB) strategies
- ✅ Index futures (Nifty, Bank Nifty, Sensex)
- ✅ High-liquidity stocks with clear ranges
- ✅ Automated trading bots
- ✅ Scalping and day trading
### **Markets:**
- Indian Stock Market (NSE/BSE)
- Futures & Options
- Forex pairs
- Cryptocurrency (adjust timing for 24/7 markets)
- Global indices
---
## ⚙️ Integration with Algo Trading
This indicator is **algo-ready** and can be integrated with automated trading systems:
1. **TradingView Alerts**: Set up alert conditions for each signal type
2. **Webhook Integration**: Connect alerts to trading platforms via webhooks
3. **API Automation**: Use with brokers supporting TradingView integration (Zerodha, Upstox, Interactive Brokers, etc.)
4. **Signal Data Access**: All signals are plotted for external data retrieval
---
## 📖 Quick Start Guide
1. **Add Indicator**: Apply to your chart (works best on 1-5 minute timeframes)
2. **Configure Time Window**: Set your desired box formation period
3. **Adjust Parameters**: Tune confirmation bars, targets, and add-on settings to your trading style
4. **Set Alerts**: Create alert conditions for automated notifications
5. **Backtest**: Review historical signals to validate strategy performance
6. **Go Live**: Enable alerts and start receiving real-time trading signals
---
## ⚠️ Risk Disclaimer
This indicator is a **tool for analysis** and does not guarantee profits. Trading involves substantial risk of loss. Always:
- Use proper position sizing
- Implement stop losses (not included in this indicator)
- Test thoroughly before live trading
- Understand market conditions
- Never risk more than you can afford to lose
- Consider your risk tolerance and trading experience
**Past performance does not indicate future results.**
## 🔄 Version History
**v1.0** - Initial Release
- Dynamic box formation system
- Confirmed breakout signals
- Add-on position management
- Visual signal labels and statistics
- Comprehensive alert system
- Auto-adjusting target boxes
---
## 📞 Support & Feedback
If you find this indicator helpful:
- ⭐ Please leave a like/favorite
- 💬 Share your feedback in comments
- 📊 Share your results and improvements
- 🤝 Suggest features for future updates
---
## 🏷️ Tags
`breakout` `daytrading` `signals` `algo` `automated` `intraday` `ORB` `opening-range` `buy-sell` `scalping` `futures` `nifty` `banknifty` `algorithmic` `box-strategy`
*Remember: The best indicator is combined with proper risk management and trading discipline.* Use it at your own rist, not as financial advie

Long‑only Swing/ScalpThis is a basic scalper stategy for algos or crypto bots, tested on BNB, not the best backtest but you can tweak and get better results. Take profit at 1% and Sl at 2% , adjust those settings first to see different back test resutls.

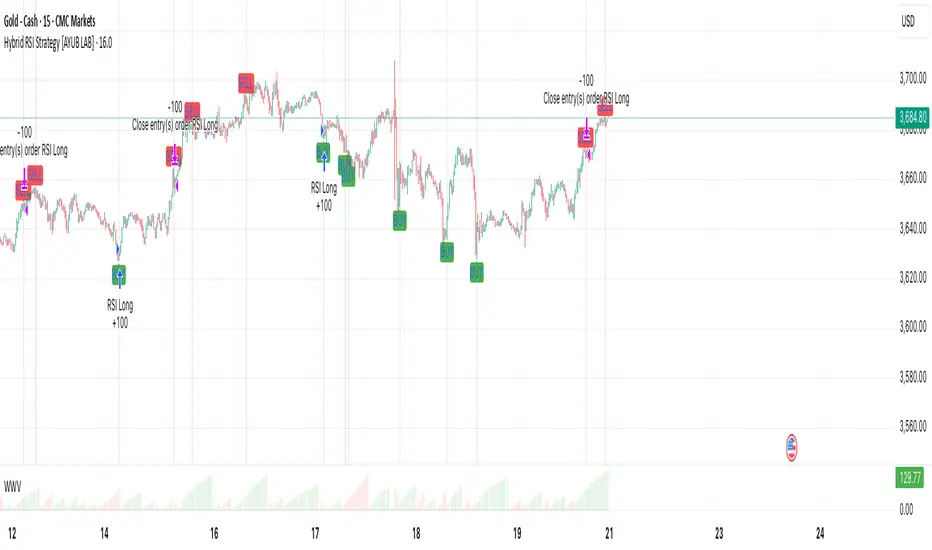
Hybrid RSI Strategy [Heifereum ]This is a hybrid script that combines visual RSI indicator signals with an optional backtestable trading strategy.
BUY Entry: When RSI crosses above the oversold level (default 30)
SELL Exit: When RSI crosses below the overbought level (default 70)
Timeframe: Works best on trending assets (crypto, forex, indices) in 5min to 1H
Backtest Toggle: Turn ON/OFF live testing using the Enable Backtest Mode? setting
Visual Cues: Buy/Sell labels, background coloring, and alerts ready for webhook automation
Use this strategy to visually explore RSI dynamics, run performance backtests, or hook up to external bots via alerts.
Big Gong Reminder Assistant 大的要来小助手我是大的要来了小助手,我负责提醒大家大的要来了
I’m the Gong Reminder bot—here to alert everyone when the big gong is coming.
Ravi AlgoBot📌 Indicator Description (Publish Notes)
Indicator Name:
EoR / EoS Entry & SL/Target Manager (Put=Red, Call=Green)
Purpose:
यह indicator उन traders के लिए बनाया गया है जो अपनी manual levels (EoR, EoR+1 for Put, और EoS, EoS-1 for Call) को chart पर plot करना चाहते हैं और उनके आधार पर Entry, Stop Loss और Target manage करना चाहते हैं।
How it works:
आप manual prices (EoR, EoR+1, EoS, EoS-1) input fields में डालेंगे।
Put levels (EoR, EoR+1) लाल रंग में दिखेंगे।
Call levels (EoS, EoS-1) हरे रंग में दिखेंगे।
हर price पर chart पर horizontal line + label बनेगा।
आप अपने Stop Loss और Target prices भी manual डाल सकते हैं (Call और Put दोनों के लिए अलग-अलग)।
जब भी price किसी entry/SL/Target level को touch करेगा:
Chart पर signal shape बनेगा (triangle)
एक alertcondition trigger होगा।
आप TradingView में Alerts create करके इन alerts को webhook URL से connect कर सकते हैं।
Example: जब EoR Put level touch हो → webhook के ज़रिए broker/bot में auto order लग जाएगा।
SL और Target levels भी इसी तरह alerts से manage होंगे।
Use Case:
Manual level-based intraday या positional trading
Automated trading setup (via TradingView alerts → Webhook → Broker API)
Put/Call entry, target, SL को clearly visualize और monitor करना
Disclaimer:
यह indicator trading automation tool नहीं है। Actual buy/sell orders Pine Script से नहीं लग सकते। Order execution केवल TradingView Alerts और external webhook के integration से ही possible है। कृपया पहले paper-trade और test करें।

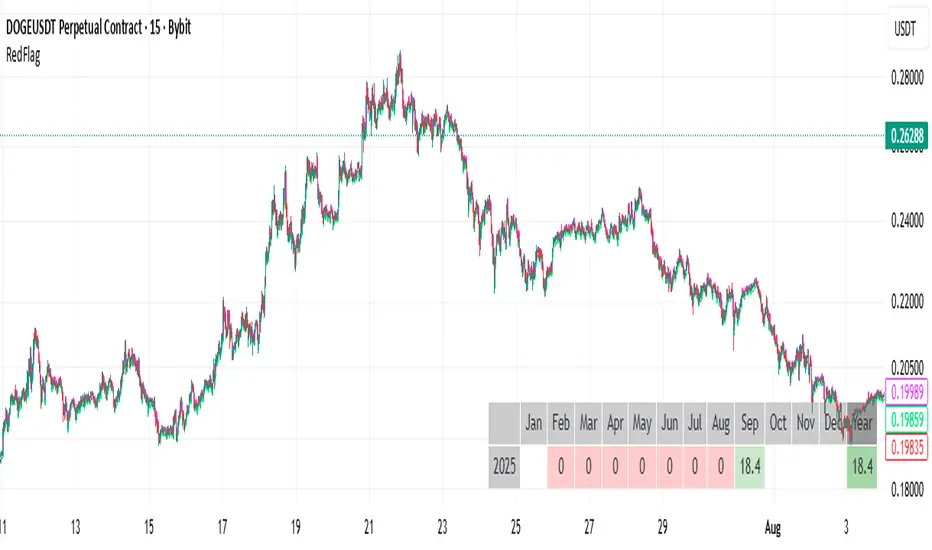
RedFlagCounter-trend strategy
Condition to open a long position:
Buys if the price drops by a specified percentage from the previous candle’s close. Only one purchase can be made within a single candle.
Condition to close a position:
Places a separate individual closing limit order for each purchase, or uses one common take-profit order for the whole position.
⚠️ Attention : Stop-loss is not implemented in the current first version of the strategy.
Options description:
Drop_percent , % — Percentage drop in price from the From point
From — The reference point on the closed candle from which the Drop_percent is calculated (Open, Close, High, Low)
Tp , % — Take-profit level as a percentage
Count — Number of allowed additional purchases (scaling in)
Each_tp — Mode switch:
True — a separate take-profit is placed for each purchase
False — one common take-profit is placed based on the average entry price of the position
All-In-One MA Stack ScalperWhat is this Indicator?
This tool is an advanced, multi-layered breakout and trend-following indicator designed for lower timeframes. It identifies high-conviction buy and sell signals by combining moving average stacking with a suite of professional-grade filters.
How Does It Work?
A signal is generated only when ALL of the following conditions are met:
Moving Average Stack (5M Chart):
Buy: The close price is above all five moving averages (MAs: 100, 48, 36, 24, 12).
Sell: The close price is below all five MAs.
Volatility Filter (ATR):
Signals only print when the current ATR (14) is at least 80% of its 100-period average, ensuring you only trade in actively moving markets.
Candle Structure Filter:
The current candle must have a real body that is at least 35% of the candle’s total range, filtering out dojis and indecision bars.
Big Candle Filter:
The candle’s total range must be at least 40% of the current ATR, avoiding signals on minor, insignificant moves.
Volume Filter:
The current volume must be at least 80% of its 50-period average, filtering out signals during illiquid or quiet market conditions.
Minimum Distance from All MAs:
Price must be a minimum distance (20% ATR) away from each MA, confirming a clean breakout and avoiding signals in tight MA clusters or ranging markets.
RSI Momentum Filter:
Buy: RSI(14) must be greater than 55.
Sell: RSI(14) must be less than 45.
This ensures trades are only taken in the direction of momentum.
ADX Trend Filter:
ADX(14,14) must be above 20, ensuring signals only print in trending conditions (not in chop/range).
Minimum Bars Between Signals:
Only one signal per direction is allowed every 10 bars to avoid overtrading and signal clustering.
What Does This Achieve?
Reduces noise and false signals common in basic MA cross or stack systems.
Captures only strong, high-momentum, and high-conviction moves.
Helps you avoid chop, range, and news whipsaws by combining multiple market filters.
Perfect for advanced scalpers, intraday trend followers, or as a trade filter for algos/EAs.
How to Use It:
Apply to your 5-minute chart.
Green BUY signals: Only when all bullish conditions align.
Red SELL signals: Only when all bearish conditions align.
Use as a stand-alone system or as a filter for your own entries.
Recommended For:
Scalpers & intraday traders who want only the best opportunities.
EA and bot builders seeking reliable signal logic.
Manual traders seeking confirmation of high-probability breakouts.
Tip:
Adjust any of the filters (e.g., RSI/ADX thresholds, minBars, minDist) to make it more/less selective for your style or market.

Support and Resistance levels from Options DataINTRODUCTION
This script is designed to visualize key support and resistance levels derived from options data on TradingView charts. It overlays lines, labels, and boxes to highlight levels such as Put Walls (gamma support), Call Walls (gamma resistance), Gamma Flip points, Vanna levels, and more.
These levels are intended to help traders identify potential areas of price magnetism, reversal, or breakout based on options market dynamics. All calculations and visualizations are based on user-provided data pasted into the input field, as Pine Script cannot directly fetch external options data due to platform limitations (explained below).
For convenience, my website allows users to interact with a bot that will generate the string for up to 30 tickers at once getting nearly real-time data on demand (data is cached for 15min). With the output string pasted into this indicator, it's a bliss to shuffle through your portfolio and see those levels for each ticker.
The script is open-source under TradingView's terms, allowing users to study, modify, and improve it. It draws inspiration from common options-derived metrics like gamma exposure and vanna, which are widely discussed in financial literature. No external code is copied without rights; all logic is original or based on standard mathematical formulas.
How the Options Levels Are Calculated
The levels displayed by this script are not computed within Pine Script itself—instead, they rely on pre-calculated values provided by the user (via a pasted data string). These values are derived from options chain data fetched from financial APIs (e.g., using libraries like yfinance in Python). Here's a step-by-step overview of how these levels are generally calculated externally before being input into the script:
Fetching Options Data:
Historical and current options chain data for a ticker (e.g., strikes, open interest, volume, implied volatility, expirations) is retrieved for near-term expirations (e.g., up to 90 days).
Current stock price is obtained from recent history.
Gamma Support (Put Wall) and Resistance (Call Wall):
Gamma Calculation: For each option, gamma (the rate of change of delta) is computed using the Black-Scholes formula:
gamma = N'(d1) / (S * sigma * sqrt(T))
where S is the stock price, K is the strike, T is time to expiration (in years), sigma is implied volatility, r is the risk-free rate (e.g., 0.0445), and N'(d1) is the normal probability density function.
Weighted gamma is multiplied by open interest and aggregated by strike.
The Put Wall is the strike below the current price with the highest weighted gamma from puts (acting as support).
The Call Wall is the strike above the current price with the highest weighted gamma from calls (acting as resistance).
Short-term versions focus on strikes closer to the money (e.g., within 10-15% of the price).
Gamma Flip Level:
Net dealer gamma exposure (GEX) is calculated across all strikes:
GEX = sum (gamma * OI * 100 * S^2 * sign * decay)
where sign is +1 for calls/-1 for puts, and decay is 1 / sqrt(T).
The flip point is the price where net GEX changes sign (from positive to negative or vice versa), interpolated between strikes.
Vanna Levels:
Vanna (sensitivity of delta to volatility) is calculated:
vanna = -N'(d1) * d2 / sigma
where d2 = d1 - sigma * sqrt(T).
Weighted by open interest, the highest positive and negative vanna strikes are identified.
Other Levels:
S1/R1: Significant strikes with high combined open interest and volume (80% OI + 20% volume), below/above price for support/resistance.
Implied Move: ATM implied volatility scaled by S * sigma * sqrt(d/365) (e.g., for 7 days).
Call/Put Ratio: Total call contracts divided by put contracts (OI + volume).
IV Percentage: Average ATM implied volatility.
Options Activity Level: Average contracts per unique strike, binned into levels (0-4).
Stop Loss: Dynamically set below the lowest support (e.g., Put Wall, Gamma Flip), adjusted by IV (tighter in low IV).
Fib Target: 1.618 extension from Put Wall to Call Wall range.
Previous day levels are stored for comparison (e.g., to detect Call Wall movement >2.5% for alerts).
Effect as Support and Resistance in Technical Trading
Options levels like gamma walls influence price action due to market maker hedging:
Put Wall (Gamma Support): High put gamma below price creates a "magnet" effect—market makers buy stock as price falls, providing support. Traders might look for bounces here as entry points for longs.
Call Wall (Gamma Resistance): High call gamma above price leads to selling pressure from hedging, acting as resistance. Rejections here could signal trims, sells or even shorts.
Gamma Flip: Where gamma exposure flips sign, often a volatility pivot—crossing it can accelerate moves (bullish above, bearish below).
Vanna Levels: Positive/negative vanna indicate volatility sensitivity; crosses may signal regime shifts.
Implied Move: Shows expected range; prices outside suggest overextension.
S1/R1 and Fib Target: Volume/OI clusters act as classic S/R; Fib extensions project upside targets post-breakout.
In trading, these are not guarantees—combine with TA (e.g., volume, trends). High activity levels imply stronger effects; low CP ratio suggests bearish sentiment. Alerts trigger on proximities/crosses for awareness, not advice.
Limitations of the TradingView Platform for Data Pulling
TradingView's Pine Script is sandboxed for security and performance:
No direct internet access or API calls (e.g., can't fetch yfinance data in-script).
Limited to chart data/symbol info; no real-time options chains.
Inputs are static per load; updates require manual pasting.
Caching isn't persistent across sessions.
This prevents dynamic data pulling, ensuring scripts remain lightweight but requiring external tools for fresh data.
Creative Solution for On-Demand Data Pulling
To overcome these limitations, users can use external tools or scripts (e.g., Python-based) to fetch and compute levels on demand. The tool processes tickers, generates a formatted string (e.g., "TICKER:level1,level2,...;TIMESTAMP:unix;"), and users paste it into the script's input. This keeps data fresh without violating platform rules, as computation happens off-platform. For example, run a local script to query APIs and output the string—adaptable for any ticker.
Script Functionality Breakdown
Inputs: Custom data string (parsed for levels/timestamp); toggles for short-term/previous/Vanna/stop loss; style options (colors, transparency).
Parsing: Extracts levels for the chart symbol; gets timestamp for "updated ago" display.
Drawing: Lines/labels for levels; boxes for gamma zones/implied move; clears old elements on updates.
Info Panel: Top-right summary with metrics (CP ratio, IV, distances, activity); emojis for quick status.
Alerts: Conditions for proximities, crosses, bounces (e.g., 0.5% bounce from Put Wall).
Performance: Uses vars for persistence; efficient for real-time.
This script is educational—test thoroughly. Not financial advice; past performance isn't indicative of future results. Feedback welcome via TradingView comments.

MACD StrategyOverview
The "MACD Strategy" is a straightforward trading strategy tested for BTCUSDT Futures on the 1-minute timeframe, leveraging the Moving Average Convergence Divergence (MACD) indicator to identify momentum-based buy and sell opportunities. Developed with input from expert trading analyst insights, this strategy combines technical precision with risk management, making it suitable for traders of all levels on platforms like TradingView. It focuses on capturing trend reversals and momentum shifts, with clear visual cues and automated alerts for seamless integration with trading bots (e.g., Bitget webhooks).
#### How It Works
This strategy uses the MACD indicator to generate trading signals based on momentum and trend direction:
- **Buy Signal**: Triggered when the MACD line crosses above the signal line, and the MACD histogram turns positive (above zero). This suggests increasing bullish momentum.
- **Sell Signal**: Triggered when the MACD line crosses below the signal line, and the MACD histogram turns negative (below zero), indicating growing bearish momentum.
Once a signal is detected, the strategy opens a position (long for buy, short for sell) with a position size calculated based on your risk tolerance. It includes a stop-loss to limit losses and a take-profit to lock in gains, both dynamically adjusted using the Average True Range (ATR) for adaptability to market volatility.
#### Key Features
- **MACD-Based Signals**: Relies solely on MACD for entry points, plotted in a separate pane for clear momentum analysis.
- **Risk Management**: Automatically calculates position size based on a percentage of your account balance and sets stop-loss and take-profit levels using ATR multipliers and a risk:reward ratio.
- **Visual Feedback**: Plots entry, stop-loss, and take-profit lines on the chart with labeled markers for easy tracking.
- **Alerts**: Includes Bitget webhook-compatible alerts for automated trading, notifying you of buy and sell signals in real-time.
#### Input Parameters
- **Account Balance**: Default 10000 – Set your initial trading capital to determine position sizing.
- **MACD Fast Length**: Default 12 – The short-term EMA period for MACD sensitivity.
- **MACD Slow Length**: Default 26 – The long-term EMA period for MACD calculation.
- **MACD Signal Length**: Default 9 – The smoothing period for the signal line.
- **Risk Per Trade (%)**: Default 3.0 – The percentage of your account balance risked per trade (e.g., 3% of 10000 = 300).
- **Risk:Reward Ratio**: Default 3.0 – The ratio of potential profit to risk (e.g., 3:1 means risking 1 to gain 3).
- **SL Multiplier**: Default 1.0 – Multiplies ATR to set the stop-loss distance (e.g., 1.0 x ATR).
- **TP Multiplier**: Default 3.0 – Multiplies ATR to set the take-profit distance, adjusted by the risk:reward ratio.
- **Line Length (bars)**: Default 25 – Duration in bars for displaying trade lines on the chart.
- **Label Position**: Default 'left' – Position of text labels (left or right) relative to trade lines.
- **ATR Period**: Default 14 – The number of periods for calculating ATR to measure volatility.
#### How to Use
1. **Add to Chart**: Load the "MACD Strategy" as a strategy and the "MACD Indicator" as a separate indicator on your TradingView chart (recommended for BTCUSDT Futures on the 1-minute timeframe).
2. **Customize Settings**: Adjust the input parameters based on your risk tolerance and market conditions. For BTCUSDT Futures, consider reducing `Risk Per Trade (%)` during high volatility (e.g., 1%) or increasing `SL Multiplier` for wider stops.
3. **Visual Analysis**: Watch the main chart for trade entry lines (green for buy, red for sell), stop-loss (red), and take-profit (green) lines with labels. Use the MACD pane below to confirm momentum shifts.
4. **Set Alerts**: Create alerts in TradingView for "Buy Signal" and "Sell Signal" to automate trades via Bitget webhooks.
5. **Backtest and Optimize**: Test the strategy on historical BTCUSDT Futures 1-minute data to fine-tune parameters. The short timeframe requires quick execution, so monitor closely for slippage or latency.
#### Tips for Success
- **Market Conditions**: This strategy performs best in trending markets on the 1-minute timeframe. Avoid choppy conditions where MACD crossovers may produce false signals.
- **Risk Management**: Start with the default 3% risk per trade and adjust downward (e.g., 1%) during volatile periods like BTCUSDT news events. The 3:1 risk:reward ratio targets consistent profitability.
- **Timeframe**: Optimized for 1-minute charts; switch to 5-minute or 15-minute for less noise if needed.
- **Confirmation**: Cross-check MACD signals with price action or support/resistance levels for higher accuracy on BTCUSDT Futures.
#### Limitations
- This strategy relies solely on MACD, so it may lag in fast-moving or sideways markets. Consider adding a secondary filter (e.g., RSI) if needed.
- Stop-loss and take-profit are ATR-based and may need adjustment for BTCUSDT Futures’ high volatility, especially during leverage trading.
#### Conclusion
The "MACD Strategy" offers a simple yet effective way to trade momentum shifts using the MACD indicator, tested for BTCUSDT Futures on the 1-minute timeframe, with robust risk management and visual tools. Whether you’re scalping crypto futures or exploring short-term trends, this strategy provides a solid foundation for automated or manual trading. Share your feedback or customizations in the comments, and happy trading!
