hamster-bot ZZCompilation of various modifications of the trend breakout reversal strategies based on the ZigZag .
Includes past versions of scripts:
version 1 ZZ2 Breakout reversal strategy
version 2 ZZ2 with experimental options hamster-bot ZZ Breakout reversal strategy
version 3 ZZ6 Noro's ZZ-6 by hamster-bot The original script is available here
The original script is available here
Description ZZ6 :
New version of ZZ-strategy.
Repaint?
Normal lines are not redrawn. Dotted lines repaint, but do not affect trading (do not affect backtests). You can turn off repaint in the script settings. Repaint (dotted lines) are needed only for clarity. To make it clear from which bar the level is created.
Levels
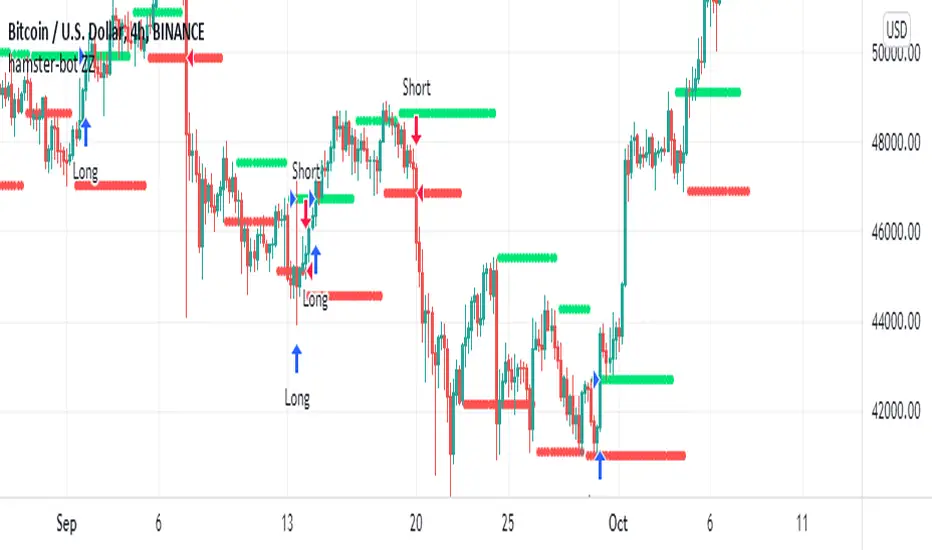
Lime lines above - level from a local high bar. To open a long position. Using a market stop order.
Red line at the bottom - the level from a local low bar. To open a short position. Using a market stop order.
Trading
You can trade without short positions. Then the red line is the level for a stop-loss order.
Reverse trading can be used. Without stop-loss orders.
Risk size
Order size depends on the risk size parameter and possible loss. If risk size = 2%, it means that the loss will be no more than 2%.
For crypto
Symbols: XBT/USD, BTC /USD, BTC /USDT, ETH/USD, etc - need USD(T)
Timeframes: 1h, 4h, 1d
This new ZZ strategy includes all the best practices for this strategy. the script has great flexibility of settings.
Instructions for script parameters:
Parameter ZZ Type - is responsible for the basic type of strategy used (usually it is responsible for building levels)
then you will need to configure the settings block corresponding to the selected ZZ type .
At the moment the script contains types: ZZ2 + ZZ6
The rest of the parameters are common for any type of ZZ.
Further development will be done in this script. The above scripts will not be updated.
At the moment the options are already available:
- Take Profit
- Stop Loss
- One entry Long/Short
- Single entry
- Levels offset
- Levels multiplier
- Levels angle
"bot" için komut dosyalarını ara
hamster-bot PDD Pump and Dump DetectorPump and Dump detector by hamster-bot
strategy author: foresterufa
Pump and Dump detector (PDD)
This is a trend strategy, with a unique mechanism of multi-stage re-entry into a position (Take Profit-Entry) when a significant trend develops, based on our HiDeep indicator.
Positions are opened by the HiDeep indicator signal with trend direction filtering and volatility filtering. Positions are closed by a HiDeep indicator signal or a change in the trend direction.
The position can be accompanied by a unique Stoploss trailing MA.

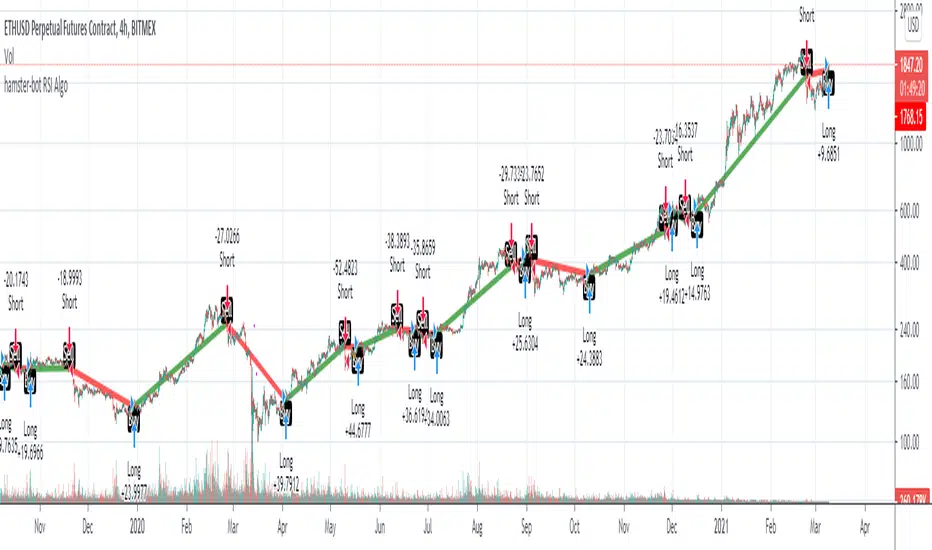
hamster-bot RSI AlgoThis is a simple RSI based signal indicator. It is designed for algorithmic bot trading.
For best results, leave a time-frame of at least 1 hour.
When the RSI reaches 70, it gives a buy signal, and when the RSI reaches 30, it gives a sell signal. The position is then maintained until the opposite signal is given. If backtesting shows poor results, but looks like the opposite would be good, there is a simple switch in the settings to turn it over.
original indicator on the basis of which the strategy is made:
Noro's ZZ-6 by hamster-botThe original script is available here
New version of ZZ-strategy.
Repaint?
Normal lines are not redrawn. Dotted lines repaint, but do not affect trading (do not affect backtests). You can turn off repaint in the script settings. Repaint (dotted lines) are needed only for clarity. To make it clear from which bar the level is created.
Levels
Lime lines above - level from a local high bar. To open a long position. Using a market stop order.
Red line at the bottom - the level from a local low bar. To open a short position. Using a market stop order.
Trading
You can trade without short positions. Then the red line is the level for a stop-loss order.
Reverse trading can be used. Without stop-loss orders.
Risk size
Order size depends on the risk size parameter and possible loss. If risk size = 2%, it means that the loss will be no more than 2%.
For crypto
Symbols: XBT/USD, BTC /USD, BTC /USDT, ETH/USD, etc - need USD(T)
Timeframes: 1h, 4h, 1d
The script will continue to be developed by the Hamster Bot team

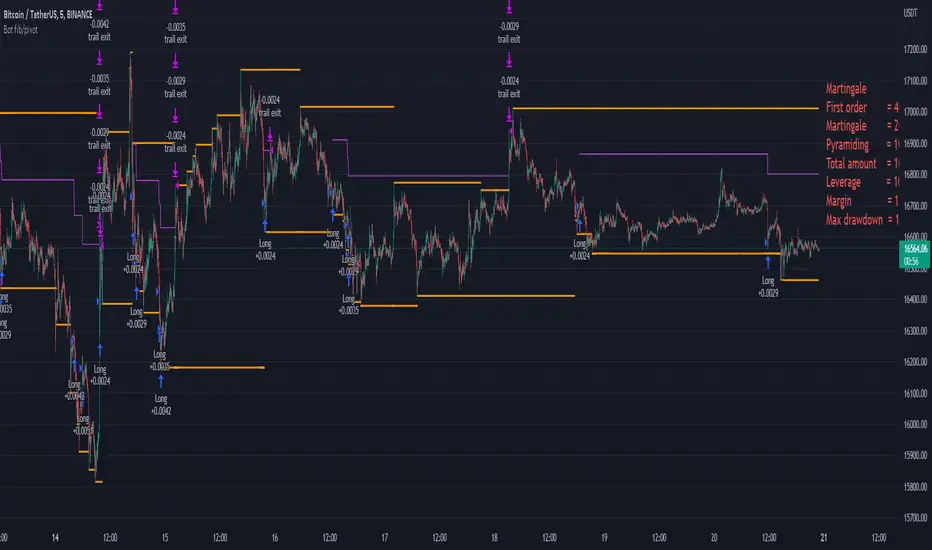
Bot fib/pivot Hello, friends!
This strategy is based on the fibonacci level you choose in the setup and possible pivot points under the control of Williams’ Percent Range.
Williams' Percent Range is a dynamic indicator that detects overbought/oversold conditions.
When the possible reversal points coincide with the fibonacci level, and the high or low points according to Williams also coincide, then an entry occurs.
One of the oldest and most reliable trading tools are widely used support and resistance levels.
In this strategy, we are trying to find these reversal levels based on fibonacci.
//LOGIC ENTRY SETTINGS
Deviation-deviation from the pivot point, the lower this figure, the more entries. The yellow lines on the chart are pivot points.
Fibonacci lvl-fibonacci level, from which the entry will occur, provided that other conditions match
Highest lookback-The setting, which refers to Williams' Percent Range , looks at how many candles ago, was high or low. The smaller the number, the larger, but less accurate inputs.
//AMOUNT(USDT) FIRST ORDER AND > % NEXT
-Martingale first order (the amount of the entrance to the usdt) / next order (Increase of each subsequent order as a percentage)
//EXIT SETTINGS (%, RSI)
-Use RSI for close position? (the position will not be closed if it is in the red, even if the RSI conditions worked)
-Use % for exit? Exit immediately upon reaching the specified percentage
-Use trailing? When the checkbox is checked, the position will be exited by trailing.
Activation trail,after?- When the specified percentage is reached, trailing is activated!
Stop_trail,%- if the last candle falls from the high (after the trailing is activated), the position will be exited.
For example:
We entered the purchase at 100 per asset, activation costs 10, and stop is 2.
the price reached 110, there was an activation, after that it went up to 120, and from the high of the last candle, a 2% drop occurs and the trade is exited.
PS:The default value is 1%, what does this give us? if there is a sharp increase, then we take away all the movement
Use only long?
Allow long?- Only long trades will be displayed
Allow short? Only short trades will be displayed
Allo reverse? Upon receipt of a return signal, the opposite position will be closed.
//MARTINGALE GRID
If there is a check mark in the line "Use martingale and grid?"
then the grid will be active
If there is a check mark in the "Limit each next entry,%?" then, even if the entry from the bot logic is triggered, and the price does not fall by the specified percentage, then there will be no entry!
If there is a check mark in the "Grid,%" column, then purchases with martingale support will be added with a decrease by the specified percentage!
PS: "Grid" always starts anew, as the input from logic triggered!
//FILTER SETTINGS
1) Use filter oscillator? (The filter uses 7 averaged oscillators)
Period-the period for which you will be billing
Upper line-Short entry border.
(if 40, then there will be no entry until it reaches)
Lower line-Long entry border.
(20 until below 20 no entry)
2)Use filter range?
Filter type-moving average selection
Bars back-offset speed based on number of last bars
Period-period to calculate
3)Use filter supertrend?
Supertrend filter with multitimeframe
// How do filters work 2 and 3?
Filters can work either one by one or together.
A trade is entered when conditions from the logic and filters in the red zone are triggered, when there are no entries in the green zone.
//DATA RANGE:
-Testing results for any period of time
//PIRAMIDING
-Also in the settings there is a pyramid of order, keep this in mind. Make a deal for a small part of the deposit, and not for all the money at once!
PS: to use martingale, you need to write in the hook messages:
"amount": "{{strategy.order.contracts}}" (purchases will be in the amount of coins equivalent to USDT)
The default settings for TF are 1 minute, 10 inputs.
You can choose your settings for any TF, but look at different coins to make sure you have good statistics
- Trading Bot – TopBot Anomaly Robot Strategy -- Introduction -
This strategy is based on a search for abnormal market price movements relative to a time-shifted main moving average. Different variations of the main moving average are created and shifted proportionally rather than linearly, giving the strategy greater reactivity and serving as position entry points. What's more ? This strategy stands out with a major innovation, allowing position exits to be set on variations in the moving average (and not on the moving average itself, like all strategies that close positions on return to the moving average), which greatly improves actual results.
- Detailed operation of the strategy -
It defines a function that calculates various moving averages (depending on the type of moving average defined by the user) and the chosen length. The function takes into account different types of moving averages: SMA, PCMA, EMA, WMA, DEMA, ZLEMA and HMA, and is offset in time so that it can be an entry or exit condition in real time (otherwise you'd have to wait for the next candle for the moving average to be calculated).
It calculates shifted variants (semi-parallel) as a percentage of this main moving average, high and low, to define position entry points (depending on user settings, up to 10 shifted levels for ten position entries for each direction). By calculating shifts as percentages rather than fixed values, the resulting deviations are not parallel to the main moving average, but can be used to detect sudden price contractions. By adjusting these deviations proportionally, we can observe variations relative to the main moving average more clearly, enabling us to detect dynamic support and resistance zones that adapt to market fluctuations. The fact that they are not strictly parallel avoids too rigid an interpretation and gives a more nuanced reading of trends, capturing small divergences that could indicate more subtle changes in market dynamics.
The most distinctive feature of this strategy concerns position exits: the script calculates two new moving averages shifted in proportion to the main moving average (adjustable) to define position exit price levels.
The strategy enters position when one of the deviations from the position entry moving average is crossed, and exits position when the deviation from the position exit moving average is crossed.
Position entry can be single or up to ten entry levels per direction to smooth trades. Differentiated settings are available for Longs and Shorts.
In this type of strategy, the return to the moving average is generally used as the position exit point, but this strategy incorporates a unique feature: the position exit can be made on a deviation from the moving average, adjustable and differentiated for Long and Short positions.
This is a major change compared to other strategies using a moving-average position exit, since the result is thatchanging the position exit point considerably improves the strategy's results .
Backtest with a classic exit back to the moving average :
Backtest with an exit back on an (adjustable) derivative of the moving average :
- “Ready to use” and user-adjustable parameters -
The strategy interface has been optimized for easy creation of trading robots, with all settings underlying the calculations and numerous options for optimization. Here are the contents of the strategy parameters interface:
In addition, important information about strategy settings and results is displayed directly on the chart. The percentage profit displayed may differ slightly from that of the backtest, as it includes potential profits from open trades (strategy.openprofit) in its calculation.
- Conditions, options and settings for graph and backtest presentation -
Here are the conditions and settings for the graph presented on the screen:
The strategy is set for 10 possible LONG and SHORT entries
10% of capital in x2 leverage is invested at each position entry (i.e. 20% of capital under backtest conditions)
The backtest runs for 14 months: from 08/17/2023 to 08/19/2024
It is carried out on PENDLEUSDT.P on BitGet Swap in 4H
LONGS strategy settings: 0.18 - 0.19 - 0.2 - 0.21 - 0.22 - 0.23 - 0.24 - 0.25 - 0.26 - 0.275 - LONGS output deviation: 0.03 (3%)
Strategy settings for SHORTS: 0.21 - 0.22 - 0.23 - 0.24 - 0.25 - 0.26 - 0.27 - 0.28 - 0.29 - 0.3 - LONGS output deviation: 0.032 (3.2%)
All other settings are strategy defaults - Broker fees + spread are set at 0.13% per trade
We can see several interesting points:
The strategy has very high winrate if set to this objective
The settings here have not been “over-optimized”, i.e. all 10 entries are unused, leaving room for larger-than-expected market movements in the future. In this particular case, it is set to favor safety over profitability optimization, but other approaches are possible to maximize profitability.
The result is 277.75% , thanks to the strategy's adjustment of position exit levels. With a conventional exit at the moving average, results are only 204.47%, a significant difference.
- How to adjust and apply the strategy? -
Generally speaking, the strategy works well on a large proportion of cryptocurrencies, especially for LONG positions. The recommended timeframes are: 30M-45M-1H-2H-3H-4H and the most appropriate timeframe will vary according to the cryptocurrency. It is also possible, with certain assets, to run the strategy on shorter timeframes such as 5M or 15M with success.
The strategy can be used with a single position entry level, maximizing capital utilization on each trade and/or having several strategies active on a single account at the same time
It can also be used in a “safe” way, using up to ten successive entries to smooth out unforeseen market movements and minimize risk as much as possible. In this case, enter positions with 1/10 of the capital each time, for a setting of ten entries, and give preference to a single active bot per account so that all positions can be covered (a fixed dollar amount, not a percentage, is then recommended)
The recommended leverage is x1 or x2 for controlled long-term trading, especially with ten entry levels, although sometimes higher leverage could be considered with controlled risk.
Here's how to set up the strategy:
Start by finding a cryptocurrency displaying a nice curve with the default settings
Then try out the default settings on all timeframes, and select the timeframe with the best curve or the best result
Deactivate shorts
Set the first long triggerlevel to the value that gives the best result
(optional): Change the moving average type, period and data source to find the most optimized setting before proceeding to the next step
Set the 10thlong inputlevel to the last value modifying the result
Set the 8 intermediate input levels, distributing them as evenly as possible
Then adjust the output level of the longs, which can greatly improve the results
Temporarily deactivate the longs, activate the shorts and follow the same process
Reactivate longs and shorts
- How to program robots for automated trading using this strategy -
If you want to use this strategy for automated trading, it's very simple. All you need is an account with a cryptocurrency broker that allows APIs, and an intermediary between TradinView and your broker who will manage your orders.
Here's how it works:
On your intermediary, create a bot that will manage the details of your orders (amount, single or multiple entries, exit conditions). This bot is linked to the broker via an API and will be able to place real orders. Each bot has four different signals that enable it to be activated via a webhook. When one of the signals is received, it executes the orders for you.
On TradingView, set the strategy to a suitable asset and timeframe. Once set, enter in the strategy parameters the signals specific to the bot you've created. Confirm and close the parameters.
Still on TradingView, create an alarm based on your set strategy (on the strategy tester). Give the alarm the name of your choice and in “Message” enter only{{strategy.order.comment}}.
In alarm notifications, activate the webhook and enter the webhook of your trading intermediary. Confirm the alarm.
As long as the alarm is activated in TradingView, the strategy will monitor the market and send an order to enter or exit a position as soon as the conditions are met. Your bot will receive the instruction and place orders with your broker. Subsequent changes to the strategy settings do not change those stored in the alarm. If you wish to change the settings for one of your bots, simply delete the old alarm and create a new one.
Note: In your bot settings, on your intermediary, make sure to allow: - Multiple inputs - A single output signal to close all positions - Stoploss disabled (if necessary, use the strategy one)

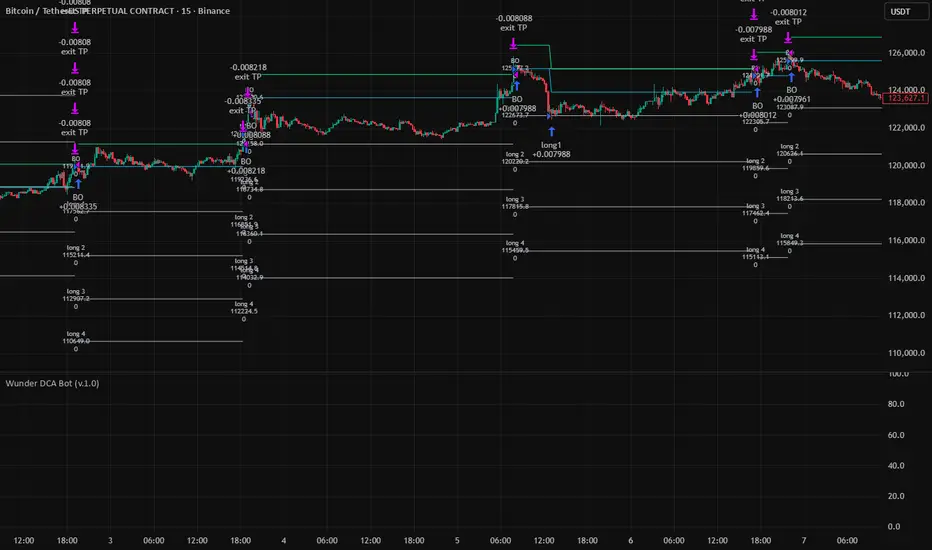
Wunder DCA BotThe bot is based on the DCA system.
1. DCA is the investment method in which you buy a certain portion of the asset after the determined price deviation.
2. For entry, we evaluate the maximum and minimum levels for a given period that you can adjust in the script. The bot enters when price rebound from the specified levels.
3. For the exit, the bot will use the take profit percentage that you will specify in settings.
It is also possible to choose how the take profit is calculated either from the average entry price or from the entry order (first order).
4. DCA uses the following settings:
- Base order Volume: Volume of your first order on entry signal
- Subsequent orders volume: The volume of all subsequent orders except the first
- DCA orders count: This parameter will determine how many entries your overall strategy will have. For example: If you will put 3, that will mean that including your initial position you will have 2 additional orders.
- DCA order price deviation:
This is the value in % which determines the deviation of the additional entries from the entry price. Example: If you go long and the price of the asset is 100$ and you put an order price deviation of 1% that will mean that the first additional entry will occur when the price will drop by 1%, and the second entry will be triggered when the overall price will drop by 2% (as the interval between the first and the second additional entry will be 1%).
- DCA Order Volume Multiplier:
This parameter will determine the amount that you put into each additional position. If this parameter is equal to 1 that means that each additional entry will be equal to the initial amount. The extra volume will be added to your position from the second DCA entry. Example: Your initial position was 10$ and your Volume Multiplier is set to 2. When you reach your 1st DCA target your additional order will have the same volume of 10$. When you reach your 2nd DCA target your additional order will be 20$ (previous position volume * multiplier). Your 3rd DCA target will place the order of 40$.
- DCA order price Deviation Multiplier:
This value will increase the price deviation between each additional entry. It is calculated as the price deviation multiplied by the deviation multiplier. For example: if you enter long at the price 100$ and have a price deviation of 1% with the price deviation multiplier of 2 that will mean that the first additional entry will occur when the price will drop to 99$ however the second will occur when the price will go to 97$. The third additional position will be entered at 94$
5. For full automation of the bot, you should set your comments to the input in the bot settings in the "LONG" and "SHORT" fields. You also need to create an alert signal and set a Webhook to send signals.
IMPORTANT!!!
1. Position calculation should take into account several factors: your deposit, leverage, the number of DCA orders, the distance to the last DCA order;
2. When choosing leverage, it is important to correctly calculate the possible drawdown. If you set a high leverage value, then liquidation awaits and the bot will not be able to take profits and will exit the position ahead of time;
3. The size of the position must be determined in accordance with all risks and take into account the size of your deposit;
4. This DCA Bot is able to earn consistently with the correct calculated money management.
CS Trading Bot Strategy - Crypto EditionWhat is this strategy about?
The CS Trading Bot Strategy is for researching the most lucrative Crypto assets to be selected for in the corresponding Study (that actually generates alerts/signals).
The Strategy is very profitable for a vast amount of Crypto assets and the algorithm behind is not overfitted.
How to use it?
As a rule of thumb, the best time-frames are the 4h, 3h, 2h and 1h (sometimes 30M and 45M).
For many high profile/volume assets such as BTC, ETH and XRP the Daily is very profitable, as well. Weekly and Monthly time-frames should be avoided.
It is not recommended to apply this strategy to new assets with only a few weeks of history. I recommend a history of at least 6 months and 5 trades in the Strategy stats.
In the Strategy settings, you can adjust the time-span to see how the Strategy performs in certain conditions like bear-markets (see for example 4H on BTCUSDT from Jan 2018 - March 2019).
What to look for on researching?
If you are researching, make sure to look for these metrics in the Strategy overview:
Linear equity growth (especially over a larger period of time)
Low drawdown
Profitability above 50%
Average gain per trade of 5%
A satisfying profit for your selected time-span
Min. 5 trades, better 10
Min. 6 Months time-span
As a head-start, I suggest to research on the following assets, so you get a feeling about what to look for based on the list above:
POLONIEX:BTCUSDT
POLONIEX:ETHUSDT
POLONIEX:XRPUSDT
Why Poloniex? Because it has a long history for these assets...
Once you determined your favorite assets, you are ready to add the corresponding Study and within, set alerts for them.
Here the Webhooks are very interesting as you can forward your signals to your own trading bot or simply wait until my trading bot is available (currently in development)
Since I develop myself, rest assured it will be available soon. Look out for comments below as soon as it is available!
The bot is a commercial package including:
This Strategy for finding the best assets
The Study for setting alerts based on the best assets (webhooks, emails, popups, etc)
Access to our automated trading bot (separate download, as soon as available)
How to access?
If you are interested to get access to the complete package, please don't hesitate to send me a private message for a quote.
The amount of concurrent users using the package (=licenses) is limited to max. 500 a month (more we cannot manually handle has Tradingview has no automation for this yet).
Access to the bot package is based on a monthly basis. If you get access, you will asked in person at the end of the month if you want to continue or not.

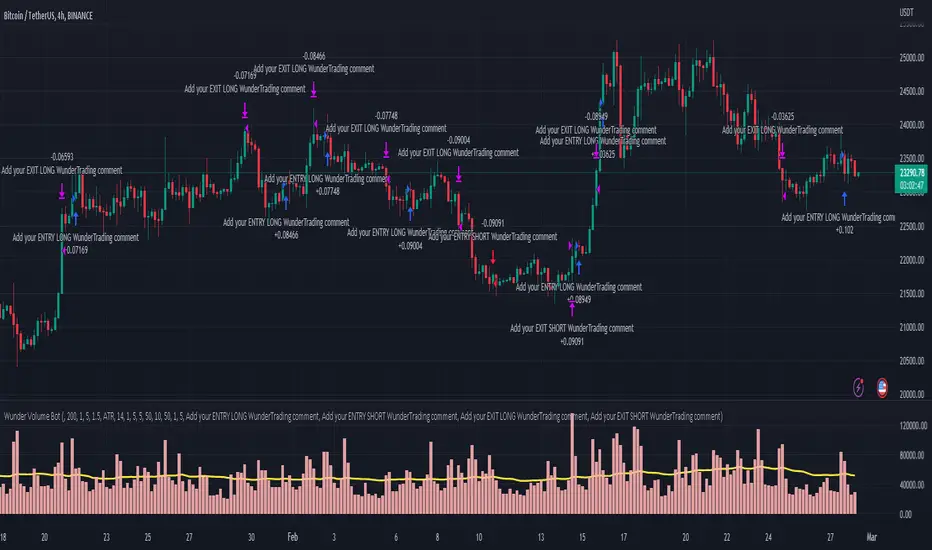
Wunder Volume botWunder Volume Bot
1. Wunder Volume bot is a non-indicator strategy that is based on the Volume analysis.
2. For the entry we will use the volume multiplier to detect the abnormal volume activity. For example, the volume should be 2 times the average. You can set your own preferences for each asset. It is recommended to use a higher multiplier and multiple assets to run multiple different bots in order to diversify your approach.
3. A function for calculating risk on the portfolio (your deposit) has been added to the Wunder Volume bot script. When this option is enabled, you get a calculation of the entry amount in dollars relative to your Stop Loss. In the settings, you can select the risk percentage on your portfolio. The loss will be calculated from the amount that will be displayed on the chart.
For example, if your deposit is $1000 and you set the risk to 1%, with a Stop Loss of 5%, the entry volume will be $200. The loss at SL will be $10.10, which is your 1% risk or 1% of the deposit.
Important! The risk per trade must be less than the Stop Loss value. If the risk is greater than SL, then you should use leverage.
The amount of funds entering the trade is calculated in dollars. This option was created if you want to send the dollar amount from Tradingview to the exchange. However, putting your volume in dollars you get the incorrect net profit and drawdown indication in the backtest results, as TradingView calculates the backtest volume in contracts.
To display the correct net profit and drawdown values in Tradingview Backtest results, use the ”Volume in contract” option.
- Trading Bot – Dynamic RSI (Professional) - Robot Strategy -1. General Concept and Philosophy
This strategy was designed for systematic traders and work especially well on short timeframes (1 to 5 minutes), who seek to capture trend reversal movements with a high degree of confirmation. The goal is not to follow the trend, but to identify precise entry points in oversold or overbought zones, and then to exit the position dynamically to adapt to changing market conditions.
The originality of Trading Bot Dynamic RSI lies not in a single indicator, but in the intelligent fusion of several concepts:
Dynamic RSI bands for both entries and exits .
A triple confirmation filter to secure trade entries.
A fully parameterizable design ready for automation .
2. Originality at the Core of the Strategy: Key Features
Dynamic Exits on RSI Bands: This is a main original feature of this script. Unlike traditional strategies that use fixed Take-Profits and Stop-Losses, this one uses an exit RSI band, calculated with parameters independent of the entry ones. This allows the strategy to:
Adapt to Volatility: In a volatile market, the exit band will move further away, allowing for the capture of larger moves. In a ranging market, it will tighten to secure smaller gains.
Optimize Profits: The exit occurs when momentum genuinely fades, not at an arbitrary price level, thus maximizing the potential of each trade.
Triple Confirmation Filter for Precise Entries: To avoid false signals, each entry is validated by the convergence of three distinct conditions:
The base signal is generated when the price reaches an overbought or oversold zone, materialized by an RSI band calculated directly on the chart.
The WaveTrend oscillator must also be in an extreme zone, confirming that the short-term momentum is ready for a reversal.
Finally, the StochRSI must validate that the RSI itself is in an overbought or oversold condition, adding an extra layer of security.
"Automation Ready" Design: The strategy was developed with automation in mind.
Customizable Alert Messages: All messages for entries and exits (Long/Short) can be formatted to be compatible with automated trade execution platforms.
Precise Capital Management: The position size calculation can be set as a fixed amount (e.g., 100 USDT), a percentage of the total capital, or of the available capital, and includes leverage. These parameters are crucial for a trading bot.
3. Detailed Operation
Entry Logic: A position is opened only if the following three conditions are met:
The market price touches (or closes below/above) the entry RSI band (lower for a buy, upper for a sell).
The WaveTrend indicator is in the oversold zone (for a buy) or overbought zone (for a sell).
The Stochastic RSI indicator is also in the oversold zone (for a buy) or overbought zone (for a sell).
The order is placed as a limit order on the RSI band, allowing for execution at the best possible price.
Exit Logic: The primary exit is dynamic.
For a Long position, the trade is closed when the price reaches the upper exit RSI band.
For a Short position, the trade is closed when the price reaches the lower exit RSI band.
Optionally, a percentage-based Stop-Loss and Take-Profit can be activated for more traditional risk management, although the dynamic exit is the recommended default mechanism.
4. Ease of Use and Customization
Despite its internal complexity, the strategy is designed to be user-friendly :
Clear Settings Panel: Parameters are grouped by function (Long Entry, Long Exit, Quantity, etc.), and each option comes with an explanatory tooltip.
Integrated Display: All key information (performance, current settings) is displayed in clean and discreet tables directly on the chart, allowing you to see at a glance how the strategy is configured.
Total Flexibility: Although default settings are provided, every parameter (RSI lengths, levels, filters) can be adjusted to optimize the strategy on any asset (cryptocurrencies, Forex, indices...) and any timeframe.
5. Detailed Guide to User Settings
A comprehensive set of parameters
To offer you complete control and maximum flexibility, the strategy exposes a comprehensive set of parameters. Here is an overview of what you can customize:
Trading Mode and Display
Trading Mode: Choose to enable only long positions ("Long Only"), only short positions ("Short Only"), or both simultaneously ("Long and Short").
Display: Manage the information panels on the chart. You can opt for a full display, a minimal window showing the profit, or hide all information for a clean chart.
Filters Smoothing (StochRSI K)
Filters Smoothing: This key parameter adjusts the smoothing of the Stochastic RSI. A lower value will make the filter more responsive, generating more signals. A higher value will make it smoother, generating fewer but potentially more reliable signals.
LONG Position Settings
Long Only mode
Entry: Define the RSI length and Oversold level that draw the lower band for long position entries.
Exit: Independently configure the RSI length and Overbought level that draw the upper band for the dynamic position exit.
Options: Optionally enable a percentage-based Take-Profit and/or Stop-Loss.
SHORT Position Settings
Short Only Mode
Entry: Define the RSI length and Overbought level for the upper entry band for short positions.
Exit: Independently configure the RSI length and Oversold level for the lower dynamic exit band.
Options: Just like for long positions, you can enable a percentage-based Take-Profit and/or Stop-Loss.
Quantity and Leverage
Quantity Type: Calculate your position size in three ways: as a fixed cash amount, as a percentage of available capital, or as a percentage of the total account balance.
Amount: Specify the dollar amount or percentage to commit per trade.
Leverage: Set the leverage to be applied. This is crucial for automation.
Backtest Period
Backtest Period: Enable this option to limit the strategy's calculations to a specific time period. This is a powerful tool for testing performance under particular market conditions.
Bot Alert Messages
Bot Alert Messages: This section is dedicated to automation. Customize the exact text messages that will be sent by TradingView alerts for each event (enter long, exit long, etc.).
Other Settings (Advanced - Optional)
Other Settings: This section allows experienced users to fine-tune the confirmation engine. You can adjust the parameters of the WaveTrend and Stochastic RSI oscillators in detail.
Spread Calculator (Informative Only)
Spread Calculator: This handy tool helps you estimate the actual fees of your exchange to run a much more realistic backtest. This panel has no impact on the trading logic itself.
Disclaimer
This strategy provides signals based on past market conditions. Past performance is not indicative of future results. Trading involves risk, and it is the responsibility of each user to manage their risk appropriately. It is strongly recommended to conduct thorough backtests and to understand the functioning of each parameter before using this strategy in live conditions or automating it. Take into account transaction fees, spread, and slippage, which can impact real results.

Wunder OI botWunder OI bot
1. Wunder OI bot is based on the search for divergences on the Open Interest indicator. The strategy determines the divergence between the price and the Open Interest for a given period.
2. 50 EMA is used as an additional filter. If a divergence is found for a specified number of bars ago and the price is above or below, a trade will be opened.
3. A function for calculating risk on the portfolio (your deposit) has been added to the Wunder OI bot script. When this option is enabled, you get a calculation of the entry amount in dollars relative to your Stop Loss. In the settings, you can select the risk percentage on your portfolio. The loss will be calculated from the amount that will be displayed on the chart.
For example, if your deposit is $1000 and you set the risk to 1%, with a Stop Loss of 5%, the entry volume will be $200. The loss at SL will be $10. 10$, which is your 1% risk or 1% of the deposit.
*Important!** The risk per trade must be less than the Stop Loss value. If the risk is greater than SL, then you should use leverage.
The amount of funds entering the trade is calculated in dollars. This option was created if you want to send the dollar amount from Tradingview to the exchange. However, putting your volume in dollars you get the incorrect net profit and drawdown indication in the backtest results, as TradingView calculates the backtest volume in contracts.
To display the correct net profit and drawdown values in Tradingview Backtest results, use the ”Volume in contract” option.

Cyatophilum 3Commas DCA Bot BacktesterAn indicator to backtest and automate 3Commas DCA Bots.
═════════════════════════════════════════════════════════════════════════
█ HOW IT WORKS
The indicator allows you to replicate your bot settings and get backtest results from the Strategy Tester and also a backtest panel with additional information on the safety orders.
You can also create alerts for each of the strategy events.
█ HOW TO USE
Choose a symbol that corresponds to your bot pair and exchange.
Pick a chart time frame as small as possible, usually 1 minute. The timeframe should always be smaller or equal to the deal start conditions timeframes.
Always use regular candle type.
Configure your deal start condition . You can combine several technical indicators to trigger an entry using a AND logical gate.
Configure your profit target
Use the Take Profit feature to set a target in percentage of price. You can also make it trail.
There is also a Stop Loss feature that is turned off by default.
Configure your safety orders
Replicate the safety orders from your bot into the indicator inputs.
Check your backtest parameters
Make sure that the initial capital and order size make sense. Since it is a pyramiding strategy with safety orders, the sum of all deals should not be bigger than the initial capital.
In this example: Initial capital is 0.02 BTC, which around 600$. I used 1000$ to be safe.
If you use % equity as order size, please note that it will create compounding.
Check the fees, by default they are set to 0.1%.
I also recommend to set a slippage that corresponds to your exchange's spread.
█ FEATURES
• Strategy direction
Configure wether to go long or short.
• Deal Start Conditions
The current conditions available are:
- Up to 4 MTF Trading View ratings conditions (Buy/Sell, Strong Buy/Sell)
- Up to 4 MTF RSI with configurable start conditions (Less/Greater than, Crossing Up/Down)
- Up to 2 MTF Ultimate Oscillator with configurable start conditions (Less/Greater than, Crossing Up/Down)
- MTF BB%-20-1 (length-deviation) with configurable start conditions (Less/Greater than, Crossing Up/Down)
- MTF BB%-20-2 (length-deviation) with configurable start conditions (Less/Greater than, Crossing Up/Down)
- Up to 2 MTF TA presets with the following options (Bollinger Bands, MFI, CCI, MACD, PSAR, SMA crosses, Heikin Ashi)
• Stop Loss and Take Profit
Configure your stop loss and take profit for long and short trades.
You can also make a trailing take profit.
• DCA (Safety orders)
Create up to 100 safety orders with configurable options for step and volume scaling, take profit from total volume, base and safety order size.
• Backtest Settings
Choose a backtest period, longs or shorts, wether to use limit orders or not.
Graphics
A Configuration panel with all the indicator settings, useful for sharing/saving a strategy.
A Backtest Results panel with additional information from the strategy tester.
█ ALERTS
The indicator is using the alert() calls: it only uses 1 alert slot to send order messages for each event (Long/Short entry, stop loss, take profit, safety order). This means free TV plans can create 1 complete strategy.
To set your alert messages, open the indicator settings and scroll to the bottom of the "inputs" tab.
Create your alert after you set the messages in the indicator settings, and make sure "Any alert() function call" is set in the alert option.
█ BACKTEST RESULTS
The backtest settings used in this snapshot are the following:
Initial Capital: 1000€
Order size: 0.003 BTC
Commission: 0.1 % per order
Slippage : 1 tick
Please read the author instructions below for access.

Instrument-Z (3Commas Bot)Instrument-Z is what I am currently using as my 3Commas Bot.
It allows you to customize signals from 3 indicators; Crossing MA's, Stochastic RSI, and WaveTrend.
Better yet, it allows you to setup these signals separately depending on whether the Trend MA is going up or down.
So there are 2 sets of inputs for everything, Uptrend inputs and Downtrend inputs.
I have realized that we can't expect a strategy to work the same way in an uptrend vs downtrend, so the inputs should be separated too.
In my testing, separating increased the net profit by 60% on average.
You can select whether you are trading Long or Short.
You can choose your stop loss and take profit levels as well as trade expiration.
You can choose if you only want to trade with the trend (making the opposing signals irrelevant).
The trend is based on the Trend MA.
This script is specifically for cryptocurrencies.
I've noticed that MA crosses on other asset classes are unreliable because the fluctuations are not strong enough to push the MA's across each other in a meaningful way.
If you want to use this as a 3Commas Bot, then you will have to copy the code of the strategy and paste it into your own personal script.
Then you have to change the alert messages at the bottom of the script.
Make sure to change your alert message from this;
{"message_type": "bot", "bot_id": 0000000, "email_token": "0b000a0a-0aa0-00aa-0aa0-000a00000a0a", "delay_seconds": 0}
To this;
{\n\"message_type\": \"bot\",\n\"bot_id\": 0000000,\n\"email_token\": \"0a000a0a-0aa0-00aa-0aa0-000a00000a0a\",\n\"delay_seconds\": 0\n}
With \n after each new line and \ before each quotation.
In the Alert setup, select "alert() function calls only".
This indicator is like a middle ground of complexity between the Juicy Trend indicator and the Instrument-A indicator.
And because it does not feature my neural network project, I have made it open script.
Enjoy!

3Commas BotBjorgum 3Commas Bot
A strategy in a box to get you started today
With 3rd party API providers growing in popularity, many are turning to automating their strategies on their favorite assets. With so many options and layers of customization possible, TradingView offers a place no better for young or even experienced coders to build a platform from to meet these needs. 3Commas has offered easy access with straight forward TradingView compatibility. Before long many have their brokers hooked up and are ready to send their alerts (or perhaps they have been trying with mixed success for some time now) only they realize there might just be a little bit more to building a strategy that they are comfortable letting out of their sight to trade their money while they eat, sleep, etc. Many may have ideas for entry criteria they are excited to try, but further questions arise... "What about risk mitigation?" "How can I set stop or limit orders?" "Is there not some basic shell of a strategy that has laid some of this out for me to get me going?"
Well now there is just that. This strategy is meant for those that have begun to delve into the world of algorithmic trading providing a template that offers risk defined positions complete with stops, limit orders, and even trailing stops should one so choose to employ any of these criteria. It provides a framework that is easily manipulated (with some basic working knowledge of pine coding) to encompass ones own ideas and entry criteria, while also providing an already functioning strategy.
The default settings have a basic 1:1 risk to reward ratio, which sets a limit and a stop equal distance from the entry. The entry is a simple MA cross (up for long, down for short). There a variety of MA's to choose from and the user can define the lengths of the averages. The ratio can be adjusted from the menu along with a volatility based adder (ATR) that helps to distance a stop from support or resistance. These values are calculated off the swing low/high of the user defined lookback period. Risk is calculated from position entry to stop, and projected upwards to the limit as a function of the desired risk to reward ratio. Of note: the default settings include 0.05% commissions. Competitive commissions of the leading cryptocurrency exchanges are .1% round trip (one buy and one sell) for market orders. There is also some slippage to allow time for alerts to be sent and orders to fill giving the back test results a more accurate representation of real time conditions. Its recommended to research the going rates for your exchange and set them to default for the strategy you use or build.
To get started a user would:
1) Make a copy of the code and paste in their bot keys in the area provided under the "3Comma Keys" section
- eg. Long bot "start deal" copied from 3commas in to define "Long" etc. (code is commented)
2) Place alert on desired asset with desired settings ensuring to select "Order fills and alert() function calls"
3) Paste webhook into the webhook box and select webhook URL alerts (3rd party provided webhook)
3) Delete contents of alert message box and replace with {{strategy.order.alert_message}} and nothing else
- the codes will be sent to the webhook appropriately as the strategy enters and exits positions. Only 1 alert is needed
settings used for the display image:
1hr chart on BTCUSD
-ATR stop
-Risk adjustment 1.2
-ATR multiplier 1.3
-RnR 0.6
-MAs HEMA/SMA
-MA Length 50/100
-Order size percent of equity
-Trail trigger 60% of target
Experiment with your own settings on your crypto of choice or implement your own code!
Implementing your trailing stop (optional)
Among the options for possible settings is a trailing stop. This stop will ratchet higher once triggered as a function of the Average True Range (ATR). There is a variable level to choose where the user would like to begin trailing the stop during the trade. The level can be assigned with a decimal between 0 and 1 (eg. 0.5 = 50% of the distance between entry and the target which must be exceeded before the trail triggers to begin). This can allow for some dips to occur during the trade possibly keeping you in the trade for longer, while potentially reducing risk of drawdown over time. The default for this setting is 0 meaning unless adjusted, the trail will trigger on entry if the trailing stop exit method is selected. An example can be seen below:
Again, optional as well is the choice to implement a limit order. If one were to select a trailing stop they could choose not to set a limit, which could allow a trail to run further until hit. Drawdowns of this strategy would be foregoing locking gains at highs on target on other trades. This is a trade-off the user can decide on and test. An example of this working in favor can be observed below:
Conclusion
Although a simple strategy is implemented here, the benefits of this script allow a user a starting platform to build their strategies from with built in risk mitigation. This allows the user to sidestep some of the potential difficulties' that can arise while learning Pine and taking on the endeavor of automating their trading strategies. It is meant as an aid, a structure, and an educational piece that can be seen as a "pick-up-and-go" strategy with easy 3Commas compatibility. Additionally, this can help users become more comfortable with strategy alert messages and sending strings in the form of alerts from Pine. As well, FAQs are often littered with questions regarding "strategy.exit" calls, how to implement stops. how to properly set a trailing stop based on ATR, and more. The time this can save an individual to get started is likely of the best "take-aways" here.
Happy trading

Wunder Trend Reversal botWunder Trend Reversal bot
1. Wunder Trend Reversal Bot - this has only one goal to find a reversal of the trend.
2. The strategy determines, based on the specified value for the filter, a market reversal based on the price actions of the previous bars.
3. A short EMA is used to filter false signals after the reversal signal was received. Crossing the EMA and changing its direction confirms the trend change.
4. There are 2 ways to calculate stop loss and take profit. You can choose one of them:
- Classic stop loss and take profit in a fixed percentage
- ATR stop loss and take pro
5. ATR uses risk reward (R:R) to calculate take profit. The script calculates the risk-reward based on a certain stop loss level and uses it to calculate the take profit
6. A function for calculating risk on the portfolio (your deposit) has been added to the script. When this option is enabled, you get a calculation of the entry amount in dollars relative to your Stop Loss. In the settings, you can select the risk percentage on your portfolio. The loss will be calculated from the amount that will be displayed on the chart.
For example. Deposit - $1000, you set the risk to 1%. SL 5%. Entry volume will be $200. The loss at SL will be $10.10$ this is your 1% risk or 1% of the deposit.
Important! The risk per trade must be less than the Stop Loss value. If the risk is greater than SL, then you should use leverage.
The amount of funds entering the trade is calculated in dollars. This option was created if you want to send the dollar amount from Tradingview to the exchange. However, putting your volume in dollars you get the incorrect net profit and drawdown indication in the backtest results, as TradingView calculates the backtest volume in contracts.
To display the correct net profit and drawdown values in Tradingview Backtest results, use the ”Volume in contracts” option.

Wunder Keltner botWunder Keltner bot
1. Wunder Keltner bot is based on the breakout of the Keltner channel. For calculation, 2 channels are used, one for long trades, and the other for short trades. The division into 2 channels is used for more accurate entry calculations depending on trend directions.
2. The ADX indicator is used to filter signals and determine the trend strength. ADX determines the strength of the trend and confirms the entry into the strategy if the value is greater than the level indicated in the settings.
3. There are 3 ways to calculate Stop Loss and Take Profit. You can choose one of them:
Classic Stop Loss and Take Profit in a fixed percentage
ATR Stop Loss
Keltner. Stop Loss, which is set on the opposite Keltner’s Channel Band from Keltner breakout.
4. ATR and Keltner use Risk Reward (R:R) to calculate Take Profit. The script calculates Risk Reward based on the determined Stop loss level and uses the ration to calculate Take Profit.
5. A function for calculating risk on the portfolio (your deposit) has been added to the script. When this option is enabled, you get a calculation of the entry amount in dollars relative to your Stop Loss. In the settings, you can select the risk percentage on your portfolio. The loss will be calculated from the amount that will be displayed on the chart.
For example. Deposit - $1000, you set the risk to 1%. SL 5%. Entry volume will be $200. The loss at SL will be $10.10$ this is your 1% risk or 1% of the deposit.
Important! The risk per trade must be less than the Stop Loss value. If the risk is greater than SL, then you should use leverage.
The amount of funds entering the trade is calculated in dollars. This option was created if you want to send the dollar amount from Tradingview to the exchange. However, putting your volume in dollars you get the incorrect net profit and drawdown indication in the backtest results, as TradingView calculates the backtest volume in contracts.
To display the correct net profit and drawdown values in Tradingview Backtest results, use the ”Volume in contract” option.

MZ HTF HFT ROCit Bot - Non Repainting Scalper v1.2 ADX RSI MOM This is a new iteration based on my Momentum trading bot.
This is an original script meant to be a high frequency trader that works on higher time frame calculations.
I came up with the idea that using calculus I can figure out the actual rate of change and momentum with different calculations than the momentum indicator that is provided by trading view. Once momentum is shifted on a small time frame, it will provide an entry signal. The script is meant to be used on an algorithmic trading system for scalping purposes. It should be run on a one minute time frame. Unfortunately due to various plotting constraints in Pinescript, you cannot plot the rate of change and momentum and price in the same pane. To counter this, I have a showdata toggle to give you values of the indicators at each entry.
This version has two main entry settings toggled with a checkbox. There is the ROC (rate of change) version and the MOM (momentum) entry signals.
The rate of change version is meant to take a look at your moving average and try to trigger when it hits a certain rate of change point. This can be helpful if you rather play it safer. I have noticed that you can get slightly better entry points but also does not give you as many entries. The momentum algorithm will give you faster entry points and might work best with a slight offset (use your back test to help you figure it out).
I have started to add tooltips to help you along. If you have suggestions please let me know.
How does it work?
Let's just assume that you are looking at a one minute chart. I recommend using the one minute for bots because it will give you the fastest execution for entries. Pinescript has an issue where the signal is not usually sent until the end of the bar/beginning of next bar. If the signal was triggered at the beginning of a 15 minute bar, it might not actually send the signal until the following 15 minute bar. If you are trading on small time frames, this can make all the difference. If you are using an algo platform that trailing stops, stop losse, take profits, etc. I would recommend you use that platform to close your trade. The close trade message will work, but pinescript does not know the exact entry price you received, so if you are trying to collect small profits, it is best that intermediary platform does that calculation for you. If you are dealing with larger moves, instead of small 1-3% scalps, you are probably fine to use the close message setting from pinescript.
Ok, so to take an example. I like to use the 3L and 3S tokens on Kucoin. This gives you a lot of volatility to work with compared to other tokens and coins. However, it can also meas that you are likely taking a higher risk. However, there are some things that can help with that (more on that later).
So we have a token we want to run, and have it on the 1m chart.
First, be sure that all of your filters are OFF when you start playing with the back test. This allows you to see how to best optimize the bot.
Use the show data to show you additional data when you are backtesting. This can allow you to try to filter out results or market conditions that do not work. I typically work with the RSI and use the 30 minute and 15 minute RSIs. I make sure that it is trading within a certain band - about 40-75. You can try the inverse and only buy during really low RSI's as well.
www.dropbox.com
Find the source of your data with the variant drop down. You can use any time frame, open, close. high, low, olc4. Open is pretty much guaranteed to not have any repainting issues - although all the other calcs use a custom isbarconfirmed security repaint calculation. I have been finding that Open and SMA work well, but feel free to explore. If you use a source like open, close, high, low, etc - the interval will not change anything further. If you use a variant such as an sma, you should try to find an interval that works well for that token. For instance, try an sma of 8-11 minutes and see which gives you the best backtest result without changing anything else. Offset ALMA/LSMA parameters are only used for those specific variants. These specific parameters will also affect the ALMA and LSMA if you use that variant in the trend filter. In other words, you can skip these if you are not using those types of moving averages.
www.dropbox.com
Configure the ROC and MOM intervals. If you are using a source such as open, close, etc- this is where you set the interval for your change. So consider using OHLC4 or a interval of 5 thru 15 and see what works best. The Momentum inverval usually works best in the 2-5 bars. There is a custom calculation I added in to try to filter out false entries as momentum is waning. This calculation works best in 2-5 bar interval.
Configure the trigger point and offset. If you are using rate of change, the best settings will likely be between -1 to 0.5. If you are using momentum, you will likely want -20 to 10. This is where you will notice the entries will shift a bit. Try to find a balance between your backtest settings and actually finding what you thin will be the best entries based on a slight delay from trading view, to algo, to your trading platform. This can likely be a minute (maybe even) or so- so be sure to not get too caught up between the backtest results and be sure to finesse the entries to actually fit nicely - maybe a bar earlier than you would likely think. If your entries are coming in too early, you can use the offset to delay your entry by a few bars. This is both science and an art form- don't get too caught up on the back test results as that is based on having all the data tha already transpired, it's not based on how it will actually perform during deployment.
Take profit and stop loss. This should be self explanatory. This script can toggle between static take profit and a trailing profit. For scalping, you will likely want to limit it below 2% to get a good win ratio. Stop loss should be at least 5-6% for these types of 3L/3S tokens to give the strategy some room to move (if the token goes down 2% before it shoots back up, the price will go down 6%). This does not yield the best R/R ratio from a traditional trader perspective, but the statistical probabilities are in your favor for these events will happen. If you have better ideas for how to set this all up, feel free to contribute your ideas in the comments as we can all learn from each other. You can definitely set a much tighter stop loss with a larger take profit to get a lower win rate but in turn might get much better returns. It's all up to you.
FILTERS www.dropbox.com
These filters require you to know a bit about each indicator and how you want to use them. I will only go over the general idea.
Variant Filter - this is especially useful if you want to trade above a moving average. Say for instance you only want to take trades when we are over the 100 Day moving average. Or above a 30 minute, 30 bar EMA, etc. Although originally ported over from my other scripts, this is not a filter that I use often in conjunction with this script.
RSI - perhaps you want to buy when we are below the 30 line on the 30 minute RSI, or we want only want to have the strategy work when we are above the 50 RSI, this can all be configured here. I typically like to try a few different rationales here.
Now with brand NEW ADX filter - this is a brand new idea that seems to work rather well. Based on your ADX settings you can also turn on the "only uptrend" which will try to calculate if you are in an uptrend based on your ADX config. Please keep in mind that uptrend is based relatively on the ADX settings.
- There is a sprinkle of RSI magic in the entry signal to make sure that rsi is not declining in the calculation, so this can affect how many entries you get.
Some other tips:
Forward test.
Set up your algo bot on a one minute interval.
Set up take profit and stop loss on your algo trading platform.
Don't use the exact settings as your backtest, maybe try a slightly more conservative approach from the algo trading platform to make sure you are within range of triggering your events with a slight delay from signal to execution. If you have a 1.6% take profit, perhaps try 1.5% on your platform first.
By using these scripts you agree that you are trading at your own risk. I make no guarantees of returns or results. I just provide tools to help you trade better. However, I hope this ROCit will take you to the moon. And if it does, be sure to give me a shout as well as some tips of your own.
Send me a message with any questions or suggestions.

Customizable Non-Repainting HTF MACD MFI Scalper Bot StrategyThis script was originally shared by Wunderbit as a free open source script for the community to work with.
WHAT THIS SCRIPT DOES:
It is intended for use on an algorithmic bot trading platform but can be used for scalping and manual trading.
This strategy is based on the trend-following momentum indicator . It includes the Money Flow index as an additional point for entry.
HOW IT DOES IT:
It uses a combination of MACD and MFI indicators to create entry signals. Parameters for each indicator have been surfaced for user configurability.
Take profits are fixed, but stop loss uses ATR configuration to minimize losses and close profitably.
HOW IS MY VERSION ORIGINAL:
I started trying to deploy this script myself in my algorithmic trading but ran into some issues which I have tried to address in this version.
Delayed Signals : The script has been refactored to use a time frame drop down. The higher time frame can be run on a faster chart (recommended on one minute chart for fastest signal confirmation and relay to algotrading platform.)
Repainting Issues : All indicators have been recoded to use the security function that checks to see if the current calculation is in realtime, if it is, then it uses the previous bar for calculation. If you are still experiencing repainting issues based on intended (or non intended use), please provide a report with screenshot and explanation so I can try to address.
Filtering : I have added to additional filters an ABOVE EMA Filter and a BELOW RSI Filter (both can be turned on and off)
Customizable Long and Close Messages : This allows someone to use the script for algorithmic trading without having to alter code. It also means you can use one indicator for all of your different alterts required for your bots.
HOW TO USE IT:
It is intended to be used in the 5-30 minute time frames, but you might be able to get a good configuration for higher time frames. I welcome feedback from other users on what they have found.
Find a pair with high volatility (example KUCOIN:ETH3LUSDT ) - I have found it works particularly well with 3L and 3S tokens for crypto. although it the limitation is that confrigurations I have found to work typically have low R/R ratio, but very high win rate and profit factor.
Ideally set one minute chart for bots, but you can use other charts for manual trading. The signal will be delayed by one bar but I have found configurations that still test well.
Select a time frame in configuration for your indicator calculations.
Select the strategy config for time frame. I like to use 5 and 15 minutes for scalping scenarios, but I am interested in hearing back from other community memebers.
Optimize your indicator without filters (trendFilter and RSI Filter)
Use the TrendFilter and RSI Filter to further refine your signals for entry. You will get less entries but you can increase your win ratio.
I will add screenshots and possibly a video provided that it passes community standards.
Limitations: this works rather well for short term, and does some good forward testing but back testing large data sets is a problem when switching from very small time frame to large time frame. For instance, finding a configuration that works on a one minute chart but then changing to a 1 hour chart means you lose some of your intra bar calclulations. There are some new features in pine script which might be able to address, this, but I have not had a chance to work on that issue.

TradingGroundhog - Fundamental Bot Automation - Fractal/Wave -V1PLEASE READ THE DESCRIPTION - AS THE SCRIPT IS USED FOR AUTOMATION AND TRADING PAIR SWITCH THE MECHANISM CAN BE COMPLICATED TO UNDERSTAND
#-- Pairs Switching - No Repaint - Fractals - Wavetrend --
This strategy uses my fractal/wavetrend previous methods in order to buy/sell.
However, it has been designed in order to switch automatically the pairs on which it trades to reduce the loss and risk.
#-- Synopsis --
To do so, the script uses a Daily wavetrend oscillator. The oscillator is used to find uptrend periods.
From it, the number of uptrend days are counted.
#-- Wavetrend --
For exemple, if BTC/EUR goes from downtrend to uptrend, the script will start to count since how many days the market is uptrend.
Then, if BTC/EUR goes from uptrend to downtrend, the counter will be reset to 0.
The script only trades during uptrend periods.
#-- Pairs --
Up to 35 pairs can be used at the same time. The user can enable of disable to trade on certain pairs.
Uptrend days are counted for each one of those pairs. The user can define on how many pairs the script can trade at the same time.
The select which pairs will be trade, the script sort all the enabled pairs based on their uptrend days counters.
#-- Trade organization --
For exemple if we set 5, as the number of maximum pairs to trade on.
Trades will be conducted on the 5 pairs being in uptrend for the longest time.
Therefore, to organize the money placement on each pair, the equity is used.
For 100% of equity, 10% are kept if losing trades occur.
The remaining 90% are divided by the number of maximum pairs to trade on.
If we chose 5, we will have (90/5) 18% of our capital placed in each bot.
#-- Setting it --
As explained before, this script is used for automation.
For exemple, lets say you are interested by 15 pairs with promising evolution and you set the number of maximum pairs to trade on to 5.
You will have to set alerts for the script on each of the 15 pairs.
You will receive alerts for when to buy and sell.
Note that the script has to be set for each of the selected pairs, it is not able to trade on 15 pairs (thus, webpages) if only set on one Tradingview webpage.
#-- Plot--
Once launch, you can see a plot.
The plot represent the Uptrend days counter for 20 pairs. It also project the organization of the ENABLED pairs.
If a pair is part of the one with the highest number of uprend days. It's name will be displayed under the plot in a yellow comment box.
Four other box are projected to the right of the plot:
White comment : All the pairs sorted from highest number of uptrend days to the lowest.
Red comment : Pairs with the lowest number of uptrend days.
Blue comment : Interesting pairs which will may be uptrend for a long time.
Green comment : Actual pairs with active trading (thus, the pairs with the maximum number of uptrend days)
#-- Bot automation --
If you use 3commas or other trading bot platforms, you will have to set as comments the BUY/SELL alerts. <= Which is what I am doing with it.
Doing so make you trade on multiple pairs, automatically.
However, you will need to set as input the 3commas signal.
For the moment, the script will be needed for it.
However, I will soon release a V2 taking as input the 3commas strategy comments.
For the moment, you can set the script in different webpages and follow BUY/SELL orders by eyes of alerts. ;)
#-- Parameters --
*** Parameters have been intensively optimized using 35 cryptocurrency pairsin order to have potent efficiency for each of them. I would recommend to only change the METHOD SETTINGS. For the others, I don't recommend any modifications. If you need precision on the other parameters of if you want to modify them, more informations can be found in my previous scripts and ***
Filtering method :
Used to reduce or not the risks. If you set Wavetrend, less trades will be conducted as the wavetrend filter from will be used. If you choose Fractal, no Wavetrend signals will be used.
(I prefer to use Fractal as I am using 1 or 3 minutes timeframes for the moment.)
Market Pairs : You can select on which markets the script will trade by enabling it's checkbox.
*** Also, for the moment, due to Pinescript limitation, I cannot set as input the number of active pairs. So I set 5, after optimization, as the default number of maximum pairs to trade on. Thus, you should open webpage for each ENABLED pairs and load the script in each on them. 5 Tradingview webpage will always be active. ***
#-- Timeframe --
You can use the script for Short or Long term trading:
For Short term, you will have to use 1 or 3 minutes timeframes, depending on the volatility of the market. (What I am using)
For Long term, you will have to use 5 or 15 minutes timeframes, depending on the volatility of the market.
#-- Strategy abilities and results for more than a month of activity -- *** !!! IMPORTANT SECTION !!! ***
I have simulated the profit for the 21 ACTIVE pairs I selected has been potent with my Fractal strategy. Different maximum number of trading pairs were used in order to find the best one. The script was run for the last 46 or 30 days.
Different timeframe have been used as pairs have different volatility.
*** If you use the script, SET IT UP with the following pairs and the following timeframes. ***
-------------------------------------------------------------------------------------------------------
Parameters | Maximum number of trading pairs
-------------------------------------------------------------------------------------------------------
Timeframe | Pairs | 1 2 3 5 6 10
-------------------------------------------------------------------------------------------------------
3M | SHIB | 0 0.98 3.63 2.17 2.56 2.56
1M | SOL | 0 1.5 1.08 1.26 0 0
3M | XRP | 10.5 4.56 3.29 2.19 1.52 1.52
3M | ETH | 9.94 6.97 4.55 3.45 2.19 2.19
3M | BTC | 1.7 2.32 1.74 1.88 1.33 1.33
3M | DOT | 0 3.5 2.32 2.27 1.99 1.99
1M | DOGE | 0 0 0 3.14 1.93 1.93
1M | LUNA | 0 0 0 0.23 2.35 2.35
3M | AVAX | 8.92 0 0.53 3.63 1.17 1.17
1M | HOT | 0 0 2.12 7.96 4.69 4.69
3M | GRT | 0 -1.09 -0.82 0.25 -0.191 0
1M | LINK | 0 0 0 0 0 0
1M | CHZ | 0 0 0.4 0.85 1.89 1.91
3M | WIN | 0 0 0.52 5.89 2.8 2..8
3M | ENJ | 32.63 15.65 12.55 10.31 5.62 5.62
3M | RUNE | 0 4.68 3.42 -1.18 2.3 2.3
3M | LTC | 0 -0.06 1.1 1.29 3.49 3.49
3M | BTT | 0 0 0 0.85 1.63 1.63
3M | BCH | 0 0 0 1.36 2.36 2.36
3M | WRX | 0.26 4.66 5.36 4.29 3.01 3.01
3M | ETC | -0.92 0 0 3.6 3.31 3.56
-------------------------------------------------------------------------------------------------------
Net profit % | 63.03 43.67 37.24 55.69 45.949 43.61
Number of days | 46 30 30 46 46 46
Net profit % per day | 1.38 1.46 1.25 1.22 1.00 0.95
-------------------------------------------------------------------------------------------------------
*** Therefore, we are around more than 1% per day in each case. ***
#-- Choosing pairs --
I selected the 35 cryptocurrencies which can be exchange with EUR and evaluated the ability of my Fractal script on them. The on which have been ENABLED (true) are the best.
BINANCE:SHIBEUR | true
BINANCE:SOLEUR | true
BINANCE:XRPEUR | true
BINANCE:ETHEUR | true
BINANCE:BTCEUR | true
BINANCE:DOTEUR | true
BINANCE:ENJEUR | true
BINANCE:DOGEEUR | true
BINANCE:LUNAEUR | true
BINANCE:VETEUR | false
BINANCE:BNBEUR | false
BINANCE:AVAXEUR | true
BINANCE:HOTEUR | true
BINANCE:EGLDEUR | false
BINANCE:GRTEUR | true
BINANCE:MATICEUR | false
BINANCE:LINKEUR | true
BINANCE:CHZEUR | true
BINANCE:ICPEUR | false
BINANCE:UNIEUR | false
BINANCE:WINEUR | true
BINANCE:ADAEUR | false
BINANCE:RUNEEUR | true
BINANCE:TRXEUR | false
BINANCE:THETAEUR | false
BINANCE:EOSEUR | false
BINANCE:LTCEUR | true
BINANCE:XLMEUR | false
BINANCE:BTTEUR | true
BINANCE:SXPEUR | false
BINANCE:LAZIOEUR | false
BINANCE:YFIEUR | false
BINANCE:BCHEUR | true
BINANCE:WRXEUR | true
BINANCE:ETCEUR | true

DCA Bot Long/Short Thanks to @TheTradingParrot for the inspiration and knowledge shared.
Thanks to @ericlin0122 for the original DCA Bot Emulator which is the backbone of this strategy.
The script simulates DCA strategy with parameters used in 3commas DCA bots for futures trading. Experiment with parameters
to find your trading setup.
Beware how large your total leveraged position is and how far can market go before you get liquidated!
Do that with the help of futures liquidation calculators you can find online!
I`ve added:
1) an internal average price and profit calculating, instead of TV`s native one, which is subject to severe slippage.
2) I`ve built a graphic interface, so levels are clearly visible and back-test analyzing made easier.
3) now both Long & Short direction of the strategy exist.
4) trailing TP which was featured in the initial script has been removed because TV`s execution model makes
it impossible to know how the real world trailing would have unfolded.
5) the table is self explanatory, and it is there to help you discover what happened and where.
6) vertical colored lines appear when the new maximum deviation from the original price has
been reached
All the trading happens with total account capital, and all order sizes inputs are expressed in percent.
Known issues:
When deviation is small, and the same candle triggers safety AND the close order, the initial orders are closed, but a
new one opens on the next candle. This is "resolved" by closing the unwanted trade forcefully on the next candle, affecting
profit calculating minimally and guaranteeing that what should be closed has been closed.
The code could be improved through use of arrays, making the table flexible so the number of rows should be dynamic depending
on the number of SOs.
!!!!! IMPORTANT!!!!!
This strategy script is made to receive a signal from an exterior study script, which should plot +100 for long or -100 for short
entry (that is by default - values can be changed in the strategy settings menu). That plot should be found in "Enter Trigger" input
dropdown menu at the bottom of strategy settings menu. Removing the "and trigger == long/short_trigger" condition from strategy entry
conditions makes the strategy open trades ASAP.
Cheers!

Crypto Money Bot - Trading Bot for Bitcoin (BTCUSD)This takes my previous script, adds even more logic conditions, and sets up long and short entries in a strategy that can trade.
Default settings with a $5,000 starting balance have shown this bot to get the following results:
Net Profit: $ 10302.70 / 206.05 %
EXAMPLES
LOGIC
This indicator looks for accumulation of buying and selling along with trend flows for oversold and overbought opportunities to align the trade entries. It does not trade all the time, but when it does pull a trade the success rates are higher.
You could choose to pair this with another indicator to do a manual entry, or to manage your stop losses and money management strategy.
PROOF
Check out the reviews on the original indicator that this is built upon (and more logic) is here:
NOTES
You can try this strategy on other charts if you want, it is only tested and supported on BTCUSD. To try it on ETHUSD, change the settings from BTC to ETH. If you get a "resolve_error" it means that specific coin is not supported.
ACCESS
If you'd like to use my custom indicator - send 0.05 BTC to 32Hagdtq7PCR4inF4ZPkCReEjyecm2eNaP then email me at samurai_crypto@protonmail.com with your TradingView username and your transaction ID and I will add you.
Costs are lifetime with full support via email on how to use it.

BTC 4h bot 2.0 StrategyThis is Strategy version of BTC 4h bot 2.0.
Optimized for pairs BTC vs stablecoins, 4h timeframe.
HOW IT WORKS:
Script is based on the fact that there are certain phases of the market when there is a greater probability that BTC will go to one side or the other. To evaluate which phase we are in, the script uses "Main trend" and "Confirmation signals".
Main trend
- Is composed of a combination of several supertrends and moving averages. A Supertrend is a trend following indicator that helps in identifying whether we are in an uptrend or a downtrend. A higher factor is used to capture the main trend and not just small movements. In case the market goes sideways, the Supertrend does not work well, so it is a combination of multiple supertrends along with moving averages to differentiate a real strong trend from a range.
- It can be seen on the graph as a thick solid line.
- In an uptrend is green, in a downtrend red, gray represents the neutral zone.
Confirmation signals
- Are several script-evaluated indicators such as RSI , MACD , ADX and others, which serve to confirm the trend. In this case, it is the opposite way to the Main trend. Confirmation signals are used here to detect small movements. They are trying to capture bullish and bearish price momentum.
- On the graph they are seen as dashed lines above or below the Main trend (in the gray zone they are in the middle).
- It indicates only two signals, green for buy and red for sell.
HOW TO USE IT:
if the Main trend and Confirmation signals are of the same color, it will send a buy or sell signal, depending on which phase of the trend it is in. If the Main trend is e.g. in an uptrend and the market is going up, Confirmation signals should generate a lot of signals. But if the market starts to go in the opposite direction, Confirmation signals should generate fewer signals or none at all, thus reducing the number of wrong trades. In the gray zone of the Main trend it does not open positions.
To close position is possible to use stop loss and take profit or alternative could be to set very high TP value, thereby letting the script close the positions by itself.
The default setting is:
TP: 3.9%
SL: 4.7%.
In this case, it is a strategy to find out how the script worked in the past period. The longest period in which it is possible to test BTCUSD is on the Bitstamp exchange. The script works consistently well over a long period of time, using past probabilities, but this does not guarantee future results.

Combined Strategy Trading Bot (RSI ADX 20SMA)Trading Bot V1, This code implements a combined trading strategy that uses several indicators and strategies to make buy and sell decisions in the market. The code is written in Pine Script™, which is a programming language used in the TradingView platform. By BraelonWhitfield.Eth
The strategy uses the Average Directional Movement Index (ADX) and the Pine SuperTrend indicator to identify trends and price movements in the market. The SuperTrend indicator is a popular technical analysis tool that helps to identify the direction of the current trend and provides entry and exit points for trades.
The strategy also uses the Relative Strength Index (RSI) to identify overbought and oversold conditions in the market. The RSI is a momentum indicator that measures the speed and change of price movements in the market.
The first part of the code defines the inputs for the ADX and DI Length, which are used to calculate the ADX and DI values. The dirmov() function is used to calculate the positive and negative directional indicators (plusDM and minusDM) based on the high and low prices. The truerange variable is then calculated using the True Range (TR) formula. Finally, the plus and minus variables are calculated using the smoothed moving average of the plusDM and minusDM values.
The adx() function is then used to calculate the ADX values based on the plus and minus variables. The Pine SuperTrend indicator is defined using the pine_supertrend() function. This function uses the high-low average (hl2) and the Average True Range (ATR) to calculate the upper and lower bands for the indicator. The direction of the current trend is then determined based on whether the current price is above or below the upper or lower bands.
The RSI values are then calculated using the ta.rsi() function, with the inputs for the close price and the RSI period. The overbought and oversold conditions are defined using the OB and OS inputs, which specify the threshold values for the RSI. The upTrend and downTrend variables are defined based on the direction of the Pine SuperTrend indicator.
The next part of the code defines the 20-period Simple Moving Average (SMA) using the ta.sma() function. The os and ob variables are then calculated based on the RSI values and the OB and OS inputs. The strategy.entry() function is used to define the buy and sell orders based on the upTrend and downTrend variables, as well as the Pine SuperTrend indicator, the 20-period SMA, and the os variable.
The final part of the code defines the Channel Breakout Strategy using the ta.highest() and ta.lowest() functions to calculate the upper and lower bounds of the channel. The strategy.entry() function is then used to define the buy and sell orders based on whether the current price is above or below the upper or lower bounds.
In summary, this code implements a combined trading strategy that uses several indicators and strategies to make buy and sell decisions in the market. The strategy is designed to identify trends and price movements in the market, as well as overbought and oversold conditions, to provide entry and exit points for trades. The strategy uses the Pine SuperTrend indicator, the ADX and DI indicators, the RSI, and the 20-period SMA, as well as the Channel Breakout Strategy to make informed trading decisions.
