BOT Buddy v3Bot Buddy is a script that uses customized indicators to give out signals for a number of different assets with high probability and really good risk to reward.
Bot Buddy will provide:
- Entry signals with alerts
- Stop Loss
- Two Take profit targets
- Break Even signals with alerts
How does it work?
-Uses a Trend direction to find trades going in the right direction
-Uses a customized Volume, EMA's, candle pattern and ATR to find entries
Signals:
-Green Arrow-long
-Red Arrow-short
-Red line- STOP LOSS
-Blue lines- Take Profits
The Script is designed to be very user friendly as it'll post all the information you'll need for each trade on every entry signal.
For access, please DM us or visit the link below in Signature.
"bot" için komut dosyalarını ara


BotDCA | Algorithmic Smart DCA Bot🌌 What the script does, how it does ?
At the heart of its algorithm, this script incorporates the concept of Dollar Cost Averaging (DCA), a method of periodically allocating funds to an asset to mitigate the effects of market volatility.
Before we start, it's important to clarify that the script is adapted for the cryptocurrency market on USDT & USDC pairs in Spot, and on the Daily timeframe (D).
For this reason, and to optimize profits, the script will generate very few buy and sell positions.
Please also note that the script does not repaint.
Essentially, BotDCA generates buy and sell orders.
These buy and sell orders are generated using the following logic :
BUYING LOGIC :
• Volume : Current volume is compared with a linear percentile of volume over a short period.
This means that if current volume is higher than observed volumes over this period, the volume criteria is considered valid.
• Momentum & Volatility : The Average True Range (ATR) indicator adjusted by a square root is used as a measure of volatility.
Momentum is then calculated as the difference between the current closing price and a short moving average, normalized by this adjusted volatility.
The oversold condition is validated when momentum exceeds a specific level.
For the buy order to be triggered, the volume, momentum and volatility criteria must be validated.
SELLING LOGIC :
• Volume : Similar to the buy logic, the volume criteria is validated when current volume is higher than previous volumes.
• Momentum & Volatility : Volatility is measured using the adjusted ATR indicator, similar to the buy logic.
An overbought condition is validated when normalized momentum, calculated as the difference between the current closing price and a volatility-adjusted short-period moving average, exceeds a specific level.
• Trend : The general market trend is considered for the sell logic.
The trend criteria is validated when the current moving average is higher than that of the previous period.
For the sell order to be triggered, the volume, momentum, volatility and trend criteria must be validated.
These orders are also adjusted according to what the user defines as buy and sell settings :
🔵 Buying settings
• Quantity per order ($) : Defines the amount in stable coins to be invested for each buy order.
• └> Mult. quantity (x) : Multiplication factor applied to the buy quantity for successive orders, enabling the investment to be increased in the event of a price fall.
Example : If Quantity per order is $200 and Mult. quantity is x2, then the second buy order will be $400, the third buy order will be $800, the fourth buy order will be $1600 ...
After a sell order, the multiplier is cancelled.
Note : If value is set to 1 : Disabled
• └> Max. quantity (x) : Sets a maximum purchase quantity limit, preventing orders from exceeding this amount.
Example : If Quantity per order is $200, Mult. quantity is x2, and Max. quantity is $700, then the second buy order will be $400, the third buy order will be $700, the fourth buy order will be $700 ...
Note : If value is less than Quantity or is set to 0 : Disabled
• └> If Price > Average price : Enable or disable quantity multiplier when current price exceeds average price.
• Min. delay (in days) : Establishes a minimum interval in days between two successive purchases to avoid investing too close together.
Example : By default the time interval for the bot is set to D, so if you set 20 as the value, the bot will wait at least 20 days between buy orders before entering a position.
Note : If value is set to 0 : Disabled
• └> Min. deviation (%) : Defines the minimum price difference in percent to trigger a new purchase after the first.
Note : If value is set to 0 : Disabled
• └> Mult. deviation (x) : Apply a multiplication factor to the price differential for successive buys, progressively increasing the purchase interval.
Example : If Mult. deviation is 10% and Min. deviation is x2, then between the first and second buy orders the minimum deviation will be 10%, between the second and third buy orders the minimum deviation will be 20%, between the third and fourth buy orders the minimum deviation will be 40%...
After a sell order, the multiplier is cancelled.
Note : If value is set to 1 : Disabled
• Display help for these settings : On chart, displays help text about buying settings.
🟢 Selling settings
• Quantity (% position) : Percentage of the position to be sold in each sell order.
Example : If the first buy order is 0.1 BTC and the second buy order is 0.2 BTC, then the position is 0.3 BTC.
If Quantity (% position) is set to 20, then the first sell order will be 0.06 BTC (20% of 0.3 BTC), the second sell order will be 0.048 BTC (20% of 0.24 BTC) ...
(Auto ?) : If this option is enabled, the bot will automatically sell part of your position.
The quantity sold depends on the volatility of the last 30 days : the higher the volatility, the more it sells, and the lower the volatility, the less it sells.
The minimum sale defined is 10%, while the maximum sale will not exceed 50%.
• └> Min. deviation (%) : Minimum percentage of price deviation to trigger a sale.
Example : If Average price of BTC is 30 000 USDT and Min. deviation is 10%, then the first sell order will be at least 33 000 USDT, the second sell order will be at least 36 300 USDT ...
Note : If value is set to 0 : Disabled
(Auto ?) : If this option is activated, the bot automatically determines the sell minimum deviation percentage.
The deviation set depends on the volatility of the last 30 days : the higher the volatility, the higher the deviation, and the lower the volatility, the lower the deviation.
A start and end date defines when the script should generate buy and sell positions :
📆 Date settings
• Start date : Indicate the script launch date (If it’s a new launch, you must choose today’s date before creating your TradingView alert).
• End date : Enter the date on which you want the script to stop.
Other parameters can be configured to fine-tune buys and sells :
⏲️ Trading session settings
• Days : Allows you to select the specific days on which the script will be active, offering the possibility of excluding certain days.
🏛️ Exchange settings
• Fees (%) : Indicate the percentage fee applied by the exchange platform on each transaction.
• Price spread (%) : Specifies the price spread to be considered for realistic order adjustment.
🤖 Bot settings
• Add to Position ? : Allows tokens to be manually added to the position when the script is launched.
• └> How much ? (Base) : Number of tokens to add.
• └> Cost ? ($) : Stable coins amount of addition to position.
These settings are included in the calculation when an order is triggered.
Advanced visual customization options can be modified :
🎨 Visual settings
• TradingView Theme : Choose between a light or dark theme for the bot interface.
• Panel : Enables or disables the display of the information panel on the graph, and modifies its size and alignment.
• Positions : Show or hide buy and sell position labels on the chart, and modify their size and appearance (several display modes : basic, simple, advanced).
• Average price : Enables or disables the display of the average price line and modifies its size and color.
• Simulator : Enables or disables the ATH percentage-based simulator line and modifies its size and color.
• Trading session : Displays or hides the background of specified trading sessions.
• Hide warning messages ? : Hide or show warning messages on graph.
A profit simulator can be configured :
🕹️ Simulator settings
• Price (% ATH) : Determines a percentage of the token's ATH to simulate potential gains if the token reaches this price level again.
Users can also activate buying and selling alerts in the settings :
🤖 Bot settings
• START THE BOT ? » ALERTS ON : REAL MODE : Enable or disable the bot to execute real orders based on alerts.
• Mode FULL Auto ? : Enables the Mode FULL Auto, requiring additional configuration for connection to exchange APIs.
• └> Password FULL Auto : Password required to activate the Mode FULL Auto.
By activating FULL Auto Mode with TradingView's webhook system, the user can connect the script to the APIs of compatible exchanges, and receive notifications of buy and sell orders by e-mail, Telegram or Discord.
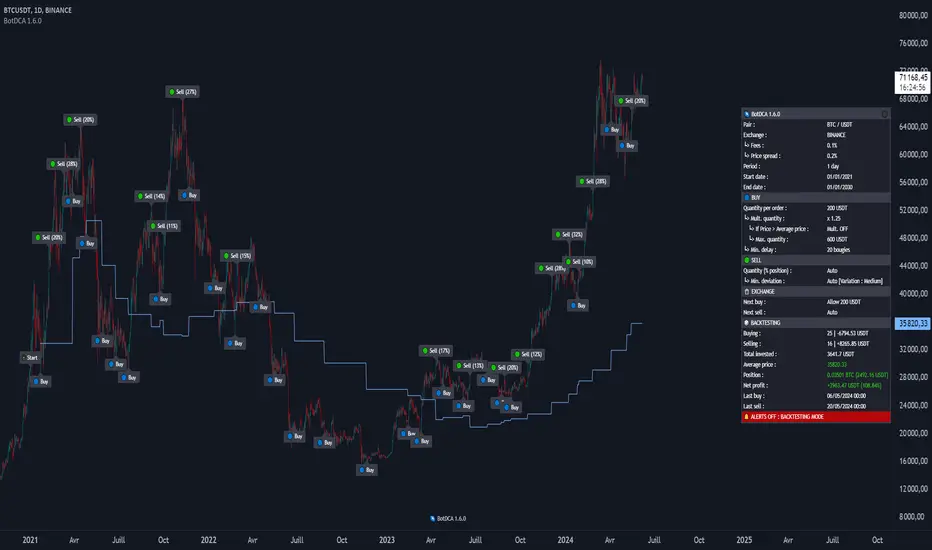
On the chart, a panel displays a variety of information, and also a backtesting / result of the script.
Here is a list of elements displayed by the panel :
💻 Informations panel
General :
• Pair
• Exchange
• └> Fees
• └> Price spread
• Period
• Start date
• End date
• Trading days
Buying
• Quantity per order
• └> Mult. quantity
• └> Max. quantity
• └> If Price > Average price
• └> Min. deviation
• └> Mult. deviation
• Min. delay (in days)
Selling
• Quantity (% position)
• └> Min. deviation
Exchange
• Next buy
• Next sell
Backtesting / Results
• No. of buys
• No. of sells
• Average price
• Actual position
• Actual net profit
• └> Simulator
• Last buy
• Last sell
🌌 About default settings
Default settings are defined as an example.
Above in the description, you will find details of each setting.
Here's a description of how user-defined setting categories affect the script's buy and sell positions :
📆 Date : Determines between which time ranges buy and sell positions are generated.
⏲️ Trading session : Exclude selected days disables buy positions on deselected days.
🕹️ Simulator : Does not affect buying and selling. It is for information purposes only.
🏛️ Exchange : Fees should be as close as possible to your exchange and price spread depends on your tolerance. This affects buy and sell position.
🔵 Buy : Depending on your investment capacity and risk management, these settings have an impact on buy positions.
🟢 Sell : These settings determine profit-taking. This has an impact on sell positions.
🎨 Visual : Does not affect buy and sell positions. For information only.
🤖 Bot : This part is mainly used to use the script with TradingView alerts. Only the 'Add to position' option affects buy and sell positions.
Once you've set all your settings for the script, you can view the backtesting displayed in the panel on the chart.
🌌 How to use it ?
To summarize how to use this script successfully, please follow these steps :
1. First, choose a cryptocurrency pair (e.g. BTC/USDT).
2. Set a start date (preferably today's date if it's your first launch) and an end date.
3. According on your preferences, you can choose specific trading days, or default to all days of the week.
4. Depending on your exchange, you can set fees and a price spread.
5. Then, based on your portfolio management and investment capabilities, define buy and sell parameters.
6. You can set the bot's appearance on the chart.
7. Once you have configured your settings, you can choose a simulation price.
8. Finally, to activate TradingView Alerts, check the box START THE BOT ? ALERTS ON : REAL MODE.
🌌 Overview
Here's a preview of the script with a few screenshots :
BTC/USDT • Basic display
SOL/USDT • Simple display
XRP/USDT • Advanced display
MATIC/USDT • Light theme
Script settings
🌌 Why do I have to pay ?
BotDCA uses advanced indicators and complex calculations to identify buying and selling opportunities.
With TradingView's alert system, it automates your investment strategy, eliminating the need for constant manual analysis and constant market monitoring.
This saves you precious time.
With adjustable buy and sell settings, you can customize the script to suit your risk tolerance and investment objectives.
This flexibility adds considerable value, allowing you to optimize the script to suit your situation.
Paid access ensures that you benefit from ongoing support and updates, which are essential for maintaining the script's effectiveness.
🌌 Disclaimer
This script is provided for educational purposes only and should not be construed as investment advice.
Users should be aware that trading in the financial markets involves risks, and that past performance of a script does not guarantee future results.
It is strongly recommended that you carry out a detailed analysis and consider your financial situation and risk tolerance before committing yourself to trading/investing.
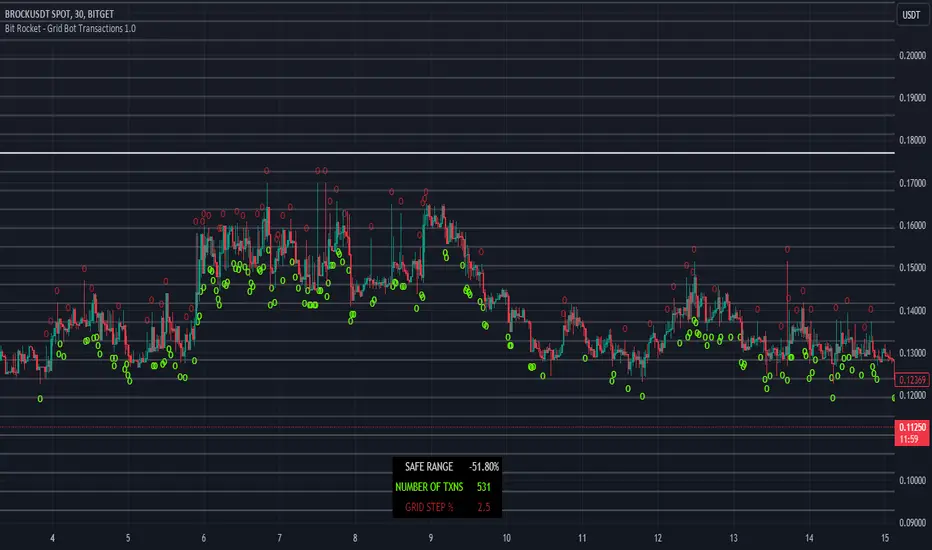
Bit Rocket - Grid Bot Transactions 1.0DESCRIPTION
A grid bot is an automated trading bot that is designed to execute buy and sell orders based on a pre-defined grid of prices. Grid bots operate within a specified price range, placing trades at set intervals above and below the current market price. The key idea behind a grid bot is to take advantage of price fluctuations and market volatility.
The Grid Bot Transactions Indicator serves as a valuable tool for identifying the most suitable trading pairs and optimizing the grid bot percentage, also known as the grid level configuration. This indicator assists in the selection of pairs that are likely to yield the best results and aids in determining the ideal configuration for grid bot trading.
USAGE
NUMBER OF TRANSACTIONS - will calculate the number of times the price moves up and down by the grid level percentage for a particular trading pair. Each move up and down is counted as a transaction, total transactions are then calculated from the date range set by the user.
RANGE - number represents the swing from the highest price to the lowest price during the date range set by the user, this will assist in determining what grid range could be used when configuring the grid bot.
GRID STEP (%) - This is the distance for each buy and sell set by the user, for example if the grid step % is set at 2% then for each 2% move up or down that occurs will count as one transaction. Try different grid step percentages to see what percentage produces the best results, too high and transactions will lower but profit per sell transaction will be greater, too small results in higher trading fees and lower profit per sell transaction. Using 1.5% - 5% for the grid step will make the most sense.
Armed with this knowledge the user can now compare against other pairs, determine the optimum grid level percentage, which pairs have more transactions, and determine transaction trend.
SETUP
When you first add the indicator to the chart you will see a pop-up reminding you to set the From Date Time for Bit Rocket Grid Bot Transactions 1.0, just click anywhere on the chart to add.
1. Change timeframe to 30m
2. Under Inputs – Grid Settings change the From Date & Time field
3. Under Inputs – Grid Settings change Size of Grid % or leave at default 2.5%
4. If grid and buy and sell symbols are in the way, go to ‘Style’ tab and turn off all the signals and Lines options.
CS Trading Bot Study - Crypto EditionWhat is this Study about?
The CS Trading Bot Study is for getting Open Long (Buy) and Close Long signals (Sell) that you can use to get alerts in various ways (Webhooks, Emails, etc).
The Study is very profitable for a vast amount of Crypto assets and the algorithm behind is not overfitted.
How to use it?
Make sure to start your research and find your favorite Crypto assets using the corresponding strategy:
The research process is very important as you can see beforehand how well the alerts for this Study would perform.
Make sure to read the Strategy's description, as well!
After you found your Crypto assets of interest using the corresponding Strategy...
Open a new chart for each asset and add the Study from your favorite indicators.
Click on the alert symbol on your chart and from "Condition" choose the "CS Bot" Strategy.
Then below choose "CS Bot Buy Alert" and "CS Bot Sell Alert" (each separate alerts).
Under "options" check "Once per bar" (very important) .
Pick your desired way of getting the alerts (app, popup, email, webhook).
The webhooks for setting alerts are very interesting as you can forward your signals to your own trading bot or simply wait until my trading bot is available (currently in development)
Since I develop myself, rest assured it will be available soon. Look out for comments below as soon as it is available!
How to access?
If you are interested to get access to the complete package, please don't hesitate to send me a private message for a quote.
The amount of concurrent users using the package (=licenses) is limited to max. 500 a month (more we cannot manually handle has Tradingview has no automation for this yet).
Access to the bot package is based on a monthly basis. If you get access, you will asked in person at the end of the month if you want to continue or not.
The monthly fee depends on the demand, but for as long as you continue using the package your initial price stays the same!

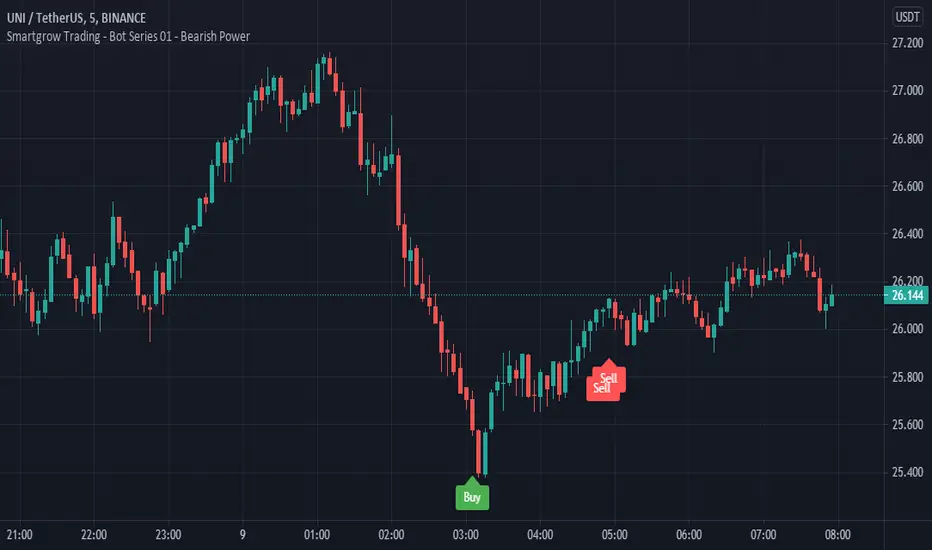
Smartgrow Trading - Bot Series 01 - Bearish PowerWelcome to our first Tradingview trading bot.
We develop signals which have been specially developed for crypto trading bots. We publish new indicators at regular intervals.
The main idea behind the bot is to use custom created indicators in a short and longer term timeframe to signal potential trendreversals in downtrends or ranging markets. The bot is not waiting for a trend confirmation signal before entering a trade, on the contrary, the bot waits for statistical extreme values to open a trade. When potential signals are detected we are trailing price to find the best spot to enter a trade. With this approach we buy in strong oversold areas as these have great potential to move in the other direction again. The sell signals are also generated by this custom indicator only selling off, if a stronger recovery in the market has occured. The potential profit margin is therefore between the best possible entry into a heavily oversold market and a recovery of the market.
So this tradingbot isnt designed to work with take profit, stop loss or trailing stop loss. This would result in a long term loss and is therefore not recommented. Also the bot is not tested in any other market like futures or stocks. So we recommend to use it in crypto spot market only.
Depending on market situations, potential losses can occur when a market is strongly bearish and does not want to recover over a long range, or when the bot has entered a trade to early. We have built in a safety mechanism for detecting further downtrends to avoid major losses. This mechanism is part of the needed risk management Therefore we are suggesting to use a proper risk management so only use 2-5% of your funds per trade. We use this bot with 2,5% funds per trade for our personal use. The study needs to be set up in the 5 min chart to work and you need to set up one buy alarm and one sell alarm per pair. The Signals are very picky therefore it is suitable to apply it on all possible pairs on your exchange excluding stable and shitcoins. You could test it in other financial markets but the bot was developed especially for crypto markets. If you have questions regarding pairs or want to see real life performance, feel free to contact us.
This indicator using different timeframes so it is sending a repainting warning. Cause it calculates values in a different timeframe. But thats normal and it wont recalculate results.
We sell this indicator so it is invite only. But of cause you can test it before buying.
If there are questions, write them into the comments or contact us directly over the direct message. Happy Trading!
Skript nur auf Einladung
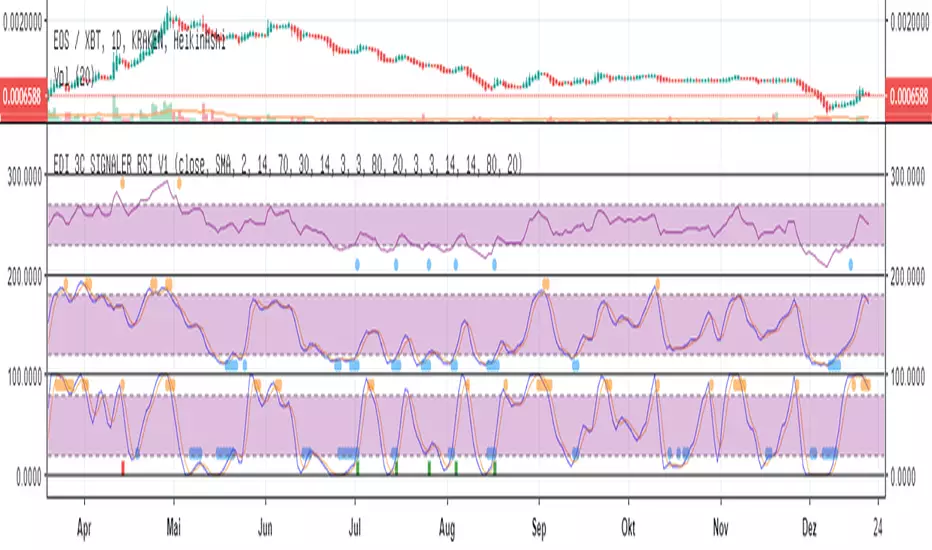
Eds Bot Signaler on Basis of RSI Stoch StochRSIEDS AWESOME BOT SIGNALER
Specially for use with e.g. 3commas or autoview
But can also be used just in normal manual (visual) mode
This Script is very early Beta. Works for visual manual use....
and also for 3Commas Bot as "Signaler" (how to connect with Bot, see the docu on 3commas).
... but can use as Signaler for any Bot who is able to get Tradingview sms-mails. (e.g. autoview)
It combines RSI, Stoch and Stoch-RSI.
You can choose normal RSI, or " returning RSI " (signals when leaving the sell/buy-zone. much higher profits with this)
You can choose how many of the indicators are needed to "fire".
You can choose if one of the indicators is a "must"
For Stoch & Stoch-RSI you can Choose sma or ema calculations of the moving average.
All the Values speak for themselves, if you are used to technical analyses (stay away in the moment, if you dont know, what rsi, stoch etc is used.
The Signals are also shown in the chart, the single ones, but also the combined which fires the Bot-Signal (shown as green and red column-candle at bottom)
Enjoy !! Free use in the moment.
More detailled Explanation in the future. Just play around!
If you wanna give something back:
BTC: 15buigKjh4JYnuVwcEWiYMpYvP3Lbp4ypL
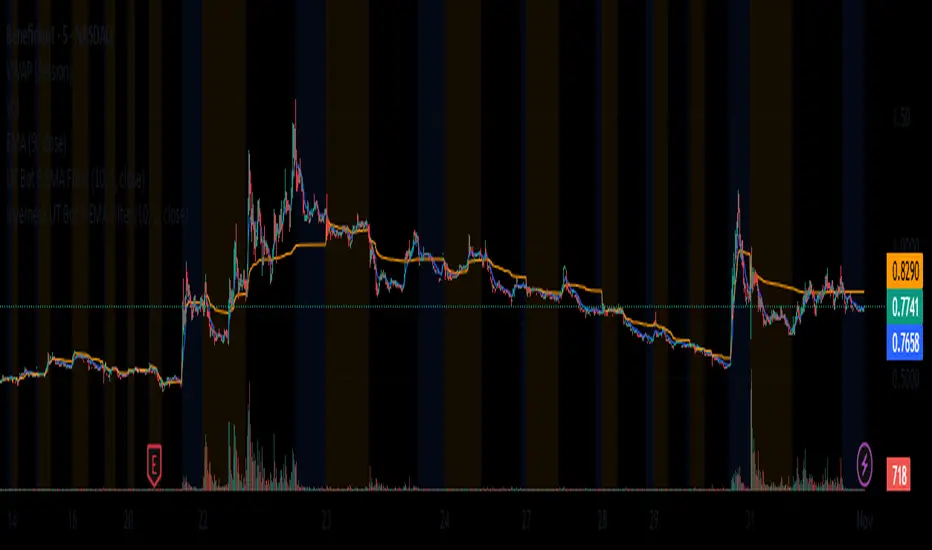
UT Bot Stochastic RSIUT Bot Stochastic RSI is a powerful trading tool designed to help traders identify potential buy and sell signals in the market. This indicator combines the Stochastic and RSI (Relative Strength Index) oscillators, two of the most popular and effective technical analysis tools, to provide a comprehensive view of market conditions.
The Stochastic oscillator is a momentum indicator that compares a security's closing price to its price range over a given time period. The RSI, on the other hand, is a momentum oscillator that measures the speed and change of price movements. By combining these two indicators, the UT Bot Stochastic RSI can help traders identify overbought and oversold conditions, as well as potential trend reversals.
The UT Bot Stochastic RSI also includes an ATR (Average True Range) trailing stop, which can be used to set stop-loss levels and manage risk. This feature is particularly useful in volatile markets, where price movements can be large and unpredictable.
In addition to its powerful technical analysis tools, the UT Bot Stochastic RSI also includes a backtesting feature, allowing traders to test their strategies on historical data. This can help traders identify the most effective settings for the indicator and improve their trading performance.
Overall, the UT Bot Stochastic RSI is a versatile and effective tool for traders of all levels, providing valuable insights into market conditions and helping to improve trading decisions

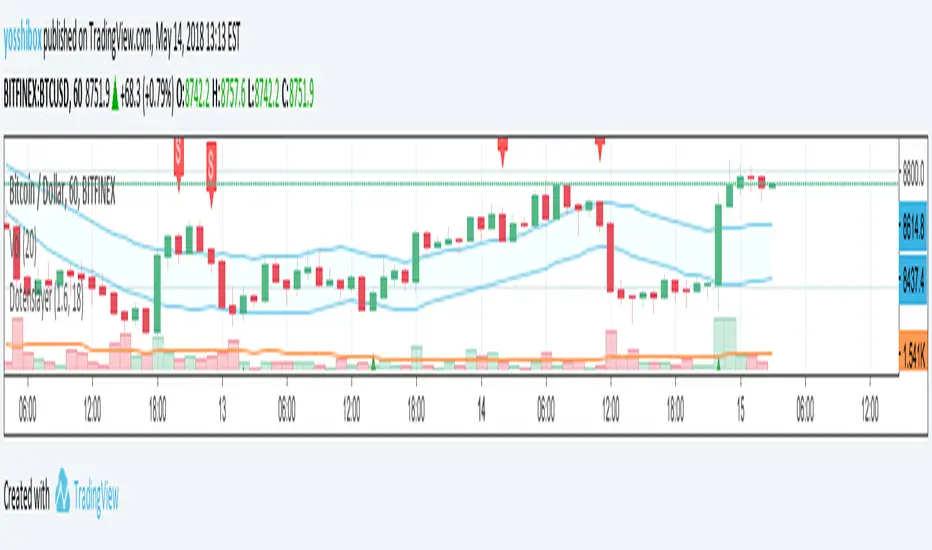
Dotenslayer : An open range breakouts method indicator for botThis script shows the long and short points of certain Japanese bots like 'DotenKun' which use open range breakouts method.
Searching recent 18 bars as default and shows the range calculated with a factor (default k = 1.6). You can edit this condition by yourself.
When filled the long or short conditions, also shows the indicator on the price chart to help your trading on BTC.
Also, this script can make alarm events related to those conditions.
This script only works for BTCUSD, XBTUSD, BTCJPY, FXBTCJPY with 1H time span.
Disclaimer :
I don't own the source code of the certain bots and I didn't directly reference the source code of it.
So which means, I don't guarantee this script works as same as the bots works.
Also, I didn't mean to disturb their trading bot businesses.
Your donations are welcome! :
BTC : 327MqYGfHJFC7LRijGwQZXdTAyFwvYCzyv
ETH : 0x5E270c3667E65ba6158D292a98c5b54F81AfCAf1
UT Bot + LinReg Candles (Dual Sensitivity)
Script Description:
This indicator combines the popular UT Bot Alerts system with Linear Regression Candles (open source) for enhanced trend detection and trading signals in one singel script. The UT Bot features independent, then 2 x ATR sensitivity and periods controls for buy and sell signals, allowing you to fine-tune entries and exits to match your strategy. The script also overlays colored Linear Regression Candles with an optional signal line, helping you visually identify trend strength and direction. All calculations are performed on standard chart prices (no Heikin Ashi). Suitable for all asset classes and timeframes.
Eample setting for usdjpy 5 min chart for repeated buy and sell singnals based on trend:
BUY ATR period 300 multiplier 1
SELL ATR period 1 multiplier 2
Disclaimer:
This script is for informational and educational purposes only. It is not financial advice. Use at your own risk; the author assumes no responsibility for any trading results or losses.
Credits goes to to Ugurvu for linreg candles and quantnomad for UT Bot alerts that make this script possible.
Author: Patrick

Grid Bot SimulatorThis script is a grid bot simulator for ranging/choppy markets. Prices are divided into grids, or trade zones, that will trigger signals each time a new zone is entered. During ranging markets, each transaction is followed by a “take profit.” As the market starts to trend, transactions are stacked (compare to DCA), until the market consolidates. No signals are triggered above the Upper Limit or Below the Lower Limit.
Settings overview:
Upper Limit/Lower Limit : Highest and Lowest values for entire grid.
Number of Grids : Number of trade zones.
Show Grids : Show or hide all gridlines.
Show Only Current Grids : Only display the grids just above and just below the current trade zone.
High/Low for signals : If enabled, signals are triggered as soon as the price touches the next zone. If disabled, signals are triggered after bar closes. Enable this for “Once Per Bar alerts. Disable for “Once Per Bar Close” alerts.
Highlight Trade Zones
The grid bot should work well during ranging/choppy markets. Each zone will have only one trade, and then will immediately take profit in the next zone.
Ranging/Choppy Market
However, trending markets can produce multiple signals in rapid succession:
Trending Market
If the gridlines are compressing the chart space, enable the “Show Only Current Grids” in settings.
Show Only Current Grids disabled
Show Only Current Grids enabled
When changing symbols, adjust the Upper and Lower Limits to accommodate the new symbol. Otherwise, the chart will look compressed.
XBTUSD chart with ETHUSDT settings
The bot is a proof-of-concept and is considered experimental . Possible future updates will include Fibonacci grids and “smart entry/exits,” depending on the current trend. Comments and suggestions are encouraged.

BB BotThis bot is automating signals based on Bollinger Band deviations. Both arrows and '+' signs are potential entries given when price violates one of the outer bands.
1st profit target is the BB mid-band (thinner inside line running in parallel with the BB envelope ).
2nd and final profit target is the opposite outer BB, as per conventional BB theory.
BB Width can be used to better time signals when the Bollinger bands are contracting.
The bot also automatically plots sup/res levels to indicate good location for taking trades (and exiting them). In this example I have included Better SCMR for extra confluence when taking entries.
Very efficient for discretionary scalping on down to 15 min, but also a super useful tool to get good location on higher timeframe entries, e.g. sup/res levels can automatically be derived on daily/weekly charts and entries can be fine tuned down to H1/H4.
The bot can also be fully automated by using TV signals on entries and exits and feeding those into an execution platform.
PM through TradingView for access information.

Grid Bot Visualizer V1
📊 Grid Bot Visualizer – V1
A dynamic and visual support tool for grid trading strategies.
🔧 Key Features
• Fixed grid levels based on a central entry price
• Customizable spacing, number of levels, and range
• Color-coded lines (🟢 green above, 🔴 red below)
• Expands automatically when price exceeds boundaries (within the defined box)
• Optional price labels shown outside the grid
• Grid visually framed by a blue box
• Vertical line to mark grid origin
• Built-in alert when price hits a grid level
⚙️ Use Case
Ideal for visualizing grid bot logic in volatile markets.
Monitor how price interacts with predefined zones.
✅ Alert Ready
Use alertcondition to get notified when a grid level is touched.

Grid Bot RSIGrid Bot Simulator. Based on RSI levels.
How it works:
Prices are divided into grids, or trade zones, that are based on RSI levels. Buys will trigger when the RSI crosses into a higher zone, after descending. Sells will trigger when the RSI crosses into a lower zone, after ascending. After triggering, a new signal will not be produced until the RSI progresses into better zone.
Standard Settings :
RSI Length
Number of Grids
RSI Type : Standard RSI or Jurik RSX (based on Everget’s formula)
Show All Grids
Experimental Features (Adjust in settings menu) :
No Trade Zone : RSI Levels where no trades will be signaled. Adjust to prevent over-buying/selling in narrow markets. Default: 35-65:
No Trade Zone (40-60)
Aggression Level : Increase aggressiveness to stack buys/sells at extreme RSI levels:
Aggression = high
Aggression = low
Market Direction : If market is trending up, the bot will skip every other sell ( = more buys than sells). If down, will skip every other buy (more sells than buys). Default: neutral.
Market Direction: down
Market Direction: neutral

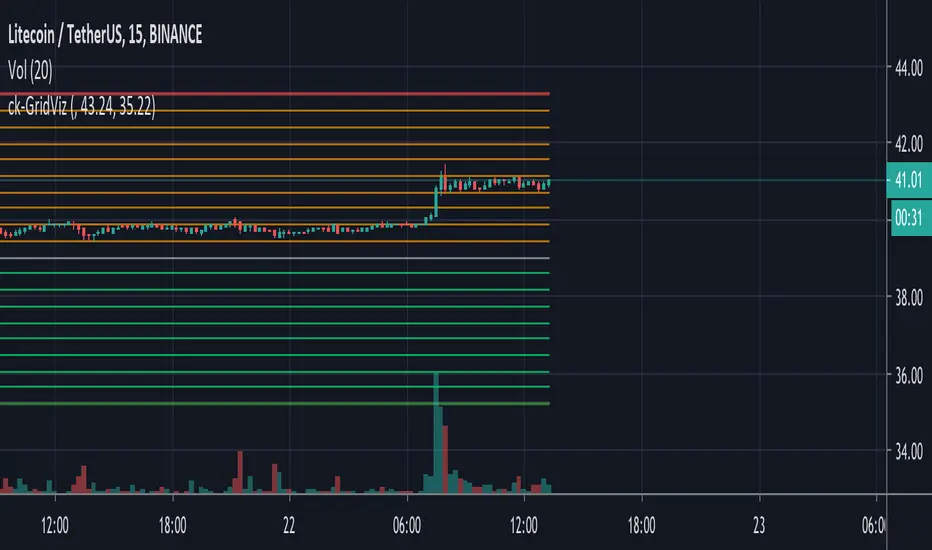
ck - 3commas GRID bot VisualisationHi,
This is a very quick script indicator to show the “grid” for an active (or one you are planning to manually configure) 3commas Grid bot.
To use, you’ll need to go to your Grid bot page in 3commas and enter the Upper and Lower Limit Values, either from the “manual” section if you are planning a new Grid bot, or from an open Grid trade by clicking the monthly button and using the Upper value (in green) and the Lower value (in red).
Have fun!
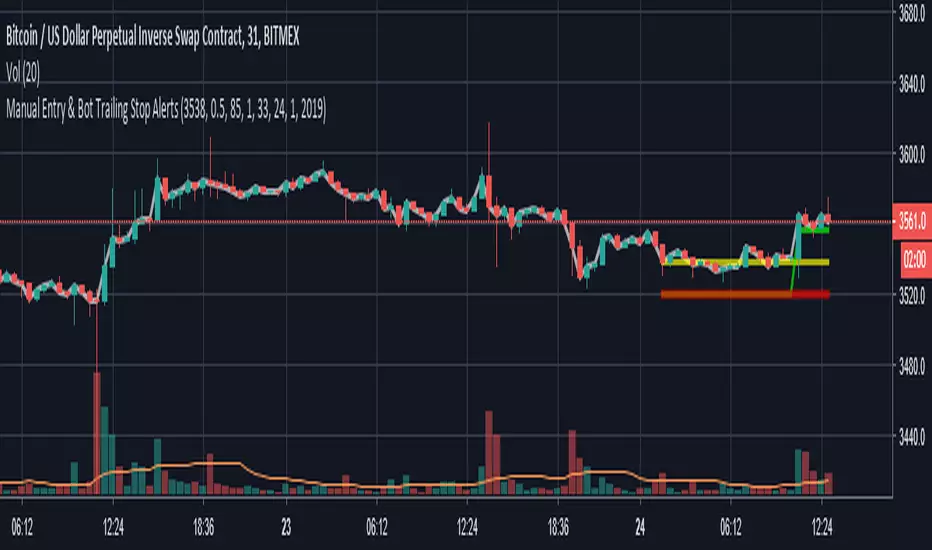
Manual Entry & Bot Trailing Stop AlertsHello all,
Another useful script & indicator with alerts enabled for trailing stoploss in your toolbox!
If you manually start a deal on a bot or even manual trade, you can set your chart time frame, enter the price and the time and date of your entry, then configure an Alert to fire using the “Close Long”/“Close Short” alert trigger.
This indicator features:
Definable Hard Stoploss by % - if price drops to hit this value, immediately trigger a close
Definable “Trail” value using Ticks (one Tick = lowest tradeable unit for your chart)
Supports Longs and Shorts!
Ideal for connecting to your 3commas BitMEX bots for EthUSD or XbtUSD
The indicator plots onto the chart various signals, Red is the Hard Stoploss value, Yellow is your Entry price, Green is the Trailing Stop and White is the live Price Tracker.
Please Note: When you add this indicator to your chart you need to click the Cog/Settings icon to configure it!
Let me know what you think!
Thanks,
Chris
Inyerneck UT Bot 9 EMA V.sthis script is a custom ut bot signal generator using a 9 ema filter and atr based thresholds. it shows buy/sell signals based on crossover logic and works well for volitality based set ups. created by inyerneck
AI Bot Regime Feed (v6) — stableThis indicator generates real-time, structured JSON alerts for external trading bots or automation systems.
It combines multiple technical layers to identify market regimes and high-probability buy/sell events, and sends them to any webhook endpoint (e.g., a FastAPI or Zapier listener).

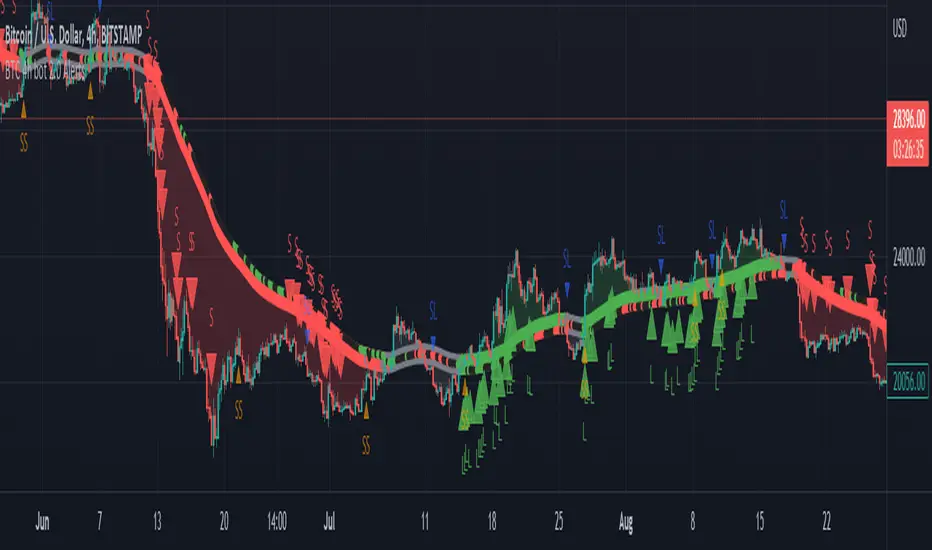
BTC 4h bot 2.0 AlertsThis is Alert version of BTC 4h bot 2.0.
Optimized for pairs BTC vs stablecoins, 4h timeframe.
HOW IT WORKS:
Script is based on the fact that there are certain phases of the market when there is a greater probability that BTC will go to one side or the other. To evaluate which phase we are in, the script uses "Main trend" and "Confirmation signals".
Main trend
- Is composed of a combination of several supertrends and moving averages. A Supertrend is a trend following indicator that helps in identifying whether we are in an uptrend or a downtrend. A higher factor is used to capture the main trend and not just small movements. In case the market goes sideways, the Supertrend does not work well, so it is a combination of multiple supertrends along with moving averages to differentiate a real strong trend from a range.
- It can be seen on the graph as a thick solid line.
- In an uptrend is green, in a downtrend red, gray represents the neutral zone.
Confirmation signals
- Are several script-evaluated indicators such as RSI , MACD , ADX and others, which serve to confirm the trend. In this case, it is the opposite way to the Main trend. Confirmation signals are used here to detect small movements. They are trying to capture bullish and bearish price momentum.
- On the graph they are seen as dashed lines above or below the Main trend (in the gray zone they are in the middle).
- It indicates only two signals, green for buy and red for sell.
HOW TO USE IT:
if the Main trend and Confirmation signals are of the same color, it will send a buy or sell signal, depending on which phase of the trend it is in. If the Main trend is e.g. in an uptrend and the market is going up, Confirmation signals should generate a lot of signals. But if the market starts to go in the opposite direction, Confirmation signals should generate fewer signals or none at all, thus reducing the number of wrong trades. In the gray zone of the Main trend it does not open positions.
To close position is possible to use stop loss and take profit or alternative could be to set very high TP value, thereby letting the script close the positions by itself by Stop Long or Stop Short.
The recommended setting is:
TP: 3.9%
SL: 4.7%.
In this case, it is a Alert version, where can be seen all the signals, which the script generates.
Green triangels indicate open Long.
Red triangels indicate open Short.
Small blue triangels indicate Stop Long position.
Small orange triangels indicate Stop Short position.
Signal is valid after bar is closed, so do not open a position before.
Script works well on Bitstamp, but also other exchanges with pair BTC/USD or BTC/stablecoins.
The script works consistently well over a long period of time, using past probabilities, but this does not guarantee future results.
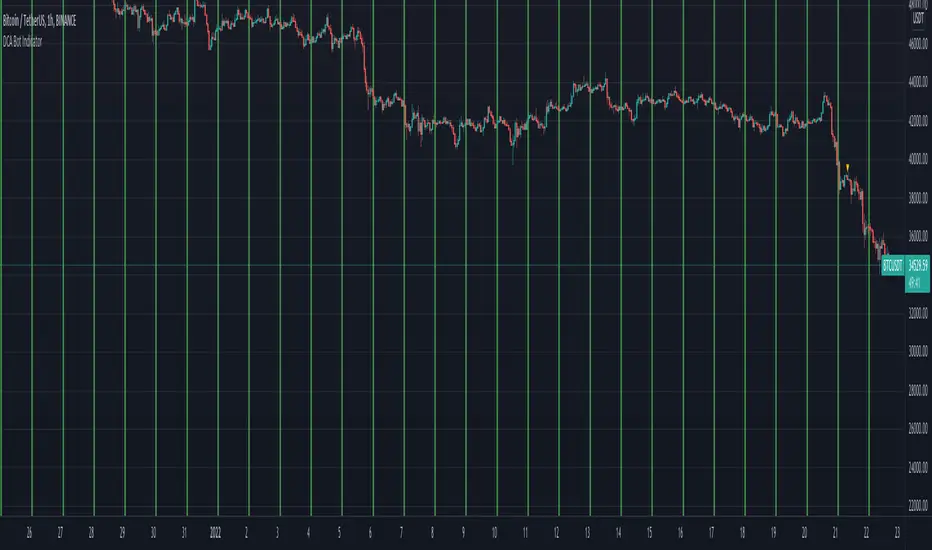
DCA Bot IndicatorName: DCA Bot Indicator
Category: Dollar Cost Average.
Operating mode: Alerts at a specific time, day of the week and day of the month.
Trades duration: N/A.
Timeframe: 1H
Suggested usage: long-term investing DCA strategies.
Entry: Only indicates the time and then the day of the week or the day of the month to buy.
Exit: As per long-term Investor’s strategy.
Usage: If you want to perform a Dollar Cost Averaging approach with:
- Daily purchases (at a specific time)
- Weekly purchases (at a specific time and day of the week)
- Monthly purchases (at a specific time and day of the month)
It is then possible to set the alert text with a preferred message or for use with trade automation systems. The green background identify the specific time chosen.
It is possible to identify through the Bias Analyzer the best time for the daily purchase.
Configuration:
- Buy Time: hour you would like to buy, please consider that the script is executed at the end of the defined time, so if you would like to buy at 2, have to put 1.
- Buy only Days of the Week: you can select the day you want.
- Buy only on Day of Month, you can specify a specific day.
Credits:
- dsteaves for inspiration
Bollinger Bands + RSI Alerts for 3commas/DCA botHey Folks !
This is in indicator that generates buy alerts combining Bollinger Bands and RSI.
RSI validates the BB signal by confirming we are not in an oversold area.
Interval: 3m to 15m
Recommended settings for 3commas DCA bot
- TP/TTP: 0.3%/0.1%,
- Base Order: Your choice ,
- Safety Order: 1.2 * Your choice of base order
- Safety Order Volume Scale: 1.2,
- Safety Order Step Scale: 1.5,
- Price Deviation to Open Safety Order (% from initial order): 0.25%,
- Max Safety Trades Count: 7
- DO NOT USE STOP LOSS
> Create Alert with Buy Alert and link it to "Message for deal start signal"

Moon Bot Study w/ AlertsThis is an experimental strategy that trades based on the Moon Cycles
Works best on 4hr, tested mostly on BTC but maybe you can find other assets that also return profitably
Important: With much power comes much responsibility, use it wisely
*Study version of Moonbot Strategy with built-in alerts
Strategy Version:

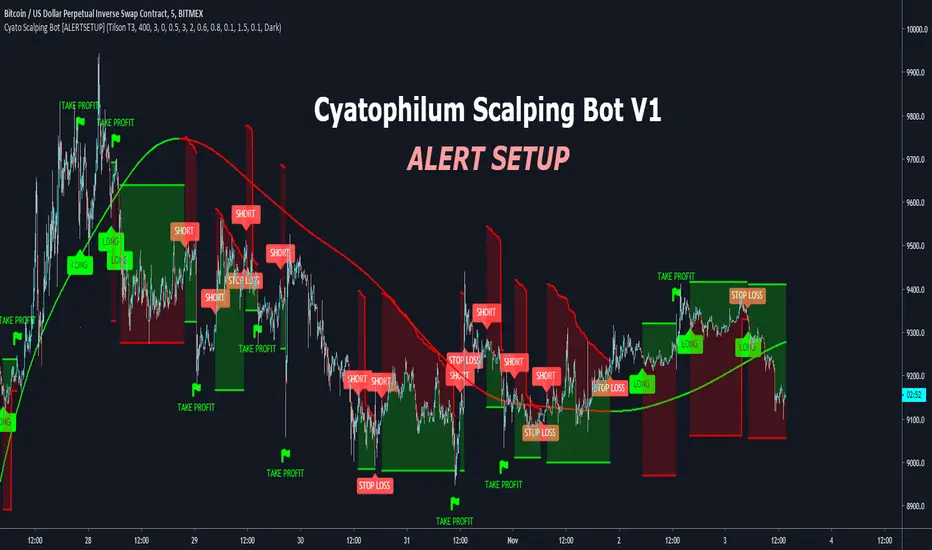
Cyatophilum Scalping Bot [ALERTSETUP]This indicator triggers Short or/and Long entries and exits.
Example with a Long trade:
The integrated stop loss will trigger an alert to exit the trade.
It is possible that a trend reverses during a trade.
In this case, the "LONG EXIT" alert will trigger at the same
time as the "SHORT ENTRY".
The Trend Detector feature, using EMA or Tilson T3 will filter trades that are against the main trend and thus increase profitability.
BONUS FEATURE
Trailing Take Profit with configurable % deviation.
SAMPLE USE CASES
ETH/BTC
ETH/USD
FOREX: GBP/USD
FOREX: XAU/USD
BTC/USDT
LTC/BTC
XRP/BTC
Read More
> Get access to the Cyatophilum Indicators <