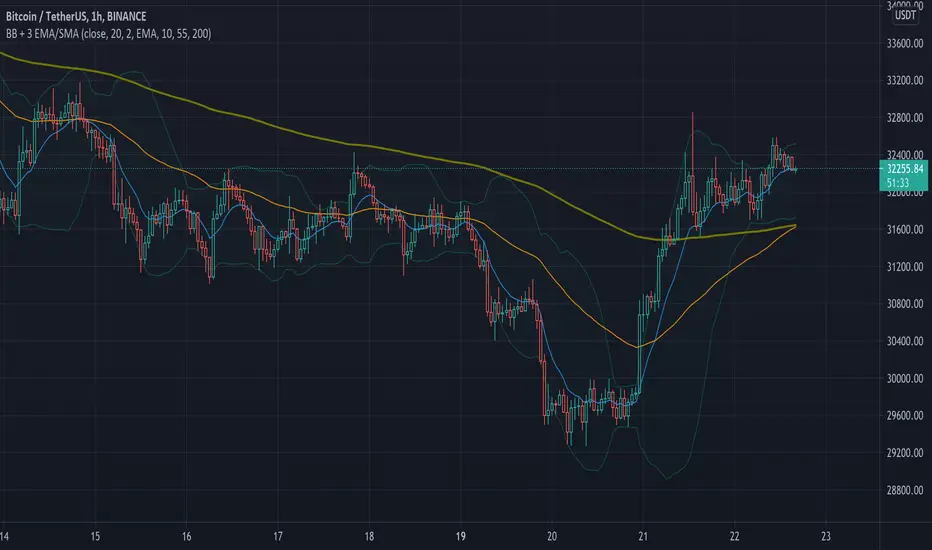
Simple Bollinger Bands + 3 EMAWe know that the number of indicators that we can use is limited, that is why with this indicator the Bollinger Bands + 3 EMAs join and be able to use 4 indicators in 1.
Bollinger Bands (BB)
Bollinger Bands (BB) are a widely popular technical analysis instrument created by John Bollinger in the early 1980’s. Bollinger Bands consist of a band of three lines which are plotted in relation to security prices. The line in the middle is usually a Simple Moving Average (SMA) set to a period of 20 days (the type of trend line and period can be changed by the trader; however a 20 day moving average is by far the most popular). The SMA then serves as a base for the Upper and Lower Bands which are used as a way to measure volatility by observing the relationship between the Bands and price. Typically the Upper and Lower Bands are set to two standard deviations away from the SMA (The Middle Line); however the number of standard deviations can also be adjusted by the trader.
Exponential Moving Average (EMA)
Moving averages visualize the average price of a financial instrument over a specified period of time. However, there are a few different types of moving averages. They typically differ in the way that different data points are weighted or given significance. An Exponential Moving Average (EMA) is very similar to (and is a type of) a weighted moving average. The major difference with the EMA is that old data points never leave the average. To clarify, old data points retain a multiplier (albeit declining to almost nothing) even if they are outside of the selected data series length.
The 3 EMAs that the Script has, are configured as follows:
Fast EMA (purple) 10 periods.
Slow EMA (blue) 55 periods.
Big EMA (olive) 200 periods.
However, you can configure each one with the color and the number of periods you want.
There are other indicators in the Public Library that have similar functions to this Script, but they all do it in a more complex and less friendly way when configuring it, for this reason we wanted to keep this Script as simple as possible.
"bollingerband" için komut dosyalarını ara
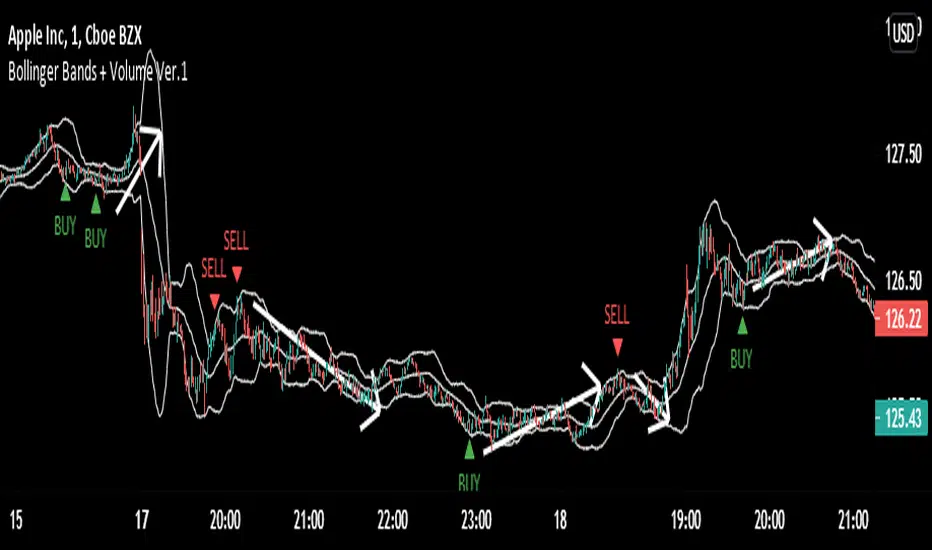
Bollinger Bands + Volume (Version.1)Bollinger Bands + Volume (Version.1)
This is just version 1, "version 2 ,version 3,version 4" are coming, which are better than this version.
- This indicator used the volume with Bollinger Bands.
- This indicator generates BUY and SELL signals.
- Whenever price will touch the upper band and if the buying volume is low and the selling volume is high Then it will give SELL signal.
AND
- Whenever price will touch the lower band and if the selling volume is low and the buying volume is high Then it will give BUY signal.
Hull MA with BB (With Alerts)This is a combination of the standard Bollinger bands with a VWAP(Pink line), and the 'Hull Trend with Kahlman' script by user capissimo, and the NMA (Moving Average 3.0 (3rd Generation)) script by everget.
You can find the original scripts here:
This indicator gives you several confirmations of a good entry and exit positions for Crypto currency like bitcoin and most alt coins. I use this on a 15min, 30min, 1hour, and 4hour chart for best results.
How to use:
Entry Signals:
-A candle closes above the NMA (Yellow Step Line). AND
-You see a Long (text) flag. AND
-The candles are near the bottom of the Bollinger bands and heading upwards.
Exit Signals:
-Candles have passed below and closed below the NMA (Yellow Step Line). AND
-You see a Short (text) flag.
It's important to use these confirmations with other indicators so you have the best entry/exit positions, and make sure you are on normal candles and not HA or any other types.
There are alerts built in that you can setup for the Short and Long text flags that you see. These are generally good alerts to follow. I use the alerts as a reminder to check the charts and see if my other indicators line up for a good trade.

Value RangeHere is another attempt to chase value based on technical analysis.
This is extended version of PE range script published earlier.
Instead of just PE, this script contains several other factors which defines value. You can chose which factor to look at from input dialog:
Possible value factors included in this script are:
Price to Earnings
Price to Sales
Price to Book
PE - Forwarding
PS - Forwarding
Price to Cashflow
Enterprise Value to EBITDA
Enterprise Value to Cashflow
Some of these can be added to chart directly from financials. But, the script also calculate range based on donchian channel or bollinger bands. Instead of short periods, we are looking for periods in terms of years. Rest of things remain same.

Triple BB3 Bollinger Band Plots that are translucent in order to see where the bollinger bands align from 3 different resolutions.
Change the resolution to more closely represent the current chart. For example on a 1 hour chart you might choose Res1 as 30 minutes, Res2 as 1 hour, and Res3 as 2 hour.

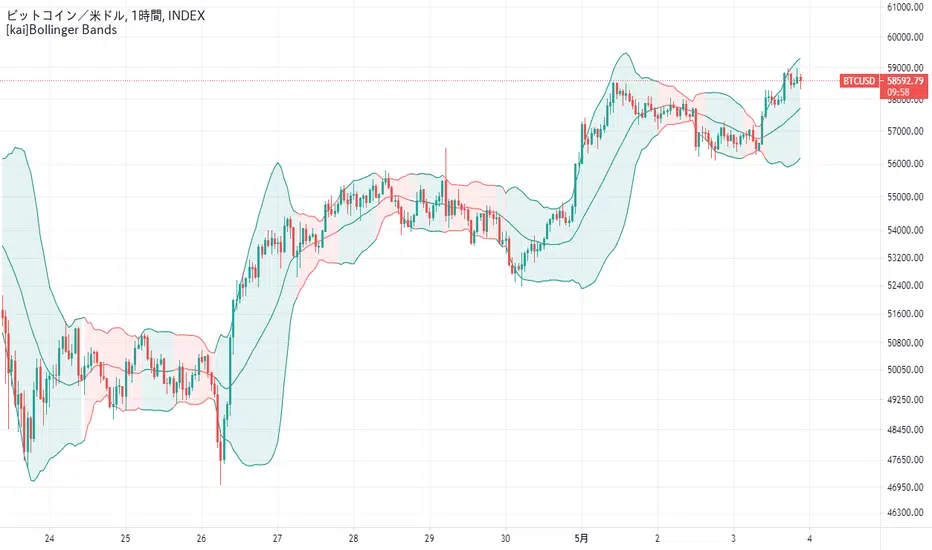
[kai]Bollinger BandsBollinger band compatible with log scale
You can display the squeezed part in red
ログスケールに対応したボリンジャーバンドです
スクイーズしたところを赤く表示することができます
EMA Ribbon Bollinger UltimateEma Ribbon and Bollinger Bands.
Background change color if the trend change or if it goes weak.

[KL] Bollinger bands + RSI StrategyThis strategy is based on two of my previous scripts, one called “RSI14 + 10”; the other one called “Bollinger Bands Consolidation”. At its core, it combines the main setups from each of those two scripts but excludes the auxiliary features that were considered as experimental. This strategy will identify periods of squeeze, and then enter long during consolidation with a trailing stop loss set.
Primary indicator will be the Bollinger Bands. By comparing the width of the BBs with the ATR of the same lookback period (i.e. 2 standard deviations of the 20 recent closing prices vs ATR(20) x2), we begin to look for confirmation for entry whenever the standard deviation of prices is less than the ATR. This can be seen visually in the plots (i.e. default gray lines representing ATRx2 relative to BB center line).
Confirmation for entry will be the RSIs (slow-14, and fast-10). If both are upward sloping, then we assume prices are in an uptrend and may eventually break above upper band. RSIs are typically in mid-range when prices are consolidating, therefore no need to measure it.
Exits will happen in two cases, (1) when trailing stop loss hits, or (2) when RSIs signal that the instrument is overbought. No. 1 is self-explanatory. No. 2 happens, when RSI14 reaches above 70 (can be changed), followed by RSI10 catching up and surpassing RSI14.

Projected Bollinger Bands - Quadratic RegressionBased on the work of Alex Groove : https://www tradingview com/script/YnoXd2AY-forecasting-quadratic-regression/
and also based on https://www tradingview com/script/YnoXd2AY-forecasting-quadratic-regression/ by capissimo
Notes:
1. This Bollinger Bands uses the QREG as its middle line (not MA as the original Bollinger Bands) so this should be acknowledged.
2. This indicator forecasts 3 candles (periods) ahead.
3. The label's position is quite messy, so you need to adjust the chart zoom in order to make the indicator doesn't overlap anything.
4. You need to manually set the time frame in the indicator settings because i'm not able to make the indicator recognizes it automatically
I'm trying to make the Bollinger Bands Forecasting from Quadratic Regression, and i'm really sure that there are a lot of mistakes here and there, so i 'm hoping corrections coming from you guys...
CHEERS!!!

GSO + RSI + MACD + MFI + Bollinger BandsThis script uses a Gann Swing Oscillator , RSI , MACD , MFI and Bollinger Bands to generate long and short signals for cryptocurrencies on the 5 minute chart.
The Gann Swing Oscillator was inspired by HPotter's GSO.
This script is for educational purposes only. This script is NOT to be used as financial advice. I will not accept liability for any losses which may occur as a result of using this script.

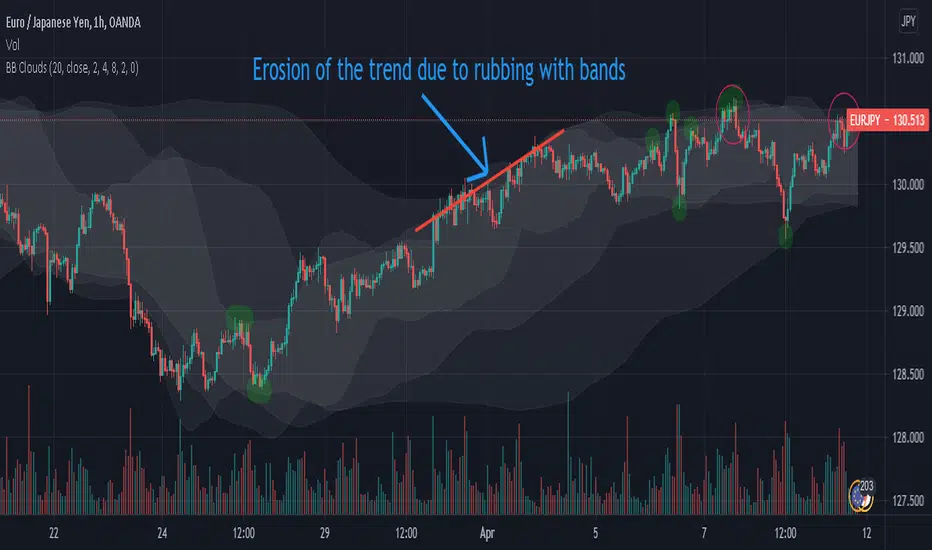
Bollinger Bands Clouds - BB CloudsBollinger Bands Clouds provides Bollinger Bands of different timeframes in a chart.
It actually shows BB from a new angles.
This indicator can show three BB from different timeframes simultaneously.
The idea is to be able to combine different levels of BB from other timeframes in one chart
Each cloud is a Bollinger band whose time frame is a multiple of the current chart time frame. If this multiplier is set to 1, its Bollinger bands will be drawn for the current time frame and will be no different from normal Bollinger bands.
This indicator can be suitable for fractal perspective.
Multipliers can be changed from within the indicator settings:
settings -> mult1, mult2 and mult3
For a dark theme, enable the Dark Theme option from the indicator settings.
Asynchronous Bollinger Bands - Async BBThis indicator allows you to draw Bollinger bands using higher timeframes.
Note: The timer of your Bollinger Bands must be a multiple of the current chart of the chart.
For example: If your chart is 4 h and you set the sync value to 3, the Bollinger Bands will be drawn with a 12H time frame. 3 * 4H = 12
If the sync is equal to 1, normal Bollinger bands are drawn and will be no different from the normal Bollinger band .
Using this indicator may be appropriate for fractal perspectives.

Weighted stdev/BBThe basis/mean is the equivalent to the pine built in function wma(). It assigns greater weighting to recent data points and less weighting on past data points. The weighted moving average is calculated by multiplying each observation in the data set by a predetermined weighting factor.
Similarly the stdev is calculated using the same weighting factors where recent deviations are given greater weight than past deviations.

EMA (10,20,60) + Bollinger BandsCombination of bollinger bands and exponential moving averages (10, 20, 60)
The coloring is optimized for dark background, and it is editable
This indicator combined 3 exponential moving average lines and bollinger bands . The EMA lines can be add or deleted in pine editor, and its parameters can be changed too. Same to the bollinger bands . Defaulted value for BB is 20SMA with 2 standard deviations.
Useful as a supplmentary indicators

Inverse BandsThis was the result of quite some time spent examining how much information could be gleamed by studying the interactions between Keltner Channels, STARC Bands and Bollinger Bands. I was surprised by the results.
First of all, there are four fills that are black. Set the transparency of those to 0 and you'll see this indicator the way that it's meant to be seen. Those fills belong to unused sections of the Bollinger Bands.
There are two clouds which represent STARC Bands and the Keltner Channel. There is some delay when they flip from bullish (green) to bearish (red), but they are indicative of the trend. The space between them is black and the narrower that space is, the greater volatility is. Because of this, we don't need the exterior Bollinger Bands.
The Bollinger Bands remain visible as the yellow interior clouds on the top cloud and the blue interior clouds on the bottom cloud. Often, the thicker the yellow or blue cloud is, the less severe a throwback from a given trend reversal will be. Often the thinner that yellow or blue cloud is, the more severe the trend reversal will be. If price is rising into a thin interior yellow cloud, the following dip will be substantial. If price action dips towards a thicker interior blue cloud, often the pump following that dump will be less enthusiastic.
We preserve the Keltner Channel and STARC bands as our cloud because the way that they interact with the three basis lines yields a lot of information.
The yellow Bollinger basis line tells us about trend strength. The closer the BB basis line is to the top of the top cloud or the bottom of the bottom cloud, the stronger the trend is. When it enters the cloud very close to the bottom of the bottom cloud, you know you're looking at a strong pump, and vice versa when it's close to the top of the top cloud.
The purple Keltner Channel basis line and orange STARC Band basis line can forecast short term trend changes one candlestick in advance by contacting any line in either cloud. The moment either basis line touches or crosses any boundary of the clouds, you know that the next candle will change directions. In an uptrend, a touch or cross means the next candle will have a lower high point. In a downtrend, a cross or touch means the next candle will have a higher high point. This is most useful in scalping.
It'd be pretty easy to slap some crossover alerts on to this and useful considering that they come a candle in advance. Feel free to further explore and develop this.

Bollinger Bands Trending Reverse StrategyWelcome to yet another script. This script was a lot easier since I was stuck for so long on the Donchian Channels one and learned so much from that one that I could use in this one.
This code should be a lot cleaner compared to the Donchian Channels, but we'll leave that up to the pro's.
This strategy has two entry signals, long = when price hits lower band, while above EMA, previous candle was bearish and current candle is bullish.
Short = when price hits upper band, while below EMA, previous candle was bullish and current candle is bearish.
Take profits are the opposite side's band(lower band for long signals, upper band for short signals). This means our take profit price will change per bar.
Our stop loss doesn't change, it's the difference between entry price and the take profit target divided by the input risk reward.

3Commas Bollinger StrategyThis strategy is intended for use as a way of backtesting various parameters available on 3commas.io composite bot using a bollinger band type trading strategy. While it's primary intention is to provide users a way of backtesting bot parameters, it can also be used to trigger a deal start by either using the {{strategy.open.alert_message}} field in your alert and providing the bot details in the configuration screen for the strategy or by including the usual deal start message provided by 3commas. You can find more information about how to do this from help.3commas.io
The primary inputs for the strategy are:
// USER INPUTS
Short MA Window - The length of the Short moving average
Long MA Window - The length of the Long moving average
Upper Band Offset - The offset to use for the upper bollinger offset
Lower Band Offset - The offset to use for the lower bollinger offset
Long Stop Loss % - The stop loss percentage to test
Long Take Profit % - The Take profit percentage to test
Initial SO Deviation % - The price deviation percentage required to place to first safety order
Safety Order Vol Step % - The volume scale to test
3Commas Bot ID - (self explanatory)
Bot Email Token - Found in the deal start message for your bot (see link in previous section for details)
3Commas Bot Trading Pair - The pair to include for composite bot start deals (should match format of 3commas, not TradingView IE. USDT_BTC not BTCUSDT)
Start Date, Month, Year and End Date, Month and Year all apply to the backtesting window. By default it will use as much data as it can given the current period select (there is less historical data available for periods below 1H) back as far as 2016 (there appears to be no historical data on Trading view much before this). If you would like to test a different period of time, just change these values accordingly.
Known Issues
Currently there are a couple of issues with this strategy that you should be aware of. I may fix them at some point in the future but they don't really bug me so this is more for informational purposes than a promise that they may one day be fixed.
Does not test trailing take profit
Number of safety orders and Safety Order Step Scale are currently not user configurable (must edit source code)
Using the user configuration to generate deal start message assumes you are triggering a composite bot, not a simple bot.

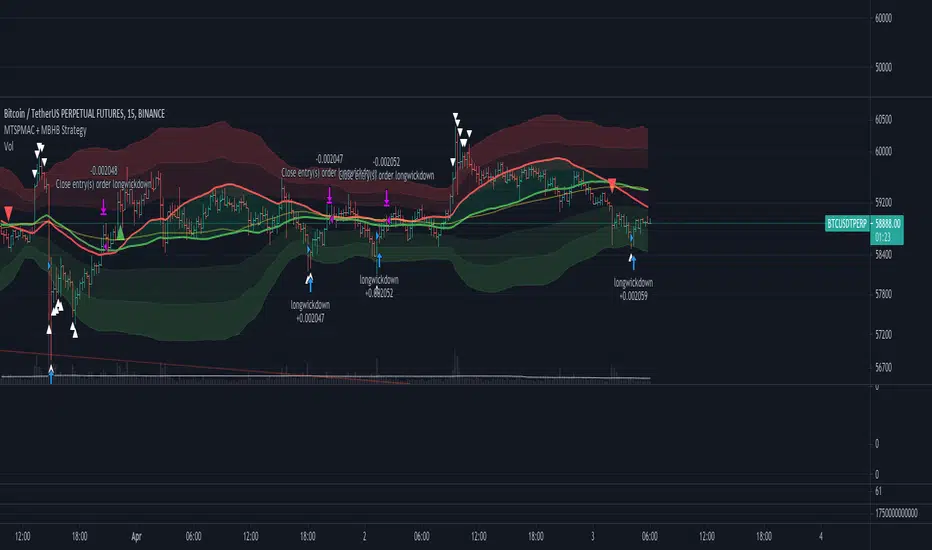
LAGging span leaves Bollinger Bands strategyAbstract
This script points out the positions a lagging span leaves a Bollinger Band.
This script does not plot a lagging span but moves the Bollinger Band forward.
You can find profit opportunities by combining this script and risk management.
Introduction
Bollinger Bands is a popular indicator.
It contains a moving average, an upper band and a lower band.
The moving average can indicate trend, the upper band and the lower band can indicate if the price is far away from the moving average.
However, in trading markets, anything can happen.
Both continuation and reversal are possible when the price touches the moving average, the upper band or the lower band.
Therefore, many traders adjust the parameters of the Bollinder Band or add other indicators to improve their trading strategies.
@Daveatt et. al. provided an idea that uses a lagging span.
A lagging span is a line chart. It displays the reference price but in earlier time.
For example, if the offset of a lagging span is 26 days, the value of the lagging span on 29 days ago is the reference price 3 days ago.
A lagging span is a part of Ichimoku Cloud.
It can compare the price to the earlier price and the values of indicators in the past.
To compare the price to the values of indicators in the past, we can also shift indicators forward instead of adding a lagging span into the chart.
This script uses shift-the-indicators-forward method.
In other words, this script plots the Bollinger Band forward so that the price can be compared to the values of the Bollinger Band in the past.
Computing and Adjusting
(1) Compute Moving Average
(2) Compute Standard Derivation
(3) Upper Band = Moving Average + Standard Derivation * Multi
(4) Lower Band = Moving Average - Standard Derivation * Multi
(5) Shift the Bollinger Band forward according to the offset parameter.
(6) Mark the points the price leaves the shifted Bollinger Band
(7) Compute the most possible loss and profit before the next opposite signal.
Parameters
source : the data for computing the bollinger band. can be open, high, low, close or their combination.
length : how many days are calculated by the bollinger band
mult : the distance from the moving average to the upper band and the distance from the moving average to the upper band is equal to ( mult * standard derivation ) .
x_offset : the offset of the lagging span
Conclusion
This script can find signals for potential breakout or trend continuation.
If you want to use this signal well, you need to know when to cut loss and protect the profit.
Reference
@Daveatt , Bollinger bands/Lagging span cross , BGyrPgOA , Tradingview 2019
How to trade with Bollinger Bands
How to use Ichimoku Cloud
How to trade with a line chart


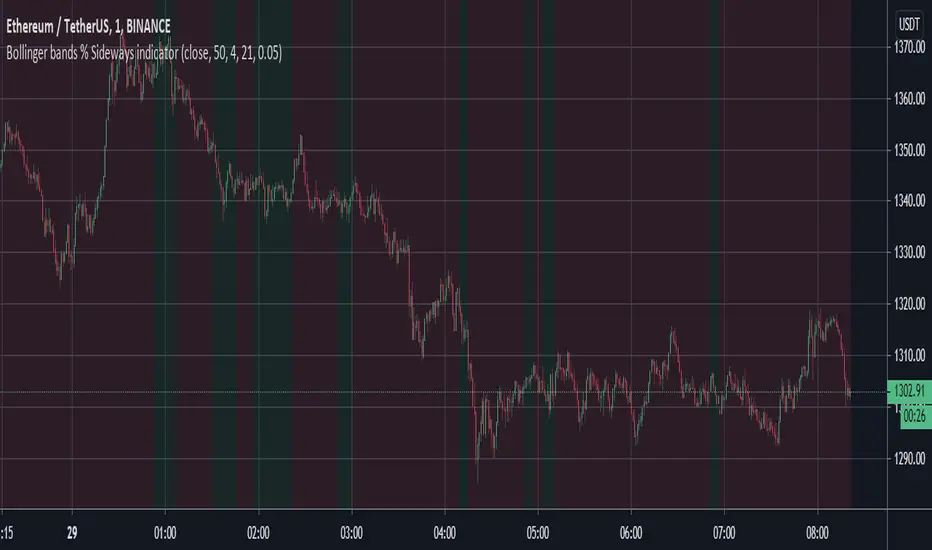
Bollinger bands % Sideways indicatorDetect sideways markets (green background) vs. trending markets (red background) with this indicator. It makes use of the Bollinger bands % as its base.
Relative Channel BandwidthThis indicator uses different volatility channels - Bollinger Band, Donchian Channel and Keltner Channel width to measure volatility.
Indicator plots channel bandwidth percentage with respect to close price.
This is not same as Bollinger Percent B - which is measure of where price is with respect to band. Instead this indicator is similar to ATR Percent indicator published here:
Plotting is color coded to indicate volatility zone:
Red : Extreme volatility
Orange : High volatility
Lime : Low volatility
Green : Extreme low volatility
These levels are again derived by long period bollinger bands

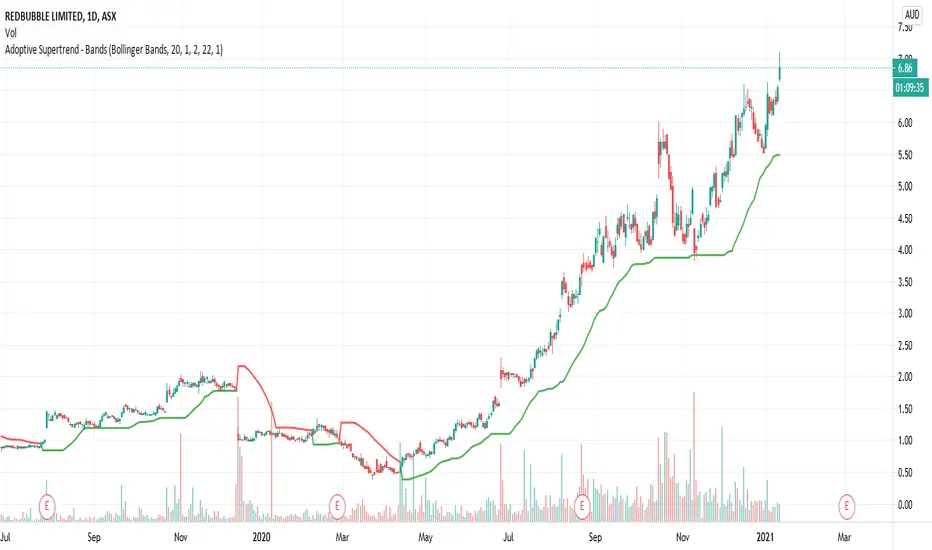
Adoptive Supertrend - BandsAnother adoption of supertrend. This time based on different channels - Bollinger Band, Keltner Channel, Donchian Channel and Pivot point based Donchian channel.
When price hits top of bands, it is considered as start or continuation of uptrend. When price hits bottom of the band it is considered as start or continuation of downtrend. Hence, supertrend is drawn based on these calculations. Use ATR Periods and ATR Multiplier to create stops certain ATR away from band's top and bottom.
Other supertrend adoptions published are here:
Pivot point based donchian channel is published here: