"bitcoin" için komut dosyalarını ara
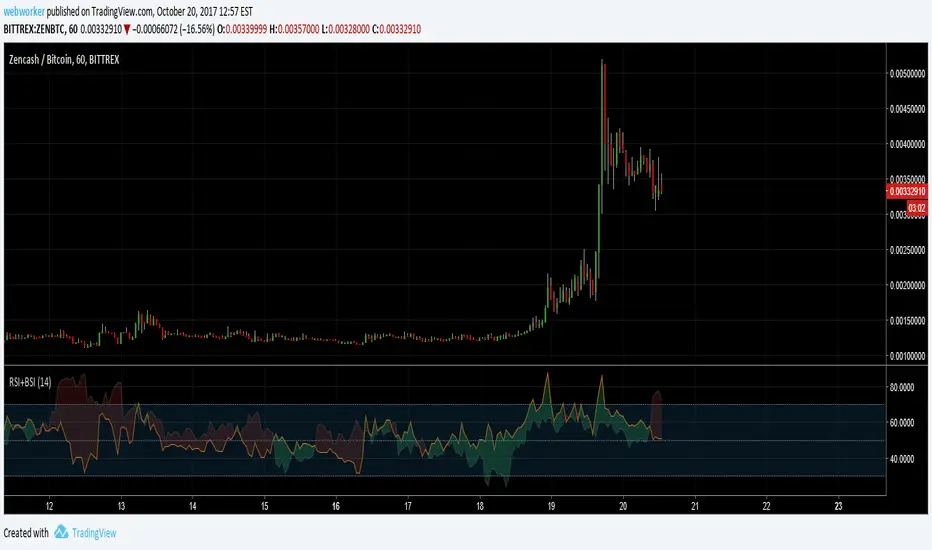
RSI+BSIThis script simply plots the current instruments RSI as well as Bitcoin's RSI from bitfinex. Helpful to identify when an alt is performing stronger than BTC or if BTC is dragging the alt down.
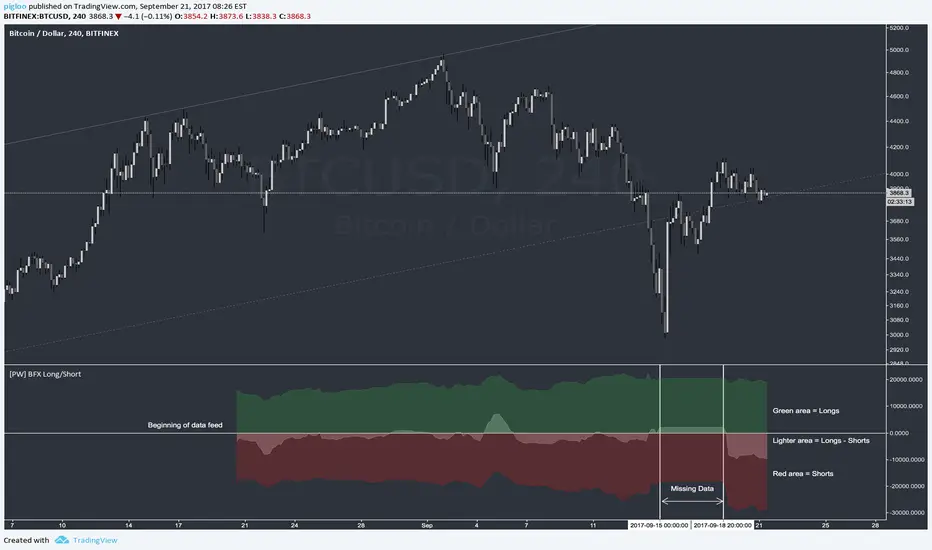
BFXLS - BitFinex Long/Shorts
Small improvement upon the above script - all credit should really go to pigloo
Auto-detects ticker and automatically loads the long/shorts for it - so works on more than just BTC
Note - only works on BitFinex and only works for tickers which have long and short data available!
Green area = Longs
Red area = Shorts
Lighter area = Longs - Shorts

Bitfinex Bitcoin Short/Long PercentageShows the percentage of longs vs shorts. Red area means more shorts than longs and the other way around.
Bitfinex (BFX) - Longs and Shorts for BitcoinGreen area = Longs
Red area = Shorts
Lighter area = Longs - Shorts
The data only started recently which is why there is not much history, also I have marked a period of missing data between the vertical lines.
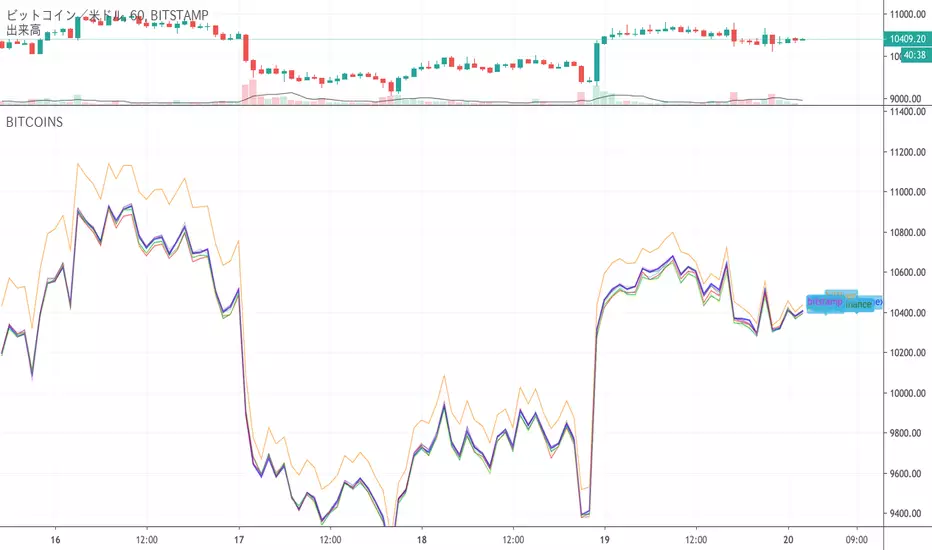
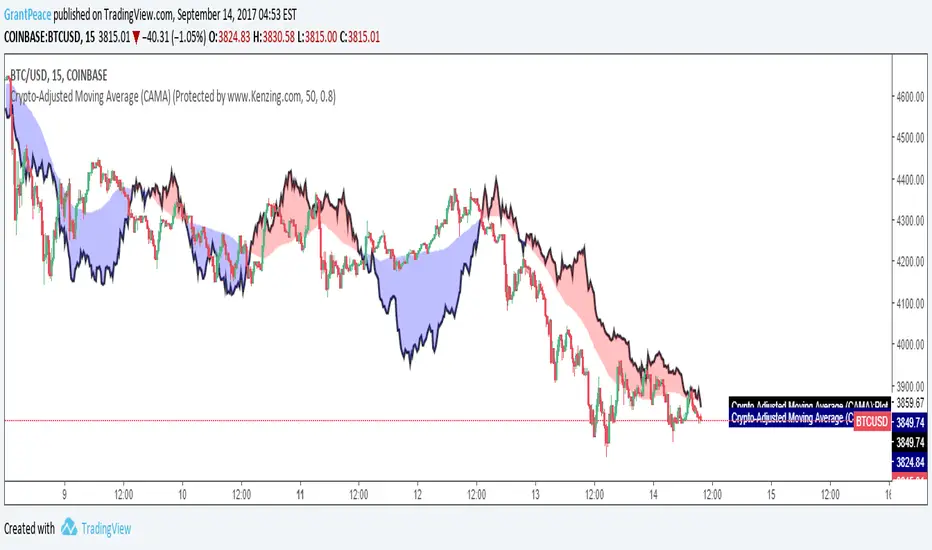
Crypto-Adjusted Moving Average (CAMA)UPDATED! This moving average can now be applied to any Crypto-currency and ANY time-frame!
Request use in the comments :)
This moving average is adjusted to give weight to the performance of the 6 largest Cryptocurrencies by market-cap.
This is the Crypto-Index that affects the moving average.
Bitcoin
Ethereum
Bitcoin Cash
Ripple
Litecoin
Nem Coin.
The use of this indicator is to observe divergence between the price of the underlying asset that is the basis of your chart, and the rest of the Crypto-currency market.
If more Crypto-currencies go down while your observed currency goes up, the CAMA will sit lower and a blue pool will become visible showing that that the chart is performing better than the Crypto-Weighted Index listed above. If more Crypto-currencies go up while your observed currency goes down, the CAMA will sit higher and a red cloud will form, showing that the chart is performing worse than the Crypto-weighted Index.
The indicator uses two variables that can be changed:
"MA_Length" = This is the length of the moving average and is set to 50 by default.
"CryptoFactor" = This is the weighting given to the movement of the Crypto-Index. Essentially, this is the factor as to how much the movement of the Crypto-Index effects the weight of the moving average. If you set this at 0 , the line will be a simple moving average of the set length without any affect of the Crypto-Index.
By default, the CryptoFactor is set to 0.8 .
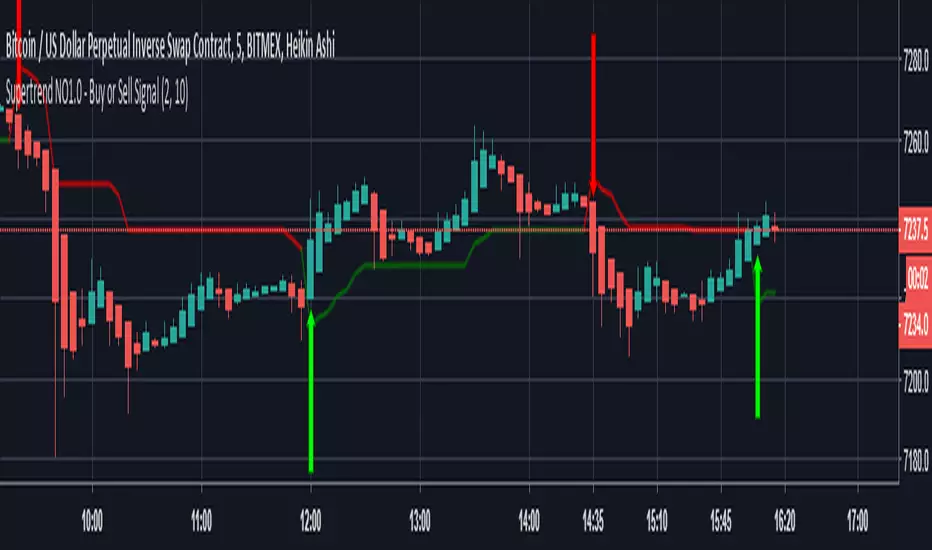
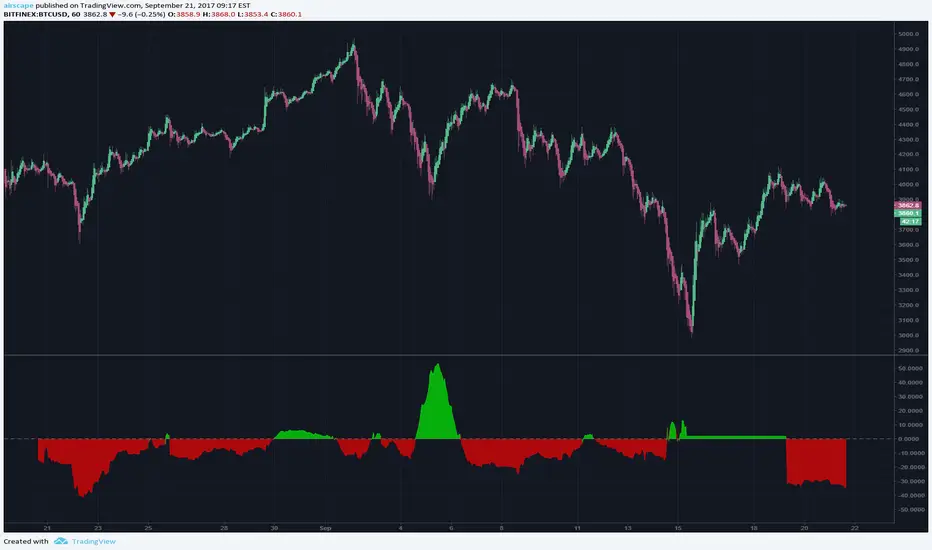
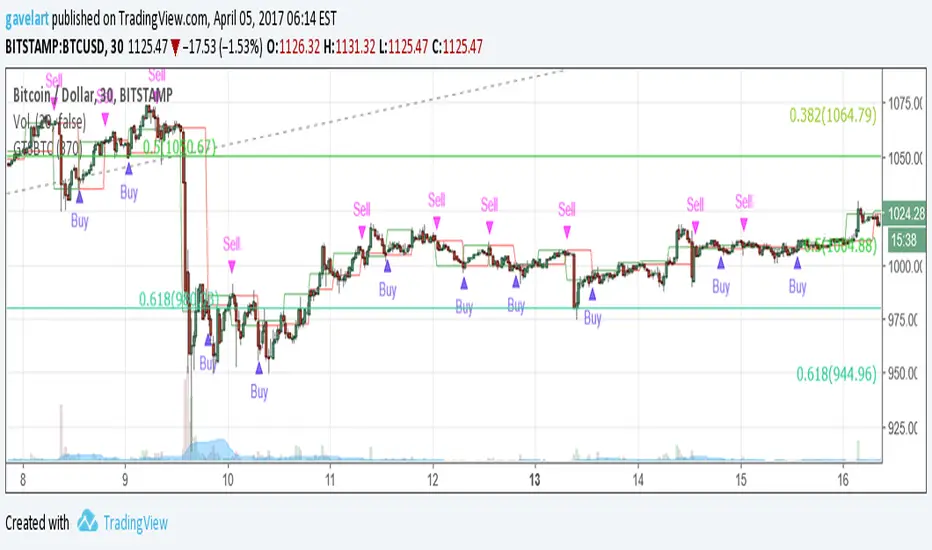
Ichimoku Volume Filtered SignalsFor use whenever you would use an Ichimoku Indicator.
This indicator will print buy and sell signals when the following conditions are met - note all parameters for ichimoku, volume sma, etc are configurable
Buy
Price is above cloud
Tenkan-sen is above Kijun-sen
Volume is double or more than 20 sma volume
Volume is less then four times 20 sma volume
Candle is positive
Sell
Price is below cloud
Kijun-sen is above Tenkan-sen
Volume is double or more than 20 sma volume
Volume is less than four times 20 sma volume
Candle is negative
If you find this useful, consider sending some bitcoin my way 😀
1LbFxAYJSVPxirT8eW31QHaGbySHyPYgMq
Good luck and have fun!

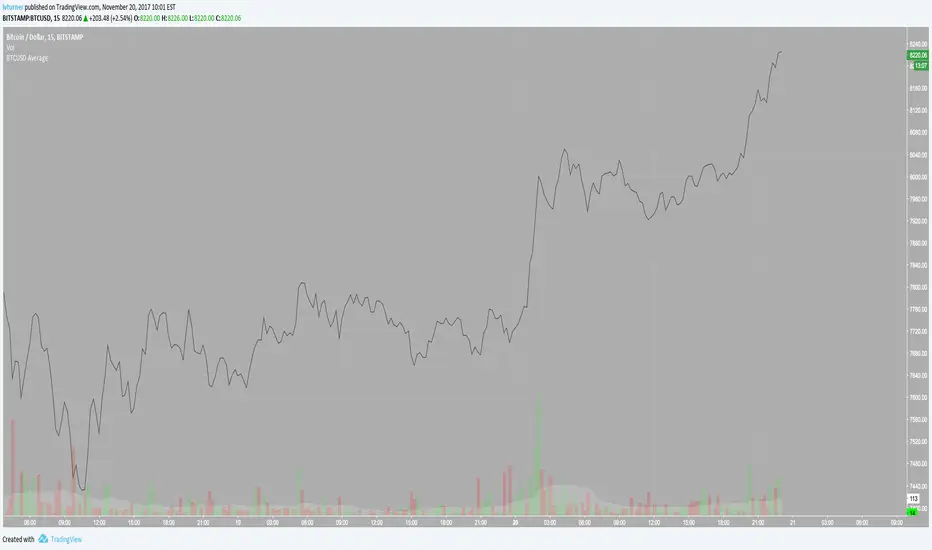
Volume Conversion IndicatorVolume Conversion Indicator
The volume conversion indicator is much like the in-built volume indicator. This particular volume indicator allows you to find out how much of something has been traded in a given timeframe.
This is done by multiplying volume by the average price at that point.
What does this mean?
Well, say, for example, you were watching DGB/BTC (DigiByte/Bitcoin). Instead of the volume being displayed in the amount of DGB traded, the amount of BTC traded is displayed instead.
Feel free to comment... Hope this helps :D

WhenWasThePriceAction
Bars of largest range (volatility)
* see moments of strongest price action immediately
* colored & upDown by candle color
* amplifier: you see only the bull runs, and subsequent dumps
Very nice on the 5 years scale of BITSTAMP:BTCUSD - nothing comparable to 2013 has happened yet.
Internals:
squared_range = pow(high-low, 2)
That is essentially it already. The rest are details:
* gauge with (in case of Bitcoin exponentially rising) price
* show in red for negative candles
* take even higher polynomial (than 2) to show only the very largest values
* allow some user input (but there is not much more that can be chosen here.)
Sorry for such a simple formula - but sometimes the easiest things are powerful.
Please give feedback. www.tradingview.com and/or in the cryptocurrency chat. Thanks.

Alert GetTrendStrategy BTCUSDAlerta para la estrategia "GetTrendStrategy 370 30 min" optimizada para Bitcoin
Puedes programar alarmas para que envié mensajes al móvil o al correo electrónico. Para ello observa la siguiente imagen:
mejorestraders.ml
Pip Foundry - BitMEX BVOL7D IndexMy premium indicators are available for monthly lease at www.tradingview.com
A quick indicator in response to the product released this month from BitMEX - a Weekly settled volatility index for bitcoin!
www.bitmex.com
uses BVOL calculation from www.bitmex.com

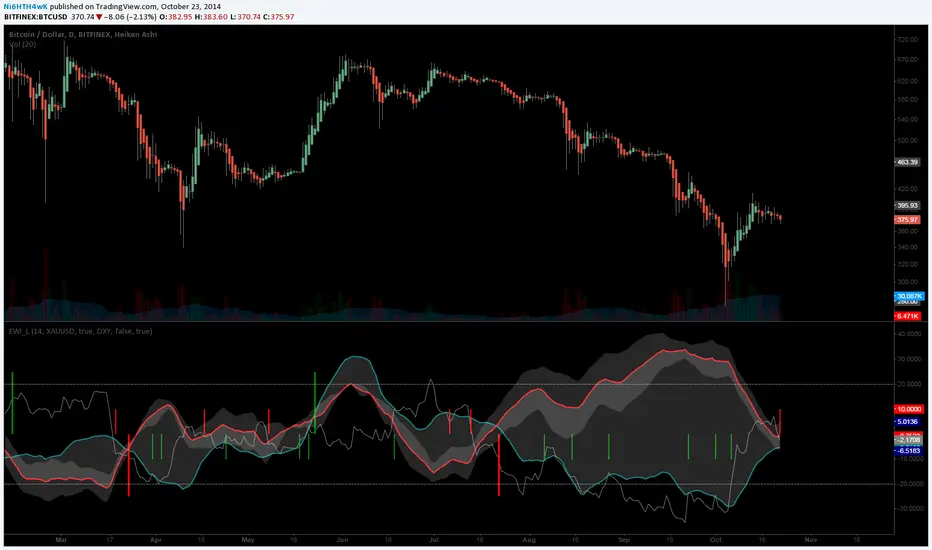
[LAVA] Early Warning IndicatorCombined the RSI inverse of gold to USD with the Dollar index (or whatever stock symbol that may be inverted/complementary) with another asset/currency, like bitcoin, you can basically be well informed when a potential move is on the horizon. Settings allow for inverse settings and de-combining the two pairs as well as a nice cloud look if all the lines get annoying.
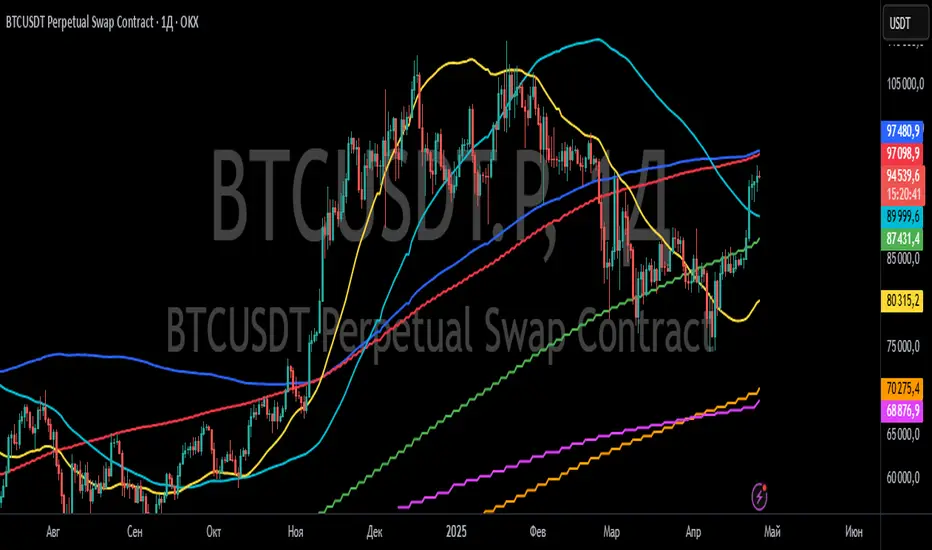
Event-Based Multi MA v1.1📈 Event-Based Multi MA v1.1 — Smart Trading with Dynamic MA Updates
Overview
In a world where most moving averages blindly follow every candle, Event-Based Multi MA v1.1 introduces a smarter logic:
➡️ Update moving averages only when significant price movements occur.
Forget the noise. Focus on what's important.
This indicator recalculates your moving averages only after meaningful price shifts, allowing you to spot true trends and avoid market whipsaws.
Key Features
✅ Event-Driven Logic
Set events based on:
Points: Absolute price change
Percent: Relative price movement
ATR: Volatility-adjusted dynamic movement
✅ Seven Fully Customizable Moving Averages (MA1–MA7)
Each MA offers:
Custom timeframe
Selection of types (EMA, SMA, WMA, VWMA, HMA, LSMA, DEMA, TEMA, ALMA, RMA)
Adjustable lengths and colors
✅ Reduced Market Noise
MAs adjust only after important price actions — cutting down lag and false signals.
✅ Multi-Timeframe Analysis
You can blend moving averages from different timeframes (e.g., 15m, 1H, Daily) into a single chart — perfect for professional multi-frame strategy building.
Settings Explained
Event Trigger Type: Select Points, Percent, or ATR-based movement.
Event Threshold: The amount of price movement needed to trigger a new calculation.
ATR Length: If ATR mode is selected, this controls the sensitivity.
Each Moving Average (MA1 to MA7) has:
MA Type: Choose the smoothing method that suits your trading style.
Length: The number of bars used in the calculation.
Color: Customize visual styling.
Timeframe: Load MAs from different timeframes into your current chart.
How to Use It in Trading
🔹 Trend Confirmation
Wait for event-triggered updates. Fresh MAs after a significant move are much stronger signals than constantly refreshing MAs.
🔹 Momentum Breakouts
Combine short-term (e.g., MA1, MA2) and long-term (e.g., MA5, MA6) MAs. When short-term MAs cross above/below long-term after an event, it's a powerful breakout cue.
🔹 Dynamic Support/Resistance
Use slow-moving MAs like 100-200 length across different timeframes.
The event-based recalculation keeps them relevant to recent major price moves.
🔹 Volatility Filters
Switch to ATR-based events to adapt moving average updates during volatile periods and calm markets.
Why It Beats Traditional Moving Averages
🚀 No More Overfitting to Every Candle
You focus only on impactful price changes.
🚀 Multi-Timeframe Flexibility
Blend micro and macro views seamlessly in one chart.
🚀 Cleaner Signals, Less Noise
Event-triggered recalculations filter out useless minor price wobbles.
🚀 Customization Beyond Standard MAs
TEMA, HMA, ALMA, DEMA, VWMA — all included for ultra-fine-tuned strategies.
✨ Ready to Upgrade Your Trading?
Forget the old, slow MAs.
Use intelligence. Trade events, not noise.
→ Add Event-Based Multi MA v1.1 to your chart and experience true precision!
Renko SR VolumeDaily ATR Renko SR Levels with Volume Analysis is a technical indicator that combines Renko-based support/resistance levels with volume analysis. It dynamically calculates Renko boxes using the ATR (Average True Range) of daily data and identifies key price levels. The indicator:
- Uses daily ATR to determine Renko box size.
- Draws support/resistance levels based on Renko price structure.
- Analyzes volume between levels to assess their strength.
- Colors levels based on relative volume activity:
- Red – strongest level (high volume activity).
- Orange – strong level.
- Yellow – moderate level.
- Green – weakest level (low volume activity).
- Detects daily Renko-based trends.
This tool helps traders visualize key price zones with volume confirmation, improving decision-making in trend and range markets.

Trend Magnet ProTrend Magnet Pro – Advanced Adaptive Trend & Oscillator Indicator
Overview:
Trend Magnet Pro is a powerful, fully customizable indicator that combines adaptive moving averages with a dynamic oscillator to provide a comprehensive view of market trends and potential reversal points. It integrates multiple analytical layers—volatility, volume, multi-timeframe analysis, and divergence detection—to help traders make informed decisions.
Key Features & Competitive Advantages:
Adaptive Moving Average (MA):
The indicator calculates an adaptive MA by blending your chosen MA type (SMA, EMA, WMA, VWMA, KAMA, or LSMA) with Kaufman’s Adaptive Moving Average (KAMA). This hybrid approach adjusts dynamically to market volatility, ensuring smoother trend detection and reducing noise during erratic periods.
Custom Oscillator Calculation:
A separate oscillator is computed based on the difference between the closing price and a dedicated oscillator MA. This difference is normalized using an ATR-based volatility measure and then smoothed with the Hull MA. This process enhances signal precision by filtering out minor fluctuations.
ATR & Volume Integration:
Using the Average True Range (ATR) for volatility and a volume spike detection mechanism, the indicator filters out weak signals. These features ensure that only significant market moves trigger trading signals.
Multi-Timeframe Analysis:
By incorporating an oscillator analysis on a higher timeframe, Trend Magnet Pro provides an extra layer of confirmation. This multi-timeframe approach improves the reliability of signals, making it easier to identify sustained trends.
Divergence Detection:
The indicator automatically detects bullish and bearish divergences between price movements and the oscillator. These divergences can serve as early warnings for potential trend reversals, adding further depth to your market analysis.
Visual Clarity & Customization:
Trend Magnet Pro offers:
A separate oscillator panel with color-coded histograms.
Overlay plots of the adaptive MA on the price chart.
Clear visual markers for buy and sell signals.
Adjustable parameters for pivot detection and oscillator pressure thresholds.
How to Use Trend Magnet Pro:
Main MA Settings:
Choose your preferred MA type and set the MA length for the main trend analysis.
The adaptive algorithm will blend this with KAMA based on current volatility.
Oscillator Settings:
Set the oscillator’s MA type and its smoothing length.
Fine-tune the oscillator parameters to match your trading style and market conditions.
Common Settings:
Define the ATR length for volatility measurement.
Adjust the volume multiplier and volume SMA period to enable volume spike detection.
Set the low and high pressure thresholds to determine oscillator color changes, reflecting different market pressures.
Multi-Timeframe & Divergence:
Optionally, select a higher timeframe for the oscillator to provide additional confirmation.
Enable divergence detection to highlight potential trend reversals based on price and oscillator pivots.
Signal Interpretation:
Buy Signal: Triggered when the oscillator crosses above zero, accompanied by volume spikes and confirmed by both multi-timeframe analysis and price being above the adaptive MA.
Sell Signal: Triggered under opposite conditions, where the oscillator crosses below zero and the price is below the adaptive MA.
By adjusting these settings, you can tailor Trend Magnet Pro to your specific market and trading strategy, making it an invaluable tool for both trend-following and reversal trading.
Русское Описание
Trend Magnet Pro – Индикатор Адаптивного Тренда и Осциллятора
Обзор:
Trend Magnet Pro – это мощный и полностью настраиваемый индикатор, который объединяет адаптивные скользящие средние с динамическим осциллятором для комплексного анализа рыночных трендов и потенциальных точек разворота. Он интегрирует несколько аналитических слоёв — волатильность, объём, мультитаймфреймовый анализ и детекцию дивергенций — что позволяет принимать обоснованные торговые решения.
Основные преимущества и функциональные возможности:
Адаптивная Скользящая Средняя (MA):
Индикатор рассчитывает адаптивную MA, комбинируя выбранный тип (SMA, EMA, WMA, VWMA, KAMA или LSMA) с Kaufman’s Adaptive Moving Average (KAMA). Такой гибридный подход динамически подстраивается под рыночную волатильность, обеспечивая более плавное определение трендов и снижая уровень шума в нестабильные периоды.
Кастомизированный Расчёт Осциллятора:
Осциллятор вычисляется отдельно на основе разницы между ценой закрытия и специально рассчитанной MA для осциллятора. Эта разница нормализуется с использованием ATR (Average True Range) для оценки волатильности и сглаживается при помощи Hull MA, что позволяет точнее фиксировать значимые сигналы и исключать мелкие колебания.
Интеграция ATR и Объёма:
Применение ATR для измерения волатильности в сочетании с механизмом обнаружения всплесков объёма позволяет отсеивать слабые сигналы. Эти функции гарантируют, что торговые сигналы возникают только при значительных движениях рынка.
Мультитаймфреймовый Анализ:
Встроенный анализ осциллятора на старшем таймфрейме даёт дополнительное подтверждение сигналов. Такой подход повышает надёжность сигналов, помогая выявлять устойчивые тренды.
Детекция Дивергенций:
Индикатор автоматически обнаруживает бычьи и медвежьи дивергенции между движением цены и осциллятором. Эти дивергенции могут служить ранним предупреждением о потенциальном развороте тренда, что добавляет глубины вашему анализу.
Удобство Визуализации и Настройки:
Trend Magnet Pro предлагает:
Отдельную панель осциллятора с цветными гистограммами.
Наложение адаптивной MA на график цены.
Чёткие визуальные сигналы для покупки и продажи.
Настраиваемые параметры для обнаружения пивотов и уровней давления осциллятора.
Как работать с Trend Magnet Pro:
Настройки Основной MA:
Выберите предпочитаемый тип MA и установите период для анализа основного тренда.
Адаптивный алгоритм объединит выбранную MA с KAMA на основе текущей волатильности.
Настройки Осциллятора:
Задайте тип MA для осциллятора и установите период сглаживания.
Подберите параметры осциллятора, чтобы он соответствовал вашему стилю торговли и рыночным условиям.
Общие Настройки:
Определите период ATR для измерения волатильности.
Настройте множитель объёма и период SMA объёма для обнаружения всплесков.
Установите пороги низкого и высокого давления, которые будут влиять на цветовую индикацию осциллятора и отражать рыночное давление.
Мультитаймфреймовый Анализ и Дивергенции:
При необходимости выберите старший таймфрейм для осциллятора, чтобы обеспечить дополнительное подтверждение сигналов.
Включите функцию детекции дивергенций для выявления потенциальных разворотов тренда на основе пивотов цены и осциллятора.
Интерпретация Сигналов:
Сигнал на покупку: Формируется, когда осциллятор пересекает ноль снизу вверх, подтверждаясь всплеском объёма, анализом на старшем таймфрейме и положением цены выше адаптивной MA.
Сигнал на продажу: Формируется при обратных условиях – когда осциллятор пересекает ноль сверху вниз, а цена находится ниже адаптивной MA.
Настройка параметров позволяет адаптировать Trend Magnet Pro под конкретный рынок и торговую стратегию, делая его незаменимым инструментом как для трендового анализа, так и для поиска разворотных сигналов.

BBTrend ModularBBTrend Modular Indicator
The BBTrend Modular Indicator is designed to provide multiple perspectives on market dynamics by leveraging Bollinger Bands. It consists of several independent modules, each analyzing a specific aspect of price action and volatility. By default, all modules are enabled except the Adaptive BBTrend module, which remains off unless activated.
Modules Overview
1. BBTrend (Basic Module)
- Purpose: Calculates the difference between the absolute differences of the upper and lower Bollinger Bands for short and long periods.
- Working Principle: By comparing the divergence between the bands of two different timeframes, this module gives an indication of trend strength. A positive value may indicate bullish conditions, while a negative value suggests bearish conditions.
2. BB Expansion (Volatility Analysis)
- Purpose: Measures market volatility by comparing the widths of the Bollinger Bands for short and long periods.
- Working Principle: An increased width in the short-period bands relative to the long-period bands signals rising volatility and trend expansion. Dynamic color coding further helps in interpreting volatility changes.
3. BB Momentum Trend (Slope Analysis)
- Purpose: Assesses market momentum by analyzing the slope (or the rate of change) of the short-period Bollinger Band’s middle line.
- Working Principle: A positive slope indicates upward (bullish) momentum, whereas a negative slope points to downward (bearish) momentum. This helps traders gauge the speed at which the trend is evolving.
4. Adaptive BBTrend (Adaptive Calculation)
- Purpose: Adjusts the Bollinger Bands’ lengths dynamically using the Average True Range (ATR) to better respond to changing market volatility.
- Working Principle: An adaptive factor is computed based on the ATR relative to the closing price. This factor recalculates the short and long periods, making the indicator more responsive in volatile markets. Note: This module is disabled by default.
5. Volume-Weighted BBTrend (Volume Adjustment)
- Purpose: Integrates trading volume into the BBTrend calculation to refine the trend signal.
- Working Principle: By applying a volume weighting factor, the module gives more significance to high-volume bars. This results in a nuanced view of market sentiment, where high trading activity can strengthen the trend signal.
Русское описание
Индикатор BBTrend Modular
Индикатор BBTrend Modular создан для предоставления различных взглядов на динамику рынка с использованием полос Боллинджера. Он состоит из нескольких независимых модулей, каждый из которых анализирует определенный аспект ценового действия и волатильности. По умолчанию все модули включены, за исключением модуля Adaptive BBTrend, который остается выключенным, если его специально не активировать.
Обзор модулей
1. BBTrend (Базовый модуль)
- Назначение: Рассчитывает разницу между абсолютными разностями верхней и нижней линий полос Боллинджера для короткого и длинного периодов.
- Принцип работы: Сравнивая дивергенцию полос для двух разных временных периодов, модуль предоставляет информацию о силе тренда. Положительное значение может свидетельствовать о бычьем тренде, а отрицательное — о медвежьем.
2. BB Expansion (Анализ волатильности)
- Назначение: Оценивает волатильность рынка путем сравнения ширины полос Боллинджера для короткого и длинного периодов.
- Принцип работы: Увеличение ширины короткого периода по сравнению с длинным сигнализирует об увеличении волатильности и расширении тренда. Динамическая раскраска помогает визуально интерпретировать изменения волатильности.
3. BB Momentum Trend (Анализ наклона)
- Назначение: Анализирует моментум рынка путем оценки наклона (темпа изменения) средней линии полос Боллинджера для короткого периода.
- Принцип работы: Положительный наклон указывает на бычий моментум, а отрицательный — на медвежий, что помогает оценить скорость изменения тренда.
4. Adaptive BBTrend (Адаптивный расчет)
- Назначение: Динамически корректирует периоды расчета полос Боллинджера с использованием Average True Range (ATR) для лучшей адаптации к изменяющейся волатильности рынка.
- Принцип работы: Вычисляется адаптивный коэффициент на основе ATR относительно цены закрытия, после чего пересчитываются короткий и длинный периоды. Такой подход позволяет индикатору быть более чувствительным в условиях высокой волатильности. Примечание: Модуль по умолчанию выключен.
5. Volume-Weighted BBTrend (Объёмно-взвешенный расчет)
- Назначение: Включает объем торгов в расчет BBTrend для уточнения сигнала тренда.
- Принцип работы: Модуль применяет объемное взвешивание, придавая больший вес барам с высоким объемом. Это позволяет получить более точное представление о настроениях рынка, когда высокий объем торговли усиливает сигнал тренда.

Interval & Session Market StatisticsThe "Interval & Session Market Statistics" indicator is designed to uncover recurring patterns and market inefficiencies by analyzing market cycles. By breaking down price movements into defined intervals and sessions, this tool helps traders pinpoint periods of strength and weakness—identifying both bullish and bearish trends with clear percentage breakdowns. Its comprehensive visual tables make it easier to detect accumulation, distribution, and potential turning points, providing valuable insights that can be leveraged to optimize trading strategies.
Important: If the indicator does not reveal a strong bias toward either short or long positions and the statistics hover around 50%, consider reducing the analysis start date and adjusting the end time of the first interval in the settings. Over longer periods, the market tends to revert to a 50/50 balance, so significant deviations are often more visible in weekly or monthly intervals. Since this indicator focuses on intraday cycles, fine-tuning these parameters is crucial for capturing actionable trends.
Индикатор "Interval & Session Market Statistics" разработан для выявления закономерностей и неэффективностей на основе рыночных циклов. Разбивая ценовые движения на заданные интервалы и сессии, инструмент помогает трейдерам определить периоды силы и слабости, выявляя как бычьи, так и медвежьи тренды с наглядным процентным отображением. Подробные таблицы позволяют обнаруживать зоны накопления и распределения, а также потенциальные разворотные моменты, что даёт ценные данные для оптимизации торговых стратегий.
Важно: Если индикатор не выявляет ярко выраженного перекоса в сторону шортового или лонгового приоритета, и статистика колеблется в районе 50%, рекомендуется уменьшить дату начала анализа и поработать с окончанием первого интервала в настройках индикатора. На более длительных периодах рынок обычно стремится к балансу в 50%, поэтому существенные отклонения эффективнее искать в рамках недельных или месячных интервалов. Поскольку данный индикатор ориентирован на внутридневные циклы, корректировка этих параметров имеет решающее значение для выявления значимых трендов.

Market Pulse"Market Pulse" is a comprehensive technical analysis indicator designed to provide traders with insights into market dynamics by combining several analytical modules:
Turning Points & Forecasts: Identifies potential market turning points by analyzing pivot highs and lows over a specified period. It calculates forecast levels (A, B, C) based on the averages and standard deviations of these pivots, offering potential support and resistance zones.
TPO (Time Price Opportunity) Profile: Analyzes the distribution of prices over a set number of bars to determine key levels such as Point of Control (POC), Value Area High (VAH), and Value Area Low (VAL). These levels help traders understand where the majority of trading activity has occurred, indicating potential support and resistance areas.
High Volume Highlight: Detects bars with significantly higher volume compared to a moving average benchmark, highlighting potential areas of increased market activity and interest.
Open Interest Analysis: Monitors open interest data for both USD and USDT pairs, comparing current values to their moving averages. This analysis helps gauge market sentiment and potential future price movements based on the commitment of traders.
------------------------------------------------------------------------------------------
"Market Pulse" — это комплексный индикатор технического анализа, предназначенный для предоставления трейдерам глубокого понимания динамики рынка посредством объединения нескольких аналитических модулей:
Разворотные точки и прогнозы: Определяет потенциальные разворотные точки рынка, анализируя экстремумы (максимумы и минимумы) за заданный период. Рассчитывает прогнозные уровни (A, B, C) на основе средних значений и стандартных отклонений этих экстремумов, предлагая потенциальные зоны поддержки и сопротивления.
Профиль TPO (Time Price Opportunity): Анализирует распределение цен за определённое количество баров для определения ключевых уровней, таких как Point of Control (POC), Value Area High (VAH) и Value Area Low (VAL). Эти уровни помогают трейдерам понять, где происходила основная торговая активность, указывая на потенциальные области поддержки и сопротивления.
Выделение высокого объёма: Обнаруживает бары с значительно более высоким объёмом по сравнению с движущейся средней, выделяя потенциальные области повышенной рыночной активности и интереса.
Анализ открытого интереса: Отслеживает данные об открытом интересе для пар в USD и USDT, сравнивая текущие значения с их скользящими средними. Этот анализ помогает оценить рыночные настроения и потенциальные будущие ценовые движения на основе вовлечённости трейдеров.

Dynamic Regression Divergence (DRD)The Dynamic Regression Divergence (DRD) indicator is an adaptive oscillator designed to assess the deviation of the current price from its expected trend, as determined by linear regression. It calculates a regression line over a specified period and measures the difference between the actual price (e.g., the closing price) and the regression value, normalizing this deviation by the current market volatility (using standard deviation). The resulting value is displayed as an oscillator oscillating around zero.
Signals:
– When the oscillator exceeds a positive threshold (e.g., +1.5 standard deviations), it may indicate overbought conditions and a potential trend reversal to the downside.
– Conversely, when the oscillator falls below a negative threshold (e.g., -1.5 standard deviations), it signals oversold conditions and a possible reversal to the upside.
Advantages:
– Dynamic adaptation to changing market volatility.
– Simplicity of implementation using basic mathematical functions in Pine Script.
– A unique combination of trend analysis and normalized divergence measurement, helping traders identify moments of abnormal price behavior.
Индикатор Dynamic Regression Divergence (DRD) – это адаптивный осциллятор, разработанный для оценки отклонения цены от ожидаемой тенденции, полученной с помощью линейной регрессии. Он рассчитывает регрессионную линию на выбранном периоде и измеряет разницу между фактической ценой (например, ценой закрытия) и значением регрессии, нормируя её на основе текущей волатильности (с использованием стандартного отклонения). Полученное значение отображается в виде осциллятора, колеблющегося вокруг нуля.
Сигналы:
– Если осциллятор значительно превышает положительный порог (например, +1,5 стандартных отклонений), это может указывать на перекупленность и потенциальный разворот вниз.
– Если осциллятор опускается ниже отрицательного порога (например, -1,5 стандартных отклонений), это сигнализирует о перепроданности и возможном развороте вверх.
Преимущества:
– Динамичная адаптация к изменяющейся волатильности рынка.
– Простота реализации с использованием базовых математических функций Pine Script.
– Уникальное сочетание трендового анализа и нормировки отклонений, позволяющее трейдерам выявлять моменты аномального поведения цены.