Breakout Machine V2 - Alerts - Bitcoin BeatsHello, Hello, Hello and welcome back to Bitcoin Beats.
As the title suggests, this is Version 2 of The Breakout Machine Alerts version.
Unlike the previous version, this one has been fine-tuned to work best on Binance Futures ( BTCUSDT ).
PLEASE BE CAREFUL WITH YOUR LEVERAGE AND DON'T GET REKT.
Trade at your own risk! Good luck!
This strategy takes MACD and Volume spikes to calculate pumps and dumps in the bitcoin market.
I've also added custom backtesting inputs and leverage for you all to experiment with and see the profitability of the Strategy.
Alerts version coming soon...
Thank you, And goodbye, from Bitcoin Beats.
"bitcoin" için komut dosyalarını ara

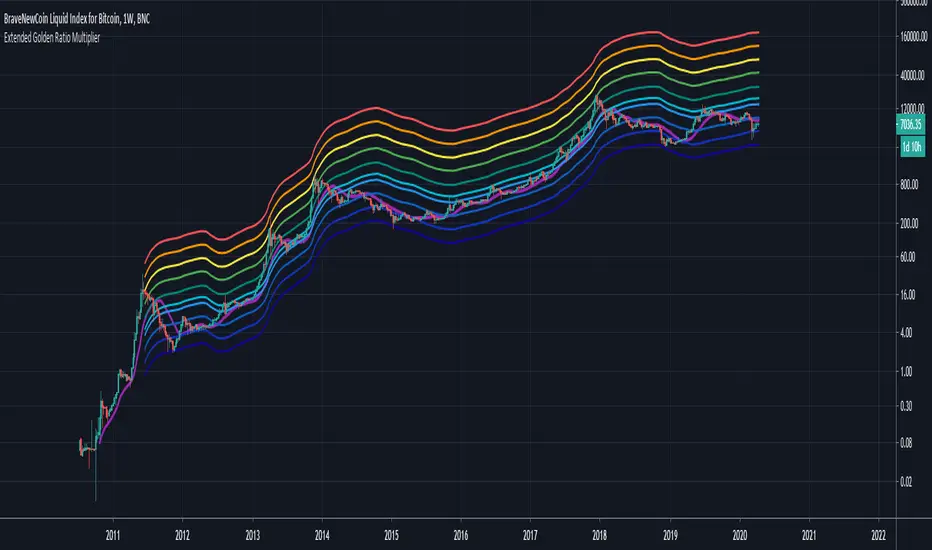
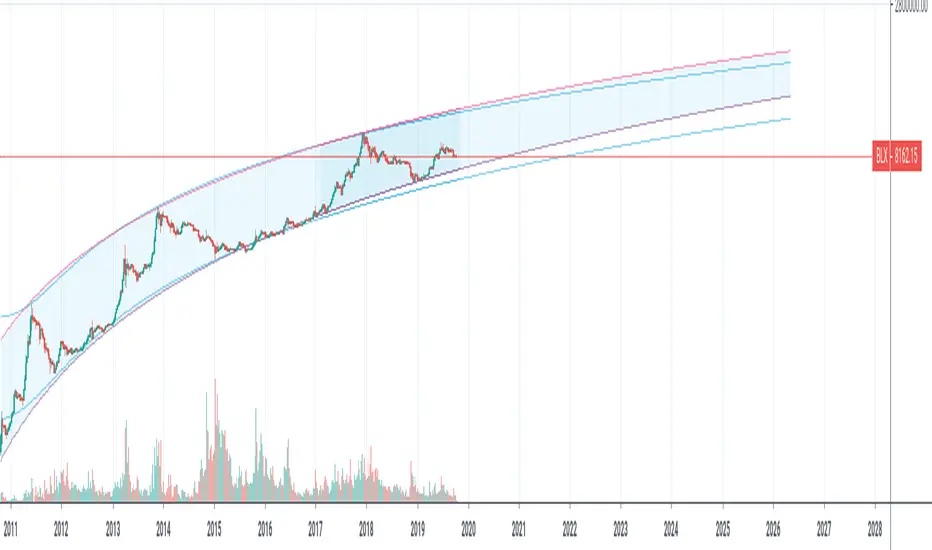
Extended Golden Ratio Fibonacci Multiplier + Pi Cycle TopHere I present the Golden Ratio Multiplier and Pi Cycle Top Indicator originally conceptualized by Philip Swift, and extend it. Due to popular demand for a nicer looking color scheme and added MAs & functionalities, I decided to publish this indicator, of course with free access for everyone as the discovery is attributed to Philip. The indicator works best for BLX (BraveNewCoin Liquid Index for Bitcoin) on daily (D) or weekly (W) timeframe. Other timeframes are not supported (and also generally not needed as this is a rather high timeframe indicator).
Added functionality:
- Additional Fibonacci MAs for Bottom: 0.618*MA(50W) and 0.382*MA(50W), which seem to be distinct high timeframe support MAs
- Pi Cycle Top and all Fibonacci MAs can be plotted or hidden individually
- Correct MA values for daily (D) and weekly (W) timeframes are automatically assigned, so you do not need to change anything when you switch between those timeframes.
It is generally said that Bitcoin's peaks always only reach a lower yearly Fibonacci MA. The next one to eye would be the 3*MA(50W) = 3*MA(350D) here plotted in dark green. Historically when the MA(16W) = MA(111D) (here plotted in magenta) line crossed the 2*MA(50W) = 2*(350D) line (plotted in cyan) from below a cycle peak is reached. This indicator might therefore be a good high timeframe indicator for Bitcoin trading. Of course this is no financial advice.
PRIME+ EMASPRIME+ EMAS is an indicator that allows you to see some of the best hourly, daily, weekly and monthly EMAs/SMAs for trading cryptocurrencies; in particular Bitcoin.
These are timeframe-fixed EMAs/SMAs, which means that they will provide you with the same data in all timeframes, unlike most EMAs/SMAs indicators out there.
You also have the option to show them in full or a simplified version of them to declutter your chart.
This PRIME+ version also has 3m timeframe EMAs for a more detailed analysis of the market.
For access and questions, please message me here on TradingView. I will be happy to help!

PRIME - EMASPRIME - EMAS is an indicator that allows you to see some of the best hourly, daily, weekly and monthly EMAs/SMAs for trading cryptocurrencies; in particular Bitcoin.
These are timeframe-fixed EMAs/SMAs, which means that they will provide you with the same data in all timeframes, unlike most EMAs/SMAs indicators out there.
You also have the option to show them in full or a simplified version of them to declutter your chart.
For access and questions, please message me here on TradingView. I will be happy to help!

BTC Bullish or Bearish (Joy)Quite often we are faced with the question of whether Bitcoin is macro bullish or bearish.
I tried to take a punch at this.
There many ways to find that answer.
This is one crude way.
Whenever the background colour is light lime, it means it thinks the Bitcoin is macro bullish
Whenever the background colour is red lime, it means it thinks the Bitcoin is macro bearish
How would I use this information?
I can possibly use it in position sizing and hedging. If I see a sell in a lime background, I can potentially just hedge & vice versa.
Do note that it works best in the higher timeframes.
Do note that it is not supposed to be used to open any new trade or to close any trade.
I use it alongside other indicators for confirmation bias.
This can possibly be used for other instruments. As I only use it for trading BTCUSD, I have crudely tested for BTCUSD
For info on gaining access see the ⬇ link below ⬇ in our signature field & direct message me. I have a busy schedule at my own workplace. Trading is my hobby. Hence, please be kind to me if I am late in replying.
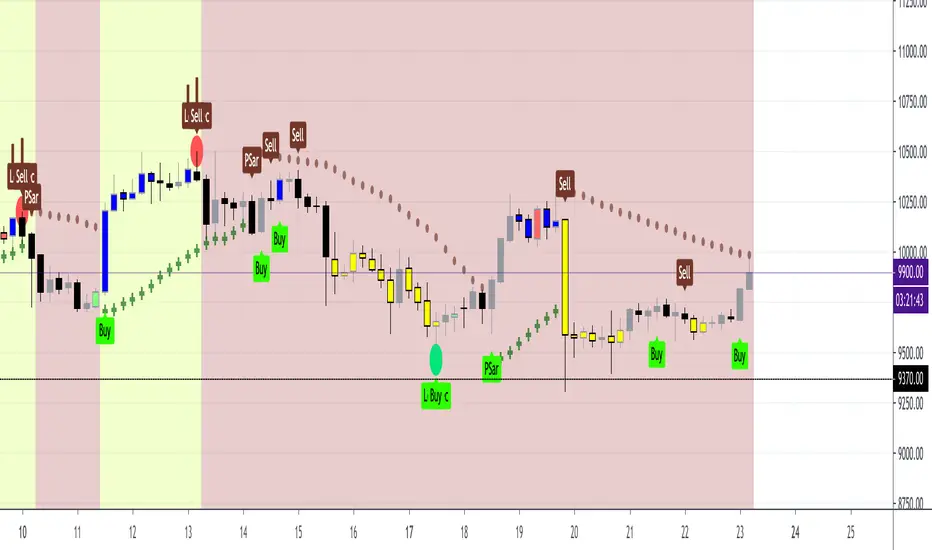
Sideways Money - Bitcoin BeatsHello, Hello, Hello,
And welcome back to Bitcoin Beats.
This is another version of my previous script, "Range Indicator - Bitcoin Beats".
Designed initially for breakouts but shows adaptive ranges and consolidation in XBTUSD(Haven't tested other assets but should do the same thing).
If we are consolidating (which is most of the time) a good strategy to trade would be to trade ranges. However, as soon as you spot the range it can feel like the range has changed so you lose out on making the monies.
This indicator plots out the average range in a consolidation.
It also shows you when the range has broken in a direction that it previously hasn't broken in. This essentially signifies the the trend changing and gives warning that trading the range may no longer be valid.
There are a few ways to trade this indicator and I will explain 2 of them here.
PLEASE TRADE AT YOUR OWN RISK. YOUR FUNDS ARE YOUR RESPONSIBILITY.
IF YOU TRADE WITH THESE STRATEGIES, YOU ARE TO BLAME FOR YOUR OWN LOSSES.
BY USING THIS INDICATOR YOU AGREE THAT I WILL NOT BE HELD LIABLE IN THE CASE OF YOU LOSING FUNDS.
Strategy 1:
- Have 2 bitmex accounts open.
- Use on the 30m, 1h, 3h or 12h.
- Long AND Short on both accounts when we hit the middle area. This is called the "Reload Zone".
- When we hit the edge of each side of the plotted range, close the positions in profit.
- You will then have 1 trade underwater.
- If the range is solid, the price will move back to the Reload Zone in which you reload you position that you took profit with.
- You then have both a Long AND Short open after 1 profitable trade.
- Rinse and repeat until you get the "STRATEGY CAUTION" message signifying that the range will most likely break soon.
Strategy 2(least profitable):
- When the "STRATEGY CAUTION" Message appears, you can long or short depending on which side it breaks toward.
- If we break down, short.
- If we break up, Long.
I wouldn't advise this second strategy if you are a beginner as the results are inconclusive and it's more of a hybrid trading strategy, meaning you have to know how to trade with price action flowing.
Usually if it is appearing volatile, you can go to a higher time frame and find the exact range it's catering to, adjusting your strategy accordingly.
See you soon,
Goodbye, from Bitcoin Beats.

BLX GravityWavesEstimates generational tops and bottoms for bitcoin. Only works correctly for the BLX ticker (BNC:BLX). Although it has worked extremely well until the point of publication, don't assume it will work in the future; do your own research! :)

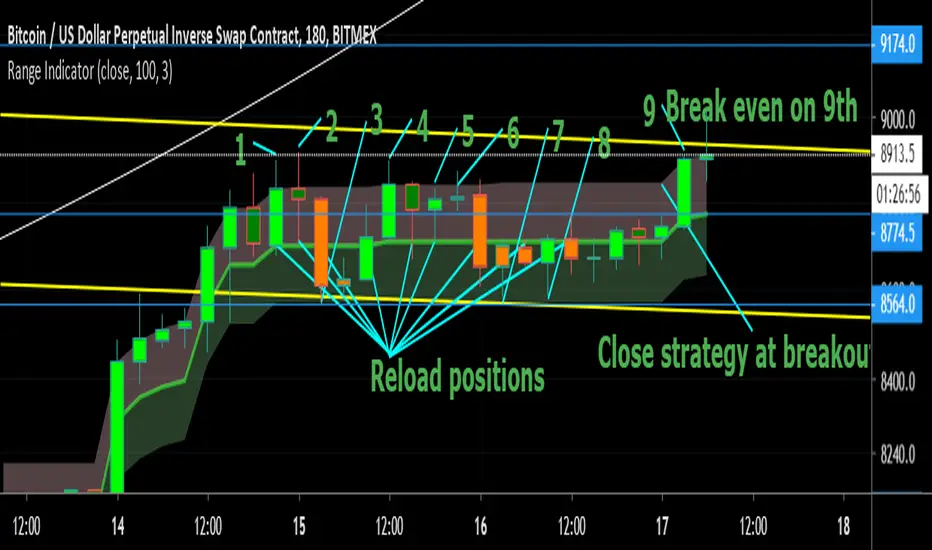
Range Indicator - Bitcoin BeatsHello, Hello, Hello,
And welcome back to Bitcoin Beats.
Today I'm going to show you my Ranges Indicator. Designed initially for breakouts but an analysts mind quickly spots the other uses for this indicator.
If we are consolidating (which is most of the time) a good strategy to trade would be to trade ranges. However, as soon as you spot the range it can feel like the range has changed so you lose out on making the monies.
This indicator plots out the average range in a consolidation allowing you to take action and make those monies.
I've highlighted a profitable strategy in the picture that means you can make money on bitcoin when it goes sideways.
Usually if it is appearing volatile, you can go to a higher time frame and find the exact range it's catering to, adjusting your strategy accordingly.
The strategy I've highlighted in accordance with this indicator is longing AND shorting from the center point of a range and cashing out either side until the range breaks.
If you'd like a trial, please leave a comment and I'll add you to the list :)
See you soon,
Goodbye, from Bitcoin Beats.
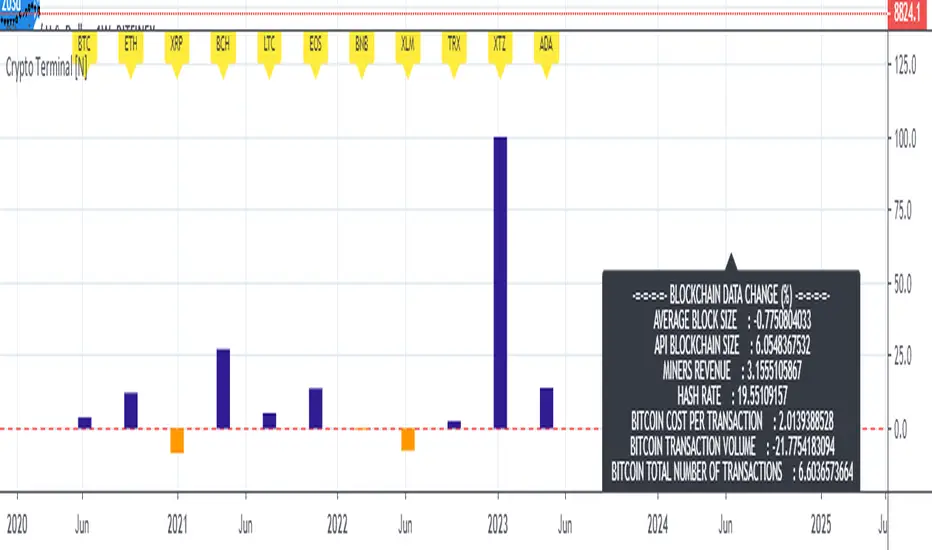
Live Mini Terminal 7 : Major Cryptocurrencies Change DataThis script displays relative data changes occurring in the adjustable period and/or adaptive automatic period in U.S Dollar based Major Cryptocurrencies.
This script was inspired by the data terminals used by commercial traders.
Period selection can be set in the menu.
This script uses the adaptive period algorithm used by Autonomous LSTM and Relativity scripts.
Or you can set the period manually from the menu.
For more information about adaptive period:
This script works only for 1 day (1D) and 1 week (1W) time frames.
Since usage of Blockchain Data, the most efficient time frame is 1 week (1W) .
Features
Value changes on a percentage basis (%)
The Info Panel contains percentage-based blockchain data changes.
CRYPTOCURRENCIES
BTC : Bitcoin
ETH : Ethereum
XRP : Ripple
BCH : Bitcoin Cash
LTC : Litecoin
EOS : EOS
BNB : Binance Coin
XLM : Stellar
TRX : Tron
XTZ : Tezos
ADA : Cardano
INFO PANEL
Average Blockchain Size change data
API Blockchain Size change data
Miners Revenue change data
Hash Rate change data
Bitcoin Cost Per Transaction change data
Bitcoin Transaction Volume change data
Bitcoin Total Number of Transactions change data
USAGE
The script can be used as an indicator by putting it under the chart as shown above.
It is necessary to enlarge to see clearly.
Since it is not often looked at,
such use is the best method for healthy interpretation.
Best regards.
2-Year MA MultiplierIndicator built by lookintobitcoin specifically for identifying ideal Bitcoin buy and sell regions.
lookintobitcoin describes this indicator as:
"The 2-Year MA Multiplier is intended to be used as a long term investment tool.
It highlights periods where buying or selling Bitcoin during those times would have produced outsized returns.
To do this, it uses a moving average (MA) line, the 2yr MA, and also a multiplication of that moving average line, 2yr MA x5.
Note: the x5 multiplication is of the price values of the 2yr moving average, not of its time period.
Buying Bitcoin when price drops below the 2yr MA (green line) has historically generated outsized returns. Selling Bitcoin when price goes above the 2yr MA x 5 (red line) has been historically effective for taking profit."

BEST Mayer MultipleHello traders
I'm not a HODLer by any means. I know when to sell (or I think I know....) when an asset starts going against me too much.
Even if it's a "long-term" investment.
My mentor used to telling me this: "If a short-term trade becomes a long-term investment, then you're in for a hell of a ride".
I have no clue if Bitcoin/BTC will go back up or not - I don't even care because I'm an intraday trader.
What if BTC was actually a way to accumulate more fiat? Satoshi fooled us
I coded this Mayer Multiple according to the specifications below. By the way, I'm a big fan of Willy Woo. I've been monitoring all his work since I learned about crypto (10 minutes ago.... it's a joke come on)
charts.woobull.com
Scaling
To respect the Mayer's multiple model, I recommend to select the Logarithmic scaling as shown below
imgur.com
What Mayer's model says
Using the reference below, the model says we're in the oversold zone. But, we can be in that zone for months/years...
When a model says an asset could bounce in a 1000-7000 USD range... well... I don't know how I would be able to perform optimally with that insight. This is very subjective and not a recommendation.
Mayer's Multiple model reference
All the BEST
Dave

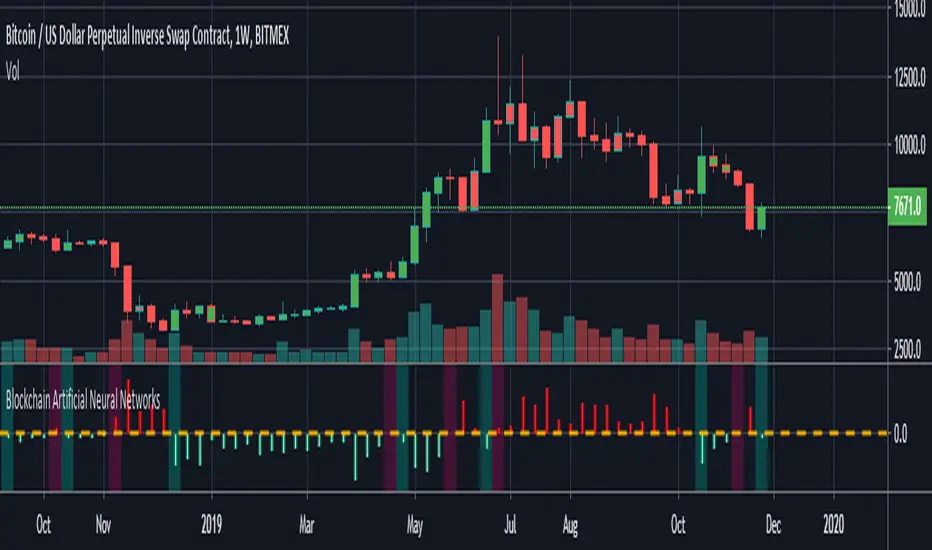
Blockchain Artificial Neural NetworksI found a very high correlation in a research-based Artificial Neural Networks.(ANN)
Trained only on daily bars with blockchain data and Bitcoin closing price.
NOTE: It does not repaint strictly during the weekly time frame. (TF = 1W)
Use only for Bitcoin .
Blockchain data can be repainted in the daily time zone according to the description time.
Alarms are available.
And you can also paint bar colors from the menu by region.
After making reminders, let's share the details of this interesting research:
INPUTS :
1. Average Block Size
2. Api Blockchain Size
3. Miners Revenue
4. Hash Rate
5. Bitcoin Cost Per Transaction
6. Bitcoin USD Exchange Trade Volume
7. Bitcoin Total Number of Transactions
OUTPUTS :
1. One day next price close (Historical)
TRAINING DETAILS :
Learning cycles: 1096436
AutoSave cycles: 100
Grid :
Input columns: 7
Output columns: 1
Excluded columns: 0
Training example rows: 446
Validating example rows: 0
Querying example rows: 0
Excluded example rows: 0
Duplicated example rows: 0
Network :
Input nodes connected: 7
Hidden layer 1 nodes: 5
Hidden layer 2 nodes: 0
Hidden layer 3 nodes: 0
Output nodes: 1
Controls :
Learning rate: 0.1000
Momentum: 0.8000
Target error: 0.0100
Training error: 0.010571
The average training error is really low, almost worth the target.
Without using technical analysis data, we established Artificial Neural Networks with blockchain data.
Interesting!
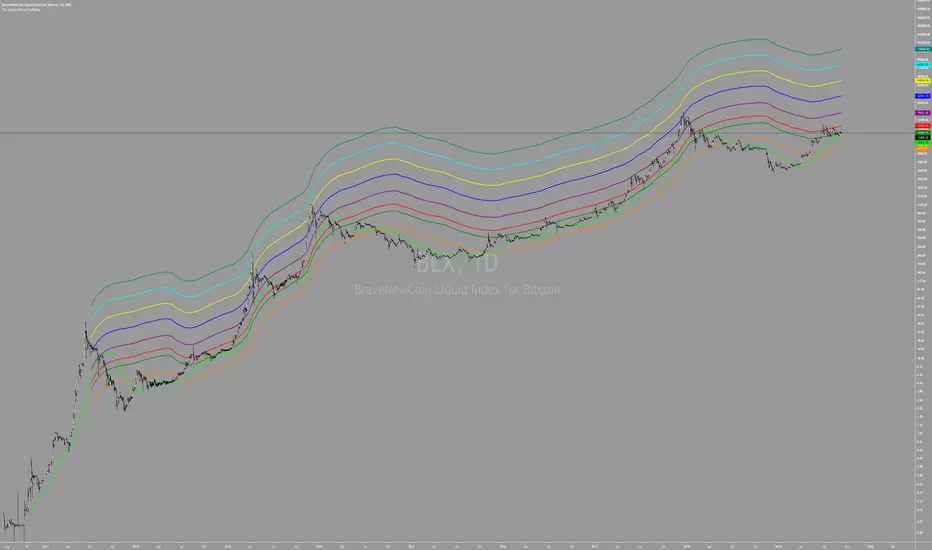
Yope BTC PL channelThis is a new version of the old "Yope BTC tops channel", but modified to reflect a power-law curve fitted, similar to the model proposed by Harold Christopher Burger in his medium article "Bitcoin’s natural long-term power-law corridor of growth".
My original tops channel fitting is still there for comparison. In fact, it looks like the old tops channel was a bit too pessimistic.
Note that these channels are still pure naive curve-fitting, and do not represent an underlying model that explains it, like is the case for PlanB's "Modeling Bitcoin's Value with Scarcity" which uses Stock-to-Flow.
The motivation for this exercise is to observe how long this empirical extrapolation is valid. Will the price of bitcoin stay in either of both channels?
Note on usage: This script _only_ works with the BLX "BraveNewCoin Liquid Index for Bitcoin" in the 1D, 3D and 1W time-frames!
It may be necessary to zoom in and out a few times to overcome drawing glitches caused by the extreme time-shifting of plots in order to draw the extrapolated part.
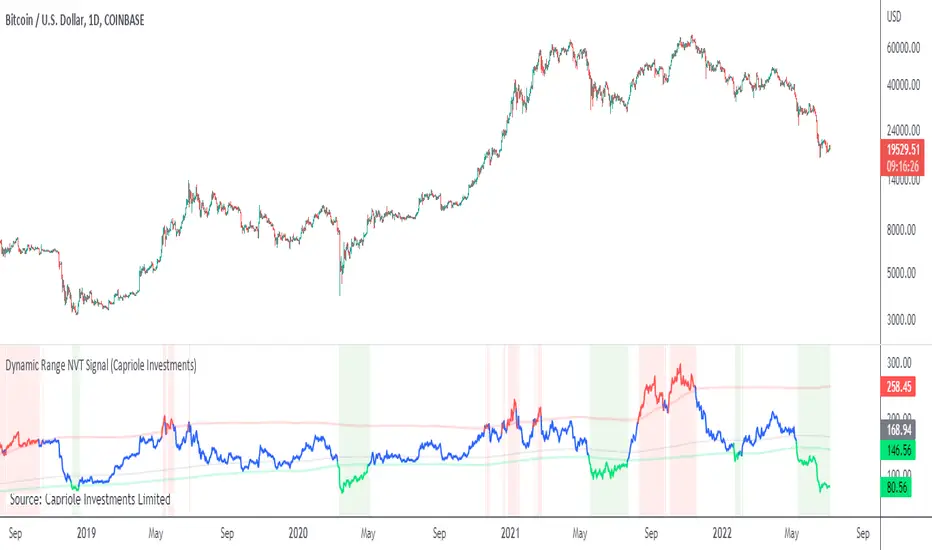
Dynamic Range NVT SignalABOUT DYNAMIC RANGE NVT SIGNAL
NVT Signal (Credit: Willy Woo and Dmitry Kalichkin) is akin to a "PE" ratio for Bitcoin , and can be used to identify when Bitcoin is overbought or oversold based on the relative value of transactions sent across the network.
This indicator includes a 2 year moving average and standard deviation to identify outlier values, instead of declaring a static high-low range for relative valuation.
THEORY
A dynamic "high-low" range was chosen for the following reasons:
- Bitcoin is only 10 years old, it is likely that relatively "high" and relatively "low" NVT values will change with time, as have PE ratios over the last century.
- Some transactions are now made off-chain (eg. Liquid Network's private side-chain which is used by many major exchanges). If this trend continues, we can expect "normal" NVT ranges to increase with time (as the relative portion of public on-chain transaction values decreases).
CALCULATION
- NVT = Circulating Market Cap / 90 average On-chain Transaction Value*
- Overbought (default): NVT > 2-year mean + 2*standard deviations. I.e. NVT Signal is in the top 2.5% of values for the prior 2 years.
- Oversold (default) NVT < 2-year mean - 0.5 * standard deviations.**
*Data source: Blockchain.info, estimated transaction value does not include returned to sender as change.
**Oversold under 2-year mean was chosen due to the skewness of NVT Signal, it is not normally distributed. For example: NVT Signal has never been less than the 2-year mean - 2* standard deviations. This may change in the future.
NOTES ON USAGE
- Use with care. Bitcoin can remain "overbought" or "oversold" for extended periods (eg. 2015-2016).
- As Bitcoin ages, the validity of NVT Signal will need to be monitored. Particularly with respect to potentially increasing use of side-chains, private transactions and potentially the lightning network.
- It is likely that a 2-year “look back period” for calculating mean and standard deviation will not be sufficient in the decades to come. As Bitcoin matures and stabilizes (some time in the future), a longer "look back period" should probably be used. To allow for this, the defaults for this indicator can be easily adjusted.
Cyatophilum H.A. Swing [ALERT SETUP]Hi guys, to celebrate the beginning of a new altcoins cycle, I created a Swing trade Indicator. (It's a joke, there will not be any altcoins cycle)
Cyatophilum Heikin Ashi Swing
This indicator will allow us to create one strategy for each pair and never miss those big swings ever again!
HOW BEAT BUY & HOLD WORKS
This kind of strategy is a safe long term investment , usually played in high timeframes such as 4H, 1D etc.
It is perfect for beginners in trading as the process is very simple: buy and sell when you receive the alert. The high timeframes allows to trade manually by receiving alerts on your phone or email, but you also can automate it if you prefer.
The primary goal of these strategies is to increase your capital faster than someone simply holding the asset .
The trades are made with no leverage and 100% equity . It is for those who want to grow their portfolio fast without risking to lose everything. You can use several strategies at once, in this case split your equity accordingly.
HOW DOES IT WORK?
The Heikin Ashi candles are very usefull. This strategy is built upon H.A. candles but is used on normal candles, because H.A. candles price are an average of real candles and we want to know the real price. I did the trick by recalculating the H.A. open, high, low and close with the original formula based on the real candles's ohlc. This allows me to use the strategy tester and backtest with real results.
HOW TO USE
Creating a signal is as simple as adding the indicator called to your chart and click "Set alert". Select "Once per bar close" for your alert options.
There are 3 alerts:
- BUY
- SELL
- BUY OR SELL (for free TV users)
Sample Backtest results
Bitcoin/Dollar
Ethereum/Bitcoin
Basic Attention Token/Bitcoin
> > Start using the indicator now < <
Note: This version is the ALERT SETUP. You can find the Backtest version on my profile scripts.

The Golden Ratio MultiplierBy Philip Swift
As Bitcoin continues to progress on its adoption journey, we learn more about its growth trajectory.
Rather than Bitcoin price action behaving like a traditional stock market share price, we see it act more like a technology being adopted at an exponential rate.
This is because Bitcoin is a network being adopted by society, and because it is decentralised money with limited supply, its price is a direct representation of that adoption process.
There are a number of regression analysis tools and stock to flow ratio studies that are helping us to understand the direction of Bitcoin’s adoption curve.
The new tool outlined in this paper brings an alternative degree of precision to understanding Bitcoin’s price action over time. It will demonstrate that Bitcoin’s adoption is not only following a broad growth curve but appears to be following established mathematical structures.
In doing so, it also:
Accurately and consistently highlights intracycle highs and lows for Bitcoin’s price.
Picks out every market cycle top in Bitcoin’s history.
Forecasts when Bitcoin will top out in the coming market cycle.
To begin, we will use the 350 day moving average of Bitcoin’s price. It has historically been an important moving average because once price moves above it, a new bull run begins.
more ...
medium.com
All rights reserved to Philip Swift (@PositiveCrypto)
RSI Trendchange for BTC by OSHELLThe script indicates typical turning points on RSI for bitcoin. Buying indicator is more reliable especially for short term trades.

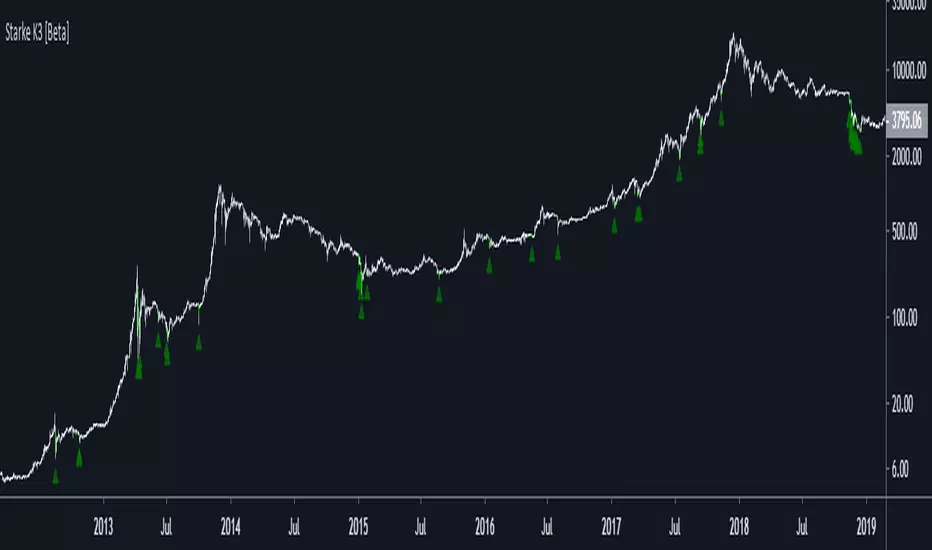
Starke K3 [Beta]The K3 is a long-term Indicator primarily for Bitcoin.
This indicator can also be used in other markets, and performs extremely well in up-trends for buying the dips and selling the tops.
The Beta will not print any signals past 7th June 2019 and is only meant for back-testing.
By default, Stock to Flow Filter is on. To test other markets, turn the option off in the settings.
Want long-term access? Find our discord on twitter @StarkeBTC
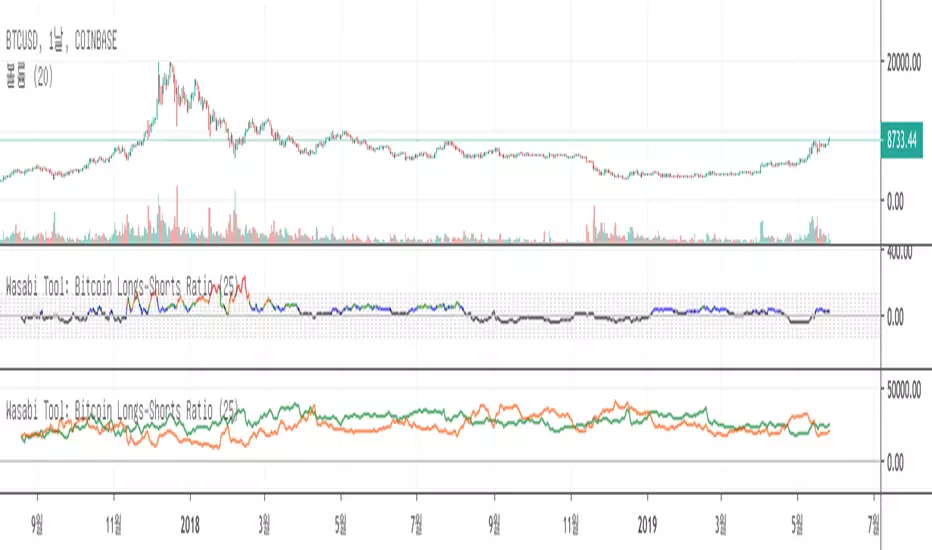
Wasabi Tool: Bitcoin Longs-Shorts Ratio
This indicator is to show how much more Bitcoin Longs exist in comparison to Bitcoin Shorts in percent.
It is calculated as * 100 (%)
By default, the indicator displays the Longs-Shorts ratio. You can also show the actual Bitcoin Longs and Shorts numbers instead by disabling 'Show Longs-Shorts Ratio' in the settings. In this case, the Longs are in green and the Shorts are in red.
The data is coming from Bitfinex exchange.
This indicator can be used for free . Please subscribe and Like it.
현 지표는 비트코인 숏 물량대비 롱 물량이 얼마나 많은지를 퍼센티지(%)로 표현하는 지표 입니다.
계산식은 (Bitcoin Longs - Bitcoin Shorts) / Bitcoin Shorts ] * 100 (%) 입니다.
기본 표시값은 롱-숏 비율이지만, 설정에서 비율이외에도 'Show Longs-Shorts Ratio' 를 비활성화하면 비트코인 롱 과 숏 실제 수치 표시를 할 수 있습니다.
이 경우, 초록선은 롱 물량이고, 빨간선은 숏 물량입니다.
자료는 Bitfinex 거래소 자료 입니다.
이 지표는 무료로 사용 가능 합니다. 팔로우+좋아요 부탁 합니다~
Momentum Signal Moving AverageThis is a script with one modified indicator that mainly tracks and executes positions openings by calculating volume and "enthusiasm" from the exchanges coin pairs. I recommend that it is used on a 15m chart.
When it is a bullish trend it is configured to take profit, but this is of course something you can set values or disable. In bearish trends, the script opens bigger positions, and when a bounce happens the script starts taking profit.
In stagnation, the script used to be week, and made losses. However, with the added scalping feature it seems to at least even it out, or even make profit as I have seen now.
It's still a very 1.0 script and will get updated to make sure the profit keeps getting higher percentage.
I use the Alerts Trader extension to execute orders from Tradingview in Chrome via Bitmex API.
I use it on Bitmex, but surely you can use it on other exchanges that are supported in the Alerts Trader extension, which is extensive.
Important : You will be able to add this script to your chart, but you won't be able to se the source code, so to make it work you need to set the alerts right, with correct code for it to work.
Here is where I come in:
I'll give each user 3 day trial, and after that, if you are satisfied and want to run it longer, you can subscribe for $49/month.
And if you have bigger capital, I will install it and configure it to match the amount of contracts you wish to have.
If you are a person with big capital, you can get 1 week of trial.
And for people with big capital, you can get personal support from me when needed to alter settings or create new alerts. This will cost $50 each time.
But remember, you can also run the trial on the Bitmex testnet, but the volume is very low there so the bot does not preform as well on the testnet as it does on the mainet with big volume.
I am willing to let someone, a 3rd party, with good reputation test it for a few days and make an honest review after.
Disclaimer: I cannot guarantee that this script will make you rich, but after a week of testing, both on testnet and mainnet, the results are good enough for me. (I am no financial expert or professional trader. Any losses from the algorithm is not my issue, use it at your own risk. Always run the script/bot with money you can afford to lose)
All payments to me are made in bitcoin.

🔗 Blockchain Fundamentals - NVU Ratio by Cryptorhythms🔗 Blockchain - NVU (Network Value to User) Ratio by Cryptorhythms
Introduction
Please note this is not an indicator that gives you buy and sell signals, its for bitcoin blockchain based fundamental analysis and valuation metrics.
Description
Blockchains have network effects.
The classic example of network effects is Facebook: every person who gets on Facebook makes the network a little more valuable for every other person on Facebook.
As the number of users in a network grows, the more valuable the network becomes. That’s why the most powerful companies in the world today are network companies: Facebook, Apple, Google. The old-school “blue chip” companies don’t have the benefits of network effects. (When a new customer buys your toothpaste, it doesn’t make toothpaste more valuable for everyone else.)
Blockchain assets (like bitcoin) are essentially networks. The more people who use a blockchain asset (like bitcoin), the more valuable that blockchain becomes. One way that analysts value network companies (like Facebook and Twitter) is by looking at Network Value per User. We take their market cap, then divide by their number of Monthly Active Users.
Of the top social media networks, the Value Per User generally ranges from $25 to $250. These values have fluctuated over time, but they give us some guard rails. Of the blockchains we can track, the Network Value per User is typically $1,000 and $5,000 per user. This makes sense, as we would expect blockchain NVU to be higher than social media NVU, since blockchain users are much more valuable—they’re not just mindless ad-consuming machines, like on Facebook.
The caveat is that Value Per User depends on knowing Monthly Active Users, which is not available for all blockchain assets. Blockchains that have this level of transparency will have better valuation metrics, which means they will become more trusted, and thus more highly valued.

NVT Signal with RMA and thresholds [alertable]NVT Signal, or NVTS, is an indicator that compares the market cap of Bitcoin to the aggregate USD value of daily transactions on the Bitcoin blockchain. It is a value indicator that shows a multiple of Bitcoin price against the actual usage of its blockchain. When the NVTS is low, it suggests Bitcoin price is low relative to the amount of utility the network provides, and vice versa.
For more information on NVTS, visit medium.com
This indicator aims to provide the following:
1. An open-source implementation of NVTS on Tradingview, as the most popular one currently is closed-source.
2. To provide two simple ways to define and visualize "overbought" or "oversold" conditions using the NVTS. Here, we have absolute value of NVTS & deviation from a long-term moving average.
3. Crude integration into Tradingview's alert system.
What this indicator CANNOT do:
1. Timeframes below 1d.
2. Signals based on statistical analyses, such as seen in Bollinger Bands et al. (However, with the appropriate type of account, you can add BBands on top of this indicator.)
I would like to express my gratitude to Willy Woo, Chris Burniske and Dimitry Kalichkin for their work on NVT Ratio and NVT Signal, without which my indicator would not have been created.
Feel free to fork & improve, or experiment with settings. I hope this indicator will be useful to someone.
Alpha-Sutte ModelThe Alpha-Sutte model is an ongoing project run by Ansari Saleh Ahmar, a lecturer and researcher at Universitas Negeri Makassar in Indonesia, that attempts to make forecasts for time series like how Arima and Holt-Winters models do. Currently Ahmar and his team have conducted research and published papers comparing the efficacy of the Alpha-Sutte and other models, such as Arima and Holt-Winters, on topics ranging from forecasting Turkey's CPI data, Bitcoin prices, Apple's stock prices, primary energy supply of Indonesia, to infant mortality rates in China.
The Alpha-Sutte model in comparison to the other two models listed above shows promise in providing a more accurate forecast, and the project has been able to receive some of its funding from organizations such as the US Agency for International Development, which is a part of the US Federal Government, so maybe the project has some actual merit.
How it works:
In this model there are four values presented at the top of the window.
1) The first value in blue is the value of the Alpha-Sutte model whose purpose is to forecast the price of the current bar.
2) The second value in yellow is an adaptive version of the Alpha-Sutte model that I made. The purpose of the adaptive Alpha-Sutte model is to expand upon the Alpha-Sutte by allowing new information to be introduced, causing the value to change during the current period, hence the adaptiveness of it.
3) The third value in aqua is the moving average of the low% Sutte line which is a predictive line that is based off of the close and low of the current and previous periods.
4) The fourth value in red is the moving average of the high% Sutte line which is a predictive line that is based off of the close and high of the current and previous periods.
Trend signals:
If low% Sutte (aqua value/line) is greater than high% Sutte (red value/line) then this is a buy signal.
If high% Sutte (red value/line) is greater than low% Sutte (aqua value/line) then this is a sell signal.
Caveat:
Even though this model's purpose is to forecast the future, will it be able to predict periods of large movements? No, of course not, but it will adjust quickly to try to make more accurate forecasts for the next period. This was also a reason why I made an adaptive version of this model to try to reduce some of the discrepancies between the Alpha Sutte and price when there is a large unexpected move.
*WARNING before using this I would highly recommend that you look up "Sutte Indicator" online and read some of the papers about this model before you use this , even though this model has shown merit when compared to Arima and Holt-Winter models this is still an ongoing project.*
Hopefully this project will actually come to something in the near future as the calculation for this time series predictive model is much easier to calculate and program in pine editor than something like an Arima model.
*Also, if you know how to use R language there is a package for the "Alpha-Sutte model".*
