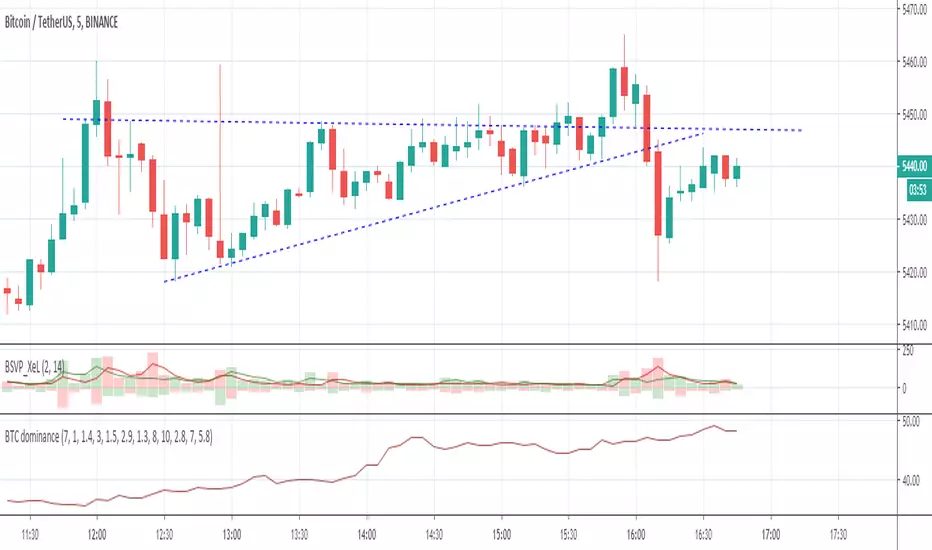
Bitcoin dominance flowHello
this is bitcoin dominance flow indicators. When when you trade altcoins, you sould see bitcoin dominance must go down and your altcoin or others must go up. If price goes up without dominance, this price wont be permenant.
"bitcoin" için komut dosyalarını ara
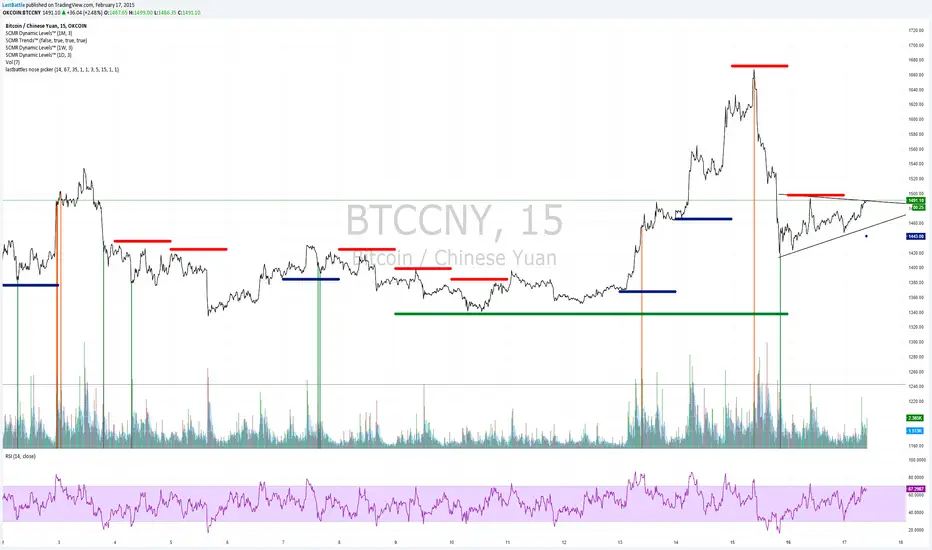
[Bitcoin] Lastbattle's nose pickerI've been working on a top and bottom picker script over the past couple of weeks, based on RSI of multiple timeframe closing price. It've been a pretty good trading system that's tested over the last meteoric rise from 220~270 and back down to 230 right now, and I think it should be released to the community.
Sure, I'm not worried about this strategy not working anymore after it is being used by the majority. Everyone have a different view of the market, and this is more towards psychology. It'll likely to hold for as long as there are still humans trading Bitcoins. Bitcoin market is full of emotions, you'll never run out of it.
So why does it work?
If you take a look at the live charts offered by Bitcoinwisdom and Cryptowatch, they only offer 1, 3, 5, and 15 minute timeframe by default with no other option to switch.
Naturally more traders will look at these levels for oversold and overbought condition.
The same indicator does not work for the broader commodities market such as Gold and Silver.
How does it work?
As long as the RSI levels of 1, 3, 5, and 15 minute fulfills the oversold/overbought level, a signal will be given.
The overbought/oversold level gets compensated the higher volatility the market is in.
Note: **
-This is only for exit strategy. If you're on long, consider reducing or exiting your position when it displays a red. On the other hand if you're short, consider reducing or covering your shorts if it shows a green.
-It may give false signal in a trending market, use your trading experience and judgement to filter them out. (eg: uptrend usually have more than 1 legs AND after a long consolidation, RSI gets to oversold/overbought easily... the market will tend to test the support/resistance again.)
-This is tuned for the 15m interval, the script won't work beyond this. I use it for scalping futures. Feel free to change or remove this line 'plot(interval == 15 and '
-Even if it shows a signal, it may not be the true top/bottom. Sometimes there may be a weak diverged leg aka 'last fart', so that's one reason I dont use this for entry until more confirmation is given via other indicators.
** If your chart is zooming all the way down to 0, right click on the price at the right and select 'Scale price only'
Go ahead and try this out with willy, etc and see what works better :D
Credits:
-LazyBear for the volatility switcher script
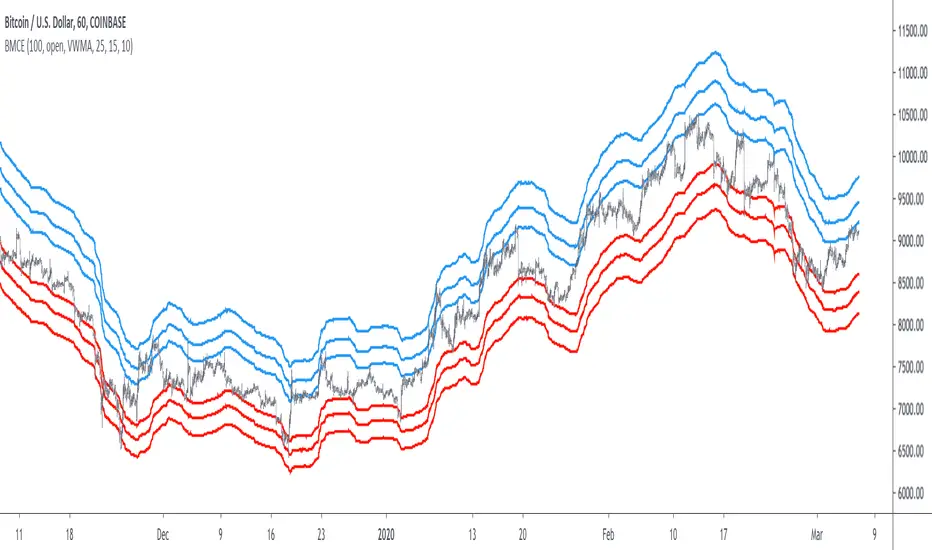
Bitcoin Margin Call Envelopes [saraphig & alexgrover]Bitcoin is the most well known digital currency, and allow two parties to make a transaction without the need of a central entity, this is why cryptocurrencies are said to be decentralized, there is no central unit in the transaction network, this can be achieved thanks to cryptography. Bitcoin is also the most traded cryptocurrency and has the largest market capitalization, this make it one of the most liquid cryptocurrency.
There has been tons of academic research studying the profitability of Bitcoin as well as its role as a safe heaven asset, with all giving mixed conclusions, some says that Bitcoin is to risky to be considered as an hedging instrument while others highlight similarities between Bitcoin and gold thus showing evidence on the usefulness of Bitcoin acting as an hedging instrument. Yet Bitcoin seems to attract more short term speculative investors rather than other ones that would use Bitcoin as an hedging instrument.
Once introduced, cryptocurrencies where of course heavily analyzed by technical analyst, and technical indicators where used by retail as well as institutional investors in order to forecast the future trends of bitcoin. I never really liked the idea of designing indicators that specifically worked for only one type of market and ever less on only one symbol. Yet the user @saraphig posted in Feb 20 an indicator called " Margin Call MovingAverage " who calculate liquidation price by using a volume weighted moving average. It took my attention and we decided to work together on a relatively more complete version that would include resistances levels.
I believe the proposed indicator might result useful to some users, the code also show a way to restrict the use of an indicator to only one symbol (line 9 to 16).
The Indicator
The indicator only work on BTCUSD, if you use another symbol you should see the following message:
The indicator plot 6 extremities, with 3 upper (resistance) extremities and 3 lower (support) extremities, each one based on the isolated margin mode liquidation price formula:
UPlp = MA/Leverage × (Leverage+1-(Leverage*0.005))
for upper extremities and:
DNlp = MA × Leverage/(Leverage+1-(Leverage*0.005))
for lower extremities.
Length control the period of the moving averages, with higher values of length increasing the probability of the price crossing an extremity. The Leverage's settings control how far away their associated extremities are from the price, with lower values of Leverage making the extremity farther away from the price, Leverage 3 control Up3 and Dn3, Leverage 2 control Up2 and Dn2, Leverage 1 control Up1 and Dn1, @saraphig recommend values for Leverage of either : 25, 20, 15, 10 ,5.
You can select 3 different types of moving average, the default moving average is the volume weighted moving average (VWMA), you can also choose a simple moving average (SMA) and the Kaufman adaptive moving average (KAMA).
Based on my understanding (which could be wrong) the original indicator aim to highlight points where margin calls might have occurred, hence the name of the indicator.
If you want a more "DSP" like description then i would say that each extremity represent a low-pass filter with a passband greater than 1 for upper extremities and lower than 1 for lower extremities, unlike bands indicators made by adding/subtracting a volatility indicator from another moving average this allow to conserve the original shape of the moving average, the downside of it being the inability to show properly on different scales.
here length = 200, on a 1h tf, each extremities are able to detect short-terms tops and bottoms. The extremity become wider when using lower time-frames.
You would then need to increase the Leverages settings, i recommend a time frame of 1h.
Conclusion
I'am not comfortable enough to make a conclusion, as i don't know the indicator that well, however i liked the original indicator posted by @saraphig and was curious about the idea behind it, studying the effect of margin calls on market liquidity as well as making indicators based on it might result a source of inspiration for other traders.
A big thanks to @saraphig who shared a lot of information about the original indicator and allowed me to post this one. I don't exclude working with him/her in the future, i invite you to follow him/her:
www.tradingview.com
Thx for reading and have a nice weekend! :3
Bitcoin Multibook v1.0 [Apollo Algo]Bitcoin Multibook v1.0 by Apollo Algo is an advanced market depth and order flow visualization tool that brings professional-grade multi-exchange order book analysis to TradingView. Inspired by Bookmap's multibook functionality and built upon LucF's original single "Tape" indicator concept, this tool aggregates real-time trading data from multiple Bitcoin exchanges into a unified tape display.
Credits & Attribution
This indicator is an evolution of the original "Tape" indicator created by LucF (TradingView: @LucF). The multibook enhancement and Bitcoin-specific optimizations were developed by Apollo Algo to provide traders with institutional-grade market microstructure visibility across major Bitcoin trading venues.
Purpose & Philosophy
Bitcoin leads the entire cryptocurrency market. By monitoring order flow across the primary Bitcoin exchanges simultaneously, traders gain crucial insights into:
Cross-exchange arbitrage opportunities
Institutional order flow patterns
Market maker positioning
True market sentiment beyond single-exchange data
Key Features
📊 Multi-Exchange Data Aggregation
Real-time tape from 3 major exchanges:
Binance (BTCUSDT)
Coinbase (BTCUSD)
Kraken (BTCUSD)
Customizable source inputs for any trading pair
Synchronized price and volume tracking
Exchange name identification in tape display
📈 Advanced Tape Display
Dynamic tape visualization with configurable line quantity (0-50 lines)
Directional flow indicators (+/- symbols for price changes)
Exchange identification for each trade
Volume precision control (0-16 decimal places)
Flexible positioning (9 screen positions available)
Real-time only operation for accurate order flow
🎯 Volume Delta Analysis
Real-time cumulative volume delta calculation
Divergence detection (price vs. volume direction)
Colored visual feedback for market sentiment
Total session delta displayed in footer
Cross-exchange delta aggregation
🚨 Smart Alert System
Marker 1: Volume Delta Bumps (⬆⬇)
Triggers on consecutive volume delta increases
Identifies momentum acceleration points
Filters out divergent movements
Marker 2: Volume Delta Thresholds (⇑⇓)
Fires when delta exceeds user-defined thresholds
Catches significant order imbalances
Excludes divergence conditions
Marker 3: Large Volume Detection (⤊⤋)
Highlights unusually large individual trades
Spots potential institutional activity
Direction-specific triggers
Configure Data Sources
Adjust exchange pairs if needed (e.g., for altcoin analysis)
Leave blank to disable specific exchanges
Use format: EXCHANGE:SYMBOL
Customize Display
Set tape line quantity based on screen size
Position the table for optimal visibility
Choose color scheme (text or background)
Adjust text size for readability
Configure Alerts
Enable desired markers (1, 2, or 3)
Set volume thresholds appropriate for your timeframe
Choose direction (Longs, Shorts, or Both)
Create TradingView alerts on marker signals
Trading Applications
Scalping (1-5 min)
Monitor tape speed for momentum shifts
Watch for cross-exchange divergences
Track large volume clusters
Use Marker 1 for quick momentum trades
Day Trading (5-60 min)
Identify accumulation/distribution phases
Spot institutional positioning
Confirm breakout validity with volume delta
Use Marker 2 for significant imbalances
Swing Trading (1H+)
Analyze volume delta trends
Detect smart money rotation
Time entries with order flow confirmation
Use Marker 3 for institutional footprints
Advanced Techniques
Cross-Exchange Arbitrage Detection
When price disparities appear between exchanges:
Immediate Opportunity: Price differences > 0.1%
Bot Activity: Rapid convergence patterns
Liquidity Vacuum: One exchange leading others
Divergence Trading Strategies
Volume delta diverging from price direction:
Absorption: Strong hands entering (price down, delta up)
Distribution: Smart money exiting (price up, delta down)
Reversal Setup: Sustained divergence over multiple bars
Institutional Footprint Recognition
Large volume characteristics:
Simultaneous Spikes: Same timestamp across exchanges
TWAP Patterns: Consistent volume over time
Iceberg Orders: Repeated same-size trades
Pine Script v6 Enhancements
Type Safety Improvements
Strict boolean type handling
Explicit type declarations
Enhanced error checking
Performance Optimizations
Improved request.security() function
Better memory management with arrays
Optimized table rendering
Modern Syntax Updates
indicator() instead of study()
Namespaced math functions (math.round())
Typed input functions (input.int(), input.float())
Performance Considerations
System Requirements
Real-time Data: Essential for tape operation
Multiple Security Calls: May impact performance
Array Operations: Memory intensive with high line counts
Table Rendering: CPU usage increases with tape size
Optimization Tips
Reduce tape lines for better performance
Increase volume filter to reduce noise
Disable unused markers
Use text-only coloring for faster rendering

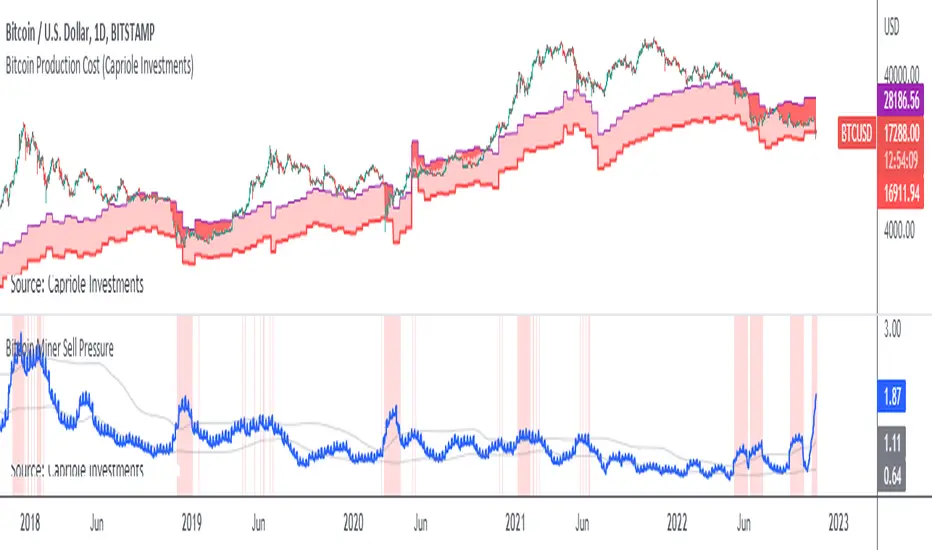
Bitcoin Miner Sell PressureBitcoin miners are in pain and now (November 2022) selling more than they have in almost 5 years!
Introducing: Bitcoin Miner Sell Pressure.
A free, open-source indicator which tracks on-chain data to highlight when Bitcoin miners are selling more of their reserves than usual.
The indicator tracks the ratio of on-chain miner Bitcoin outflows to miner Bitcoin reserves.
- Higher = more selling than usual
- Lower = less selling than usual
- Red = extraordinary sell pressure
Today , it's red.
What can we see now ?
Miners are not great at treasury management. They tend to sell most when they are losing money (like today). But there have been times when they sold well into high profit, such as into the 2017 $20K top and in early 2021 when Bitcoin breached $40K.
Bitcoin Miner Sell Pressure identifies industry stress, excess and miner capitulation.
Unsurprisingly, there is a high correlation with Bitcoin Production Cost; giving strong confluence to both.
In some instances, BMSP spots capitulation before Hash Ribbons. Such as today!
Bitcoin Block Height (Total Blocks)Bitcoin Block Height by RagingRocketBull 2020
Version 1.0
Differences between versions are listed below:
ver 1.0: compare QUANDL Difficulty vs Blockchain Difficulty sources, get total error estimate
ver 2.0: compare QUANDL Hash Rate vs Blockchain Hash Rate sources, get total error estimate
ver 3.0: Total Blocks estimate using different methods
--------------------------------
This indicator estimates Bitcoin Block Height (Total Blocks) using Difficulty and Hash Rate in the most accurate way possible, since
QUANDL doesn't provide a direct source for Bitcoin Block Height (neither QUANDL:BCHAIN, nor QUANDL:BITCOINWATCH/MINING).
Bitcoin Block Height can be used in other calculations, for instance, to estimate the next date of Bitcoin Halving.
Using this indicator I demonstrate:
- that QUANDL data is not accurate and differ from Blockchain source data (industry standard), but still can be used in calculations
- how to plot a series of data points from an external csv source and compare it with another source
- how to accurately estimate Bitcoin Block Height
Features:
- compare QUANDL Difficulty source (EOD, D1) with external Blockchain Difficulty csv source (EOD, D1, embedded)
- show/hide Quandl/Blockchain Difficulty curves
- show/hide Blockchain Difficulty candles
- show/hide differences (aqua vertical lines)
- show/hide time gaps (green vertical lines)
- count source differences within data range only or for the whole history
- multiply both sources by alpha to match before comparing
- floor/round both matched sources when comparing
- Blockchain Difficulty offset to align sequences, bars > 0
- count time gaps and missing bars (as result of time gaps)
WARNING:
- This indicator hits the max 1000 vars limit, adding more plots/vars/data points is not possible
- Both QUANDL/Blockchain provide daily EOD data and must be plotted on a daily D1 chart otherwise results will be incorrect
- current chart must not have any time gaps inside the range (time gaps outside the range don't affect the calculation). Time gaps check is provided.
Otherwise hardcoded Blockchain series will be shifted forward on gaps and the whole sequence become truncated at the end => data comparison/total blocks estimate will be incorrect
Examples of valid charts that can run this indicator: COINBASE:BTCUSD,D1 (has 8 time gaps, 34 missing bars outside the range), QUANDL:BCHAIN/DIFF,D1 (has no gaps)
Usage:
- Description of output plot values from left to right:
- c_shifted - 4x blockchain plotcandles ohlc, green/black (default na)
- diff - QUANDL Difficulty
- c_shifted - Blockchain Difficulty with offset
- QUANDL Difficulty multiplied by alpha and rounded
- Blockchain Difficulty multiplied by alpha and rounded
- is_different, bool - cur bar's source values are different (1) or not (0)
- count, number of differences
- bars, total number of bars/data points in the range
- QUANDL daily blocks
- Blockchain daily blocks
- QUANDL total blocks
- Blockchain total blocks
- total_error - difference between total_blocks estimated using both sources as of cur bar, blocks
- number_of_gaps - number of time gaps on a chart
- missing_bars - number of missing bars as result of time gaps on a chart
- Color coding:
- Blue - QUANDL data
- Red - Blockchain data
- Black - Is Different
- Aqua - number of differences
- Green - number of time gaps
- by default the indicator will show lots of vertical aqua lines, 138 differences, 928 bars, total error -370 blocks
- to compare the best match of the 2 sources shift Blockchain source 1 bar into the future by setting Blockchain Difficulty offset = 1, leave alpha = 0.01 =>
this results in no vertical aqua lines, 0 differences, total_error = 0 blocks
if you move the mouse inside the range some bars will show total_error = 1 blocks => total_error <= 1 blocks
- now uncheck Round Difficulty Values flag => some filled aqua areas, 218 differences.
- now set alpha = 1 (use raw source values) instead of 0.01 => lots of filled aqua areas, 871 differences.
although there are many differences this still doesn't affect the total_blocks estimate provided Difficulty offset = 1
Methodology:
To estimate Bitcoin Block Height we need 3 steps, each step has its own version:
- Step 1: Compare QUANDL Difficulty vs Blockchain Difficulty sources and estimate error based on differences
- Step 2: Compare QUANDL Hash Rate vs Blockchain Hash Rate sources and estimate error based on differences
- Step 3: Estimate Bitcoin Block Height (Total Blocks) using different methods in the most accurate way possible
QUANDL doesn't provide block time data, but we can calculate it using the Hash Rate approximation formula:
estimated Hash rate/sec H = 2^32 * D / T, where D - Difficulty, T - block time, sec
1. block time (T) can be derived from the formula, since we already know Difficulty (D) and Hash Rate (H) from QUANDL
2. using block time (T) we can estimate daily blocks as daily time / block time
3. block height (total blocks) = cumulative sum of daily blocks of all bars on the chart (that's why having no gaps is important)
Notes:
- This code uses Pinescript v3 compatibility framework
- hash rate is in THash/s, although QUANDL falsely states in description GHash/s! THash = 1000 GHash
- you can't read files, can only embed/hardcode raw data in script
- both QUANDL and Blockchain sources have no gaps
- QUANDL and Blockchain series are different in the following ways:
- all QUANDL data is already shifted 1 bar into the future, i.e. prev day's value is shown as cur day's value => Blockchain data must be shifted 1 bar forward to match
- all QUANDL diff data > 1 bn (10^12) are truncated and have last 1-2 digits as zeros, unlike Blockchain data => must multiply both values by 0.01 and floor/round the results
- QUANDL sometimes rounds, other times truncates those 1-2 last zero digits to get the 3rd last digit => must use both floor/round
- you can only shift sequences forward into the future (right), not back into the past (left) using positive offset => only Blockchain source can be shifted
- since total_blocks is already a cumulative sum of all prev values on each bar, total_error must be simple delta, can't be also int(cum()) or incremental
- all Blockchain values and total_error are na outside the range - move you mouse cursor on the last bar/inside the range to see them
TLDR, ver 1.0 Conclusion:
QUANDL/Blockchain Difficulty source differences don't affect total blocks estimate, total error <= 1 block with avg 150 blocks/day is negligible
Both QUANDL/Blockchain Difficulty sources are equally valid and can be used in calculations. QUANDL is a relatively good stand in for Blockchain industry standard data.
Links:
QUANDL difficulty source: www.quandl.com
QUANDL hash rate source: www.quandl.com
Blockchain difficulty source (export data as csv): www.blockchain.com

Bitcoin Energy Value OscillatorBitcoin Energy Value as an oscillator against price.
Calculated as: (Bitcoin Price / Bitcoin Energy Value - 1) * 100

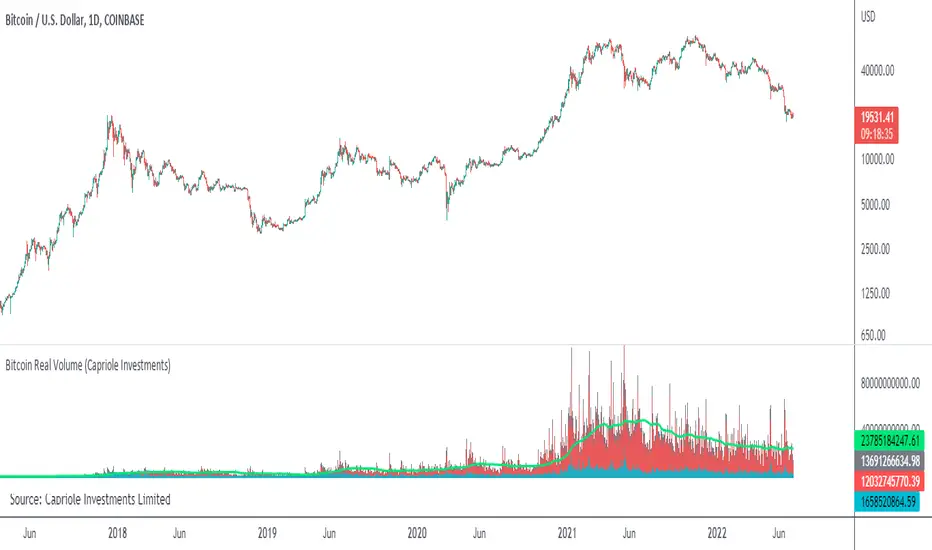
Bitcoin Real VolumeBitcoin’s Real Volume
An accurate read on the change in Bitcoin’s volume profile over time.
Based on 2019 reports by Bitwise and Alameda Research.
Please see the script code notes for assumptions and details on data selection.
Follow me for more information on this script.
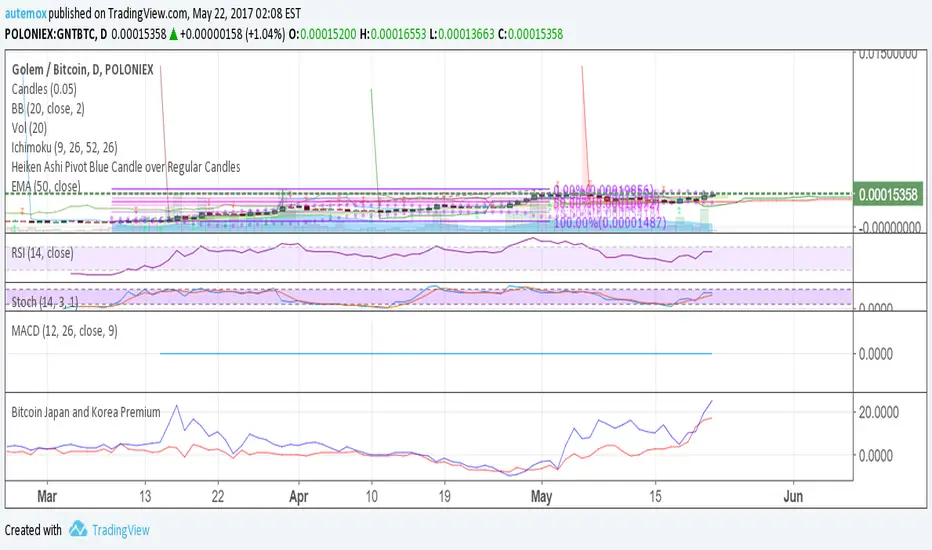
Bitcoin Japan and Korea PremiumRed line is the % premium to buy bitcoin in Japan. Blue is the % premium to buy bitcoin in korea.
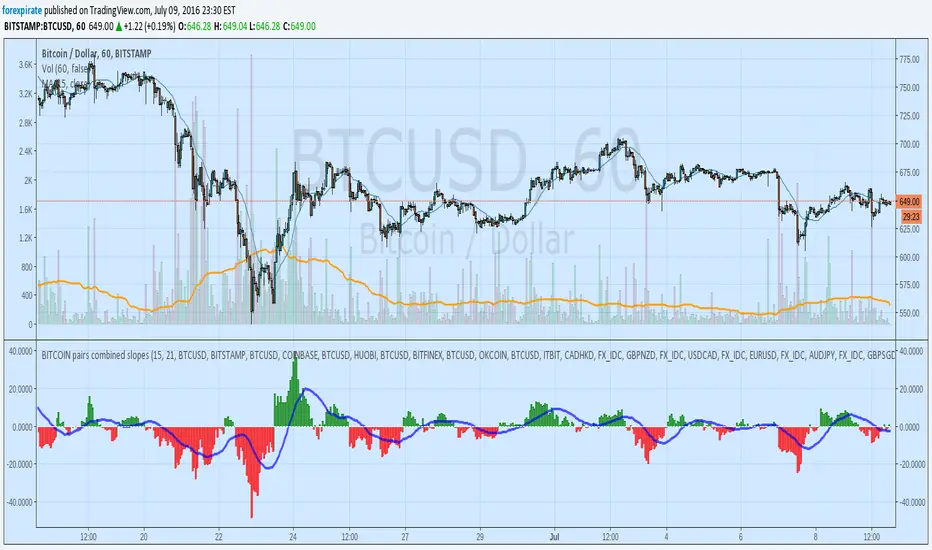
BITCOIN pairs combined slopesFirst Version of a BITCOIN multi exchange slope of moving average indicator. It takes the slope of a moving average from multiple exchanges to give a broader picture of what Bitcoin USD is doing. There is a bitcoin China and USDCHY pair in the code but it is not in the actual calculation. It is there for version two later on. Stay posted

Bitcoin Production CostBitcoin's Production Cost
Based on raw data from CBECI.
Follow me to read more about the calculation logic.


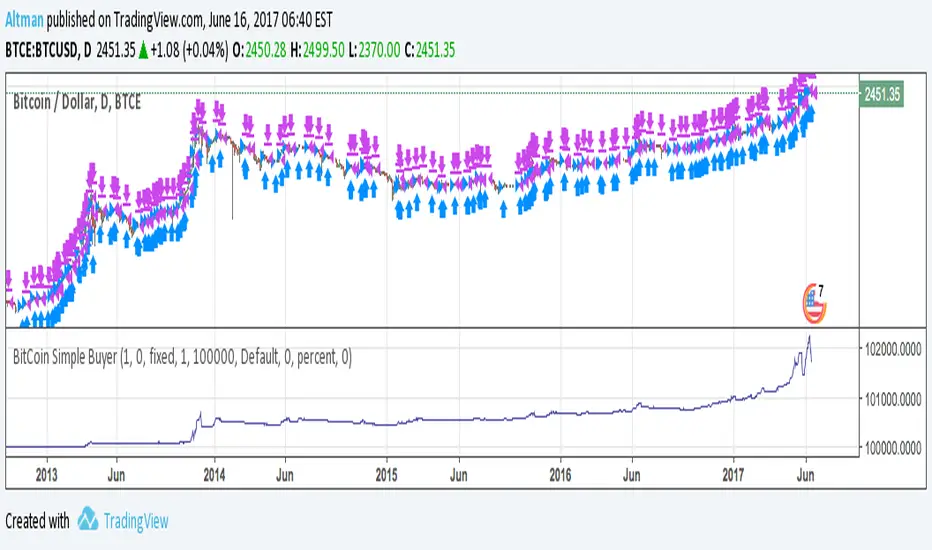
BitCoin Simple BuyerMany people asking me: How to find the right time to exit BitCoin long position? First, that comes to mind is Do Not use simple Buy-and-Hold strategy, but make short-term trades. Here is the simple algorithm for D1 or 4H timeframes.
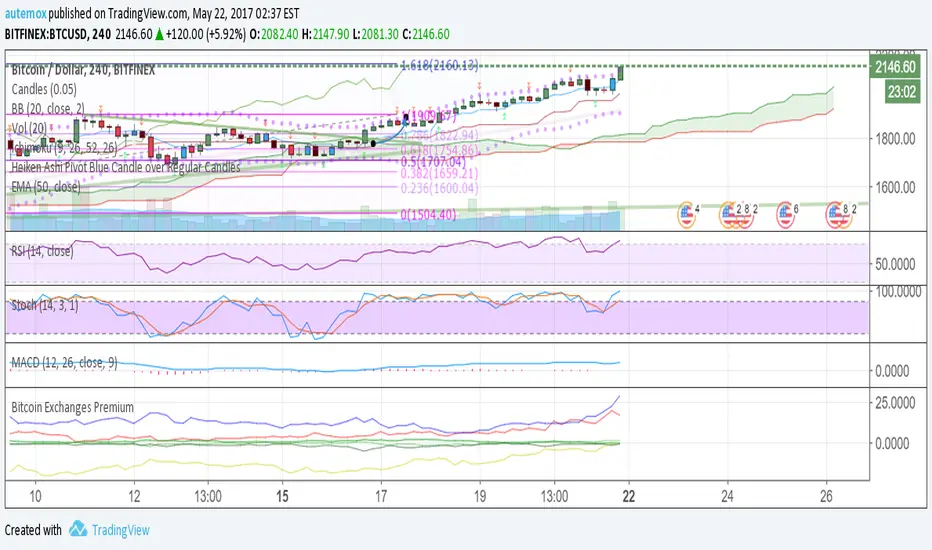
Bitcoin Exchanges PremiumThis is a % premium vs average BTCUSD price. In other words, how much % more are exchanges selling bitcoin at compared to normal BTCUSD price?
Blue: Korea
Red: Japan
Yellow: China
Green: USD Exchanges including Bitfinex, Poloniex, Coinbase, and Bitstamp
Bitcoin Kill ZonesGRAB THE LASTEST VERSION HERE:
*********************
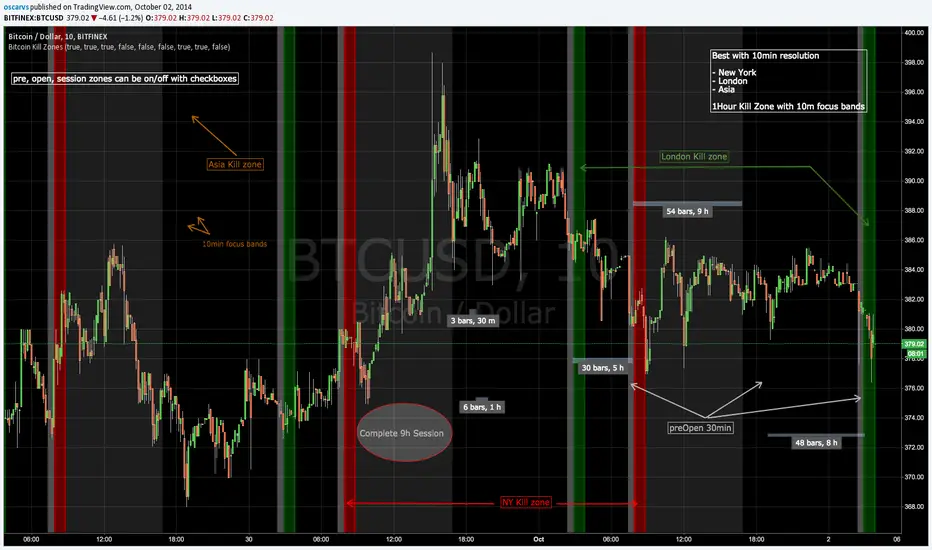
This indicator shows when the candle is entering New York, London or Asia Kill Zone (open market).
gray: 30min before market opens.
red, green, orange: First 1 hour with 10min focus bands.
silver: complete 30min session market until close.
FIX NOTE:
Set this hours for Asia to fix the 1 hour difference:
2330-0000
0000-0010
0010-0050
0050-0100
0100-0900
* this is beta, in planning to mark dynamically ranges before/after open/close session and use some Fibs to have some ripple effect indicator
Updated code: github.com
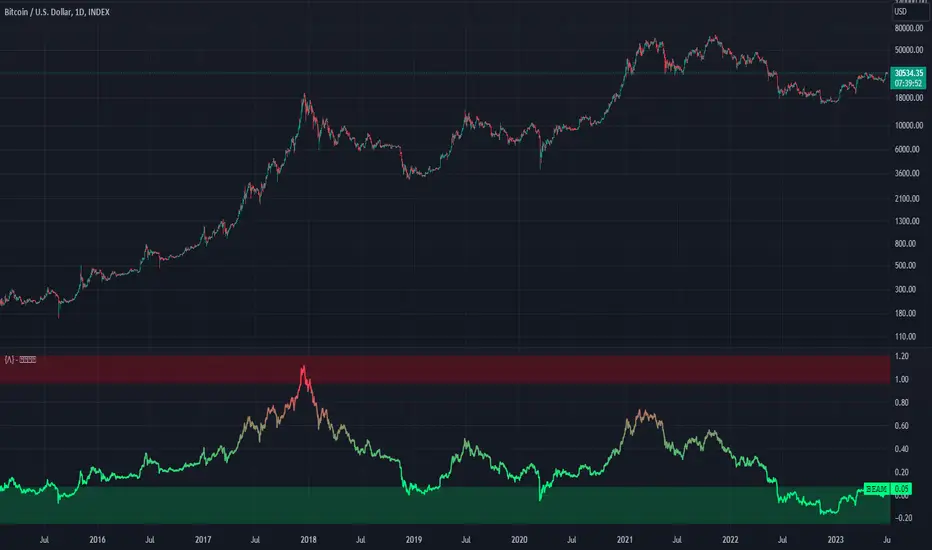
Bitcoin Economics Adaptive MultipleBEAM (Bitcoin Economics Adaptive Multiple) is an indicator that assesses the valuation of Bitcoin by dividing the current price of Bitcoin by a moving average of past prices. Its purpose is to provide insights into whether Bitcoin is under or overvalued at any given time. The thresholds for the buy and sell zones in BEAM are adjustable, allowing users to customize the indicator based on their preferences and trading strategies.
BEAM categorizes Bitcoin's valuation into two distinct zones: the green buy zone and the red sell zone.
Green Buy Zone:
The green buy zone in BEAM indicates that Bitcoin is potentially undervalued. Traders and investors may interpret this zone as a favorable buying opportunity. The threshold for the buy zone can be adjusted to suit individual preferences or trading strategies.
Red Sell Zone:
The red sell zone in BEAM suggests that Bitcoin is potentially overvalued. Traders and investors may consider selling their Bitcoin holdings during this zone to secure profits or manage risk. The threshold for the sell zone is adjustable, allowing users to adapt the indicator based on their trading preferences.
Methodology:
BEAM calculates the indicator value using the following formula:
beam = math.log(close / ta.sma(close, math.min(count, 1400))) / 2.5
The calculation involves taking the natural logarithm of the ratio between the current price of Bitcoin and a simple moving average of past prices. The moving average period used is a minimum of the specified count or 1400, providing a suitable historical reference for valuation assessment.
The resulting value of BEAM provides a standardized measure that can be compared across different time periods. By adjusting the thresholds for the buy and sell zones, users can customize BEAM to their preferred levels of undervaluation and overvaluation.
Utility:
BEAM serves as a tool for investors in the Bitcoin market, offering insights into Bitcoin's valuation and potential buying or selling opportunities. By monitoring BEAM, market participants can gauge whether Bitcoin is potentially undervalued or overvalued, helping them make informed decisions regarding their Bitcoin positions.
It is important to note that BEAM should be used in conjunction with other technical and fundamental analysis tools to validate signals and avoid relying solely on this indicator for trading decisions. Additionally, traders and investors are encouraged to adjust the threshold values based on their specific trading strategies, risk tolerance, and market conditions.
Credit: The BEAM (Bitcoin Economics Adaptive Multiple) indicator was originally developed by BitcoinEcon
Bitcoin Halving Strategy
A systematic, data-driven trading strategy based on Bitcoin's 4-year halving cycles. This strategy capitalizes on historical price patterns that emerge around halving events, providing clear entry and exit signals for both accumulation and profit-taking phases.
🎯 Strategy Overview
This automated trading system identifies optimal buy and sell zones based on the predictable Bitcoin halving cycle that occurs approximately every 4 years. By analyzing historical data from all previous halvings (2012, 2016, 2020, 2024), the strategy pinpoints high-probability trading opportunities.
📊 Key Features
Automated Signal Generation: Buy signals at halving events and DCA zones, sell signals at profit-taking peaks
Multi-Phase Analysis: Tracks Accumulation, Profit Taking, Bear Market, and DCA phases
Visual Dashboard: Real-time performance metrics, phase countdown, and position tracking
Backtesting Enabled: Comprehensive historical performance analysis with configurable parameters
Risk Management: Built-in position sizing, slippage control, and optional short trading
⚙️ Strategy Logic
Buy Signals:
At halving event (Week 0)
DCA zone entry (Week 135 post-halving)
Sell Signals:
Profit-taking zone (Week 80 post-halving)
Optional short position entry for advanced traders
📈 Performance Highlights
Captures major bull run profits while avoiding prolonged bear markets
Clear visual indicators for all phases and transitions
Customizable timing parameters for personalized risk tolerance
Professional dashboard with live P&L, win rate, and drawdown metrics
🛠️ Customization Options
Adjustable phase timing (profit start/end, DCA timing)
Position sizing control
Enable/disable short trading
Visual customization (colors, labels, zones)
Table positioning and transparency
⚠️ Risk Disclosure
Past performance does not guarantee future results. This strategy is based on historical halving cycle patterns and should be used as part of a comprehensive trading plan. Always conduct your own research and consider your risk tolerance before trading.
💡 Ideal For
Long-term Bitcoin investors seeking systematic entry/exit points
Swing traders capitalizing on multi-month trends
Portfolio managers implementing cycle-based allocation strategies

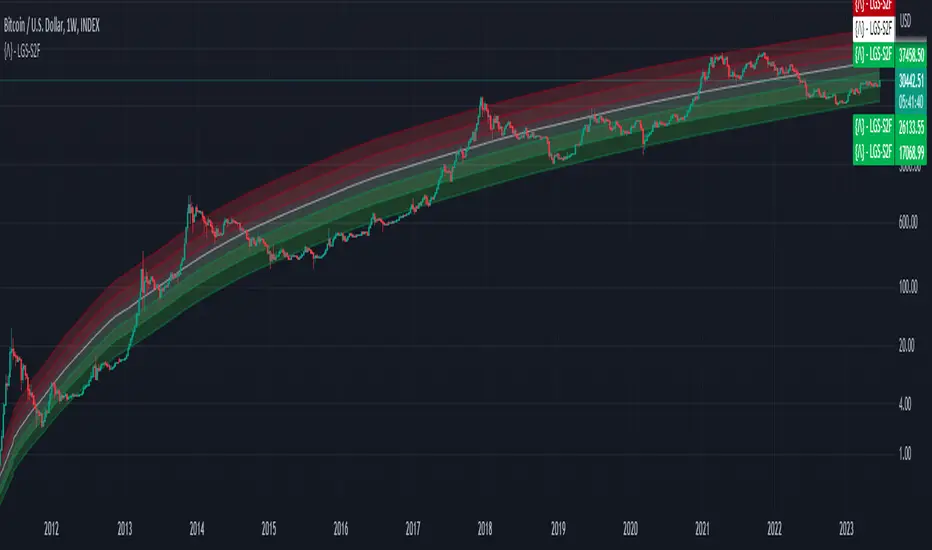
Bitcoin Limited Growth ModelThe Bitcoin Limeted Growth is a model proposed by QuantMario that offers an alternative approach to estimating Bitcoin's price based on the Stock-to-Flow (S2F) ratio. This model takes into account the limitations of the traditional S2F model and introduces refinements to enhance its analysis.
The S2F model is commonly used to analyze Bitcoin's price by considering the scarcity of the asset, measured by the stock (existing supply) relative to the flow (new supply). However, the LGS-S2F Bitcoin Price Formula recognizes the need for improvements and presents an updated perspective on Bitcoin's price dynamics.
Invalidation of the Normal S2F Model:
The normal S2F model has faced criticisms and challenges. One of the limitations is its assumption of a linear relationship between the S2F ratio and Bitcoin's price, overlooking potential nonlinearities and other market dynamics. Additionally, the normal S2F model does not account for external influences, such as market sentiment, regulatory developments, and technological advancements, which can significantly impact Bitcoin's price.
Addressing the Issues:
The LGS-S2F Bitcoin Price Formula introduces refinements to address the limitations of the traditional S2F model. These refinements aim to provide a more comprehensive analysis of Bitcoin's price dynamics:
Nonlinearity: The LGS-S2F model recognizes that the relationship between the S2F ratio and Bitcoin's price may not be linear. It incorporates a logistic growth function that considers the diminishing returns of scarcity and the saturation of market demand.
Data Analysis: The LGS-S2F model employs statistical analysis and data-driven techniques to validate its predictions. It leverages historical data and econometric modeling to support its analysis of Bitcoin's price.
Utility:
The LGS-S2F Bitcoin Price Formula offers insights for traders and investors in the cryptocurrency market. By incorporating a more refined approach to analyzing Bitcoin's price, this model provides an alternative perspective. It allows market participants to consider various factors beyond the S2F ratio alone, potentially aiding in their decision-making processes.
Key Features:
Adjustable Coefficients
Sigma calculation methods: Normal or Stdev
Credit:
The LGS-S2F Bitcoin Price Formula was developed by QuantMario, who has contributed to the field of cryptocurrency analysis through their research and modeling efforts.
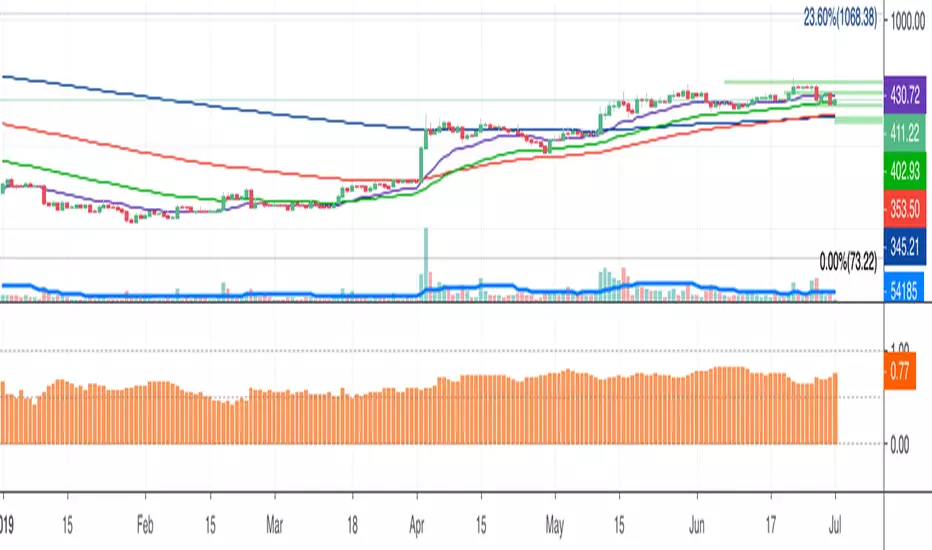
Bitcoin as % Global M2 signalThis script provides signal system:
Buy signal: each time the YoY of the Global M2 rises more than 2.5% while the distance between the bitcoin price as a percentage of the Global M2 is below its yearly SMA.
Sell signal: the distance between the bitcoin price as a percentage of the Global M2 and its yearly SMA is > 0.7
This is a very simple system, but it seems to work pretty well to ride the bitcoin price cycle wave.
The parameters are hard coded but they can be easily changed to test different levels for both the buy and sell signals.

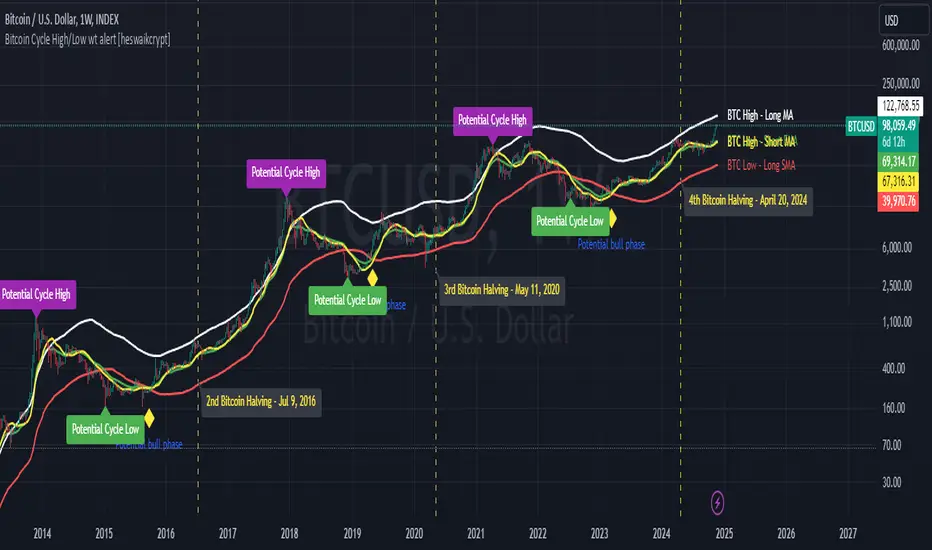
Bitcoin Cycle High/Low with functional Alert [heswaikcrypt]Introduction
Just as machines are fine-tuned for maximum efficiency, trading indicators must evolve to meet the demands of ever-changing markets.
Credit goes to the initial author, @NoCreditsLeft I only improved the existing Pi-cycle indicator with a functional alert and included a bull mode indicator in the script. The alert can help you get a live alert at candle close when the cycle tops, bottoms, and the potential bull phase switch occurs.
Philip Swift’s Pi Cycle Top Indicator is a brilliant example of leveraging mathematical relationships to signal critical turning points in Bitcoin’s price cycles. Historically, it has identified market and local tops with some relative accuracy, often within three days, as demonstrated in all the previous bull run cycles.
At its core, the Pi Cycle Indicator derives its name from the mathematical constant π (pi), achieved by using simple moving averages (MAs) in a specific ratio: 𝜋 = Long MA/short MA
The Bull mode switch is calculated using a crossover of the short exponentia moving average and the long moving average.
.
.
.
Knowing when Bitcoin reaches its top—and receiving timely alerts about it—is crucial for successful trading. The indicator is designed to signal;
Potential Bitcoin tops: Purple label
Potential Bitcoin bottoms : green Label, and
Parabolic swing : Yellow diamond shape (relating to the market switching to a potential bull mode)
"Please note: This indicator is tailored for Bitcoin using historical data analysis and should not be considered definitive. However accurate it might be."
Setting alerts
To set the alert conditions, select any alert function call to get alert whenever the conditions are met. The script is configured on dialy TF; you can set it on 1D or weekly TF.
Enjoy and Trade smartly