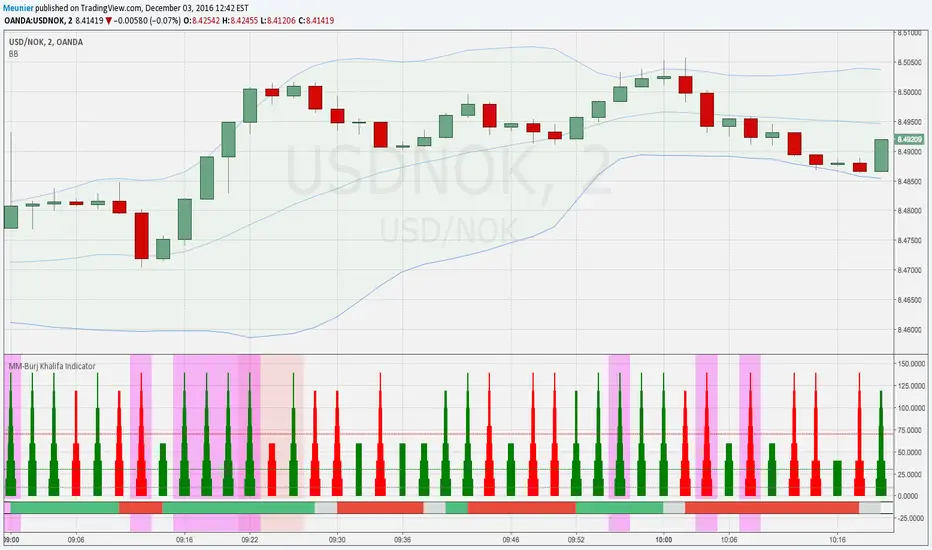
MM-Burj Khalifa Indicator
This indicator uses several signals to visualize a "perfect candle" to enter a trade.
It colors the background to identify the zones of interest (multiple configurable high or low RSI zones). Underlying is a trendbar with the current MACD direction. It's possible to tweak the indicator with a lot of options in the settings section (e.g. for which period you want a rising DM+-signal, etc.)
The indicator is using signals of:
--MACD
--RSI
--PVT
--ATR
--AD and DMI+/DMI-
When all 7 criterias are met it highlights the candle.
It also creates different colums with different height and width, so that you can see which signal is OK and which is maybe missing. When all signals are on GO you'll see a Burj-Khalifa-like figure. If not all signals are on GO you'see crippled versions.
To be clear:
it's not intended to detect trends or supertrends or reversals. It's purpose it's just to decide if this current candle is really going in the right direction. It doesn't prevent upcoming reversals in the opposite direction.
The Burj-Khalifa indicator could help to confirm the entry point of an trade which was already planned.
I'll come up with a more detailed documentation.
"binary" için komut dosyalarını ara
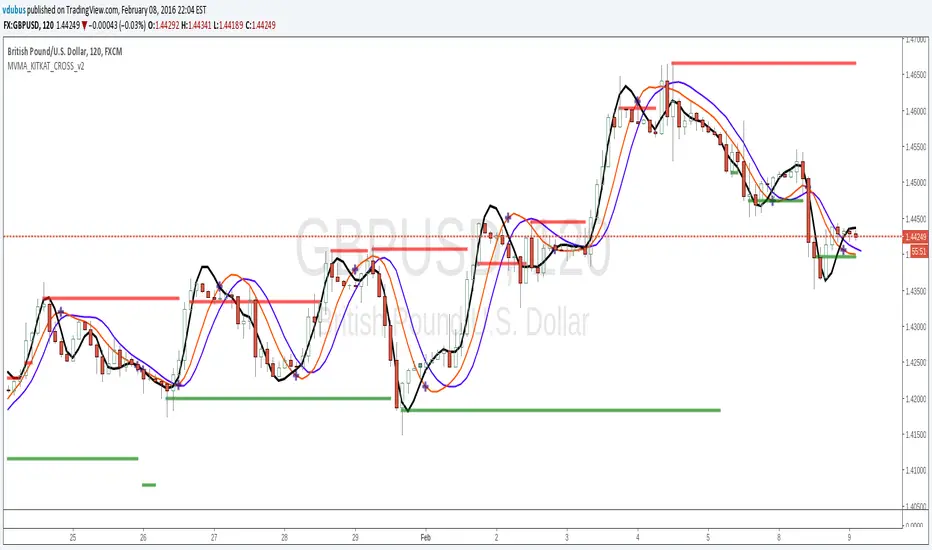
Momentum VMA KITKAT CROSS v2*Update Momentum VMA KITKAT CROSS v2
triple MVMA (Hull MA) with integrated Kitkat
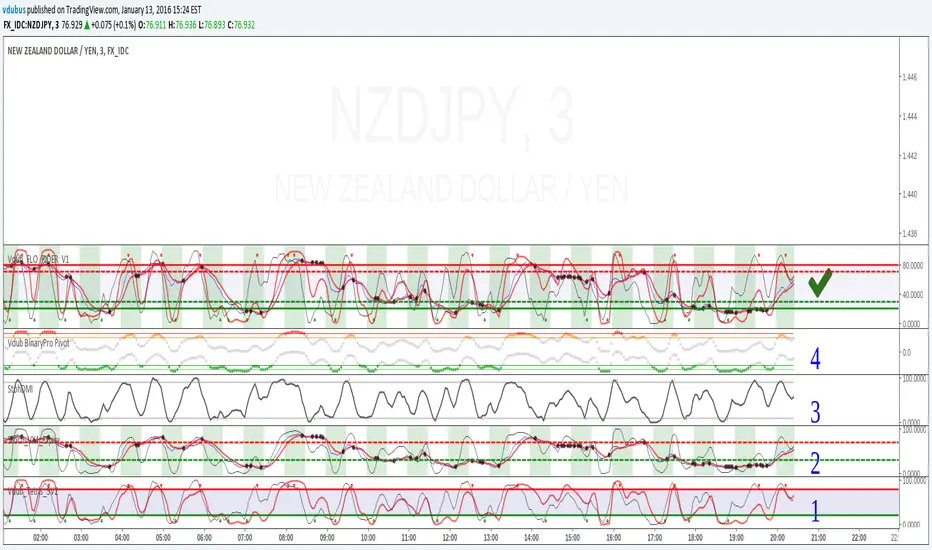
Stoch_VX4 Expiry / UpdateStoch_VX3 Update
Stoch crossover +
Fast stoch / Tops & bottoms
BO background expiry

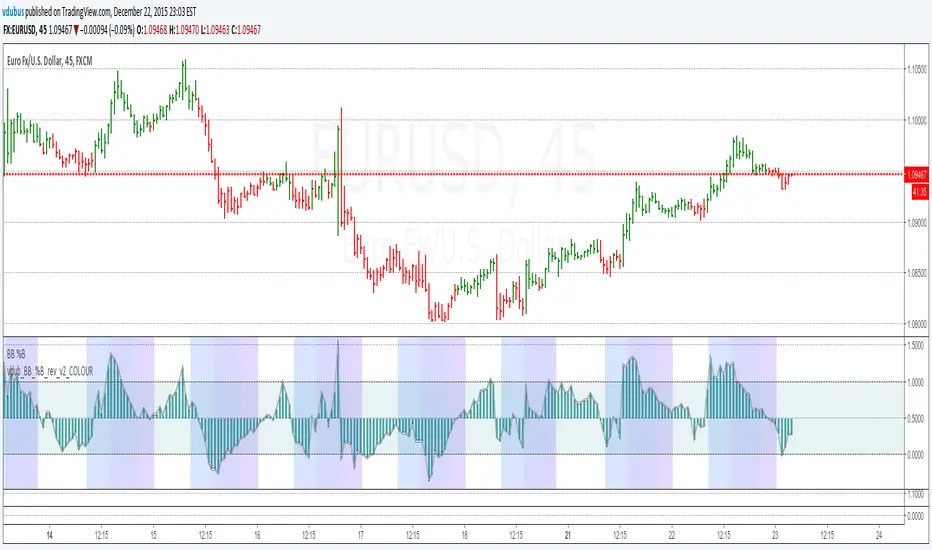
Vdub_BinaryBands_v1Combined 3 x Bollinger Bands With BUY & SELL zones
EMA,
Wma
SMA
Multiplier adjustment


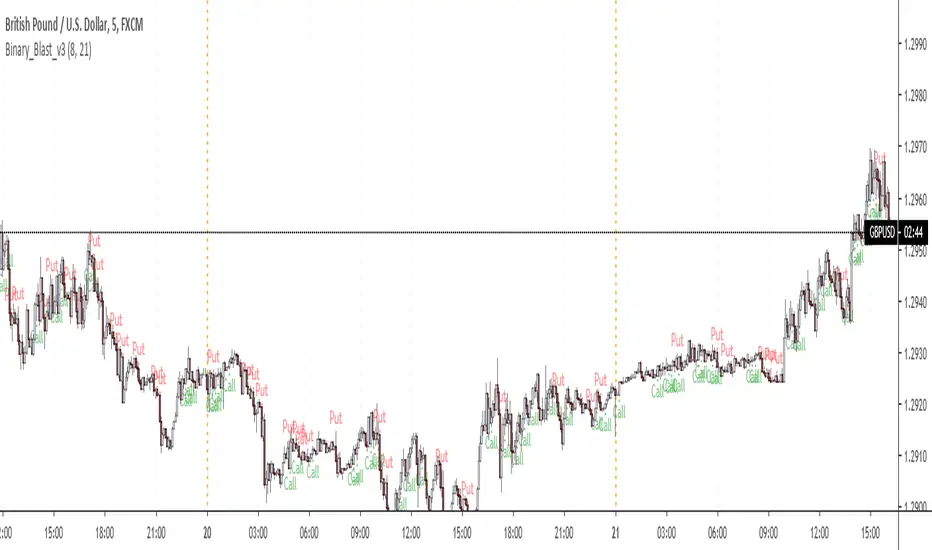
Binary_Blast_v3_directional biasThis is not my script.
The original was done by pizer.. I have just added an option to include a fast moving average and a slow moving average to filter the direction....implying should I look for "Put" or "Call"
Kay_StochasticRSIThis is a different version of Stochastic RSI. the only difference is the use of variable moving average by Lazybear instead of regular sma for K smoothing.
Its purely an experiment. I am not a professional trader but an enthusiastic programmer trying different indicator combination to see different results.
Criticizing and negative comments will be gracefully accepted. :)
Appreciation will be even more. :)
Binary Options v4.0This script fixes the situation of consecutive losses from single-direction trades through window logic

Binary ComboThis script combines Stochastic Divergence and WaveTrend Crosses.
Stochastic Divergence may be useful for seeing a shift in momentum before the price action reflects it.
WaveTrend gives us context to the short term trend.
You can combine these together to find good entries.


Binary Blast v2 Pipizer1 bar strategy after the signal bar closes. Maximum consecutive loses 5 found in back test!


Black-Scholes Model and Greeks for European OptionsThe Black-Scholes model is a mathematical model used for pricing options. From this model you can derive the theoretical fair value of a European option (an option where you have to wait until expiry to exercise). Additionally, you can derive various risk parameters called Greeks. This indicator includes three types of data: Theoretical Option Price (blue), the Greeks (green), and implied volatility (red); their values are presented in that order.
1) Theoretical Option Price:
This first value gives only the theoretical fair value of an option with a given strike based on the Black-Scholes framework. Remember this is a model and does not reflect actual option prices, just the theoretical price based on the Black-Scholes model and its parameters and assumptions.
2)Greeks (all of the Greeks included in this indicator are listed below):
a)Delta is the rate of change of the theoretical option price with respect to the change in the underlying's price. This can also be used to approximate the probability of your option expiring in the money. For example, if you have an option with a delta of 0.62, then it has about a 62% chance of expiring in-the-money. This number runs from 0 to 1 for Calls, and 0 to -1 for Puts.
b)Gamma is the rate of change of delta with respect to the change in the underlying's price.
c)Theta, aka "time decay", is the rate of change in the theoretical option price with respect to the change in time. Theta tells you how much an option will lose its value day by day.
d)Vega is the rate of change in the theoretical option price with respect to change in implied volatility.
e)Rho is the rate of change in the theoretical option price with respect to change in the risk-free rate. Rho is rarely used because it is the parameter that options are least effected by, it is more useful for longer term options, like LEAPs.
f)Vanna is the sensitivity of delta to changes in implied volatility. Vanna is useful for checking the effectiveness of delta-hedged and vega-hedged portfolios.
g)Charm, aka "delta decay", is the instantaneous rate of change of delta over time. Charm is useful for monitoring delta-hedged positions.
h)Vomma measures the sensitivity of vega to changes in implied volatility.
i)Veta measures the rate of change in vega with respect to time.
j)Vera measures the rate of change of rho with respect to implied volatility.
k)Speed measures the rate of change in gamma with respect to changes in the underlying's price. Speed can be used when evaluating delta-hedged and gamma hedged portfolios.
l)Zomma measures the rate of change in gamma with respect to changes in implied volatility. Zomma can be used to evaluate the effectiveness of a gamma-hedged portfolio.
m)Color, aka "gamma decay", measures the rate of change of gamma over time. This can also be used to evaluate the effectiveness of a gamma-hedged portfolio.
n)Ultima measures the rate of change in vomma with respect to implied volatility.
o)Probability of Touch, is not a Greek, but a metric that I included, which tells you the probability of price touching your strike price before expiry.
3) Implied Volatility:
This is the market's forecast of future volatility. Implied volatility is directionless, it cannot be used to forecast future direction. All it tells you is the forecast for future volatility.
How to use this indicator:
1st. Input the strike price of your option. If you input a strike that is more than 3 standard deviations away from the current price, the model will return a value of n/a.
2nd. Input the current risk-free rate.(Including this is optional, because the risk-free rate is so small, you can just leave this number at zero.)
3rd. Input the time until expiry. You can enter this in terms of days, hours, and minutes.
4th.Input the chart time frame you are using in terms of minutes. For example if you're using the 1min time frame input 1, 4 hr time frame input 480, daily time frame input 1440, etc.
5th. Pick what type of option you want data for, Long Call or Long Put.
6th. Finally, pick which Greek you want displayed from the drop-down list.
*Remember the Option price presented, and the Greeks presented, are theoretical in nature, and not based upon actual option prices. Also, remember the Black-Scholes model is just a model based upon various parameters, it is not an actual representation of reality, only a theoretical one.

Trend Pulse Pro V2Trend Pulse Pro V2 (Non Repaint)
TradingView Account Needed: Free
You don't need to be an expert to use Trend Pulse Pro.
Just follow the signals and that's all and use simple Fibonacci levels to find stop loss and take profit!
You can increase the win rate even more by following some simple technical analysis, for example, when trend breaks (price break signal level) you can use that as support become resistance level (sell) or resistance becomes support (buy):
No complex things. No waste of time.
And although you won't win 100% of the trades (no signals can guarantee that), your trading will surely improve a lot!
Even someone with almost no trading experience can read the simple trading rules given in the included user guide, watch the how-to videos and follow Trend Pulse Pro’s signals to consistently make smarter trades.
With Trend Pulse Pro you will get accurate buy and sell signals every time there is a new trading opportunity so that you never miss any big price movements and makes your trading both easier and more profitable.
How to use the signals and alerts:
Trend Pulse Pro automatically analyze trend and price action to give you a signal when there's a good trade.
These trend signals and alerts are derived from live data but the stability of our code allows it to not repaint.
Trend Pulse Pro allow you to easily determine the trend and will give you buy and sell entry levels.
Works on all markets on all time frames so it's suitable for scalpers, day and swing traders.
If you want more details, the link is in the signature.
Disclaimer:
Past performance is not indicative of future performance. No representation is being made that any results discussed within the service and its related media content will be achieved. All opinions, news, research, analyses, prices or other information is provided as general market commentary and not as investment advice. TradingWalk, their members, shareholders, employees, agents, representatives and resellers do not warrant the completeness, accuracy or timeliness of the information supplied, and they shall not be liable for any loss or damages, consequential or otherwise, which may arise from the use or reliance of the TradingWalk service and its content. © 2019 TradingWalk.
TradingWalk indicators are built for TradingView. TradingWalk is on no way a part of TradingView.

MM-Microtrend-Reversal-IndicatorThis indicator detects microtrend reversals based on crossing of the DMI+ and DMI- + signals
It indicates the trigger event on the chart as well as the reversal candle
In addition to that it shows a countdown above the bars
This is helping when multiple reversals occur
Important: when the Bollinger Bands are crossed in the previous bars it's possible that the prognosted reversal will NOT show up
Recommended timeframes are M1 and M2
Avoid trading sideway trends, the reverals are low and reversal triggers and assumed reversal candles could get chaotic
