Arrows Perfect BinaryThis is a binary options script for detecting the best flaws in the market and taking advantage.
Initially, the script was coded with Martingale in mind and no losses occur in 3-5 cycles but a revision was made and this is the current version 1.0 of the script. Use this script wisely, It's a powerful one and might be the Holy Grail or Account Blower.
If you think of something please lemme know so that I can improve the value of this script to the community.
I am open to wise contributions.
Enjoy, lucemanb
"binary" için komut dosyalarını ara


DXY Helper for Binary Option by MrTuanDoanThe US Dollar Index (DXY) is really important for Binary traders who looking for setups on USD pairs.
With this indicator, you dont need another chart or switching between your current USD-pair chart and DXY chart.
What's the different with normal DXY?
THE DAILY GAP
If you know what happens when there is a GAP in DXY, this is your indicator.
FYI: I'll wait for the GAP TO BE FILLED. That means other USD-pairs will follow that "filling" direction.
Functions:
Draw DXY chart on other chart
Added Double Bollinger Bands
Added Parabolic SAR for the trend
Added GAP detection on chart
Added alert for GAP
Please always follow your Risk Managment

Medium EMA Cross for Binary OptionsThis is a rework of one of Chris Moody's EMA scripts, but made useful for binary options trading. The color of the indicator is the direction of the trade you should take immediately after the bar closes. This is ideal for 5 minute charts. Overlays are based on EMA crossovers. This is dead simple - green overlay = CALL, red overlay = PUT.

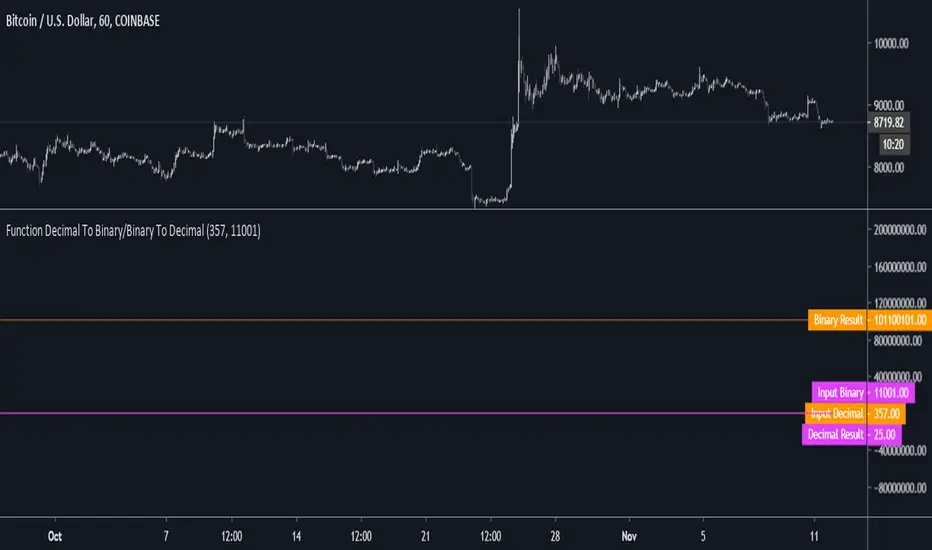
Function Decimal To Binary/Binary To DecimalNOTE: Experimental. Pinescript implementation of Decimal to Binary and Binary to Decimal that is intended for use in the development of a neural network proof of concept.
Intended for use in as subcomponent in the development of a more complex/highly experimental prototype.
Protection/logic for edge cases above 11111111/255 (8bits) is NOT implemented.
Do NOT use this in any trading system or component without edge case testing/unit tests.
// Decimal to Binary, Binary to Decimal Reference:
// diwasfamily.com
// www.wikihow.com
//
// www.khanacademy.org
Dynamic Candle Balance Indicator (Binary)
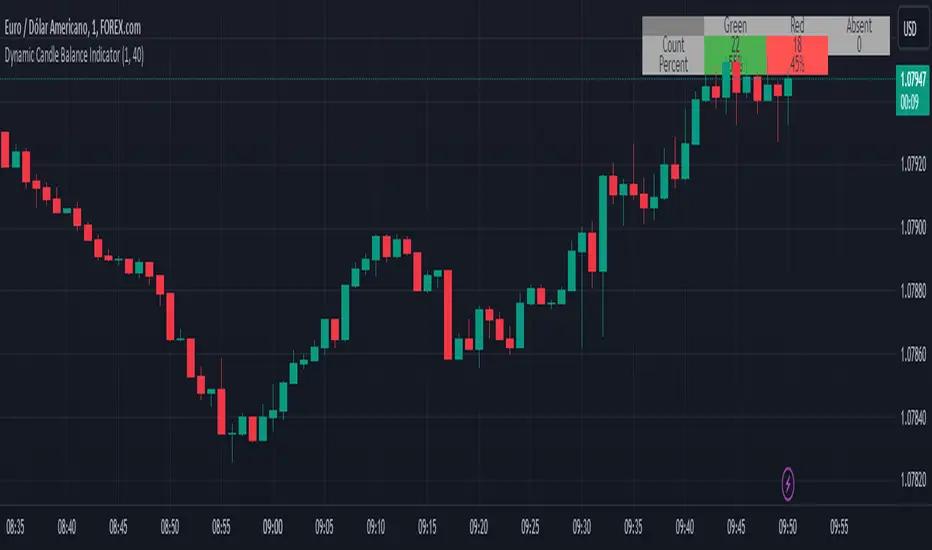
Dynamic Candle Balance Indicator
The Dynamic Candle Balance Indicator is a powerful tool designed to identify imbalances in candle colors on a chart, which can indicate potential reversals or changes in market direction. This indicator is specifically developed for traders operating on short timeframes, such as 1-minute candles, and is particularly useful for identifying opportunities in binary options.
How to Use:
Set Parameters
Initial Position: Specify the number of initial candles to be considered for calculation.
Count: Determine the total number of candles to be analyzed, including the initial position.
Interpret Results:
Green: Indicates the number of bullish candles (where the closing price is higher than the opening price).
Red: Indicates the number of bearish candles (where the closing price is lower than the opening price).
Absent: Indicates the number of candles that were not considered due to the selected interval.
Performance Analysis:
The indicator calculates the percentage of green and red candles relative to the total number of analyzed candles, providing insights into market balance or imbalance.
Identify Trading Opportunities:
Significant imbalances between candle colors can indicate potential reversals or changes in market direction.
Traders can use this information to make informed decisions about their trading strategies, such as identifying entry or exit points.
Example:
In the last 40 candles, there were 13 green candles and 27 red candles, indicating a higher likelihood of the next candle being green.
Usage Tips:
The indicator is most effective when used on a 1-minute timeframe for binary options trading, especially during periods of high imbalance.
Adjust the parameters according to your trading strategy and the timeframe being analyzed.
Combine the Dynamic Candle Balance Indicator with other technical analysis tools to confirm trading signals.
Legal Disclaimer:
This indicator is provided for educational and informational purposes only. It represents a theory and should be used as part of a comprehensive trading strategy. Past performance is not indicative of future results. Traders should always conduct their own analysis before making trading decisions.
Try out the Dynamic Candle Balance Indicator and leverage its functionalities to identify trading opportunities on short-term charts, especially in 1-minute timeframes for binary options trading during periods of high imbalance. Remember to test the indicator on a practice account before using it on a real account.
NADEX Binary OptionsAlright guys, I finally nailed NADEX Binary options!
You can use my indicator for any timeframe.
I use primarily it for 5 minutes NADEX binary options.
How do you use it?
============================
1. Watch out for a gray arrow on one minute chart, that tells you that there might be a chance of reversal.
2. Once you get a gray arrow on the chart, wait for red or green arrows depending on trends.
3. Once you get a red/green signal arrow, check following two things:
First, blue circles lines are flat or not too slanted.
Second, red line is flat or little bit slanted.
4. If all the above conditions, met then put the order in on NADEX 5 minute binary options.
Red arrow => SELL signal
Green arrow => BUY signal
Money Management:
1. I enter a pending order at $35 ITM for sell orders and $65 for buy orders. (if you loose, you loose $65).
2. Once the order is filled, I do not wait for expiry. I exit out trend if I make 25 dollars. I put take profit orders at $10 for sell orders and $90 on buy orders.
That's it!
Email me at bhaveshjpatel2003@gmail.com to get an access to my system.

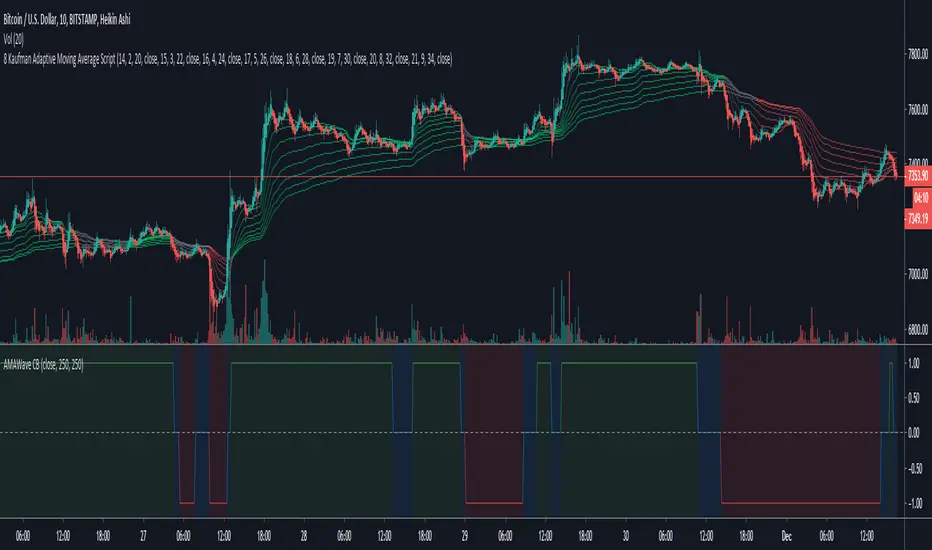
Kaufman AMA Binary Wave [ChuckBanger]This is Kaufman AMA Binary Wave with buy and sell zones. It’s pretty simple: when the line is over zero = buy zone, below zero = sell, at zero = neutral. You can experiment with the filter and length settings to suit your environment.

BinaryLifeThe indicator shows market entry points for binary options. The optimal timeframe is 3 minutes. Expiration of trades depending on currency pairs (3, 6 minutes). Each pair is selected according to history, what is the expiration better. It gives signals on the trend of higher timeframes.
/////////
Индикатор показывает точки входа в рынок для бинарных опционов. Оптимальный таймфрейм является 3 минуты. Экспирация сделок в зависимости от валютных пар (3, 6 минут). Каждая пара подбирается по истории, какая экспирация лучше. Дает сигналы по тренду старших таймфреймов.

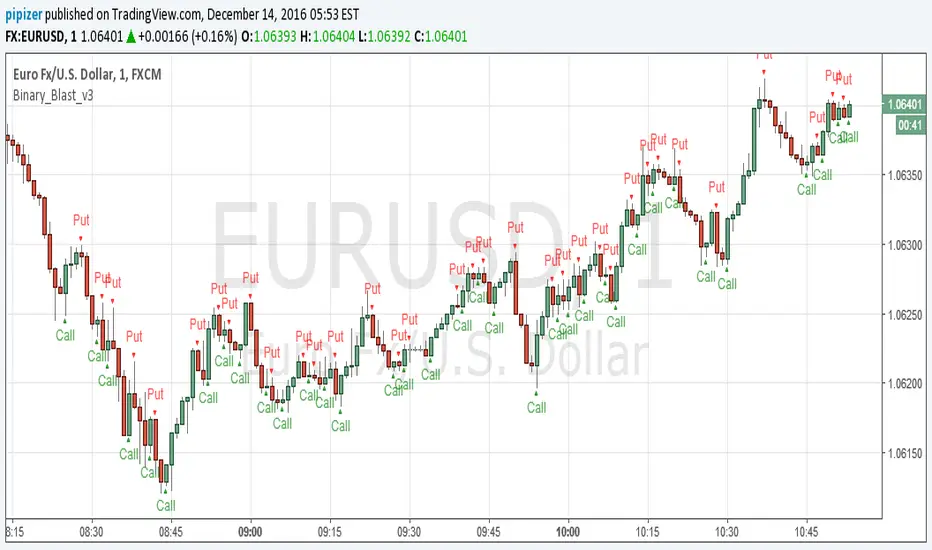
Binary_Blast_v3This is new version for binary blast! Expiry 2 candles after signal candle closes wait for signal candle to close.
Black-Scholes Options Pricing ModelThis is an updated version of my "Black-Scholes Model and Greeks for European Options" indicator, that i previously published. I decided to make this updated version open-source, so people can tweak and improve it.
The Black-Scholes model is a mathematical model used for pricing options. From this model you can derive the theoretical fair value of an options contract. Additionally, you can derive various risk parameters called Greeks. This indicator includes three types of data: Theoretical Option Price (blue), the Greeks (green), and implied volatility (red); their values are presented in that order.
1) Theoretical Option Price:
This first value gives only the theoretical fair value of an option with a given strike based on the Black-Scholes framework. Remember this is a model and does not reflect actual option prices, just the theoretical price based on the Black-Scholes model and its parameters and assumptions.
2)Greeks (all of the Greeks included in this indicator are listed below):
a)Delta is the rate of change of the theoretical option price with respect to the change in the underlying's price. This can also be used to approximate the probability of your option expiring in the money. For example, if you have an option with a delta of 0.62, then it has about a 62% chance of expiring in-the-money. This number runs from 0 to 1 for Calls, and 0 to -1 for Puts.
b)Gamma is the rate of change of delta with respect to the change in the underlying's price.
c)Theta, aka "time decay", is the rate of change in the theoretical option price with respect to the change in time. Theta tells you how much an option will lose its value day by day.
d) Vega is the rate of change in the theoretical option price with respect to change in implied volatility .
e)Rho is the rate of change in the theoretical option price with respect to change in the risk-free rate. Rho is rarely used because it is the parameter that options are least effected by, it is more useful for longer term options, like LEAPs.
f)Vanna is the sensitivity of delta to changes in implied volatility . Vanna is useful for checking the effectiveness of delta-hedged and vega-hedged portfolios.
g)Charm, aka "delta decay", is the instantaneous rate of change of delta over time. Charm is useful for monitoring delta-hedged positions.
h)Vomma measures the sensitivity of vega to changes in implied volatility .
i)Veta measures the rate of change in vega with respect to time.
j)Vera measures the rate of change of rho with respect to implied volatility .
k)Speed measures the rate of change in gamma with respect to changes in the underlying's price. Speed can be used when evaluating delta-hedged and gamma hedged portfolios.
l)Zomma measures the rate of change in gamma with respect to changes in implied volatility . Zomma can be used to evaluate the effectiveness of a gamma-hedged portfolio.
m)Color, aka "gamma decay", measures the rate of change of gamma over time. This can also be used to evaluate the effectiveness of a gamma-hedged portfolio.
n)Ultima measures the rate of change in vomma with respect to implied volatility .
o)Probability of Touch, is not a Greek, but a metric that I included, which tells you the probability of price touching your strike price before expiry.
3) Implied Volatility:
This is the market's forecast of future volatility . Implied volatility is directionless, it cannot be used to forecast future direction. All it tells you is the forecast for future volatility.
How to use this indicator:
1st. Input the strike price of your option. If you input a strike that is more than 3 standard deviations away from the current price, the model will return a value of n/a.
2nd. Input the current risk-free rate.(Including this is optional, because the risk-free rate is so small, you can just leave this number at zero.)
3rd. Input the time until expiry. You can enter this in terms of days, hours, and minutes.
4th.Input the chart time frame you are using in terms of minutes. For example if you're using the 1min time frame input 1, 4 hr time frame input 480, daily time frame input 1440, etc.
5th. Pick what style of option you want data for, European Vanilla or Binary.
6th. Pick what type of option you want data for, Long Call or Long Put.
7th . Finally, pick which Greek you want displayed from the drop-down list.
*Remember the Option price presented, and the Greeks presented, are theoretical in nature, and not based upon actual option prices. Also, remember the Black-Scholes model is just a model based upon various parameters, it is not an actual representation of reality, only a theoretical one.
*Note 1. If you choose binary, only data for Long Binary Calls will be presented. All of the Greeks for Long Binary Calls are available, except for rho and vera because they are negligible.
*Note 2. Unlike vanilla european options, the delta of a binary option cannot be used to approximate the probability of the option expiring in-the-money. For binary options, if you want to approximate the probability of the binary option expiring in-the-money, use the price. The price of a binary option can be used to approximate its probability of expiring in-the-money. So if a binary option has a price of $40, then it has approximately a 40% chance of expiring in-the-money.
*Note 3. As time goes on you will have to update the expiry, this model does not do that automatically. So for example, if you originally have an option with 30 days to expiry, tomorrow you would have to manually update that to 29 days, then the next day manually update the expiry to 28, and so on and so forth.
There are various formulas that you can use to calculate the Greeks. I specifically chose the formulations included in this indicator because the Greeks that it presents are the closest to actual options data. I compared the Greeks given by this indicator to brokerage option data on a variety of asset classes from equity index future options to FX options and more. Because the indicator does not use actual option prices, its Greeks do not match the brokerage data exactly, but are close enough.
I may try to make future updates that include data for Long Binary Puts, American Options, Asian Options, etc.


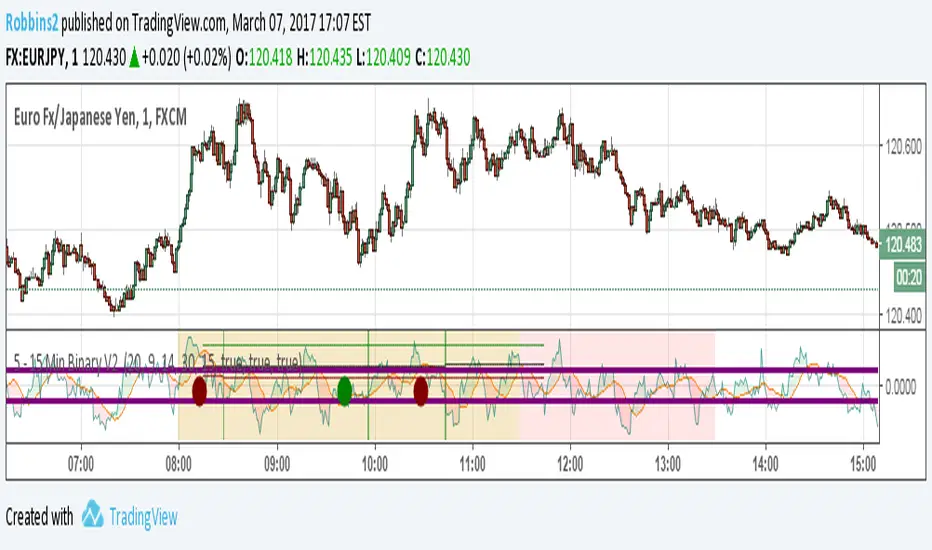
5 - 15 Min Binary V2 Hey guys
As promised back with the updated indicator without needing my blessing to use. Please post feedback so that I can perfect it.
Works great on EU/JP and USDCAD with a risk factor of 20 – 25. Use 1 time frame with 15 mins Expiry for nest results. Possible to get 90% ITM with this setup.
Updated Feature
Risk Factor: Higher the number lowers the risk but also means lower trade setups. Best between 20 – 25.
Added an additional Filter to minimize bad setups
No trading between 11.30 EST to 13.00 EST. Not worth the risk.
Displays ITM rate in Green, Red and total in Black.
Alert capable for Both, Call or Put
Please demo before you take it live. Also during normal trading hours I have not seen more than 3 consecutive loses, (unless there is a news release) so with money management you can greatly increase your total ITM rate.
If you like this indicator, feel free to donate some BTC at 18qrzku9LrQuMq9LyRYmiTbqUtC2bSAv3y
It does take considerable amount of tweaking and testing to put out something like this.
Post feedback so that everyone can benefit.
Binary Options Strategy 1-5-15-30-90 Sec & Min [TradingFinder]🔵 Introduction
Market behavior is not defined by randomness, but by order positioning, structural pressure, and directional imbalance. Every expansion or rejection in price is the result of how the market distributes orders around critical structural areas. These reactions become visible only when price reaches zones where participation and exposure are at their highest.
Price naturally migrates toward areas of unfinished business, levels where previous moves left behind unfilled orders or weak structure. When these areas are reached, the market often produces a temporary structural violation, creating the appearance of continuation while internally transitioning to the opposite side.
These brief violations are not failures of structure; they are transitional events. Their purpose is to exhaust one side of the market, absorb remaining orders, and prepare price for a directional response. Once this process is complete, price tends to react sharply as balance is restored and a new directional phase begins.
Reactions frequently originate from price inefficiencies and institutional positioning zones, where rapid movement previously occurred without sufficient interaction. When price revisits these areas after a structural trap, it often delivers decisive and controlled responses.
This screener is designed to detect these transition moments, when structural pressure, order absorption, and directional intent align. By isolating these conditions across multiple symbols, it converts complex market mechanics into clear, actionable structural signals, allowing traders to focus on moments where price behavior reflects intention rather than noise.
Bullish Signal :
Bearish Signal :
🔵 How to Use
This screener is built to identify structural reaction points where the market completes a directional phase and begins a new one. Instead of tracking price continuously, it scans for moments when pressure, exhaustion, and response converge at key structural locations.
The output of the screener should be treated as a filter, not a final decision. Each flagged symbol highlights a scenario where price behavior suggests a potential directional response. Traders are expected to confirm context, execution timing, and risk parameters on the chart before entering a position.
🟣 Long Setup
A bullish scenario is detected when price transitions from a downward phase into an area where sell pressure weakens and absorption occurs. This typically happens after price extends below recent structural lows, reaching a zone where downside continuation becomes inefficient.
In this region, price often shows signs of failed continuation. The market temporarily pushes lower but lacks follow-through, indicating that selling interest is being absorbed. Shortly after, price stabilizes and begins to react upward from a structurally sensitive area.
When the screener identifies this sequence, downward expansion, structural failure, and upward reaction, it flags the symbol as a potential long opportunity.
This condition reflects a shift from distribution to accumulation, where downside momentum is exhausted and buying pressure starts to dominate. For execution-based strategies, the optimal entry usually occurs shortly after the market confirms the reaction and begins to move away from the structural zone.
🟣 Short Setup
A bearish scenario is detected when price advances into an area where buy pressure becomes overstretched and upward continuation loses efficiency. This often occurs after price trades above recent structural highs, entering a zone where aggressive buying is met with strong opposing interest.
In these areas, price frequently produces a temporary expansion higher followed by hesitation or rejection. The inability to sustain movement above the level signals that buying momentum is being absorbed and that the market is preparing for a directional shift.
When the screener detects upward extension followed by structural weakness and downside response, it flags the symbol as a potential short opportunity.
This setup represents a transition from accumulation to distribution, where control shifts from buyers to sellers. The most effective execution window typically appears immediately after price confirms rejection and starts moving away from the upper structural zone, as reactions tend to be fast and decisive once the transition completes.
🔵 Settings
Swing Period : Determines how many candles are used to identify structural turning points such as swing highs and swing lows. Higher values increase accuracy but reduce the number of signals.
Signal Type : Specifies the type of signal generated by the indicator. The option All shows every signal, Main Signal displays only the primary one, and Alternative Signal produces a secondary signal that appears one candle after the main signal for additional confirmation.
Candle Pattern : Enables candle pattern logic for reversal confirmation. When active, the indicator issues a signal only when a valid candle formation confirms the market reaction.
Candle LookBack Check : Verifies that the last few candles move in the opposite direction of the signal to be generated. This condition acts as a confirmation filter, ensuring that the signal appears only after a clear counter-move in price.
Last Candle Direction : Considers the direction of the most recent candle in the analysis. It helps determine whether the final candle moves with or against the current trend.
Last Candle Shadow Ratio : Sets the ratio between the last candle’s wick and body to refine confirmation accuracy. Higher values require longer wicks, indicating stronger rejection and a more reliable reversal pattern.
Table on Chart : This setting enables or disables the on chart screener table. When enabled, the table displays signal status, correlation information, and symbol data directly on the chart. When disabled, the chart remains clean with no table overlay.
Number of Symbols : This option controls how many symbol pairs are displayed in the screener table. Users can choose between four or six pairs depending on screen size and personal preference.
Table Size : This setting adjusts the visual scale of the screener table. Smaller sizes are suitable for minimal layouts, while larger sizes improve readability when monitoring multiple pairs simultaneously.
Table Mode : This setting offers two layout styles for the signal table.
Basic mode displays symbols in a single vertical column, using more vertical space and providing straightforward readability.
Extended mode arranges symbols in pairs side by side, optimizing screen space with a more compact and efficient layout.
Table Position : This option defines where the screener table is placed on the chart. The table can be positioned in any corner or central area to avoid overlapping with price action or other indicators.
🔵 Conclusion
Markets move through a continuous cycle of expansion, exhaustion, and response. Understanding this cycle requires more than observing price direction; it demands recognizing where pressure builds, where it fails, and where control shifts from one side of the market to the other.
This screener is designed to isolate those moments of transition. By filtering symbols based on structural interaction, absorption, and reaction, it highlights situations where price behavior reflects intentional movement rather than random fluctuation. Instead of reacting to every candle or chasing momentum, traders can use this tool to focus on selective, high-quality scenarios where directional probability improves due to completed structural processes.
The true value of this screener lies in its ability to reduce noise, compress complex market mechanics into actionable signals, and support disciplined decision-making. When used with proper context and risk control, it becomes a powerful framework for identifying moments when the market reveals its next directional phase.
Consistency with this approach comes not from frequency, but from patience, confirmation, and a clear understanding of how price transitions between phases. Those who learn to wait for these transitions gain a significant advantage in reading and responding to market behavior.

BB and RSI Indicator Alert v0.3 by JustUncleLI have just recently revised this indicator alert for public release. This is for the 60sec Bollinger Band break Binary Option traders.
This indicator alert is a variation of one found in a well known Broker's marketing videos. It uses Bollinger bands, RSI and moving averages. Included is a pre-warning alert condition. The strategy and settings are designed for 1min charts and Binary Options, but it could work for up to 15 min charts.
The default settings are BB(14,2) and RSI(11) with 75/25 Levels boundaries. To be a valid trade the RSI needs to be within 75/25 channel. The optional Market direction filter is enabled by default and is calculated by two EMA (200 and 50):
When 200ema rising and 50ema above 200ema then market going up.
When 200ema falling and 50ema below 200ema then market going down.
A potential Bollinger Break reversal trades identified by shapes: The purple diamond is the pre-warning purple alert and the green and red pointers with the PUT/CALL labels are the trade alerts. Make Binary Option trade in specified direction 60sec (or can also use 120sec trade without Martingale).
* Notes and Hints *
The original videos specified a Martingale money management strategy, be careful using this management. When I use Martingale I recommend go to 3 levels: 10, 25, 65 if no win at 65 stop trading this alert and start next alert back at 10, you should recovery loss by future wins given you are able to get a reasonable ITM rate with this strategy. Alternatively instead of using Martingale use 120sec Binary Option trade.
Be wary of break alerts on a steep Bollinger, they tend to keep running away for awhile, especially if steep on both sides of Bollinger channel.
As with most of this style of indicator the alert conditions will redraw until the candle is closed. For me this is okay, as it is an Alert is only to a potential trade and final decision to trade is made by me.
You need to practise this and be aware of market news, sessions boundaries, slow trading periods etc. Plan your periods of when you should trade, I prefer Asian session before lunch and London sessions.

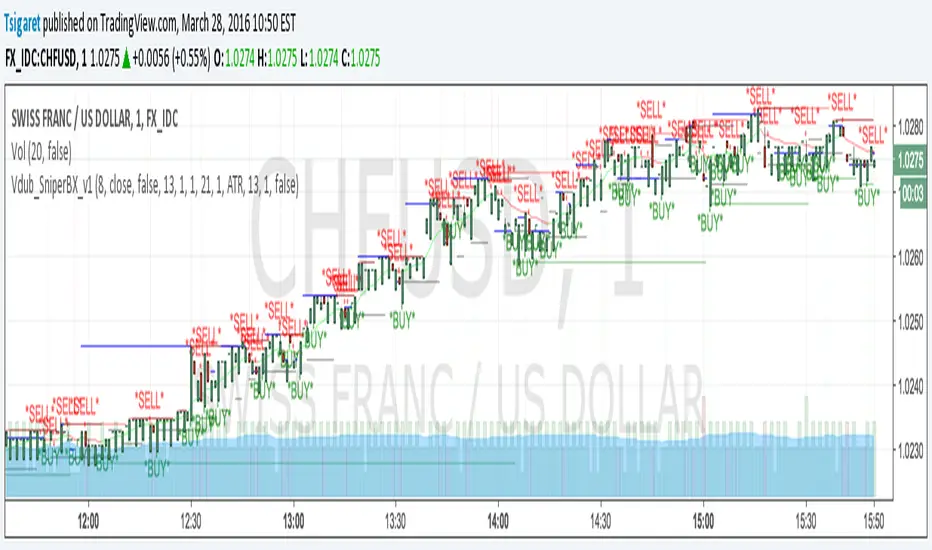
BO_EXPIRY_VDUB_v1Set Background to custom Trading sessions & set custom Binary Options expiry times.


BO ADX Binary Option strategy based on ADX/DI cross, Put or Call at the beginning of the next candle, expire 5m for 5m candle.

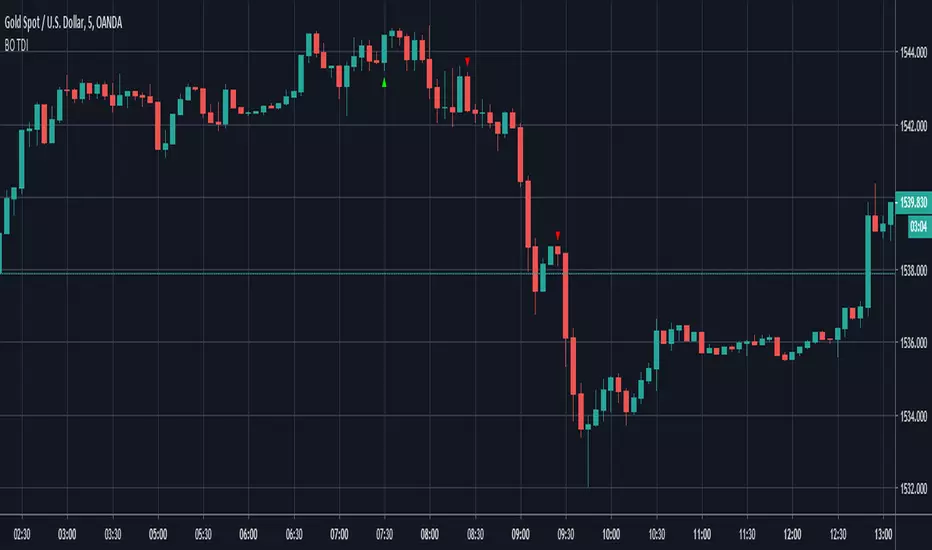
BO TDIBinary Option strategy based on TDI indicator, Put or Call at the beginning of the next candle, expire 5m for 5m candle.

Binary Fisher [Orderflowing]Binary Fisher | Adaptive Fisher Transform | Adaptive Bands | Smoothing (+) | Customizable (+)
Built using Pine Script V5.
Introduction
The Binary Fisher is a tool that transforms your traditional market analysis.
This indicator is for traders seeking a dynamic and responsive view of market turning points.
Innovation and Inspiration
Drawing inspiration from John Ehlers, the Binary Fisher represents a step forward.
It redefines the Fisher Transform with more features and customization, which gives traders a unique lens for analysis.
Core Features
Adaptive Length Calculation: Binary Fisher can operate in both fixed and automatic length modes.
Smoothing Options: Choose from EMA, HMA, SMA, Fourier, or no smoothing for the Fisher values, the indicator bends to your analytical preference.
Adaptive Bands: Visualize market extremes with adaptive bands, smoothed using EMA, HMA, SMA, or Fourier methods.
Trend Shift Detection: The indicator identifies bullish, bearish, and neutral shifts in market trends, providing early signals for potential reversals.
Experimental Divergence Analysis: Detect divergences between price and Fisher values, a key indicator of potential trend changes.
Band Lines: Projects band lines around the Fisher values, offering a way to analyze the interaction between the Fisher line and these bands to project the trend of the fisher transform.
Functionality
Input Source: Choose from various price data inputs like close, open, high, low, and more for Fisher calculations.
Hilbert Transform for Dominant Cycle Period: Utilizes Hilbert Transform to dynamically adjust to the dominant market cycle.
Custom Thresholds and Bands: Set your thresholds for trend shifts and adjust band multipliers for personalized sensitivity.
Visualization: The indicator has a color system for easy understanding of the trend according to the fisher transform.
Multi-Timeframe: Apply the Binary Fisher across different timeframes, and chart them from another. Great for different timeframe strategies.
Example of Band Lines:
Example of Multi-Timeframe (1D Calculation / 4H Chart):
Analysis and Interpretation
The Binary Fisher helps the trader get a simpler view of market pivots.
The flexibility allows for better identification of overbought and oversold conditions, trend shifts, and potential reversal points.
The color system and visual markers make it easy to interpret quickly.
Usage and Applications
Instrument Trend Analysis: Understand the direction and strength of market trends.
Reversal Prediction: Identify potential reversal points with trend shift dots and divergence detection.
Trading Strategy: Adapt the indicator settings to align with your unique trading style and risk tolerance.
Conclusion
The Binary Fisher indicator stands out as innovative trading technology.
It is a powerful tool for traders born by enhancing the Fisher Transform with adaptive features and modern analysis methods, with lots of customization options.
The Binary Fisher should be used as part of a larger trading strategy.
Never make trading decisions based on the signals of the Binary Fisher alone.
