Victoria Overlay - HTF 200 + VWAP + ATR Stop + MA TrioConsolidated road to minions
Buy Setup:
EMA1 crosses above SMA3.
RSI confirms above 50.
Volume increasing (confirming momentum).
Candle closes above SMA1 base.
Sell Setup:
EMA1 crosses below SMA3.
RSI drops below 50 or exits overbought.
Volume confirms (declining or reversing).
Candle closes below SMA1 base.
Tips:
Think of EMA1 as the scalper’s trigger.
SMA3 is your momentum check.
SMA1 (base) = short-term bias.
Avoid entries during low-volume chop.
Use for day trades or tight scalps; exits happen fast.
Overlay (Smoothed Heikin Ashi + Swing + VWAP + ATR Stop + 200-SMA)
Purpose: Multi-layer trend confirmation + clean structure.
Type: Swing alignment tool.
🟩 BUY / CALL Conditions
Green “Buy (Gated)” arrow appears.
Price is above VWAP, above 200-SMA, and above ATR stop.
ATR stop (green line) sits under price → support confirmed.
Heikin-Ashi candles are green/lime.
Bias label says “Above VWAP | Above 200 | Swing Up”.
🟥 SELL / PUT Conditions
Red “Sell (Gated)” arrow appears.
Price is below VWAP, below 200-SMA, and below ATR stop.
ATR stop (red line) sits above price → resistance confirmed.
Heikin-Ashi candles are red.
Bias label says “Below VWAP | Below 200 | Swing Down”.
Exit / Risk Control:
Close position when price crosses ATR stop.
If Heikin candles flip color, momentum is reversing.
Best Use Cases:
For next-day or multi-hour swing entries.
Use ATR Stop for dynamic stop loss.
Stay out when the bias label is mixed (e.g. “Above VWAP | Below 200 | Swing Down”).
Pro Tip:
On big news days, let VWAP reset post-open before acting on arrows — filters fake signals.
RSI Panel Pro (v6)
Purpose: Strength + exhaustion confirmation.
Type: Momentum filter.
Key Levels:
Overbought: 80+ → take profits soon.
Oversold: 20– → watch for bounce setups.
Bull regime: RSI above 60 = momentum strong.
Bear regime: RSI below 40 = weakness.
Buy / Entry Signals:
RSI crosses up from below 40 or 20.
RSI line is above RSI-EMA (gray line).
Higher timeframe RSI (if used) is also rising.
Trim / Exit:
RSI drops under 60 after being strong.
RSI crosses below its EMA.
Sell / Put Setup:
RSI fails at 60 or drops below 40.
RSI crosses under EMA after a bounce.
Tips:
Pair RSI panel with Victoria Overlay — only take gated buys when RSI confirms.
RSI < 40 but above 20 = “loading zone” for reversals.
RSI > 70 = overextended → wait for confirmation before entering.
Combined Execution Rules
Goal What to Watch Action
Entry (CALL) EMA1 > SMA3, Buy (Gated) arrow, RSI rising > 50 Buy call / open long
Entry (PUT) EMA1 < SMA3, Sell (Gated) arrow, RSI < 50 Buy put / open short
Exit Early Price crosses ATR stop or RSI flips under EMA Exit trade / protect gains
Trend Filter VWAP + 200-SMA alignment Only trade in that direction
Avoid Trades Conflicting bias label or low volume Stay flat
Pro Tips
VWAP → Intraday mean: above = bullish control, below = bearish control.
ATR Stop → Dynamic trailing stop: never widen it manually.
Smoothed Heikin-Ashi → filters noise: trend stays until color flips twice.
RSI Panel → confirms whether to hold through pullbacks.
If RSI and Overlay disagree — wait, not trade.
"bias" için komut dosyalarını ara

Aibuyzone Elliott Wave SuiteOverview
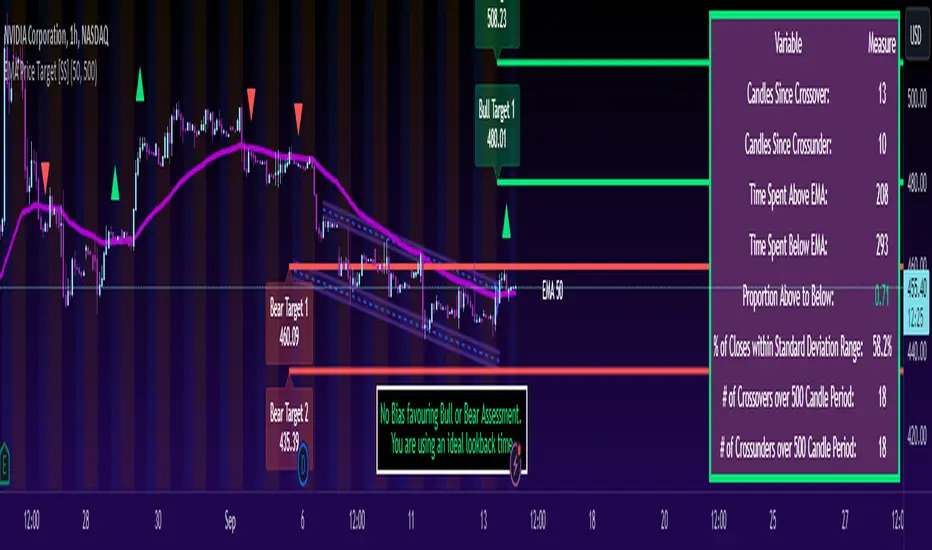
This study approximates Elliott-style wave structure using swing pivots. It labels primary waves (1–5), tracks subwaves (1–5) inside them, and plots future projection bands derived from the size of a recent primary leg. A small floating dashboard summarizes the current wave number, bias (bullish/bearish) based on the last leg, and a projection price range.
Note: This tool is educational. Wave detection is algorithmic and approximate; it does not identify textbook Elliott patterns or validate rule sets. Manage risk independently.
What it draws
Primary wave labels (1–5): Based on higher swing length pivots (major turns).
Subwave labels (1–5): Based on shorter swing length pivots (minor turns).
Zigzag connectors: Simple lines between the latest primary pivots for structure visualization.
Projection bands: Three dotted horizontal levels forward from the last primary pivot, using user-defined extension multipliers.
Floating dashboard:
Current Wave: Latest primary wave count (1–5).
Bias: “Bullish Leg” (last pivot was a low) or “Bearish Leg” (last pivot was a high), or “Unknown” if insufficient data.
Proj Range: Min–max of the three projection levels.
Key Inputs
Swing Structure
Primary Swing Length: Pivot left/right bars for major swings. Larger values = fewer, cleaner waves.
Subwave Swing Length: Pivot left/right bars for minor swings. Smaller values = more frequent subwave labels.
Max Saved Swing Points: Memory limit to prevent clutter.
Future Projections
Show Projection Levels: Toggle projection lines on/off.
Use Last Nth Leg For Size: Which recent primary leg to use for measuring projection distance (1 = most recent).
Extension 1 / 2 / 3: Multipliers applied to the measured leg (e.g., 1.0, 1.618, 2.0).
Style
Colors and text sizes for primary and subwave labels, and projection lines.
Dashboard
Show Dashboard: Toggle table on/off.
Dashboard Position: Top-Left / Top-Right / Bottom-Left / Bottom-Right.
How projections are computed
The script measures the price distance of a recent primary leg (from pivot A to pivot B).
If the last pivot is a low, projections extend upward; if the last pivot is a high, projections extend downward.
The three extension inputs (e.g., 1.0 / 1.618 / 2.0) are applied to that leg distance to create dotted forward levels.
The dashboard’s Proj Range displays the min–max of those three levels.
Using the study (suggested workflow)
Choose timeframe appropriate for your style (e.g., higher timeframes for cleaner structure; lower timeframes for detail).
Tune swing lengths:
Increase Primary Swing Length on noisy charts to stabilize wave counts.
Adjust Subwave Swing Length to reveal or simplify internal moves.
Read the dashboard:
Current Wave shows where the latest primary count sits (1–5).
Bias summarizes the direction of the last measured leg only; it is not a trend system.
Proj Range offers a coarse price band derived from your extensions.
Context check: Combine wave labeling with your own market context (trend, structure, volatility) before making decisions.
Risk management: Use your own stop/target methods. The projection lines are not signals.
Practical tips
Clutter control: If labels overlap on volatile symbols, try larger swing lengths or reduce label text sizes in Style.
Scaling: On very small tick sizes, increasing the internal label price offset can improve label readability.
Projection sensitivity: Changing Use Last Nth Leg can materially alter levels; confirm they match your intent.
Non-determinism across timeframes: Different timeframes and symbols will produce different pivot sequences and counts.
Limitations & important notes
Approximation: This does not enforce all Elliott rules (e.g., alternation, wave 4 overlap constraints, channeling). It only labels swings numerically.
Repainting of labels: Pivot-based waves confirm after enough bars have printed to the right of a high/low. Labels are placed when pivots confirm; they don’t predict pivots.
Not a signal generator: No entries/exits/alerts are included; add your own trade plan and risk controls.
Data sufficiency: Early bars or sparse data may show “Unknown” bias or “N/A” projections until adequate pivots exist.
Clean-chart publishing guidance (to stay compliant)
Use a chart that clearly shows this script’s outputs without unrelated indicators.
Keep the description educational. Avoid performance claims, guarantees, or language implying certainty.
Do not include links, promotions, prices, giveaways, contact details, or solicitations.
Disclose that labels and projections are algorithmic approximations and for educational use.
Risk disclosure
This script is for educational purposes only. It does not provide financial, investment, or trading advice and does not guarantee outcomes. Markets involve risk, including the potential loss of capital. Always do your own research and use independent judgment.

mysourcetypesncsLibrary "mysourcetypes"
Libreria personale per sorgenti estese (Close, Open, High, Low, Median, Typical, Weighted, Average, Average Median Body, Trend Biased, Trend Biased Extreme, Volume Body, Momentum Biased, Volatility Adjusted, Body Dominance, Shadow Biased, Gap Aware, Rejection Biased, Range Position, Adaptive Trend, Pressure Balanced, Impulse Wave)
rclose()
Regular Close
Returns: Close price
ropen()
Regular Open
Returns: Open price
rhigh()
Regular High
Returns: High price
rlow()
Regular Low
Returns: Low price
rmedian()
Regular Median (HL2)
Returns: (High + Low) / 2
rtypical()
Regular Typical (HLC3)
Returns: (High + Low + Close) / 3
rweighted()
Regular Weighted (HLCC4)
Returns: (High + Low + Close + Close) / 4
raverage()
Regular Average (OHLC4)
Returns: (Open + High + Low + Close) / 4
ravemedbody()
Average Median Body
Returns: (Open + Close) / 2
rtrendb()
Trend Biased Regular
Returns: Trend-weighted price
rtrendbext()
Trend Biased Extreme
Returns: Extreme trend-weighted price
rvolbody()
Volume Weighted Body
Returns: Body midpoint weighted by volume intensity
rmomentum()
Momentum Biased
Returns: Price biased towards momentum direction
rvolatility()
Volatility Adjusted
Returns: Price adjusted by candle's volatility
rbodydominance()
Body Dominance
Returns: Emphasizes body over wicks
rshadowbias()
Shadow Biased
Returns: Price biased by shadow length
rgapaware()
Gap Aware
Returns: Considers gap between candles
rrejection()
Rejection Biased
Returns: Emphasizes price rejection levels
rrangeposition()
Range Position
Returns: Where close sits within the candle range (0-100%)
radaptivetrend()
Adaptive Trend
Returns: Adapts based on recent trend strength
rpressure()
Pressure Balanced
Returns: Balances buying/selling pressure within candle
rimpulse()
Impulse Wave
Returns: Detects impulsive moves vs corrections

MACD-V Adaptive FluxProMACD-V Adaptive FluxPro
Type: Multi-Factor Volatility-Normalized Momentum & Regime Framework
Overlay: ✅ Yes (on price chart)
Purpose: Detect high-probability trend continuation or reversal zones through volatility-adjusted momentum, VWAP structure, and adaptive filters.
🧩 Concept Overview
MACD-V Adaptive FluxPro is a next-generation, multi-factor analytical framework that merges the principles of Linda Raschke’s 3-10-16 MACD with modern volatility normalization and adaptive filtering.
Instead of generating raw buy/sell signals, it builds a probability-driven environment model — showing when price action, volatility, and structure align for high-confidence trades.
The “V” in MACD-V stands for Volatility Normalization: every MACD component is divided by ATR to stabilize amplitude across fast or slow markets.
This enables the indicator to remain consistent across timeframes, instruments, and volatility regimes.
⚙️ Core Components
1️⃣ Volatility-Normalized MACD (MACD-V)
A traditional MACD built on Linda Raschke’s 3-10-16 structure, but adjusted by ATR to create a volatility-invariant momentum profile.
You can toggle to alternative presets (Scalp / Swing / Trend) for faster or slower environments.
2️⃣ Dynamic Regime Detection
A slope-based classifier that identifies whether the market is:
Trend Up 🟢
Trend Down 🔴
Compression / Squeeze 🟧
Transition / Neutral ⚫
The background color updates dynamically as momentum, volatility, and slope shift between these states.
3️⃣ VWAP Structure Bands
Adaptive VWAP with inner and outer ATR-scaled envelopes.
These act as short-term mean-reversion and breakout zones.
The indicator can optionally gate entries to occur only within defined VWAP proximity.
4️⃣ EMAs for Micro-Trend Confirmation
Includes 9-EMA and 21-EMA, color-configurable for visual crossovers and short-term momentum bias.
5️⃣ Multi-Timeframe Confirmation Tiles
Top-center dashboard tiles display directional bias from higher timeframes (e.g., 15m / 1h / 4h).
When all align, it confirms multi-frame trend coherence.
6️⃣ Adaptive Probability Engine
All subsystems — MACD-V, slope, compression, volume z-score, and VWAP distance — feed into a logistic scoring model that outputs a real-time AOI Probability (0-100%).
When conditions align, probabilities rise above 60% (long bias) or drop below 40% (short bias).
These are your high-probability “Areas of Interest.”
7️⃣ Dashboard HUD
The top-right status console provides a one-glance view of system state:
Field Meaning
AOI Prob Long Real-time probability of bullish bias
Regime Market state (Trend, Transition, Compression)
Risk Gate ATR-based volatility filter
News Mute Manual toggle for event-risk suppression
ATR (≈ risk) Real-time volatility readout
Status ✅ Trading OK / 🧱 Risk Gate / 🔇 News Mute / 🟧 Compression
🎯 Interpretation Guide
Visual Meaning
🟢 Green background Confirmed uptrend regime
🔴 Red background Confirmed downtrend regime
🟧 Orange background Volatility compression (squeeze forming)
⚫ Gray background Transitional / indecisive structure
Teal % (AOI Prob Long) Bullish probability > 60%
Arrows Optional: appear only when all gates align (rare, filtered signals)
🧮 Mathematical Notes
MACD-V = (EMA_fast(src) − EMA_slow(src)) / ATR(n)
Normalized score is smoothed, scaled 0–100 via logistic curve
Slope = Δ(EMA(src, n)) / ATR(n)
Probabilities gated by:
Minimum slope magnitude (minAbsSlope)
VWAP proximity (maxVWAPDistATR)
Multi-TF agreement
Cooldown interval (cooldownBars)
ATR-based risk gate
No repainting — all calculations use barstate.isconfirmed.
⚡ Use Cases
✅ Identify trend regime changes before major expansions
✅ Filter breakout vs. compression setups
✅ Quantify volatility conditions before entries
✅ Confirm multi-timeframe alignment
✅ Serve as a visual regime map for automated systems or discretionary traders
🧠 Recommended Presets
Market Type Setting Preset Behavior
Index Futures (ES/NQ) LBR 3-10-16 SMA (default) Classic swing/momentum balance
Scalping (1m–5m) Fast Adaptive Higher frequency, shorter cooldown
Swing Trading (1h–4h) Smooth ATR Broader, trend-only signals
Trend-Following Futures Wide ATR Bands Filters noise, favors strong continuation
⚠️ Notes
Non-repainting, bar-confirmed calculations
Signal arrows are optional and rare — intended for precision setups
ATR and slope thresholds should be tuned per instrument
Compatible with all TradingView markets and resolutions
🏁 Summary
“MACD-V Adaptive FluxPro” is not a simple MACD — it’s a volatility-normalized market state engine that adapts to changing conditions.
It fuses Linda Raschke’s timeless MACD logic with modern volatility, slope, and multi-timeframe analytics — giving you a live market dashboard that tells you when not to trade just as clearly as when you should.

PivotBoss Oscillator (PBOsc)PivotBoss Oscillator (PBOsc) – Description
The PivotBoss Oscillator (PBOsc) is a momentum-based indicator derived from the PivotBoss PEMA Method, designed to identify market bias, trend strength, and potential reversals across all timeframes and instruments.
Unlike traditional oscillators, PBOsc measures the differential among three pivot-based EMAs (fast, medium, and slow) relative to the pivot point (PP) of each bar, allowing it to self-adjust dynamically with current market volatility.
Calculation Logic
Pivot Point (PP):
𝑃
𝑃
=
(
𝐻
𝑖
𝑔
ℎ
+
𝐿
𝑜
𝑤
+
𝐶
𝑙
𝑜
𝑠
𝑒
)
/
3
PP=(High+Low+Close)/3
Pivot-Based EMAs:
Fast PEMA = EMA(PP, fast length)
Medium PEMA = EMA(PP, medium length)
Slow PEMA = EMA(PP, slow length)
Differentials:
Diff1 = Fast PEMA − Slow PEMA
Diff2 = Medium PEMA − Slow PEMA
Diff3 = Fast PEMA − Medium PEMA
Oscillator Value:
𝑃
𝐵
𝑂
𝑠
𝑐
=
(
𝐷
𝑖
𝑓
𝑓
1
+
𝐷
𝑖
𝑓
𝑓
2
+
𝐷
𝑖
𝑓
𝑓
3
)
/
𝑃
𝑃
PBOsc=(Diff1+Diff2+Diff3)/PP
Interpretation
Above Zero Line (0): Bullish bias; momentum favors the upside.
Below Zero Line (0): Bearish bias; momentum favors the downside.
Advancing Bars (Green): PBOsc rising → Strengthening trend or positive momentum.
Declining Bars (Red): PBOsc falling → Weakening trend or negative momentum.
Analytical Uses
Change of Bias: Detects short-term shifts in market sentiment.
Trending Markets: Measures pullbacks or continuations within ongoing trends.
Divergence: Divergence between price and PBOsc can signal potential reversals.
Default Settings
Default: (8, 13, 21)
Alternate Presets: (5, 8, 13), (13, 21, 34), (21, 34, 55)

Squeeze Weekday Frequency [CHE] Squeeze Weekday Frequency — Tracks historical frequency of low-volatility squeezes by weekday to inform timing of low-risk setups.
Summary
This indicator monitors periods of unusually low volatility, defined as when the average true range falls below a percentile threshold, and tallies their occurrences across each weekday. By aggregating these counts over the chart's history, it reveals patterns in squeeze frequency, helping traders avoid or target specific days for reduced noise. The approach uses persistent counters to ensure accurate daily tallies without duplicates, providing a robust view of weekday biases in volatility regimes.
Motivation: Why this design?
Traders often face inconsistent signal quality due to varying volatility patterns tied to the trading calendar, such as quieter mid-week sessions or busier Mondays. This indicator addresses that by binning low-volatility events into weekday buckets, allowing users to spot recurring low-activity days where trends may develop with less whipsaw. It focuses on historical aggregation rather than real-time alerts, emphasizing pattern recognition over prediction.
What’s different vs. standard approaches?
- Reference baseline: Traditional volatility trackers like simple moving averages of range or standalone Bollinger Band squeezes, which ignore temporal distribution.
- Architecture differences:
- Employs array-based persistent counters for each weekday to accumulate events without recounting.
- Includes duplicate prevention via day-key tracking to handle sparse data.
- Features on-demand sorting and conditional display modes for focused insights.
- Practical effect: Charts show a persistent table of ranked weekdays instead of transient plots, making it easier to glance at biases like higher squeezes on Fridays, which reduces the need for manual logging and highlights calendar-driven edges.
How it works (technical)
The indicator first computes the average true range over a specified lookback period to gauge recent volatility. It then ranks this value against its own history within a sliding window to identify squeezes when the rank drops below the threshold. Each bar's timestamp is resolved to a weekday using the selected timezone, and a unique day identifier is generated from the date components.
On detecting a squeeze and valid price data, it checks against a stored last-marked day for that weekday to avoid multiple counts per day. If it's a new occurrence, the corresponding weekday counter in an array increments. Total days and data-valid days are tracked separately for context.
At the chart's last bar, it sums all counters to compute shares, sorts weekdays by their squeeze proportions, and populates a table with the selected subset. The table alternates row colors and highlights the peak weekday. An info label above the final bar summarizes totals and the top day. Background shading applies a faint red to squeeze bars for visual confirmation. State persists via variable arrays initialized once, ensuring counts build incrementally without resets.
Parameter Guide
ATR Length — Sets the lookback for measuring average true range, influencing squeeze sensitivity to short-term swings. Default: 14. Trade-offs/Tips: Shorter values increase responsiveness but raise false positives in chop; longer smooths for stability, potentially missing early squeezes.
Percentile Window (bars) — Defines the history length for ranking the current ATR, balancing recent relevance with sample size. Default: 252. Trade-offs/Tips: Narrower windows adapt faster to regime shifts but amplify noise; wider ones stabilize ranks yet lag in fast markets—aim for 100-500 bars on daily charts.
Squeeze threshold (PR < x) — Determines the cutoff for low-volatility classification; lower values flag rarer, tighter squeezes. Default: 10.0. Trade-offs/Tips: Tighter thresholds (under 5) yield fewer but higher-quality signals, reducing clutter; looser (over 20) captures more events at the cost of relevance.
Timezone — Selects the reference for weekday assignment; exchange default aligns with asset's session. Default: Exchange. Trade-offs/Tips: Use custom for cross-market analysis, but verify alignment to avoid offset errors in global pairs.
Show — Toggles the results table visibility for quick on/off of the display. Default: true. Trade-offs/Tips: Disable in multi-indicator setups to save screen space; re-enable for periodic reviews.
Pos — Positions the table on the chart pane for optimal viewing. Default: Top Right. Trade-offs/Tips: Bottom options suit long-term charts; test placements to avoid overlapping price action.
Font — Adjusts text size in the table for readability at different zooms. Default: normal. Trade-offs/Tips: Smaller fonts fit more data but strain eyes on small screens; larger for presentations.
Dark — Applies a dark color scheme to the table for contrast against chart backgrounds. Default: true. Trade-offs/Tips: Toggle false for light themes; ensures legibility without manual recoloring.
Display — Filters table rows to show all, top three, or bottom three weekdays by squeeze share. Default: All. Trade-offs/Tips: Use "Top 3" for focus on high-frequency days in active trading; "All" for full audits.
Reading & Interpretation
Red-tinted backgrounds mark individual squeeze bars, indicating current low-volatility conditions. The table's summary row shows the highest squeeze count, its percentage of total events, and the associated weekday in teal. Detail rows list selected weekdays with their absolute counts, proportional shares, and a left arrow for the peak day—higher percentages signal days where squeezes cluster, suggesting potential for calmer trend development. The info label reports overall days observed, valid data days, and reiterates the top weekday with its count. Drifting counts toward zero on a weekday imply rarity, while elevated ones point to habitual low-activity sessions.
Practical Workflows & Combinations
- Trend following: Scan for squeezes on high-frequency weekdays as entry filters, confirming with higher highs or lower lows in the structure; pair with momentum oscillators to time breaks.
- Exits/Stops: On low-squeeze days, widen stops for breathing room, tightening them during peak squeeze periods to guard against false breaks—use the table's percentages as a regime proxy.
- Multi-asset/Multi-TF: Defaults work across forex and indices on hourly or daily frames; for stocks, adjust percentile window to 100 for shorter histories. Scale thresholds up by 5-10 points for high-vol assets like crypto to maintain signal sparsity.
Behavior, Constraints & Performance
- Repaint/confirmation: Counts update only on confirmed bars via day-key changes, with no future references—live bars may shade red tentatively but tallies finalize at session close.
- security()/HTF: Not used, so no higher-timeframe repaint risks; all computations stay in the chart's resolution.
- Resources: Relies on a fixed-size array of seven elements and small loops for sorting and table fills, capped at 5000 bars back—efficient for most charts but may slow on very long intraday histories.
- Known limits: Ignores weekends and holidays implicitly via data presence; early chart bars lack full percentile context, leading to initial undercounting; assumes continuous sessions, so gaps in data (e.g., news halts) skew totals.
Sensible Defaults & Quick Tuning
Start with the built-in values for broad-market daily charts: ATR at 14, window at 252, threshold at 10. For noisier environments, lower the threshold to 5 and shorten the window to 100 to prioritize rare squeezes. If too few events appear, raise the threshold to 15 and extend ATR to 20 for broader capture. To combat overcounting in sparse data, widen the window to 500 while keeping others stock—monitor the info label's data-days count before trusting patterns.
What this indicator is—and isn’t
This serves as a statistical overlay for spotting calendar-based volatility biases, aiding in session selection and filter design. It is not a standalone signal generator, predictive model, or risk manager—integrate it with price action, volume, and broader strategy rules for decisions.
Disclaimer
The content provided, including all code and materials, is strictly for educational and informational purposes only. It is not intended as, and should not be interpreted as, financial advice, a recommendation to buy or sell any financial instrument, or an offer of any financial product or service. All strategies, tools, and examples discussed are provided for illustrative purposes to demonstrate coding techniques and the functionality of Pine Script within a trading context.
Any results from strategies or tools provided are hypothetical, and past performance is not indicative of future results. Trading and investing involve high risk, including the potential loss of principal, and may not be suitable for all individuals. Before making any trading decisions, please consult with a qualified financial professional to understand the risks involved.
By using this script, you acknowledge and agree that any trading decisions are made solely at your discretion and risk.
Do not use this indicator on Heikin-Ashi, Renko, Kagi, Point-and-Figure, or Range charts, as these chart types can produce unrealistic results for signal markers and alerts.
Best regards and happy trading
Chervolino

PolyFilter [BackQuant]PolyFilter
A flexible, low-lag trend filter with three smoothing engines—optimized for clean bias, fewer whipsaws, and clear alerting.
What it does
PolyFilter draws a single “intelligent” baseline that adapts to price while suppressing noise. You choose the engine— Fractional MA , Ehlers 2-Pole Super Smoother , or a Multi-Kernel blend . The line can color itself by slope (trend) or by position vs price (above/below), and you get four ready-made alerts for flips and crosses.
What it plots
PolyFilter line — your smoothed trend baseline (width set by “Line Width”).
Optional candle & background coloring — choose: color by trend slope or by whether price is above/below the filter.
Signal markers — Arrows with L/S when the slope flips or when price crosses the line (if you enable shapes/alerts).
How the three engines differ
Fractional MA (experimental) — A power-law weighting of past bars (heavier focus on the most recent samples without throwing away history). The Adaptation Speed acts like the “fraction” exponent (default 0.618). Lower values lean more on recent bars; higher values spread weight further back.
Ehlers 2-Pole Super Smoother — Classic low-lag IIR smoother that aggressively reduces high-frequency noise while preserving turns. Great default when you want a steady, responsive baseline with minimal parameter fuss.
Multi-Kernel — A 70/30 blend of a Gaussian window and an exponential kernel. The Gaussian contributes smooth structure; the exponential adds a hint of responsiveness. Useful for assets that oscillate but still trend.
Reading the colors
Trend mode (default) — Line & candles turn green while the filter is rising (signal > signal ) and red while it’s falling.
Above/Below mode — Line & candles reflect price’s position relative to the filter: green when price > filter, red when price < filter. This is handy if you treat the filter like a dynamic “fair value” or bias line.
Inputs you’ll actually use
Calculation Settings
Price Source — Default HLC/3. Switch to Close for stricter trend, or HLC3/HL2 to soften single-print spikes.
Filter Length — Window/period for all engines. Shorter = snappier turns; longer = smoother line.
Adaptation Speed — Only affects Fractional MA . Lower it for faster, more local weighting; raise it for smoother, more global weighting.
Filter Type — Pick one of: Fractional MA, Ehlers 2-Pole, Multi-Kernel.
UI & Plotting
Color based off… — Choose Trend (slope) or > or < Close (position vs price).
Long/Short Colors — Customize bull/bear hues to your theme.
Show Filter Line / Paint candles / Color background — Visual toggles for the line, bars, and backdrop.
Line Width — Make the filter stand out (2–3 works well on most charts).
Signals & Alerts
PolyFilter Trend Up — Slope flips upward (the filter crosses above its prior value). Good for early continuation entries or stop-tightening on shorts.
PolyFilter Trend Down — Slope flips downward. Often used to scale out longs or rotate bias.
PolyFilter Above Price — The filter line crosses up through price (filter > price). This can confirm that mean has “caught up” after a pullback.
PolyFilter Below Price — The filter line crosses down through price (filter < price). Useful to confirm momentum loss on bounces.
Quick starts (suggested presets)
Intraday (5–15m, crypto or indices) — Ehlers 2-Pole, Length 55–80. Trend coloring ON, candle paint ON. Look for pullbacks to a rising filter; avoid fading a falling one.
Swing (1H–4H) — Multi-Kernel, Length 80–120. Background color OFF (cleaner), candle paint ON. Add a higher-TF confirmation (e.g., 4H filter rising when you trade 1H).
Range-prone FX — Fractional MA, Length 70–100, Adaptation ~0.55–0.70. Consider Above/Below mode to trade mean reversion to the line with a strict risk cap.
How to use it in practice
Bias line — Trade in the direction of the filter slope; stand aside when it flattens and color chops back and forth.
Dynamic support/resistance — Treat the line as a moving value area. In trends, entries often appear on shallow tags of the line with structure confluence.
Regime switch — When the filter flips and holds color for several bars, tighten stops on the opposing side and look for first pullback in the new color.
Stacking filters — Many users run PolyFilter on the active chart and a slower instance (longer length) on a higher timeframe as a “macro bias” guardrail.
Tuning tips
If you see too many flips, lengthen the filter or switch to Multi-Kernel.
If turns feel late, shorten the filter or try Ehlers 2-Pole for lower lag.
On thin or very noisy symbols, prefer HLC3 as the source and longer lengths.
Performance note: very large lengths increase computation time for the Multi-Kernel and Fractional engines. Start moderate and scale up only if needed.
Summary
PolyFilter gives you a single, trustworthy baseline that you can read at a glance—either as a pure trend line (slope coloring) or as a dynamic “above/below fair value” reference. Pick the engine that matches your market’s personality, set a sensible length, and let the color and alerts guide bias, entries on pullbacks, and risk on reversals.

Mig Trade Model - Kill Zones
Key features:
Liquidity Hunt Detection: Spots aggressive moves that "hunt" stops beyond recent swing highs/lows.
Consolidation Filter: Requires 1-3 small-range candles after a hunt before confirming with a strong candle.
Bias Application: Uses daily open/close to auto-detect bias or allows manual override.
Kill Zone Restriction: Limits signals to London (default: 7-10 AM UTC) and NY (default: 12-3 PM UTC) sessions for better relevance in active markets.
This strategy is inspired by smart money concepts (SMC) and ICT (Inner Circle Trader) methodologies, aiming to capture venom-like "stings" in price action where liquidity is grabbed before reversals.
How It Works
ATR Calculation: Uses a user-defined ATR length (default: 14) to measure volatility, which scales candle body and range thresholds.
Bias Determination:
Auto: Compares daily close to open (bullish if close > open).
Manual: User selects "Bullish" or "Bearish."
Strong Candles:
Bullish: Green candle with body > 2x ATR (configurable).
Bearish: Red candle with body > 2x ATR.
Small Range Candles:
Candles where high-low < 0.5x ATR (configurable).
Liquidity Hunt:
Bullish Hunt: Strong bearish candle making a new low below the past swing low (default: 10 bars).
Bearish Hunt: Strong bullish candle making a new high above the past swing high.
Signal Generation:
After a hunt, counts 1-3 small-range candles.
Confirms with a strong candle in the opposite direction (e.g., strong bullish after bearish hunt).
Resets if >3 small candles or an opposing strong candle appears.
Kill Zone Filter:
Checks if the current bar's time (in UTC) falls within London or NY Kill Zones.
Only allows final "Buy" (bullish entry) or "Sell" (bearish entry) if bias matches and in Kill Zone.
Plots:
Yellow circle (below): Bullish liquidity hunt.
Orange circle (above): Bearish liquidity hunt.
Blue diamond (below): Raw bullish signal.
Purple diamond (above): Raw bearish signal.
Green triangle up ("Buy"): Filtered bullish entry.
Red triangle down ("Sell"): Filtered bearish entry.
Inputs
Bias: "Auto" (default), "Bullish", or "Bearish" – Controls signal direction based on daily trend.
ATR Length: 14 (default) – Period for ATR calculation.
Swing Length for Liquidity Hunt: 10 (default) – Bars to look back for swing highs/lows.
Strong Candle Body Multiplier (x ATR): 2.0 (default) – Threshold for strong candle bodies.
Small Range Multiplier (x ATR): 0.5 (default) – Threshold for small-range candles.
London Kill Zone Start/End Hour (UTC): 7/10 (default) – Customize London session hours.
NY Kill Zone Start/End Hour (UTC): 12/15 (default) – Customize New York session hours.
Usage Tips
Timeframe: Best on lower timeframes (e.g., 5-15 min) for intraday trading, especially forex pairs like EURUSD or GBPUSD.
Timezone Adjustment: Inputs are in UTC. If your chart is in a different timezone (e.g., EST = UTC-5), adjust hours accordingly (e.g., London: 2-5 AM EST → 7-10 UTC).
Risk Management: Use with stop-loss (e.g., beyond the hunt low/high) and take-profit based on ATR multiples. Not financial advice—backtest thoroughly.
Customization: Tweak multipliers for different assets; higher for volatile cryptos, lower for stocks.
Limitations: Relies on historical data; may generate false signals in ranging markets. Combine with other indicators like volume or support/resistance.
This indicator is for educational purposes. Always use discretion and proper risk management in live trading. If you find it useful, feel free to share feedback or suggestions!

OB/OS adaptative v1.1# OB/OS Adaptative v1.1 - Multi-Timeframe Adaptive Overbought/Oversold Indicator
## Overview
The `tradingview_indicator_emas.pine` script is a sophisticated multi-timeframe indicator designed to identify dynamic overbought and oversold levels in financial markets. It combines EMA (Exponential Moving Average) crossovers and Bollinger Bands across monthly, weekly, and daily timeframes to create adaptive support and resistance levels that adjust to changing market conditions.
## Core Functionality
### Multi-Timeframe Analysis
The indicator analyzes three timeframes simultaneously:
- **Monthly (M)**: Long-term trend identification
- **Weekly (W)**: Intermediate-term trend identification
- **Daily (D)**: Short-term volatility measurement
### Technical Indicators Used
- **EMA 9 and EMA 20**: For trend identification and momentum assessment
- **Bollinger Bands (20-period)**: For volatility measurement and extreme level identification
- **Price action**: For confirmation of level validity and signal generation
## Key Features
### Adaptive Level Calculation
The indicator dynamically determines overbought and oversold levels based on market structure and trend bias:
#### Monthly Level Logic
- **Bullish Bias** (when monthly open > EMA20):
- Oversold = lower of EMA9 or EMA20
- Overbought = upper of EMA9 or Bollinger Upper Band
- **Bearish/Neutral Bias** (when monthly open ≤ EMA20):
- Oversold = Bollinger Lower Band
- Overbought = upper of EMA20 or EMA9
#### Weekly Level Logic
- **Bullish Bias** (when weekly open > EMA20):
- Oversold = lower of EMA9 or EMA20
- Overbought = Bollinger Upper Band
- **Bearish/Neutral Bias** (when weekly open ≤ EMA20):
- Oversold = Bollinger Lower Band
- Overbought = upper of EMA20 or EMA9
#### Daily Level Logic
- Simple Bollinger Bands:
- Oversold = Bollinger Lower Band
- Overbought = Bollinger Upper Band
### Final Level Determination
The indicator combines all three timeframes through a weighted averaging process:
1. Calculates initial values as the average of monthly, weekly, and daily levels
2. Ensures mathematical consistency by enforcing overbought_final ≥ oversold_final using min/max functions
3. Calculates a midpoint average level as the center of the range
### Visual Elements
- **Dynamic Lines**: Draws horizontal lines for current and previous period overbought, oversold, and average levels
- **Labels**: Places clear textual labels at the start of each period
- **Color Coding**:
- Red for overbought levels (resistance)
- Green for oversold levels (support)
- Blue for average levels (pivot point)
- **Transparency**: Previous period lines use semi-transparent colors to distinguish between current and historical levels
### Update Mechanism
- **Calculation Day**: User-defined day of the week (default: Monday)
- On the specified calculation day, the indicator:
- Updates all levels based on previous bar's data
- Draws new lines extending forward for a user-defined number of days
- Maintains previous period lines for comparison and trend analysis
- Automatically deletes and recreates lines to ensure clean visualization
### Proximity Detection
- Alerts when price approaches overbought/oversold levels (configurable distance in percentage)
- Helps identify potential reversal zones before actual crossovers occur
- Distance thresholds are user-configurable for both overbought and oversold conditions
### Alert Conditions
The indicator provides four distinct alert types:
1. **Cross below oversold**: Triggered when price crosses below the oversold level
2. **Cross above overbought**: Triggered when price crosses above the overbought level
3. **Near oversold**: Triggered when price approaches the oversold level within the configured distance
4. **Near overbought**: Triggered when price approaches the overbought level within the configured distance
### Debug Mode
When enabled, displays comprehensive debug information including:
- Current values for all levels (oversold, overbought, average)
- Timeframe-specific calculations and raw data points
- System status information (current day, calculation day, etc.)
- Lines existence and timing information
- Organized in multiple labels at different price levels to avoid overlap
## Configuration Parameters
| Parameter | Default Value | Description |
|---------|---------------|-------------|
| Short EMA (9) | 9 | Length for short-term EMA calculation |
| Long EMA (20) | 20 | Length for long-term EMA calculation |
| BB Length | 20 | Period for Bollinger Bands calculation |
| Std Dev | 2.0 | Standard deviation multiplier for Bollinger Bands |
| Distance to overbought (%) | 0.5 | Percentage threshold for "near overbought" alerts |
| Distance to oversold (%) | 0.5 | Percentage threshold for "near oversold" alerts |
| Calculation day | Monday | Day of week when levels are recalculated |
| Lookback days | 7 | Number of days to extend previous period lines backward |
| Forward days | 7 | Number of days to extend current period lines forward |
| Show Debug Labels | false | Toggle for comprehensive debug information display |
## Trading Applications
### Primary Use Cases
1. **Reversal Trading**: Identify potential reversal zones when price approaches overbought/oversold levels
2. **Trend Confirmation**: Use the adaptive nature of levels to confirm trend strength and direction
3. **Position Sizing**: Adjust position size based on distance from key levels
4. **Stop Placement**: Use opposite levels as dynamic stop-loss references
### Strategic Advantages
- **Adaptive Nature**: Levels adjust to changing market volatility and trend structure
- **Multi-Timeframe Confirmation**: Signals are validated across multiple timeframes
- **Visual Clarity**: Clear color-coded lines and labels enhance decision-making
- **Proactive Alerts**: "Near" conditions provide early warnings before crossovers
## Implementation Details
### Data Security
Uses `request.security()` function to fetch data from higher timeframes (monthly, weekly) while maintaining proper bar indexing with ` ` offset for open prices.
### Performance Optimization
- Uses `var` keyword to declare persistent variables that maintain state across bars
- Efficient line and label management with proper deletion before recreation
- Conditional execution of debug code to minimize performance impact
### Error Handling
- Comprehensive NA (not available) checks throughout the code
- Graceful degradation when data is unavailable for higher timeframes
- Mathematical safeguards to prevent invalid level calculations
## Conclusion
The OB/OS Adaptative v1.1 indicator represents a sophisticated approach to identifying market extremes by combining multiple technical analysis concepts. Its adaptive nature makes it particularly useful in trending markets where static levels may be less effective. The multi-timeframe approach provides a comprehensive view of market structure, while the visual elements and alert system enhance its practical utility for active traders.

HARSI PRO v2 - Advanced Adaptive Heikin-Ashi RSI OscillatorThis script is a fully re-engineered and enhanced version of the original Heikin-Ashi RSI Oscillator created by JayRogers. While it preserves the foundational concept and visual structure of the original indicatorusing Heikin-Ashi-style candles to represent RSI movementit introduces a range of institutional-grade engines and real-time analytics modules.
The core idea behind HARSI is to visualize the internal structure of RSI behavior using candle representations. This gives traders a clearer sense of trend continuity, exhaustion, and momentum inflection. In this upgraded version, the system is extended far beyond basic visualization into a comprehensive diagnostic and context-tracking tool.
Core Enhancements and Features
1. Heikin-Ashi RSI Candles
The base HARSI logic transforms RSI values into open, high, low, and close components, which are plotted as Heikin-Ashi-style candles. The open values are smoothed with a user-controlled bias setting, and the high/low are calculated from zero-centered RSI values.
2. Smoothed RSI Histogram and Plot
A secondary RSI plot and histogram are available for traditional RSI interpretation, optionally smoothed using a custom midpoint EMA process.
3. Dynamic Stochastic RSI Ribbon
The indicator optionally includes a smoothed Stochastic RSI ribbon with directional fill to highlight acceleration and reversal zones.
4. Real-Time Meta-State Engine
This engine determines the current market environmentneutral, breakout, or reversalbased on multiple adaptive conditions including volatility compression, momentum thrust, volume behavior, and composite reversal scoring.
5. Adaptive Overbought/Oversold Zone Engine
Instead of using fixed RSI thresholds, this engine dynamically adjusts OB/OS boundaries based on recent RSI range and normalized price volatility. This makes the OB/OS levels context-sensitive and more accurate across different instruments and regimes.
6. Composite Reversal Score Engine
A real-time score between 0 and 5 is generated using four components:
* OB/OS proximity (zone score)
* RSI slope behavior
* Volume state (burst or exhaustion)
* Trend continuation penalty based on position versus trend bias
This score allows for objective filtering of reversal zones and breakout traps.
7. Kalman Velocity Filter
A Kalman-style adaptive smoothing filter is applied to RSI for calculating velocity and acceleration. This allows for real-time detection of stalls and thrusts in RSI behavior.
8. Predictive Breakout Estimator
Uses ATR compression and RSI thrusting conditions to detect likely breakout environments. This logic contributes to the Meta-State Engine and the Breakout Risk dashboard metric.
9. Volume Acceleration Model
Real-time detection of volume bursts and fades based on VWMA baselines. Volume exhaustion warnings are used to qualify or disqualify reversals and breakouts.
10. Trend Bias and Regime Detection
Uses RSI slope, HARSI body impulse, and normalized ATR to classify the current trend state and directional bias. This forms the basis for filtering false reversals during strong trends.
11. Dashboard with Tooltips
A clean, table displays six key metrics in real time:
* Meta State
* Reversal Score
* Trend Bias
* Volume State
* Volatility Regime
* Breakout Risk
Each cell includes a descriptive tooltip explaining why the value is being shown based on internal state calculations.
How It Works Internally
* The system calculates a zero-centered RSI and builds candle structures using high, low, and smoothed open/close values.
* Volatility normalization is used throughout the script, including ATR-based thresholds and dynamic scaling of OB/OS zones.
* Momentum is filtered through smoothed slope calculations and HARSI body size measurements.
* Volume activity is compared against VWMA using configurable multipliers to detect institutional-level activity or exhaustion.
* Each regime detection module contributes to a centralized metaState classifier that determines whether the environment is conducive to reversal, breakout, or neutral action.
* All major signal and context values are continuously updated in a dashboard table with logic-driven color coding and tooltips.
Based On and Credits
This script is based on the original Heikin-Ashi RSI Oscillator by JayRogers . All visual elements from the original version, including candle plotting and color configurations, have been retained and extended. Significant backend enhancements were added by AresIQ for the 2025 release. The script remains open-source under the original attribution license. Credit to JayRogers is preserved and required for any derivative versions.

Volume pressure by GSK-VIZAG-AP-INDIA🔍 Volume Pressure by GSK-VIZAG-AP-INDIA
🧠 Overview
“Volume Pressure” is a multi-timeframe, real-time table-based volume analysis tool designed to give traders a clear and immediate view of buying and selling pressure across custom-selected timeframes. By breaking down buy volume, sell volume, total volume, and their percentages, this indicator helps traders identify demand/supply imbalances and volume momentum in the market.
🎯 Purpose / Trading Use Case
This indicator is ideal for intraday and short-term traders who want to:
Spot aggressive buying or selling activity
Track volume dynamics across multiple timeframes *1 min time frame will give best results*
Use volume pressure as a confirming tool alongside price action or trend-based systems
It helps determine when large buying/selling activity is occurring and whether such behavior is consistent across timeframes—a strong signal of institutional interest or volume-driven trend shifts.
🧩 Key Features & Logic
Real-Time Table Display: A clean, dynamic table showing:
Buy Volume
Sell Volume
Total Volume
Buy % of total volume
Sell % of total volume
Multi-Time frame Analysis: Supports 8 user-selectable custom time frames from 1 to 240 minutes, giving flexibility to analyze volume pressure at various granularities.
Color-Coded Volume Bias:
Green for dominant Buy pressure
Red for dominant Sell pressure
Yellow for Neutral
Intensity-based blinking for extreme values (over 70%)
Dynamic Data Calculation:
Uses volume * (close > open) logic to estimate buy vs sell volumes bar-by-bar, then aggregates by timeframe.
⚙️ User Inputs & Settings
Timeframe Selectors (TF1 to TF8): Choose any 8 timeframes you want to monitor volume pressure across.
Text & Color Settings:
Customize text colors for Buy, Sell, Total volumes
Choose Buy/Sell bias colors
Enable/disable blinking for visual emphasis on extremes
Table Appearance:
Set header color, metric background, and text size
Table positioning: top-right, bottom-right, etc.
Blinking Highlight Toggle: Enable this to visually highlight when Buy/Sell % exceeds 70%—a sign of strong pressure.
📊 Visual Elements Explained
The table has 6 rows and 10 columns:
Row 0: Headers for Today and TF1 to TF8
Rows 1–3: Absolute values (Buy Vol, Sell Vol, Total Vol)
Rows 4–5: Relative percentages (Buy %, Sell %), with dynamic background color
First column shows the metric names (e.g., “Buy Vol”)
Cells blink using alternate background colors if volume pressure crosses thresholds
💡 How to Use It Effectively
Use Buy/Sell % rows to confirm potential breakout trades or identify volume exhaustion zones
Look for multi-timeframe confluence: If 5 or more TFs show >70% Buy pressure, buyers are in control
Combine with price action (e.g., breakouts, reversals) to increase conviction
Suitable for equities, indices, futures, crypto, especially on lower timeframes (1m to 15m)
🏆 What Makes It Unique
Table-based MTF Volume Pressure Display: Most indicators only show volume as bars or histograms; this script summarizes and color-codes volume bias across timeframes in a tabular format.
Customization-friendly: Full control over colors, themes, and timeframes
Blinking Alerts: Rare visual feature to capture user attention during extreme pressure
Designed with performance and readability in mind—even for fast-paced scalping environments.
🚨 Alerts / Extras
While this script doesn’t include TradingView alert functions directly, the visual blinking serves as a strong real-time alert mechanism.
Future versions may include built-in alert conditions for buy/sell bias thresholds.
🔬 Technical Concepts Used
Volume Dissection using close > open logic (to estimate buyer vs seller pressure)
Simple aggregation of volume over custom timeframes
Table plotting using Pine Script table.new, table.cell
Dynamic color logic for bias identification
Custom blinking logic using na(bar_index % 2 == 0 ? colorA : colorB)
⚠️ Disclaimer
This indicator is a tool for analysis, not financial advice. Always backtest and validate strategies before using any indicator for live trading. Past performance is not indicative of future results. Use at your own risk and apply proper risk management.
✍️ Author & Signature
Indicator Name: Volume Pressure
Author: GSK-VIZAG-AP-INDIA
TradingView Username: prowelltraders

magic wand STSM"Magic Wand STSM" Strategy: Trend-Following with Dynamic Risk Management
Overview:
The "Magic Wand STSM" (Supertrend & SMA Momentum) is an automated trading strategy designed to identify and capitalize on sustained trends in the market. It combines a multi-timeframe Supertrend for trend direction and potential reversal signals, along with a 200-period Simple Moving Average (SMA) for overall market bias. A key feature of this strategy is its dynamic position sizing based on a user-defined risk percentage per trade, and a built-in daily and monthly profit/loss tracking system to manage overall exposure and prevent overtrading.
How it Works (Underlying Concepts):
Multi-Timeframe Trend Confirmation (Supertrend):
The strategy uses two Supertrend indicators: one on the current chart timeframe and another on a higher timeframe (e.g., if your chart is 5-minute, the higher timeframe Supertrend might be 15-minute).
Trend Identification: The Supertrend's direction output is crucial. A negative direction indicates a bearish trend (price below Supertrend), while a positive direction indicates a bullish trend (price above Supertrend).
Confirmation: A core principle is that trades are only considered when the Supertrend on both the current and the higher timeframe align in the same direction. This helps to filter out noise and focus on stronger, more confirmed trends. For example, for a long trade, both Supertrends must be indicating a bearish trend (price below Supertrend line, implying an uptrend context where price is expected to stay above/rebound from Supertrend). Similarly, for short trades, both must be indicating a bullish trend (price above Supertrend line, implying a downtrend context where price is expected to stay below/retest Supertrend).
Trend "Readiness": The strategy specifically looks for situations where the Supertrend has been stable for a few bars (checking barssince the last direction change).
Long-Term Market Bias (200 SMA):
A 200-period Simple Moving Average is plotted on the chart.
Filter: For long trades, the price must be above the 200 SMA, confirming an overall bullish bias. For short trades, the price must be below the 200 SMA, confirming an overall bearish bias. This acts as a macro filter, ensuring trades are taken in alignment with the broader market direction.
"Lowest/Highest Value" Pullback Entries:
The strategy employs custom functions (LowestValueAndBar, HighestValueAndBar) to identify specific price action within the recent trend:
For Long Entries: It looks for a "buy ready" condition where the price has found a recent lowest point within a specific number of bars since the Supertrend turned bearish (indicating an uptrend). This suggests a potential pullback or consolidation before continuation. The entry trigger is a close above the open of this identified lowest bar, and also above the current bar's open.
For Short Entries: It looks for a "sell ready" condition where the price has found a recent highest point within a specific number of bars since the Supertrend turned bullish (indicating a downtrend). This suggests a potential rally or consolidation before continuation downwards. The entry trigger is a close below the open of this identified highest bar, and also below the current bar's open.
Candle Confirmation: The strategy also incorporates a check on the candle type at the "lowest/highest value" bar (e.g., closevalue_b < openvalue_b for buy signals, meaning a bearish candle at the low, suggesting a potential reversal before a buy).
Risk Management and Position Sizing:
Dynamic Lot Sizing: The lotsvalue function calculates the appropriate position size based on your Your Equity input, the Risk to Reward ratio, and your risk percentage for your balance % input. This ensures that the capital risked per trade remains consistent as a percentage of your equity, regardless of the instrument's volatility or price. The stop loss distance is directly used in this calculation.
Fixed Risk Reward: All trades are entered with a predefined Risk to Reward ratio (default 2.0). This means for every unit of risk (stop loss distance), the target profit is rr times that distance.
Daily and Monthly Performance Monitoring:
The strategy tracks todaysWins, todaysLosses, and res (daily net result) in real-time.
A "daily profit target" is implemented (day_profit): If the daily net result is very favorable (e.g., res >= 4 with todaysLosses >= 2 or todaysWins + todaysLosses >= 8), the strategy may temporarily halt trading for the remainder of the session to "lock in" profits and prevent overtrading during volatile periods.
A "monthly stop-out" (monthly_trade) is implemented: If the lres (overall net result from all closed trades) falls below a certain threshold (e.g., -12), the strategy will stop trading for a set period (one week in this case) to protect capital during prolonged drawdowns.
Trade Execution:
Entry Triggers: Trades are entered when all buy/sell conditions (Supertrend alignment, SMA filter, "buy/sell situation" candle confirmation, and risk management checks) are met, and there are no open positions.
Stop Loss and Take Profit:
Stop Loss: The stop loss is dynamically placed at the upTrendValue for long trades and downTrendValue for short trades. These values are derived from the Supertrend indicator, which naturally adjusts to market volatility.
Take Profit: The take profit is calculated based on the entry price, the stop loss, and the Risk to Reward ratio (rr).
Position Locks: lock_long and lock_short variables prevent immediate re-entry into the same direction once a trade is initiated, or after a trend reversal based on Supertrend changes.
Visual Elements:
The 200 SMA is plotted in yellow.
Entry, Stop Loss, and Take Profit lines are plotted in white, red, and green respectively when a trade is active, with shaded areas between them to visually represent risk and reward.
Diamond shapes are plotted at the bottom of the chart (green for potential buy signals, red for potential sell signals) to visually indicate when the buy_sit or sell_sit conditions are met, along with other key filters.
A comprehensive trade statistics table is displayed on the chart, showing daily wins/losses, daily profit, total deals, and overall profit/loss.
A background color indicates the active trading session.
Ideal Usage:
This strategy is best applied to instruments with clear trends and sufficient liquidity. Users should carefully adjust the Your Equity, Risk to Reward, and risk percentage inputs to align with their individual risk tolerance and capital. Experimentation with different ATR Length and Factor values for the Supertrend might be beneficial depending on the asset and timeframe.

ZenAlgo - DominatorThis indicator provides a structured multi-ticker overview of market momentum and relative strength by analyzing short-term price behavior across selected assets in comparison with broader crypto dominance and Bitcoin/ETH performance.
Ticker and Market Data Handling
The script accepts up to 9 user-defined symbols (tickers) along with BTCUSD and ETHUSD. For each symbol:
It retrieves the current price.
It also requests the daily opening price from the "D" timeframe to compute intraday percentage change.
For BTC, ETH, and dominance (sum of BTC, USDT, and USDC dominance), daily change is calculated using this same method.
This comparison enables tracking relative performance from the daily open, which provides meaningful insight into intraday strength or weakness among different assets.
Dominance Logic
The indicator aggregates dominance data from BTC , USDT , and USDC using TradingView’s CRYPTOCAP indices. This combined dominance is used as a reference in directional and status calculations. ETH dominance is also analyzed independently.
Changes in dominance are used to infer whether market attention is shifting toward Bitcoin/stablecoins (typically indicating risk-off sentiment) or away from them (typically risk-on behavior, benefiting altcoins).
Price Direction Estimation
The script estimates directional bias using an EMA-based deviation technique:
A short EMA (user-defined lookback , default 4 bars) is calculated.
The current close is compared to the EMA to assess directional bias.
Recent candle changes are also inspected to confirm a consistent short-term trend (e.g., 3 consecutive higher closes for "up").
A small threshold is used to avoid classifying flat movements as trends.
This directionality logic is applied separately to:
The selected ticker's price
BTC price
Combined dominance
This allows the script to contextualize the movement of each asset within broader market conditions.
Market Status Evaluation
A custom function analyzes ETH and BTC dominance trends along with their relative strength to define the overall market regime:
Altseason is identified when BTC dominance is declining, ETH dominance rising, and ETH outperforms BTC.
BTC Season occurs when BTC dominance is rising, ETH dominance falling, and BTC outperforms ETH.
If neither condition is met, the state is Neutral .
This classification is shown alongside each ticker's row in the table and helps traders assess whether market conditions favor Bitcoin, Ethereum, or altcoins in general.
Ticker Status Classification
Each ticker is analyzed independently using the earlier directional logic. Its status is then determined as follows:
Full Bull : Ticker is trending up while dominance is declining or BTC is also rising.
Bullish : Ticker is trending up but not supported by broader bullish context.
Bearish : Ticker is trending down but without broader confirmation.
Full Bear : Ticker is trending down while dominance rises or BTC falls.
Neutral : No strong directional bias or conflicting context.
This classification reflects short-term momentum and macro alignment and is color-coded in the results table.
Table Display and Plotting
A configurable table is shown on the chart, which:
Displays the name and status of each selected ticker.
Optionally includes BTC, ETH, and market state.
Uses color-coding for intuitive interpretation.
Additionally, price changes from the daily open are plotted for each selected ticker, BTC, ETH, and combined dominance. These values are also labeled directly on the chart.
Labeling and UX Enhancements
Labels next to the current candle display price and percent change for each active ticker and for BTC, ETH, and combined dominance.
Labels update each bar, and old labels are deleted to avoid clutter.
Ticker names are dynamically shortened by stripping exchange prefixes.
How to Use This Indicator
This tool helps traders:
Spot early rotations between Bitcoin and altcoins.
Identify intraday momentum leaders or laggards.
Monitor which tickers align with or diverge from broader market trends.
Detect possible sentiment shifts based on dominance trends.
It is best used on lower to mid timeframes (15m–4h) to capture intraday to short-term shifts. Users should cross-reference with longer-term trend tools or structural indicators when making directional decisions.
Interpretation of Values
% Change : Measures intraday move from daily open. Strong positive/negative values may indicate breakouts or reversals.
Status : Describes directional strength relative to market conditions.
Market State : Gives a general bias toward BTC dominance, ETH strength, or altcoin momentum.
Limitations & Considerations
The indicator does not analyze liquidity or volume directly.
All logic is based on short-term movements and may produce false signals in ranging or low-volume environments.
Dominance calculations rely on external CRYPTOCAP indices, which may differ from exchange-specific flows.
Added Value Over Other Free Tools
Unlike basic % change tables or price overlays, this indicator:
Integrates dominance-based macro context into ticker evaluation.
Dynamically classifies market regimes (BTC season / Altseason).
Uses multi-factor logic to determine ticker bias, avoiding single-metric interpretation.
Displays consolidated information in a table and chart overlays for rapid assessment.

Fibonacci - RSI OscillatorIndicator Overview
The Fibonacci RSI Oscillator calculates the Relative Strength Index (RSI) based on a dynamically adjusting level derived from recent price action and a fixed Fibonacci ratio (0.236). This differs from standard RSI, which is calculated directly on the closing price. The objective is to measure momentum relative to a level that adapts to recent peaks and valleys.
Core Calculation Mechanism
Peak/Valley Tracking: The script identifies the highest high (state_peak) and lowest low (state_valley) since the last detected change in short-term directional bias (state_dir).
Dynamic Level Calculation: A level (state_dyn_level) is calculated using a fixed 0.236 Fibonacci ratio relative to the tracked peak and valley:
If bias is up: state_dyn_level = state_peak - (state_peak - state_valley) * 0.236
If bias is down: state_dyn_level = state_valley + (state_peak - state_valley) * 0.236
This level adjusts automatically when a new peak or valley is established in the current directional bias. If price crosses the dynamic level against the current bias, the bias flips, and the level recalculates.
Optional Source Smoothing: The calculated state_dyn_level can optionally be smoothed using a user-selected moving average (SMA, EMA, WMA, HMA, RMA) before the RSI calculation.
RSI Calculation: The standard RSI formula is applied to the (optionally smoothed) state_dyn_level series to produce the primary oscillator value (val_primary_osc).
Signal Line: A moving average (type and length configurable) is calculated on the val_primary_osc to generate the val_sig_line.
Key Features & Components
Dynamic Fibonacci Level: The core input for the RSI calculation, based on recent peaks/valleys and the 0.236 ratio.
Fibonacci Level RSI: The primary oscillator line representing the RSI of the dynamic level.
Signal Line: A moving average of the primary RSI line.
Overbought/Oversold Levels: User-defined threshold lines.
Optional Source Smoothing: Configurable MA smoothing applied to the dynamic level before RSI calculation.
Gradient RSI Color : Option to color the primary RSI line based on its value relative to OB/Mid/OS levels.
Zone & OB/OS Fills: Visual fills for the 0-50 / 50-100 zones and specific fills when the RSI enters OB/OS territory.
Background Gradient: Optional vertical background color gradient based on the RSI's position between 0 and 100.
Configurable Parameters: Inputs for lengths, MA types, OB/OS levels, colors, line widths, and feature toggles.
Visual Elements Explained
Fibonacci Level RSI Line: The main plotted oscillator (color/gradient/width configurable).
Signal Line: The moving average of the RSI line (color/width/MA type configurable).
OB/OS Lines: Horizontal lines plotted at the set OB/OS levels (color/width configurable).
Mid-Line (50): Horizontal line plotted at 50 (color/width configurable).
Zone Fills:
Background fill between 0-50 and 50-100 (colors configurable).
Conditional fill between the RSI line and the 50 line when RSI > OB level or RSI < OS level (colors configurable).
Background Gradient: Optional background coloring where transparency varies vertically with the RSI level (base colors and transparency range configurable).
Configuration Options
Users can adjust the following parameters in the indicator settings:
Smoothing: Enable/disable dynamic level smoothing; set length and MA type.
RSI: Set the RSI calculation length.
Signal Line: Set the signal line smoothing length and MA type.
Levels: Define Overbought and Oversold numeric thresholds.
Visuals: Configure colors and widths for the RSI line, signal line, OB/OS lines, mid-line, zone fills, and OB/OS fills.
Gradients: Enable/disable and configure colors for the RSI line gradient; enable/disable and configure colors/transparency for the background gradient.
Interpretation Notes
The oscillator reflects the momentum of the dynamic Fibonacci level, not directly the price. Divergences, OB/OS readings, and signal line crossovers should be interpreted in this context.
The behavior may differ from standard RSI, potentially offering a smoother output or highlighting different momentum patterns depending on market structure and volatility.
As with any indicator, signals should be used in conjunction with other analysis methods and risk management practices. It is not designed as a standalone trading system.
Risk Disclaimer:
Trading involves significant risk. This indicator is provided for analytical purposes only and does not constitute financial advice. Past performance is not indicative of future results. Use sound risk management practices and never trade with capital you cannot afford to lose.

Scalper's Fractal Cloud with RSI + VWAP + MACD (Fixed)Scalper’s Fractal Confluence Dashboard
1. Purpose of the Indicator
This TradingView indicator script provides a high-confluence setup for scalping and day trading. It blends momentum indicators (RSI, MACD), trend bias tools (EMA Cloud, VWAP), and structure (fractal swings, gap zones) to help confirm precise entries and exits.
2. Components of the Indicator
- EMA Cloud (50 & 200 EMA): Trend bias – green means bullish, red means bearish. Avoid longs under red cloud.
- VWAP: Institutional volume anchor. Ideal entries are pullbacks to VWAP in direction of trend.
- Gap Zones: Shows open-air zones (white space) where price can move fast. Used to anticipate momentum moves.
- ZigZag Swings: Marks structural pivots (highs/lows) – useful for stop placement and range anticipation.
- MACD Histogram: Shows bullish or bearish momentum via background color.
- RSI: Overbought (>70) or oversold (<30) warnings. Good for exits or countertrend reversion plays.
- EMA Spread Label: Quick view of momentum strength. Wide spread = strong trend.
3. Scalping Entry Checklist
Before entering a trade, confirm these conditions:
• • Bias: EMA cloud color supports trade direction
• • Price is above/below VWAP (confirming institutional flow)
• • MACD histogram matches direction (green for long, red for short)
• • RSI not at extreme (unless you’re fading trend)
• • If entering gap zone, expect fast move
• • Recent swing high/low nearby for target or stop
4. Risk & Sizing Guidelines
Risk 1–2% of account per trade. Place stop below recent swing low (for longs) or high (for shorts). Use fractional sizing near VWAP or white space zones for scalping reversals.
5. Daily Trade Journal Template
- Date:
- Ticker:
- Setup Type (VWAP pullback, Gap Break, EMA reversion):
- Entry Time:
- Bias (Green/Red Cloud):
- RSI Level / MACD Reading:
- Stop Loss:
- Target:
- Result (P/L):
- What I Did Well:
- What Needs Work:

Ryna 3 EMA Multi-Timeframe Indicator**EMA Multi-Timeframe Strategy (Pine Script v6)**
This TradingView indicator is designed to assist traders using a **multi-timeframe trend-following strategy** based on Exponential Moving Averages (EMAs).
**Core Functionality**
- **Trend Identification:**
Uses a configurable **EMA (e.g., EMA 50)** on a **higher timeframe** (e.g., H1, D1, W1) to determine the market bias:
- If price is **above** the trend EMA → **Long bias**
- If price is **below** the trend EMA → **Short bias**
- **Entry Signals:**
Uses two EMAs (fast & slow, e.g., EMA 8 & EMA 21) on either:
- The **current chart timeframe**, or
- A **separately selected timeframe** (e.g., entry on M15, trend on H1)
→ Signals are generated based on **EMA crossovers**:
- **Bullish crossover** (fast crosses above slow) → Long signal
- **Bearish crossover** (fast crosses below slow) → Short signal
- Only when aligned with the higher-timeframe trend
- **Visual Output:**
- Optional display of entry EMAs when sourced from the trend timeframe
- Always displays the trend EMA
- Entry signals shown with triangle markers on the chart
- **Info Panel (Top Center):**
- Shows selected timeframes and EMA settings
- Indicates current trend bias (LONG / SHORT / NEUTRAL)
- Notes if entry EMAs are hidden due to settings
- **Alerts:**
- Optional alerts for long and short entry signals based on EMA crossovers
#### **User Inputs**
- **Trend Timeframe & EMA Length**
- **Entry Timeframe & EMA Fast/Slow Lengths**
- **Option to show/hide entry EMAs when using the trend timeframe**
- **Option to show/hide Infobox on Chart**
Previous Day LevelsThis indicator plots the previous day's high, low, and 50% levels, providing a framework for analyzing price behavior relative to these key levels.
Full Description:
The Previous Day Levels indicator is a tool designed to help traders analyze price action based on key levels from the previous trading session. By plotting the high, low, and mid-point (50%) of the prior day’s range, traders can assess potential market bias and directional tendencies for the current trading day.
Key Features:
Plots the previous day’s high (100%), low (0%), and intermediate levels (25%, 50%, 75%).
Allows users to customize line visibility, color, style, and width.
Helps traders identify potential support and resistance zones.
Provides a bias framework for determining whether price is more likely to target the previous high or low based on behavior around the 50% level.
Use Case:
This indicator is particularly useful for intraday and short-term traders who incorporate price action into their strategy.
If price trades above the 50% level and holds, it suggests a bullish bias, indicating that price may aim for the previous day's high.
If price trades below the 50% level and holds, it suggests a bearish bias, indicating that price may aim for the previous day's low.
The high and low levels can act as key support and resistance zones, where price may react or reverse.
How to Use:
Apply the indicator to your chart.
Observe how price interacts with the 50% level.
Use price behavior around these levels to establish a directional bias.
Adjust the line styles and colors to match your personal preference.
Disclaimer:
This indicator is a tool for market analysis and does not provide financial advice. Always perform your own analysis and risk management when trading.
Trading Sessions Highs/Lows | InvrsROBINHOODTrading Sessions Highs/Lows | InvrsROBINHOOD
🚀 A powerful indicator for tracking key trading sessions and the highs and lows of each session!
📌 Description
The Trading Sessions Highs/Lows indicator visually marks the most critical trading sessions—Asia, London, and New York—using small colored dots at the bottom of the candle. It also tracks and plots the highs and lows of each session, along with the Daily Open and Weekly Open levels.
This tool is designed to help traders identify session-based liquidity zones, price reactions, and potential trade setups with minimal chart clutter.
Key Features:
✅ Session markers (Asia, London, NY AM, NY Lunch, NY PM) plotted as small dots
✅ Plots session highs and lows for market structure insights
✅ Daily Open line for intraday reference
✅ Weekly Open line for higher timeframe bias
✅ Alerts for session high/low breaks to capture momentum shifts
✅ User-defined UTC offset for global traders
✅ Customizable session colors for personal preference
📖 How to Use the Indicator
1️⃣ Understanding the Sessions
Asia Session (Yellow Dot) → Marks liquidity buildup & pre-London moves
London Session (Blue Dot) → Strong volatility, breakout opportunities
New York AM Session (Green Dot) → Major trends & institutional participation
New York Lunch (Red Dot) → Low volume, ranging market
New York PM Session (Dark Green Dot) → End-of-day movements & reversals
2️⃣ Session Highs & Lows for Market Structure
Session Highs can act as resistance or breakout points.
Session Lows can act as support or stop-hunt zones.
Break of a session high/low with volume may indicate continuation or reversal.
3️⃣ Using the Daily & Weekly Open
The Daily Open (Black Line) helps gauge the intraday trend.
Above Daily Open → Bearish Bias
Below Daily Open → Bullish Bias
The Weekly Open (Red Line) sets the higher timeframe directional bias.
4️⃣ Alerts for Breakouts
The indicator will trigger alerts when price breaks session highs or lows.
Useful for setting stop-losses, breakout trades, and risk management.
💡 Why This Indicator is Important for Beginners
1️⃣ Avoids Overtrading:
Many beginners trade in low-volume periods (NY Lunch, Asia session) and get stuck in choppy price action.
This indicator highlights when volatility is high so traders focus on better opportunities.
2️⃣ Session-Based Liquidity Traps:
Market makers often run stops at session highs/lows before reversing.
Watching session breaks prevents traders from falling into liquidity grabs.
3️⃣ Reduces Emotional Trading:
If price is above the Daily Open, a beginner shouldn’t look for shorts.
If price is below a key session low, it may signal a fake breakout.
4️⃣ Aligns with Institutional Trading:
Smart money traders use session highs/lows to set stop hunts & reversals.
Beginners can use this indicator to spot these zones before entering trades.
🛡️ How to Mitigate Risk with This Indicator
✅ Wait for Confirmations – Don’t trade blindly at session highs/lows. Look for wicks, rejections, or break/retests.
✅ Use Stop-Loss Above/Below Session Levels – If you’re going long, set SL below a session low. If short, set SL above a session high.
✅ Watch Volume & News Events – Breakouts without strong volume or news may be fake moves.
✅ Combine with Other Strategies – Use price action, trendlines, or EMAs with this indicator for higher probability trades.
✅ Use the Weekly Open for Trend Bias – If price stays below the Weekly Open, avoid bullish setups unless key support holds.
🎯 Who is This Indicator For?
📌 Beginners who need clear session-based trading levels.
📌 Day traders & scalpers looking to refine their intraday setups.
📌 Smart money traders using liquidity concepts.
📌 Swing traders tracking higher timeframe momentum shifts.
🚀 Final Thoughts
This indicator is an essential tool for traders who want to understand market structure, liquidity, and volatility cycles. Whether you’re trading forex, stocks, or crypto, it helps you stay on the right side of the market and avoid unnecessary risks.
🔹 Set it up, customize your colors, define your UTC offset, and start trading smarter today! 🏆📈

Opening ScoreOverview:
The Composite Open Strategy Indicator is designed to provide traders with a unified, early-session directional bias by aggregating multiple non-correlated signals. By combining diverse analytical methods—spanning price action, volume, volatility, and time—the indicator helps you gauge whether the market is leaning bullish or bearish during the critical opening hours.
How It Works:
• Open Range Breakout (ORB) Signal:
The indicator captures the opening range (defined up to a user-specified time, e.g., 9:45 AM ET) and assigns a bullish signal when the price breaks above the high of that range, and a bearish signal when it drops below the low.
• VWAP Signal:
It compares the current price to the Volume Weighted Average Price (VWAP). A price above VWAP suggests buying pressure, while below indicates selling pressure.
• Trend Signal:
Using a simple moving average (with an adjustable period, typically around 20 bars), the indicator determines the prevailing trend. Price above the MA contributes a bullish bias, and price below contributes a bearish bias.
• Volatility Signal:
A volatility filter is applied via the Average True Range (ATR). An increasing ATR relative to the previous bar suggests rising volatility (bullish if combined with upward moves), whereas a decreasing ATR indicates the opposite.
Each of these four signals is assigned an equal weight (modifiable as needed), and their sum forms the composite score.
Display and Timing:
• Separate Panel:
The composite score is plotted as a histogram in its own indicator panel, ensuring your main price chart remains uncluttered.
• Session Filter:
The indicator is active only during the early session—from 9:30 AM to 12:30 PM Eastern Time—when the initial directional move is most relevant. Outside this time window, the indicator remains inactive.
Trading Insights:
• A positive composite score suggests a bullish bias, indicating that the aggregated signals lean toward an upward trend.
• A negative composite score points to a bearish bias, indicating a downward directional outlook.
Usage:
Ideal for traders looking to capture the market’s early trend direction, this indicator can be used as part of a broader strategy. Its design encourages consistency by combining multiple perspectives (price, volume, volatility, time) into one clear signal, allowing you to focus on setups that align with the dominant early-session move.
Before fully automating your trading approach, you can test and refine this composite method on TradingView using the built-in manual review process. Once confident in its performance, further automation can help integrate this directional bias seamlessly into your overall trading strategy.

Professional GBP/JPY Analysis ToolThe foundation of professional trading begins with analyzing individual currencies first, not just currency pairs. By understanding the relative strength of each currency in the pair, traders can anticipate potential market moves with greater accuracy.
This indicator simplifies that process by:
Analyzing Individual Currency Strength:
The strength of GBP is calculated by averaging its performance across seven major GBP currency pairs:
GBP/EUR
GBP/USD
GBP/CAD
GBP/CHF
GBP/AUD
GBP/NZD
GBP/JPY
The strength of JPY is calculated by averaging its performance across seven major JPY currency pairs:
JPY/USD
JPY/CAD
JPY/EUR
JPY/GBP
JPY/AUD
JPY/NZD
JPY/CHF
The values are normalized to allow direct comparison on the same scale.
Identifying Correlation Between GBP and JPY:
The histogram displays the correlation between GBP and JPY strength:
Positive Correlation (Green): Both GBP and JPY are trending up or down together, indicating a less strong trend. This is a market condition to avoid, as both currencies are strengthening or weakening simultaneously.
Negative Correlation (Red): One currency is strong while the other is weak, indicating a stronger trend in GBP/JPY. This scenario presents a better trading opportunity, as you are trading one strong currency against one weak currency, amplifying the potential for a clearer price movement in GBP/JPY.
Visualizing Long/Short Bias:
GBP Strength > JPY Strength: Bullish bias for GBP/JPY (green background).
JPY Strength > GBP Strength: Bearish bias for GBP/JPY (red background).
This indicator equips traders with a deeper understanding of GBP/JPY dynamics by first breaking down the individual currencies. With insights into currency strength, their correlation, and the optimal conditions for trading, it provides a solid foundation for making informed trading decisions.
How to Use:
Check the Histogram for Correlation:
Wait for the histogram to be red. This indicates that GBP and JPY are moving in opposite directions, signaling a stronger trend where you're trading a strong currency against a weak one—a more favorable setup.
Align with Background Color for Confirmation:
Wait for the background color to match your trade plan:
Green Background: Confirms a bullish bias, supporting long positions on the GBP/JPY pair.
Red Background: Confirms a bearish bias, supporting short positions on the GBP/JPY pair.
By following these steps, you can identify stronger trade opportunities and align them with your strategy.

Bearish vs Bullish ArgumentsThe Bearish vs Bullish Arguments Indicator is a tool designed to help traders visually assess and compare the number of bullish and bearish arguments based on their custom inputs. This script enables users to input up to five bullish and five bearish arguments, dynamically displaying the bias on a clean and customizable table on the chart. This provides traders with a clear, visual representation of the market sentiment they have identified.
Key Features:
Customizable Inputs: Users can input up to five bullish and five bearish arguments, which are displayed in a table on the chart.
Bias Calculation: The script calculates the bias (Bullish, Bearish, or Neutral) based on the number of bullish and bearish arguments provided.
Color Customization: Users can customize the colors for the table background, text, and headers, ensuring the table fits seamlessly into their charting environment.
Reset Functionality: A reset switch allows users to clear all input arguments with a single click, making it easy to start fresh.
How It Works:
Input Fields: The script provides input fields for up to five bullish and five bearish arguments. Each input is a simple text field where users can describe their arguments.
Bias Calculation: The script counts the number of non-empty bullish and bearish arguments and determines the overall bias. The bias is displayed in the table with a dynamically changing color to indicate whether the market sentiment is bullish, bearish, or neutral.
Customizable Table: The table is positioned on the chart according to the user's preference (top-left, top-right, bottom-left, bottom-right) and can be customized in terms of background color and text color.
How to Use:
Add the Indicator: Add the Bearish vs Bullish Arguments Indicator to your chart.
Input Arguments: Enter up to five bullish and five bearish arguments in the provided input fields in the script settings.
Customize Appearance: Adjust the table's background color, text color, and position on the chart to fit your preferences.
Example Use Case:
A trader might use this indicator to visually balance their arguments for and against a particular trade setup. By entering their reasons for a bullish outlook in the bullish argument fields and their reasons for a bearish outlook in the bearish argument fields, they can quickly see which side has more supporting points and make a more informed trading decision.
This script was inspired by Arjoio's concepts

Papercuts Recency CandlesPapercuts Recency Candles
V0.8 by Joel Eckert @PapercutsTrading
***This is currently an experimental visual exploratory concept.***
*** Experimental tools should only be explored by fellow coders and experienced traders.***
DESCRIPTION:
As coders, how can we seamlessly transition between actual and smoothed price data sets as data ages?
This is a visual experiment to see if and how data can be smoothly transitioned from one value to another over a set number of candles. If we visualize a chart in 3 zones, a head, a body, and a tail we can start to understand how this could work. The head zone would represent the first data set of actual asset prices. The body zone would represent the transition period from the first to the to the second data set. Last, the tail zone would represent the second data set made of a Hull Moving Average of the asset.
CONCEPT:
It is conceived that data and position precision constantly shift as they decay or age, therefore making older price levels act more like price regions or zones vs exact price points. This is what I am calling Recency.
This indicator utilizes the concept of "Recency" to explore the possibility of a new style of candle. It aims to maintain accurately on recent prices action but loosen up accuracy on older price action. The very nature of this requires ALTERING HISTORICAL DATA within the body zone or transition candles to achieve the effect. It is similar to trying to merge a line chart type with a candle chart type.
This experiment of using recency for candles was to create candles that stay more accurate near current price but fade away into a simple line as they age out, resulting in a simplified view of the big picture which consists of older price action.
This experimental design theoretically will help you stay focused only on what is currently unfolding and to minimize distractions from older price nuances.
USAGE:
WHO:
This is not recommended for new traders or novices that are unfamiliar with standard tools. Standardized tools should always be used to get grounded and build a foundation.
Active traders who are familiar with trading comfortably should experiment with this to see if they find it interesting or usable.
Pine coders may find this concept interesting enough, and may adapt the idea to other elements of their own scripts if they find it interesting… I just ask they give credit where credit is due.
HOW:
The best way to visualize how this works is to do the following:
Load it on a chart.
Turn off Standard candles in Chart Setting of the current window. I actually just turn off the bodies and borders, and dim the old wicks as I like the way the old wicks look when left alone with these new candles.
Enable chart replay at a faster speed, like 3x, and play back the chart to watch the behavior of the candles.
You’ll be able to see how the head of the candle type preserves OHLC, and indicates direction but as the candle starts to age it progressively flowers into the HMA
While it plays back try adjusting settings to see how they affect behavior.
You can see the data average in real-time which often reveals how unstable actual price noise really is.
The head candle diagonals indicate the candle body direction.
SETTINGS:
Coloring: You can choose your own bullish or bearish colors to match your scheme.
Price Line: The price line is colored according to the trend and
Head Length: These candles are true to the source high and low. They remain slightly brighter than transition candles. We have a max of 50 to keep things responsive.
Time Decay Length: This is the amount of candles it takes to transition to the tail. Max is 300 to keep things responsive.
Decay Continuity: This forces transition candles to complete the HMA curve instead of creating gaps when conforming to it. The best way to visualize this feature is to run a 3x replay of an asset, and toggle the result on and off. On is preferred.
Tail HMA Length: This is the smoothing amount for the resulting HMA stepline that calculates every close, but has a delayed draw until after the transition candles. You can optionally turn off the delayed visibility to help with comprehension.
Tail HMA Weight: This is simply an option to make the tail thicker or thinner. This also adjusts the border on the head candles to help them stand out.
Show Side Bias Dots: Default true: Draws a dot when bias to one side changes to help keep you on the right side of trade. Side bias is simply the alignment of 3 moving averages in one direction.
IMPORTANT NOTES:
You'll have to turn off or dim the standard candles in your view "Chart Settings" to see this properly.
Be aware that since the candles are based on boxes and utilize the “recency concept”, which means their data decays and changes as it ages. This results in a cleaner chart overall, but exact highs and lows will be averaged out as the data decays, forming a Hull Moving Average stepline of your defined length once decay has finished.
SUMMARY OF HOW IT WORKS:
First it takes candle information and creates unique boxes that represent each candle based on the high and low. It utilizes boxes because standard candles once written, cannot be later altered or removed… which is a key element for this effect to work.
Next it creates a second box and line from open to close for the body of the Head candles. This indicates direction at a glance.
As candles age beyond the defined distance of the “Head” they enter the "Body" aka "Time Decay" zone. Here the accuracy of the high and low will be averaged down using an incremental factor of the HMA, defined by "Time Decay Length" amount of candles.
The resulting tail is an HMA of Tail HMA Length. This tail is always calculate at close, but is not drawn instantly. The draw is delayed so that there is not overlapping data, and this makes the effect look more elegant.
There are also two EMAs within the script that do nothing but help candle coloring and help provide a trade side bias. When both EMA's and the HMA align, a side bias is defined. Only when the side bias changes will a new dot is formed.
Head candles have been simplified from previous versions to be easier to read at a a glance.
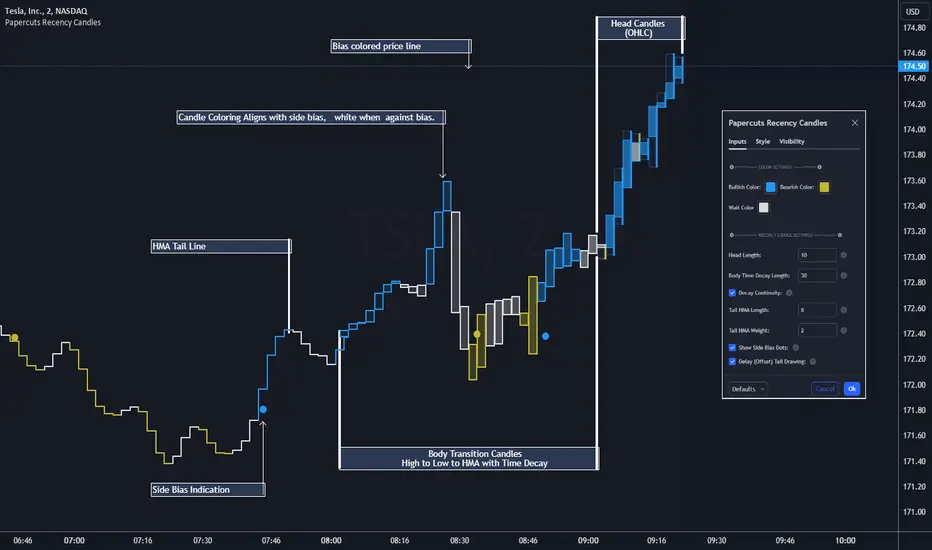
ATR Based EMA Price Targets [SS]As requested...
This is a spinoff of my EMA 9/21 cross indicator with price targets.
A few of you asked for a simple EMA crossover version and that is what this is.
I have, of course, added a bit of extra functionality to it, assuming you would want to transition from another EMA indicator to this one, I tried to leave it somewhat customizable so you can get the same type of functionality as any other EMA based indicator just with the added advantage of having an ATR based assessment added on. So lets get into the details:
What it does:
Same as my EMA 9/21, simply performs a basic ATR range analysis on a ticker, calculating the average move it does on a bullish or bearish cross.
How to use it:
So there are quite a few functions of this indicator. I am going to break them down one by one, from most basic to the more complex.
Plot functions:
EMA is Customizable: The EMA is customizable. If you want the 200, 100, 50, 31, 9, whatever you want, you just have to add the desired EMA timeframe in the settings menu.
Standard Deviation Bands are an option: If you like to have standard deviation bands added to your EMA's, you can select to show the standard deviation band. It will plot the standard deviation for the desired EMA timeframe (so if it is the EMA 200, it will plot the Standard Deviation on the EMA 200).
Plotting Crossovers: You can have the indicator plot green arrows for bullish crosses and red arrows for bearish crosses. I have smoothed out this function slightly by only having it signal a crossover when it breaks and holds. I pulled this over to the alert condition functions as well, so you are not constantly being alerted when it is bouncing over and below an EMA. Only once it chooses a direction, holds and moves up or down, will it alert to a true crossover.
Plotting labels: The indicator will default to plotting the price target labels and the EMA label. You can toggle these on and off in the EMA settings menu.
Trend Assessment Settings:
In addition to plotting the EMA itself and signaling the ATR ranges, the EMA will provide you will demographic information about the trend and price action behaviour around the EMA. You can see an example in the image below:
This will provide you with a breakdown of the statistics on the EMA over the designated lookback period, such as the number of crosses, the time above and below the EMA and the amount the EMA has remained within its standard deviation bands.
Where this is important is the proportion assessment. And what the proportion assessment is doing is its measuring the amount of time the ticker is spending either above or below the EMA.
Ideally, you should have relatively equal and uniform durations above and below. This would be a proportion of between 0.5 and 1.5 Above to Below. Now, you don't have to remember this because you can ask the indicator to do the assessment for you. It will be displayed at the bottom of your chart in a table that you can toggle on and off:
Example of a Uniform Assessment:
Example of a biased assessment:
Keep in mind, if you are using those very laggy EMAs (like the 50, 200, 100 etc.) on the daily timeframe, you aren't going to get uniformity in the data. This is because, stocks are technically already biased to the upside over time. Thus, when you are looking at the big picture, the bull bias thesis of the stock market is in play.
But for the smaller and moderate timeframes, owning to the randomness of price action, you can generally get uniformity in data representation by simply adjusting your lookback period.
To adjust your lookback period, you simply need to change the timeframe for the ATR lookback length. I suggest no less than 500 and probably no more than 1,500 candles, and work within this range. But you can use what the indicator indicates is appropriate.
Of course, all of these charts can be turned off and you are left with a clean looking EMA indicator:
And an example with the standard deviation bands toggled on:
And that, my friends, is the indicator.
Hopefully this is what you wanted, let me know if you have any suggestions.
Enjoy and safe trades!