Separated ATR - evoThis script plots two ATR (Average True Range) values, one based on only bullish and the other based on only bearish bars. If the current bar is positive, the negative ATR will use its last known negative bar for the calculation. You can smooth bar directions by using the Heikin Ashi setting.
Use this the same way how you would use the regular ATR indicator, but with the added value of knowing which side of the market has more volatility.
"bear" için komut dosyalarını ara


TMMS OscillatorThe TMMS oscillator (aka “Trading Made More Simpler”) is an indicator made of conditions based on both 2 separated Stochastic and 1 RSI.
Bullish zone is green and bearish one is red. When the histogram is grey, no signals is available at that time.
The indicator has an option to show the current trend of an Hull moving average (ascending or descending curve). When the trend is up, green dots are plotted on the zero line. When the trend is down, the dots are coloured in red.
Greetings, success with your trade!!!

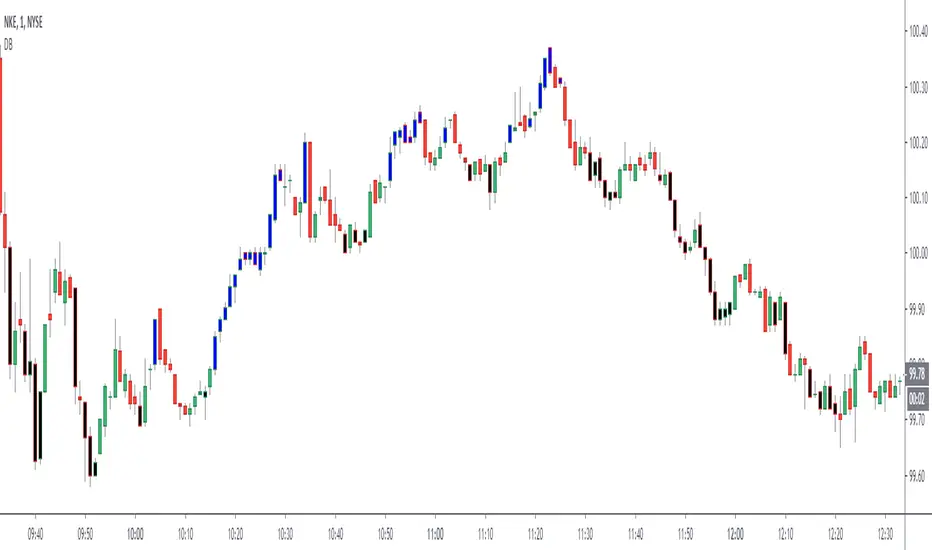
Dreadblitz BarsThese bars can give you good opportunities if you know how to analyze the context.
blue=bullish
black=bearish
thumbs up
Market Thrust IndicatorThe Market Thrust indicator is a powerful measure of the stock market's internal strength or weakness. There are four components to this indicator:
1-Advancing Issues on the New York Stock Exchange (NYSE) – $ADV
2-Advancing Volume on the NYSE – $UVOL
3-Declining Issues on the NYSE – $DECL
4-Declining Volume on the NYSE – $DVOL
The formula for Market Thrust is given below:
($ADV x $UVOL)-($DECL x $DVOL)
When used for day-trading, the trend of the Market Thrust indicator is what is most important.
Rising Market Thrust Indicator: Considered a bullish sign; can act as a confirmation signal when combined with a rising stock, index ETF, or stock index future's price.
Falling Market Thrust Indicator: Considered a bearish sign; can act as a confirmation signal of a decreasing market price.
The Market Thrust indicator could be used for detecting divergences in trends. Divergences occur when:
- Price is trending higher, but the Market Thrust indicator is not moving higher or is even going down.
- Price is trending lower, however, the Market Thrust technical analysis tool is not trending lower, it is either not trending or is trending higher.
Add a fully configurable trend line over MTI.
Read more at: commodity.com

Engulfing Scanner v1This indicator helps you to quickly identify bullish and bearish engulfing patterns.
Works on currencies only (pips required).

Differential Price Counter for Bullish/Bearish BarsThis script can show the cumulative differential price of both bullish/bearish bars with the 0.1pip precision for the currencies having five decimal precision. However, can be useful for all markets.

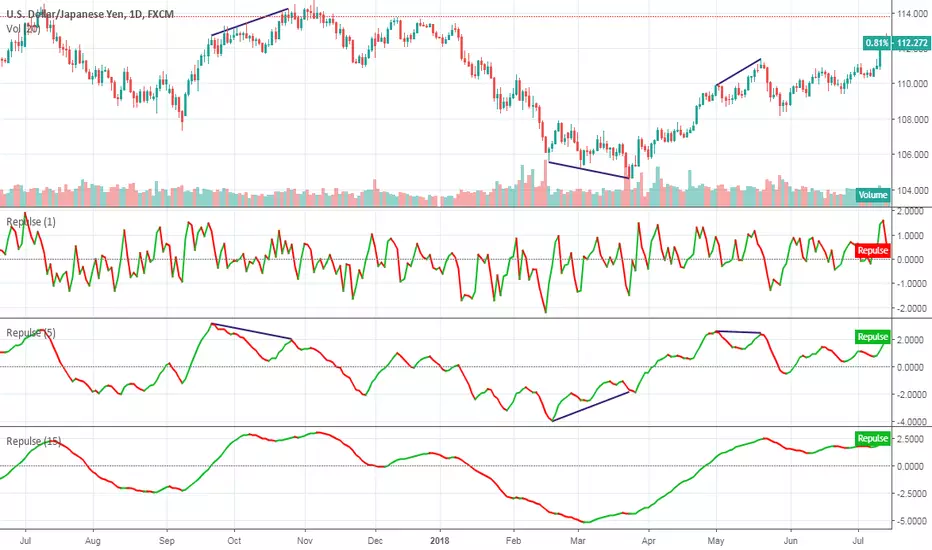
RepulseThis indicator was originally developed by Eric Lefort, a professional trader and author from France.
It gauges and displays the bullish or bearish pressure.
Like and follow for more open source indicators!
Happy Trading!
RSI_EMA & Bearish EngulfingThis is a RSI-RSI of EMA and bearish candlestick reversal pattern formed by two candlesticks. Following an uptrend, the first candlestick is a up candlestick which is followed by a down candlestick which has a long real body that engulfs or contains the real body of the prior bar. following an uptrend, if RSI and EMA line cross then Sell and for downtrend if RSI and EMA line cross then Buy.
CMYK VRMI◊ Introduction
This script indicates the relative movement of price x volume.
◊ Origin
Based on 'The Relative Momentum Index' by Roger Altman : February, 1993 issue of Technical Analysis of Stocks & Commodities magazine.
While RSI counts up and down days from close to close, the Relative Momentum Index counts up and down days from the close relative to a close x number of days ago.
This results in an RSI that is smoother. The input has been changed to the change of a smoothed close multiplied by a smoothed volume.
The polarity of VRMI indicates bearish/bullish movement.
◊ Adjustments
CMYK color theme applied.
◊ Usage
VRMI indicates the force the market moves with.
◊ Future Prospects
-
◊ ◊ ◊ ◊ ◊ ◊ ◊ ◊ ◊ ◊ ◊ ◊ ◊ ◊ ◊ ◊ ◊ ◊ ◊ ◊ ◊ ◊ ◊ ◊ ◊ ◊ ◊ ◊ ◊ ◊ ◊ ◊ ◊ ◊ ◊ ◊ ◊ ◊ ◊ ◊ ◊ ◊ ◊ ◊ ◊ ◊ ◊ ◊ ◊ ◊ ◊ ◊ ◊ ◊ ◊ ◊ ◊ ◊ ◊ ◊ ◊ ◊ ◊ ◊ ◊ ◊ ◊ ◊ ◊ ◊ ◊ ◊ ◊ ◊ ◊ ◊ ◊ ◊ ◊ ◊ ◊ ◊ ◊ ◊ ◊ ◊ ◊ ◊ ◊ ◊ ◊ ◊ ◊ ◊ ◊ ◊ ◊ ◊ ◊ ◊ ◊ ◊ ◊ ◊ ◊ ◊

CMYK VRMI RAYS ◊ Introduction
Introducing VRMI in this script, an RMI based on price movement and volume, to indicate bullish and bearish trends.
This script marks the background depending on RMI <> VRMI , VRMI polarity and large buy/sell sprees.
◊ Origin
Based on 'The Relative Momentum Index' by Roger Altman : February, 1993 issue of Technical Analysis of Stocks & Commodities magazine.
While RSI counts up and down days from close to close, the Relative Momentum Index counts up and down days from the close relative to a close x number of days ago.
This results in an RSI that is smoother.
In addition VRMI reacts quick, it is used to cut off latency from RMI, and it's polarity indicates the beginning and end of a trend.
Large buy sell sprees and detected in their proportion with an sma on the volume
◊ Adjustments
CMYK color theme applied.
◊ Usage
This indicator can be used to detect trends and mark reversals.
◊ Prospects
◊ ◊ ◊ ◊ ◊ ◊ ◊ ◊ ◊ ◊ ◊ ◊ ◊ ◊ ◊ ◊ ◊ ◊ ◊ ◊ ◊ ◊ ◊ ◊ ◊ ◊ ◊ ◊ ◊ ◊ ◊ ◊ ◊ ◊ ◊ ◊ ◊ ◊ ◊ ◊ ◊ ◊ ◊ ◊ ◊ ◊ ◊ ◊ ◊ ◊ ◊ ◊ ◊ ◊ ◊ ◊ ◊ ◊ ◊ ◊ ◊ ◊ ◊ ◊ ◊ ◊ ◊ ◊ ◊ ◊ ◊ ◊ ◊ ◊ ◊ ◊ ◊ ◊ ◊ ◊ ◊ ◊ ◊ ◊ ◊ ◊ ◊ ◊ ◊ ◊ ◊ ◊ ◊ ◊ ◊ ◊ ◊ ◊ ◊ ◊ ◊ ◊ ◊ ◊ ◊ ◊


Super Envolvente (Bullish y Bearish)Identificador de Super-envolventes (SE), se encarga de darle un color verde a la SE alzista (Bullish) verde y rojo a la bajista (Bearish).

Bearish Trailing stopIt is a trailing SL. Works very well. Good good very good. Looks like my description needs more, so here is more random text.


Bearish signal using Point of Control (POC) with PAC by guruThis indicator code helps traders identify potential sell opportunities using several important technical indicators:
Point of Control (POC) – This is the price level where the most volume was traded over the past several days.
Previous Day's Low – This shows the lowest price reached during the previous day.
PAC (Price Action Channel) EMA – These are two moving averages (one based on the low price and one based on the close price) that help determine if the price is trending within a certain range.
Volume SMA – This is a 3-day simple moving average (SMA) of volume, which helps filter out signals based on market activity.
What the Script Does:
Point of Control (POC):
The script looks at the last 50 days (configurable) and calculates which price level had the highest trading volume.
It then plots a red line on the chart at the POC level. This is important because it helps identify areas where there was strong market interest in the past.
Volume Moving Average:
The script calculates a 3-day SMA of volume, but it excludes the current day to avoid premature signals based on today’s trading.
The volume SMA is used to ensure there’s enough market activity (with a threshold set to 25 units) before triggering a sell signal.
Price Action Channel (PAC) EMA:
The PAC consists of two exponential moving averages (EMAs):
The PAC Low EMA: This is based on the low prices over the last 34 periods (configurable).
The PAC Close EMA: This is based on the closing prices over the last 34 periods.
These EMAs help determine if the price is trending above or below certain price levels.
Sell Signal Logic: The script checks three conditions before displaying a "Sell" signal:
Price Below POC and Previous Day’s Low:
The close price must be below both the Point of Control (POC) and the previous day's low.
Volume SMA Above 25:
The 3-day volume SMA must be greater than 25. This ensures the signal only triggers when there’s enough trading volume in the market.
Today’s Low is Above PAC EMAs:
Today's low price must be above both the PAC low EMA and the PAC close EMA. This prevents sell signals when prices are already significantly below the PAC, indicating possible exhaustion in the downtrend.
If all three conditions are met, the script will display a red "Sell" label on the chart, signaling a potential selling opportunity.
No Sell Signal if Price Reverses:
If the price crosses back above the POC or the previous day's low, the script will remove the sell signal and reset for a new opportunity.
Summary of Conditions:
For the script to display a "Sell" label:
The close price must be below the Point of Control (POC) and the previous day’s low.
The 3-day volume SMA (excluding today) must be greater than 25 units.
The low price of the current day must be above both the PAC low EMA and the PAC close EMA.
If these conditions are met, a red sell label appears on the chart as a potential signal for a short (sell) trade.

Supertrend Elite Trend System🏆 SUPERTREND ELITE TREND SYSTEM (SETS)
A sophisticated multi-indicator voting system designed for crypto trending markets, combining 10 powerful technical indicators with weighted scoring and trend confirmation.
📊 BACKTESTED PERFORMANCE (2018-2026):
- Total Return: +2,170%
- Win Rate: 30.23%
- Profit Factor: 2.4
- Max Drawdown: 41.72%
- Total Trades: 43
🎯 HOW IT WORKS:
The system uses 10 carefully selected indicators that "vote" on market direction:
1. Supertrend - Trend following baseline
2. ALMA - Smooth trend detection (Weight: 2)
3. CTI - Correlation Trend Indicator
4. STC - Sebastine Trend Catcher (Weight: 2)
5. GUNXO - Dual EMA trend sniper
6. DEMA DMI - Combined momentum & trend (Weight: 2)
7. MM - Market momentum indicator
8. DMI Loop - Directional movement analysis
9. Trend Oscillator - Fast/slow EMA divergence
10. Stochastic - Overbought/oversold conditions
Each indicator votes BULL (+1 or +2) or BEAR (-1 or -2), creating a weighted score out of 13 possible points.
🔥 SIGNAL GENERATION:
- STRONG BULL: Score difference > +4 (sustained 2 bars)
- WEAK BULL: Score difference > +1 (sustained 2 bars)
- WEAK BEAR: Score difference < -1 (sustained 2 bars)
- STRONG BEAR: Score difference < -4 (sustained 2 bars)
The 2-bar confirmation requirement filters out false signals and reduces whipsaws.
💎 BEST FOR:
- Crypto markets (BTC, ETH, major altcoins)
- 4H to Daily timeframes
- Trending markets (bull or bear)
- Long-term position holders
⚠️ NOT RECOMMENDED FOR:
- Ranging/sideways markets
- Scalping or day trading
- Low-volume altcoins
- High-frequency trading
📈 VISUAL FEATURES:
- Color-coded trend line below price (Green = Bull, Red = Bear)
- Real-time score dashboard showing bull/bear votes
- Clear action signals (BUY/HOLD, CAUTION, REDUCE, SELL/EXIT)
- Built-in alerts for trend changes
💡 STRATEGY:
The system is designed for "buy and hold during uptrends" approach. Enter on STRONG BULL or WEAK BULL signals, exit on WEAK BEAR or STRONG BEAR signals. Works best when combined with proper risk management and position sizing.
📱 ALERTS AVAILABLE:
- Strong Buy Signal
- Strong Sell Signal
- Trend Weakening Warning
- Bearish Turn Warning
Created and backtested by advanced algorithmic trading research. Not financial advice - always do your own research and never risk more than you can afford to lose.

Smart Krypto Futures Daytrade Suite Here is the complete **Strategy & User Guide** for your **"Smart Crypto Futures Daytrade Suite (Final)"** in English.
---
# 📘 Smart Crypto Futures Daytrade Suite – User Guide
### 1. Overview
This suite is an all-in-one institutional-grade tool designed for **Scalping and Daytrading** cryptocurrencies (Bitcoin, Ethereum, Altcoins). It combines high-timeframe trends with lower-timeframe entry triggers, liquidity levels, and a real-time market dashboard.
### 2. The Visual Legend (What is what?)
#### A) Trend & Momentum (The "Traffic Light")
* **🟣 Daily EMA 50 (Neon Violet):** The **Macro Trend**.
* *Price Above:* Bullish Bias (Look for Longs).
* *Price Below:* Bearish Bias (Look for Shorts).
* **🟢 4h EMA 50 (Neon Green):** The **Swing Trend**. Ideally, price is above both the Violet and Green lines for a strong trend.
* **🔵 WMA 200 (Royal Blue):** The **"Last Line of Defense"**. A weighted moving average often respected by algorithms as major dynamic support or resistance.
* **💠 VWAP (Cyan/Light Blue):** The **Session Anchor**.
* *Bullish Day:* Price stays above VWAP.
* *Bearish Day:* Price stays below VWAP.
* **🟡 EMA 9 (Yellow):** The **Entry Trigger**. Use this for timing. Enter when a candle closes above/below this line after a pullback.
#### B) Market Structure & Zones
* **🟥 / 🟩 Boxes (Solid):** **Supply & Demand Zones** (1h Timeframe). These are major reversal areas.
* **⬜ FVG Boxes (Transparent):** **Fair Value Gaps**. Imbalances in the market that price often wants to fill ("mitigate") before continuing the trend.
#### C) Liquidity & Targets
* **🟡 POC Line (Gold):** **Point of Control** (Yesterday’s highest volume price).
* *Rule:* Use as a **Take Profit** target. Price acts like a magnet to this level.
* **⚪ PDH / PDL (Grey Dashed):** **Previous Day High / Low**.
* *Strategy:* Watch for "Fakeouts" (Liquidity Grabs) at these levels to take a reversal trade.
---
### 3. The Dashboard (Head-Up Display)
Located in the top right corner, this panel gives you an instant overview of the market health without switching charts.
**Columns:**
1. **ASSET:** Monitors BTC, ETH, Bitcoin Dominance (BTC.D), and Tether Dominance (USDT.D).
2. **TREND (15m):** Compares Price vs. EMA 50 (15m timeframe).
* **🟢 BULL:** Short-term trend is Up.
* **🔴 BEAR:** Short-term trend is Down.
3. **RSI (15m):** Relative Strength Index (14).
* **🟢 < 30:** Oversold (Potential Bounce / Long opportunity).
* **🔴 > 70:** Overbought (Potential Pullback / Short opportunity).
* **⚪ 30-70:** Neutral.
**Correlations to watch:**
* If **BTC.D** is BULL (Green), money is flowing into Bitcoin (Altcoins might bleed).
* If **USDT.D** is BULL (Green), traders are fleeing to cash (Crypto prices usually drop).
---
### 4. Trading Strategy Blueprints
#### Setup A: The "Trend Pullback" (High Probability)
1. **Context:** Price is above **Daily EMA (Violet)** and **4h EMA (Green)**.
2. **Pullback:** Price drops down to test the **WMA 200 (Royal Blue)** or **VWAP (Cyan)**.
3. **Confluence:** Ideally, there is a **Green Demand Zone** or an **FVG** at the same level.
4. **Trigger:** Wait for a candle to close back above the **EMA 9 (Yellow)**.
5. **Target:** The **POC (Gold)** or **PDH (Grey)**.
#### Setup B: The "Liquidity Sweep" (Reversal)
1. **Context:** Price shoots up rapidly.
2. **Event:** Price breaks the **PDH (Previous Day High)** but fails to close above it (leaves a long wick).
3. **Dashboard Check:** RSI is red (> 70).
4. **Entry:** Short when price falls back below the PDH.
5. **Target:** Back to the **VWAP** or **POC**.
---
### 5. Risk Management Rules
* **No Man's Land:** Do not trade when price is far away from all EMAs and VWAP. Wait for a return to value.
* **The Chop:** If the EMAs are flat and weaving through price, the market is ranging. Reduce position size or wait.
* **VWAP Rule:** In a strong trend, the VWAP often acts as the "floor" (Longs) or "ceiling" (Shorts). If price breaks VWAP with volume, the day's trend might be changing.
**Enjoy the suite! Simplicity is the ultimate sophistication.**

Next Candle Prediction and MomentumHow to Use It – Step by Step
Enable / Disable Predictions
Hover over the indicator name at the top-left of the chart.
Click the gear icon (Settings) that appears.
In the Settings window → Inputs tab:Check or uncheck "Show Next Prediction" (default = true).
Click OK or close the window.
→ This toggles the projected candle on/off without removing the momentum arrows.
Where & When Predictions Appear
Only on the current/last bar (the rightmost bar on your chart).
Only in realtime or at bar close when momentum is strongly aligned.
Green projected candle (semi-transparent body + wicks) → bullish prediction (uptrend momentum).
Red projected candle → bearish prediction (downtrend momentum).
No projection → momentum is neutral/mixed (no strong agreement → no signal).
The % label (e.g., " 92%") shows relative strength:50–70% → conservative / low-vol move
70–100% → average expected size
100–150% → strong / high-vol move (max allowed)
Understanding the Momentum Triangles
These appear on historical bars where a momentum shift occurred.
Green MACD triangle below bar → fresh bullish acceleration (MACD crossover up).
Green RSI triangle below bar → momentum bias turning bullish (RSI > 50).
Red MACD / Red RSI above bar → opposite (bearish shift).
Double green (MACD + RSI close together) → high-conviction bullish alignment → often leads to green prediction appearing.
Best Practices & Tips Time
frames: Works on any, but shines on 5m–4h for intraday, daily for swings. Avoid very low-vol symbols or extreme timeframes (1s or monthly).
Zoom: Zoom out slightly so you see 1–2 bars to the right of the current price — predictions project forward.
Volatile markets: Bigger projections (higher %) in high-vol conditions (good for breakouts).
Clean chart: Arrows are small and only appear on shifts → low clutter. Predictions auto-cleanup.
Confirmation: Use with support/resistance, volume, or news. The script is momentum-only — not a full strategy.
Alerts (optional advanced): Right-click indicator name → "Add Alert" → select conditions like "MACD Bull Cross" or "RSI >50" to get notified on shifts.
Troubleshooting
No prediction shows → Momentum not aligned (check if all 3 conditions met), or "Show Next Prediction" is off.
Triangles missing → They only plot on actual crossovers/crossunders — normal if market is trending steadily.
Prediction too small/big → Normal (ATR-based). Switch to higher-vol symbol if needed.

GORDAUM SCALP Outside Bar + VWAP + RSI Scale + Range POC + FiBO📘 OFFICIAL MANUAL
SCALP INDICATOR – OUTSIDE BAR + VWAP + RSI + RANGE (POC / VA) + FIBONACCI
📌 INDICATOR OVERVIEW
This indicator was developed for SCALPING operations, focusing on fast entries, reduced risk exposure, and false signal filtering.
The strategy combines price action, momentum, fair value, and range structure, delivering clear, objective, and visual signals, without subjective interpretation.
🔧 INDICATOR COMPONENTS
The indicator is composed of 5 main pillars:
1️⃣ OUTSIDE BAR (PRICE ACTION)
The Outside Bar represents a candle that completely engulfs the previous candle, indicating clear buyer or seller aggression and a potential start of a short movement, ideal for scalping.
This is the main entry trigger.
2️⃣ VWAP (FAIR PRICE OF THE DAY)
VWAP represents the volume-weighted average price and is widely used by institutional traders.
Basic rules:
Price above VWAP indicates bullish bias.
Price below VWAP indicates bearish bias.
The strategy does not trade against VWAP.
3️⃣ RSI WITH STRENGTH SCALE (ANTI-FALSE ENTRY)
RSI is used as a momentum strength indicator.
The indicator measures the distance of RSI from the 50 level, classifying signals as:
Weak signal (gray): RSI very close to 50, trap zone.
Medium signal (yellow/orange): moderate strength.
Strong signal (green/red): RSI far from 50, higher probability of real movement.
The farther RSI is from 50, the lower the chance of false entries.
4️⃣ MARKET RANGE – POC, VAH AND VAL
The indicator identifies the current market range and builds a value-based reading:
POC (Point of Control): area where price trades the most.
VAH (Value Area High): top of the value area.
VAL (Value Area Low): bottom of the value area.
Key concept:
Price near the POC indicates consolidation and false entries.
Price reacting near VAH or VAL indicates cleaner trades.
This context is marked on the chart with a second marker (dot).
5️⃣ DYNAMIC FIBONACCI (CONTEXT AND TARGETS)
Fibonacci levels are calculated automatically based on the recent market range, projecting the following levels:
0.5
0.618
0.666
1.0
These levels act as targets, partial exits, rejection zones, or continuation areas.
🔺 TYPES OF SIGNALS ON THE CHART
The indicator works with two simultaneous markers:
Arrow (Outside Bar): indicates a potential entry based on Outside Bar, VWAP, and RSI.
Dot (Range Context): indicates price position within the range:
Gray: price at POC (trap zone).
Yellow: middle of the range.
Green or red: price near VAH or VAL (favorable zone).
✅ TRADING RULES
LONG (BUY) SETUP:
Price above VWAP.
Bullish Outside Bar formation.
RSI above 50.
Green or yellow arrow.
Green dot indicating proximity to VAL.
When arrow and dot align, the trade is valid.
SHORT (SELL) SETUP:
Price below VWAP.
Bearish Outside Bar formation.
RSI below 50.
Red or orange arrow.
Red dot indicating proximity to VAH.
Dual confirmation increases trade probability.
❌ WHEN NOT TO TRADE
Avoid trades when:
Arrow is gray.
Dot is gray (price at POC).
RSI is too close to 50.
Market is clearly ranging.
Not trading is also a professional decision.
🎯 STOP LOSS AND TARGETS
Stop Loss:
Below the Outside Bar low for long trades.
Above the Outside Bar high for short trades.
Targets:
Next Fibonacci level.
Opposite VAH or VAL.
Minimum risk-to-reward ratio of 1:1.
⏱️ RECOMMENDED TIMEFRAMES
1 minute
2 minutes
3 minutes
Renko charts with small bricks.
⚠️ IMPORTANT CONSIDERATIONS
This indicator is not a trading robot.
It provides context and entry triggers.
Execution and risk management are the trader’s responsibility.
🧠 STRATEGY PHILOSOPHY
This setup was created to avoid overtrading, eliminate entries in the middle of the range, and operate only where the market truly moves.
Price away from value creates opportunity.
Price inside value creates traps.

VWAP 3 SignalsVWAP D/W/M Dashboard is a simple trend / bias dashboard that compares the current price against three anchored VWAP levels:
Daily VWAP
Weekly VWAP
Monthly VWAP
A compact table is displayed in the top-right corner of the chart with 5 rows and 2 columns (Instrument / Status).
For each VWAP timeframe, the script shows:
Bullish → price is above the VWAP
Bearish → price is below the VWAP
In addition, the dashboard includes volatility-based market balance readings using ±1 Standard Deviation bands around the anchored VWAP for:
Weekly STD
Monthly STD
STD logic:
Balanced market → price is inside the ±1 deviation zone
Bullish → price is above +1 deviation
Bearish → price is below −1 deviation
What it’s used for
This tool helps you quickly identify:
multi-timeframe VWAP alignment (trend bias / direction)
whether the market is trending (outside ±1 STD) or balanced/ranging (inside ±1 STD)
It’s designed as a fast “at-a-glance” confirmation panel you can keep on screen while trading.
Notes
VWAP levels are calculated as anchored VWAPs that reset on each new day/week/month.
The dashboard is meant for decision support, not as standalone financial advice.

PinBar Finder by cryptokazancevEnglish description:
This script helps traders identify high-probability reversal points based on price action, specifically Pin Bars — a well-known candlestick pattern used in technical analysis.
What does the indicator do?
It detects bullish and bearish Pin Bars using a custom method for wick-to-body ratio and filters based on historical volatility (pseudo-ATR). A label appears on the chart with detailed info on wick and body size when a valid signal is found.
How does it work?
- The indicator calculates a pseudo-ATR based on the percentage range of the last 1000 candles.
- It then multiplies this value by a user-defined factor (default: 1.1) to set a dynamic threshold for wick size.
- Bullish Pin Bars are detected when the lower wick is at least 1.1 times the body and greater than the dynamic ATR.
- Bearish Pin Bars are detected when the upper wick meets similar conditions.
- Signals are shown using chart labels with exact wick/body percentages.
- Alerts are included for automation or integration with trading bots.
How to use it?
- Add the indicator to any timeframe and asset.
- Use the alerts to notify you when a Pin Bar appears.
- Ideal for traders who use candlestick reversal strategies or combine price action with other confluence tools.
- You can adjust the wick length multiplier to fit the volatility of the instrument.
What makes it original?
Unlike many public scripts that use fixed ratios, this script adapts wick length detection based on recent volatility (pseudo-ATR logic). This makes it more dynamic and suitable for different markets and timeframes.
Описание на русском:
Этот скрипт помогает трейдерам находить точки потенциального разворота на основе прайс-экшена, а именно — свечного паттерна «Пин-бар». Индикатор автоматически определяет бычьи и медвежьи пин-бары с учетом адаптивных параметров волатильности.
Что делает индикатор?
Скрипт ищет свечи, у которых тень в несколько раз превышает тело (пин-бары), и отображает на графике точную информацию о длине тела и тени. Это полезно для трейдеров, использующих свечные сигналы на разворот.
Как работает?
- Рассчитывается псевдо-ATR по 1000 последним свечам на основе процентного диапазона high-low.
- Этот ATR умножается на заданный множитель (по умолчанию: 1.1), чтобы динамически задать минимальную длину тени.
- Бычий пин-бар определяется, когда нижняя тень больше тела в 1.1 раза и превышает ATR.
- Медвежий пин-бар — аналогично, но для верхней тени.
- Индикатор отображает лейблы с точными значениями тела и тени.
- Реализованы условия для оповещений (alerts).
Как использовать?
- Добавьте индикатор на нужный график и таймфрейм.
- Настройте alerts, чтобы не пропустить сигналы.
- Особенно полезен для трейдеров, работающих со свечным анализом, стратегиями разворота, а также в сочетании с другими индикаторами.
В чем оригинальность?
В отличие от многих скриптов, использующих фиксированные параметры, здесь используется динамический расчет длины тени на основе волатильности. Это делает скрипт адаптивным к рынку и таймфрейму.
