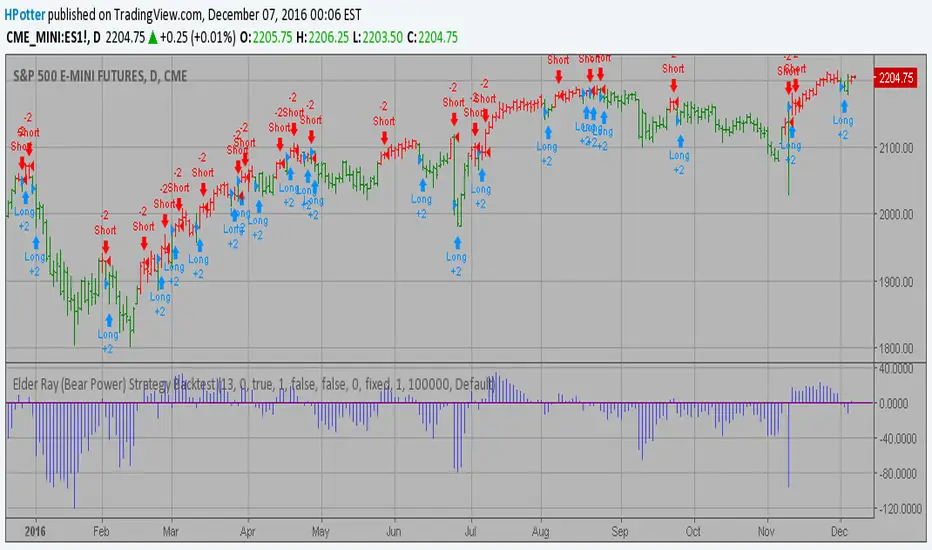
Elder Ray (Bear Power) Strategy Backtest Developed by Dr Alexander Elder, the Elder-ray indicator measures buying
and selling pressure in the market. The Elder-ray is often used as part
of the Triple Screen trading system but may also be used on its own.
Dr Elder uses a 13-day exponential moving average (EMA) to indicate the
market consensus of value. Bear Power measures the ability of sellers to
drive prices below the consensus of value. Bear Power reflects the ability
of sellers to drive prices below the average consensus of value.
Bull Power is calculated by subtracting the 13-day EMA from the day's High.
Bear power subtracts the 13-day EMA from the day's Low.
You can use in the xPrice any series: Open, High, Low, Close, HL2, HLC3, OHLC4 and ect...
You can change long to short in the Input Settings
Please, use it only for learning or paper trading. Do not for real trading.
"bear" için komut dosyalarını ara
EMA bullish/bearish dashboard - MTFThis is a good reminder for which way you should be placing orders.
It's best to not ignore these signals!!!
lime = full bull - 100ema above 200ema and price is above 200ema
green = hallf bull - price now below 200ema but 100ema is still above the 200
maroon = full bear - opposite of full bull
red = half bear - opposite of half bull
Also with multi timeframe option - so I guess you could stack several of these on a single framed chart if you wanted.

[NM] EMADiff v01 - an indicator for everyone !Allright gang, we are here with a new indicator that should help you with determining the direction to trade or whether you should trade at all.
It uses the close of the candle and 2 EMAs.
The faster moving line is the difference between the close and the Slow EMA, while the slower moving line shows the difference between the Fast EMA and the Slow EMA.
There are a couple of ways you can use this indicator, depending on your trading style :
For the quick profit, in and out :
- enable the safer trading option and keep smoothing at the default setting, buy when both lines are green, sell when both line are red and get out when one of the lines changes color (or when profit target is reached) (see the top option)
For longer trades :
- you can increase the smoothing, use a higher Slow EMA and disable the Safer trading option, enter either when both lines have the same color, either on a crossover. (the bottom option)
In both cases, if both lines hover around the zero line, the trend is definitely not strong.
Much more options are available so I would love to hear how you use this indicator. A thumbs up if you like it would be highly appreciated :)
Works nicely together with my other indicators below :
To add this indicator (or any other) to your chart, click the "Add to favorites" button. Then while having the chart you wish to apply it to open, click on Indicators > Favorites > EMADiff v01 (or any other indicator that you favorited.

Elder Ray Composite DOA hybrid representation of Elder Ray's Bear/Bull as an oscillator, using TEMA and LRC calculations to average out the signals. The Oscillation is based off of the Derivative oscillator. This gives an interesting interpretation of Bear vs Bull power. Give it a try!

M5_Bull/Bear BBOM5_ Bull/Bear BBO is a derivative oscillator built from LuxAlgo’s original Bollinger Bands Breakout Oscillator (BBO).
This version restructures the original breakout logic into a bull / bear adaptive oscillator, introduces inverted symmetry, and expands the visual system with dynamic level states and conditional color logic. The goal is to provide contextual momentum awareness rather than discrete trade signals.
A key design focus is the interaction between dominant pressure and the absence of opposing pressure. Buying and selling pressure may coexist, but moments where opposing pressure fully dissipates are treated as structurally significant — a “door opening” condition where price is no longer constrained by counter-pressure and is free to expand.
Pressure is explicitly mirrored from the opposite side, creating a symmetrical framework where each side’s expansion is reflected against the other. These mirrored structures are allowed to cross, not as directional signals, but as markers of peak intensity or exhaustion within an expanding pressure phase.
Transitional regimes — where one pressure fades before the other fully emerges — are intentionally left visible rather than smoothed away. These areas often produce late confirmation or no follow-through at all, and are presented as a challenging but informative market state rather than a condition to be optimized away.
The script is intended for visual analysis and context alignment, not as a standalone entry/exit system.
Credits & Licensing
Original concept and base implementation: LuxAlgo
Modifications, restructuring, and visual system: Metaltek5
License: Creative Commons Attribution–NonCommercial–ShareAlike 4.0 (CC BY-NC-SA 4.0)
This script is published as open source under the same license as the original work.
Non-commercial use only. Attribution and share-alike required.
Annotated example illustrating dominant pressure, mirrored behavior, and door opening conditions

MTF SMA Zones + EMA Trend (Bull & Bear) + EMA DisplayMTF SMA Zones + EMA Trend (Bull & Bear) + EMA Display

Ichimoku bull bear trend Multi-BG by Pranojit Dey It gives you bullish and bearish bias using ichimoku, VWAP, SMA and Pivot. can be used as a great confirmation tool for trading. Use it. You will love it. Lets trade traders....

RSI Bull bear thresholds region highlight on priceBullish & bearish relative strength thresholds
Default 61 & 39 RSI

MACD-v Bullish/Bearish DivergenceMACD-v Bullish/Bearish Divergence
Overview This indicator is a specialized divergence detector based on the MACD-v (Volatility Normalized Momentum) concept. Unlike standard MACD which uses absolute price differences, MACD-v normalizes values against volatility (ATR), allowing for fixed, universal Overbought/Oversold thresholds across all assets and timeframes.
Recommendation: This script is highly effective when paired with the original MACD-v by Alex Spiroglou. While this indicator focuses on identifying and visualizing divergence entries, using the original oscillator alongside it provides the best visual context for the overall momentum structure.
How It Works
This tool uses a dual-signal mechanism (Raw Line + Signal Smooth) to identify specific divergence setups:
Setup (Yellow/Blue Dots): Identifies when price momentum has extended significantly into extreme zones (Overbought/Oversold).
Trigger (Red/Green Dots): Fires when price fails to make a new momentum extreme despite price action (classic divergence/failure swing).
Active State (Background Color): Once a trigger fires, the background highlights (Red for Bearish, Green for Bullish) to indicate an active divergence play.
Reset (Exit): The signal state clears when momentum returns to the neutral "safe zone."
Important Note: Momentum Washout
The colored background persists as long as the divergence trade remains valid. Traders should note the concept of "Momentum Washout":
Signal End: The background color turns off when the MACD returns to the neutral range, indicating the primary high-velocity impulse is over.
Performance Continuation: Significant positive or negative price performance can often continue even after the background signal ends. This period allows the remaining momentum to "wash out" or drift before the next major impulse.
Strategy Tip: The indicator is designed to capture the high-volatility portion of the reversal. Do not assume the end of the signal is the absolute top or bottom of the trend; it simply marks the normalization of momentum.
Strategy Recommendation: Multi-Timeframe Analysis
Divergence signals are most powerful when confirmed across timeframes. It is highly recommended to look for alignment before taking a trade:
Trend Confirmation: If you see a signal on a lower timeframe (e.g., 5m or 15m), check a higher timeframe (e.g., 1H or 4H). A bullish divergence on the 5m is significantly more reliable if the 1H momentum is already bullish or oversold.
Signal Stacking: Valid signals often appear sequentially—first on the 1m, then the 5m, and finally the 15m. Waiting for this "cascade" can filter out false reversals.
Visual Guide
🔵 Blue Dot: Bullish Divergence Setup (Watch for entry).
🟢 Green Dot: Bullish Divergence Trigger (Long Entry).
🟡 Yellow Dot: Bearish Divergence Setup (Watch for entry).
🔴 Red Dot: Bearish Divergence Trigger (Short Entry).
Background Color: Indicates an active trade (Red = Bearish / Green = Bullish).
Settings
Auto-Detect: Automatically switches between Scalping settings (tighter thresholds) for low timeframes and Swing settings for high timeframes.
Strict Invalidation: If enabled, cancels a setup if momentum pushes too far in the opposite direction before triggering.
Active Signal Multiplier: Dynamically smooths the signal line only when a trade is active to prevent premature exits during choppy corrections.
Disclaimer: This tool is for educational purposes and trend analysis only. Always manage your risk appropriately.

Direction via Zone Break [by rukich]🟠 OVERVIEW
The indicator shows the direction of movement and zones: SSL, BSL, FVG.
Zones serve as support/resistance and as validation/invalidation of a movement reversal.
🟠 COMPONENTS
The direction of movement is built based on a three-candle swing high (BSL) and swing low (SSL) pattern. If swing high (BSL) and swing low (SSL) are formed, and then an internal swing high/low is formed (depending on the direction of movement), then in case the initial movement continues — for example, in an upward movement — the new swing low (SSL) will be the minimum before the update, i.e., the internal low, while the swing high (BSL) will be formed according to the three-candle pattern.
A change of direction is considered when a candle closes beyond the key swing high/low (BSL/SSL), depending on the direction of movement. For example, in an upward movement, a break occurs when a candle closes beyond the swing low (SSL). After that, the swing high (BSL) will be the nearest fractal (swing high), and the swing low (SSL) will be formed according to the three-candle pattern.
All the above logic also applies to downward movements.
Within each movement, there can be FVG zones, which can act as support/resistance or indicate weakness in the movement direction.
Note: if the movement is upward, only bullish FVG+ will be displayed; if the movement is downward, only bearish FVG- will be displayed.
Weakness of movement direction.
For example, consider an upward impulse with the nearest FVG+ zone. If the price closes beyond the lower boundary of the zone, it will be considered invalidated (inv. FVG-), which in turn indicates weakness in the movement direction and a possible local short, which may subsequently lead to a break of the entire movement.
🟠 HOW TO USE
There are only two visual settings in the configuration:
Show previous SSL/BSL – enables/disables the display of all previous SSL/BSL zones
Show Bullish/Bearish trend – enables/disables background shading between SSL and BSL for visual understanding of the movement direction
On the chart, the following are displayed:
Labels with current SSL/BSL
FVG+- / inv. FVG+- zones, for trading in the movement direction
In case the nearest FVG is invalidated, a label will appear with the text: Weak bullish/bearish & local short/long (this is not a signal, but only indicates the probability of a potential move based on the weakness of the nearest zone)
🟠 CONCLUSION
The indicator helps determine the current movement with zones for trading in the direction, and also indicates movement weakness through invalidation of the nearest zones.

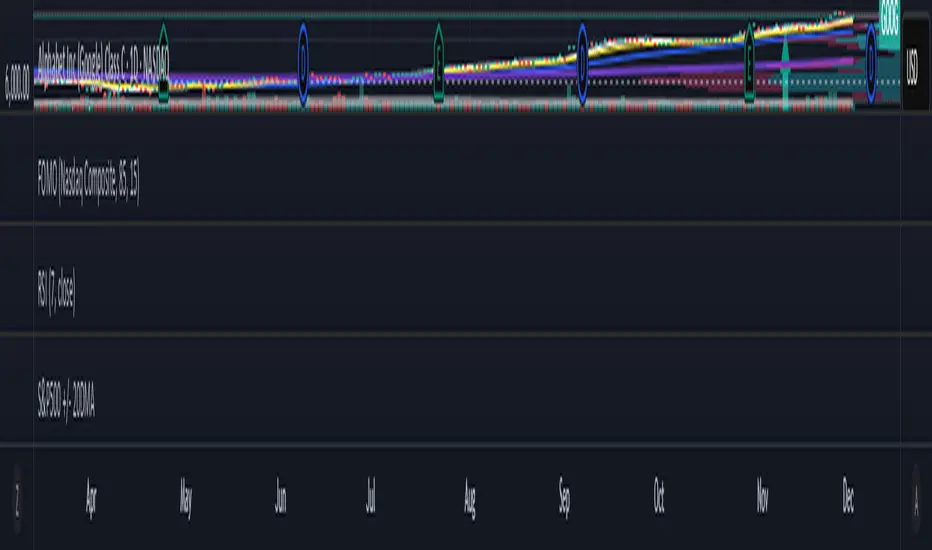
S&P 500 Breadth: Bull vs Bear (20DMA)S&P 500 Breadth: Bull vs Bear (20DMA)
Use as simple market breadth
EMAs Bullish/Bearish Confluence [Trend Bias]EMA Confluence Zones
This indicator is designed to simplify trend identification by visually highlighting "Confluence Zones" —areas where short-term, medium-term, and long-term momentum are fully aligned.
While traders can manually add three Moving Averages to a chart, identifying the exact moment all three align (the "Perfect Stack") can be visually difficult during live trading. This script automates that process, converting complex line crosses into simple background color zones and providing actionable alerts for the exact moment a trend alignment begins.
🛠 How It Works
The script utilizes three customizable Exponential Moving Averages (EMAs) to detect the market bias:
Short EMA: Represents immediate price action/momentum.
Medium EMA: Represents the intermediate trend.
Long EMA: Represents the major trend baseline.
Calculations & Logic
The indicator checks for a specific hierarchical alignment (Stacking) of these averages:
1. 🟢 Bullish Confluence (Buy Zone):** Returns true when `Short > Medium` AND `Medium >Long`. This confirms that momentum is rising across all three monitored timeframes.
2. 🔴 Bearish Confluence (Sell Zone):** Returns true when `Short < Medium` AND `Medium < Long`. This confirms that momentum is falling across all three monitored timeframes.
3. ⚪ Neutral (No Color): Any other state indicates a choppy or consolidating market where the EMAs are intertwined.
---
🚀 Key Features
*Visual Bias Confirmation: The background highlights Green (Bullish) or Red (Bearish) only when the "Perfect Stack" conditions are met.
Trend Start Alerts: Unlike standard EMA cross alerts, this script includes custom alert conditions that trigger only on the first bar where the confluence becomes valid. This prevents spam alerts during a prolonged trend.
Full Customization: Users can adjust the lengths of all three EMAs to fit specific strategies (e.g., Scalping vs. Swing Trading).
Clean Chart Mode: Includes options to hide the EMA lines entirely and rely solely on the background color for a minimalist "Naked Trading" setup.
🎯 How to Use
1. Trend Filter: Use the background color to determine your directional bias. If the background is Green, look only for Long setups on lower timeframes. If Red, look only for Short setups.
2. Breakout Confirmation: If price breaks a key level, wait for the background color to flip. This confirms that the Moving Averages have caught up to the move, validating the breakout strength.
3. Exit Signal: If you are in a trend trade and the background color disappears (turns transparent), it indicates the trend momentum is fading and the EMAs are beginning to cross/compress.
⚙️ Settings
EMA Lengths: Default is 20, 50, 100. These can be changed to common combinations like (9, 21, 55) or (50, 100, 200).
Visuals: Toggle lines or background colors on/off and adjust transparency to keep your chart readable.
---
Disclaimer: This script is for informational purposes only. Past performance of a trend following method does not guarantee future results. Always use proper risk management.

Bullish and Bearish Engulfing (Strength & Trend)This is the final indicator that will show all the “Bullish Engulfing” and “Bearish Engulfing” price action patterns on the chart.
There are several indicators that show this type of chart pattern, but this will show you on the chart all the types of engulfing that may exist and differentiated by type (or strength).
I have classified 4 types of patterns for strength.
Those of strength 1 represent patterns that only incorporate the body of the previous candle, and therefore represent a "base" signal.
Those of strength 2 represent patterns that have the close beyond the shadow, but with an open equal to the previous close.
Those of strength 3 represent patterns that open beyond the previous close.
Those of strength 4 represent patterns in which the body of the candle completely encompasses the previous candle.
Trend Filter
For a better experience I have also added a trend filter via an exponential moving average adjustable from the settings.
So if activated, patterns will only appear if the candle is completely above the moving average.
The indicator is completed by alerts that can be activated either via the "any alert function" in which you will receive any alert, or you can choose whether to receive only bullish ones or only bearish ones.

2 bearish candles above the 8 EMAYou will get a signal when:
Candle n-1 is bearish
Candle n is bearish
Candle n closes above the 8EMA
All on 30-minute timeframe

Absorption — Bullish or BearishAbsorption — Bullish or Bearish Only is a lightweight and minimalistic tool designed to identify pure absorption events in the market.
It highlights only two conditions:
Bullish Absorption
• Volume spike
• Small candle body
• Positive delta behavior (close > open)
→ Indicates potential buy-side absorption at lows
Bearish Absorption
• Volume spike
• Small candle body
• Negative delta behavior (close < open)
→ Indicates potential sell-side absorption at highs
This script intentionally keeps the chart clean by marking only “Bullish” or “Bearish” labels, without any additional visuals, colors, or extra signals.
Ideal for traders who want a simple, non-disruptive absorption confirmation tool.

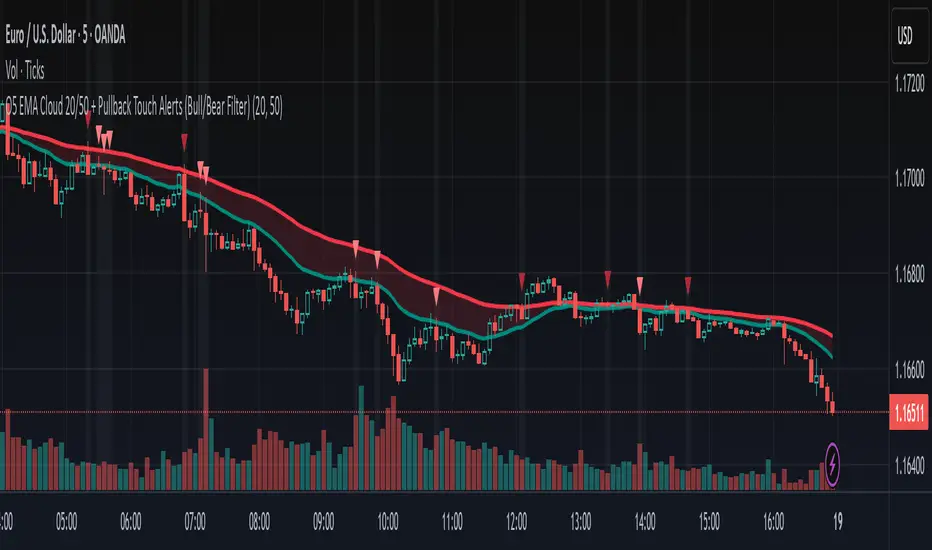
O5 EMA Cloud 20/50 + Pullback Touch Alerts (Bull/Bear Filter)This indicator shows an EMA cloud that is set to Fast=20 and Slow=50 by default, but can be changed.
It features suggested entry signals when price pulls back to either EMA level in both uptrends and downtrends.
Buy signals print only when price pulls back to one of the EMA levels and closes up.
Bearish signals only print when price pulls back to one of the EMA levels and closes down.
Bull vs Bear Volume(Simplified)Bull vs Bear Volume
After experimenting with countless volume-based indicators, I sought a simple way to visualize buying and selling pressure with just two lines—an indicator that stays closely coupled with price action.
I went through endless trial and error, building extremely complex volume indicators, only to find that in live trading, errors kept arising and the tools became more hindrance than help. Yet, to enhance the reliability of price indicators, a trustworthy volume measure is indispensable. Even after testing numerous community-shared indicators, I could not find one that met my needs.
This led me to a simple idea: process volume only when Close > Open for buying pressure, and Close < Open for selling pressure, while cleaning out the noise. By reflecting only the volume contributing to price movement, the indicator remains stable and intuitive.
Implementing this concept, I created an indicator that, among countless volume tools, stands out for its clarity and lack of extraneous functions. Users can freely adjust the sum periods of the Bull and Bear lines, choose line styles, and even enjoy the dynamic color changes when the lines cross.
If this indicator can provide even a little assistance in trading, then my purpose is fulfilled.

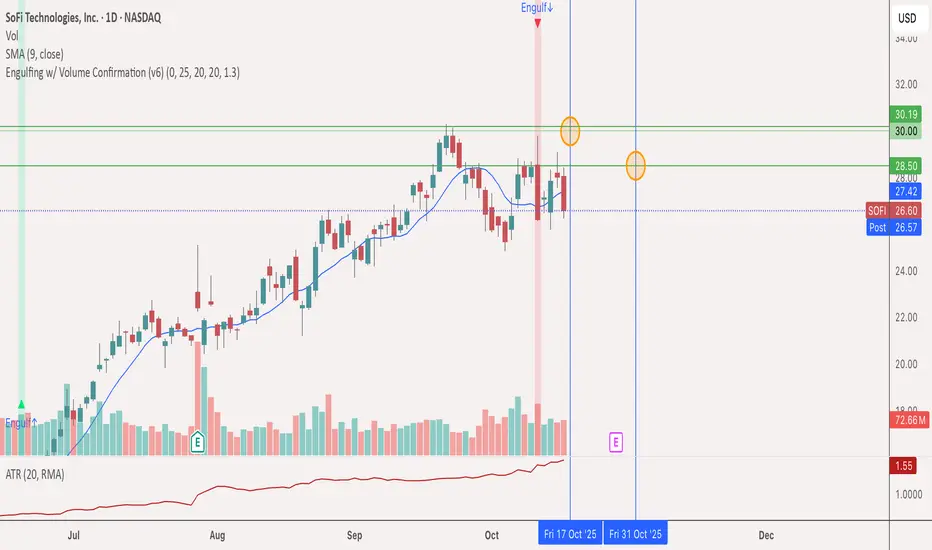
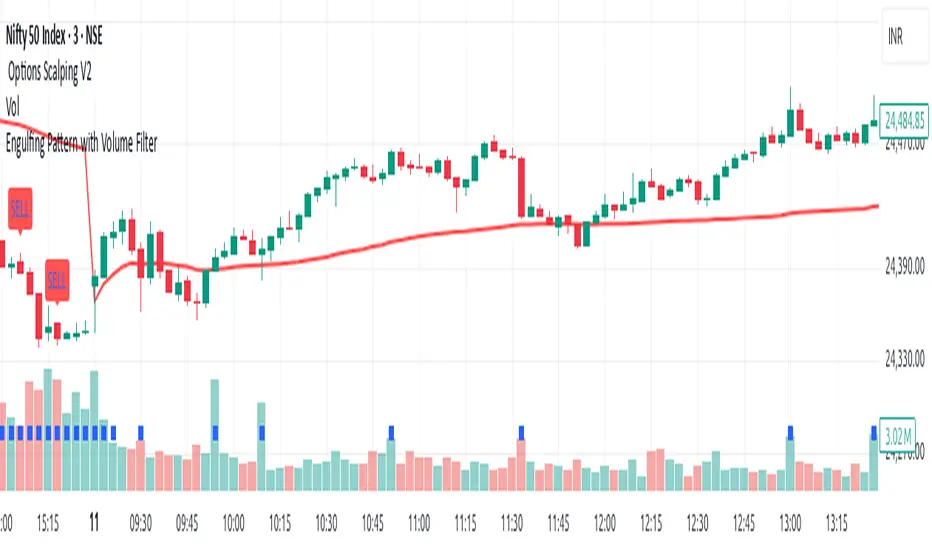
Engulfing bull & bear w/ Volume Confirmation (v6)This script ID's bullish & bearish engulfing bars with volume ≥ SMA (volume, 20) x 1.3 and (optionally) ≥ previous bar's volume.
Parameters adjustable
Bullish & Bearish Once Bar PainterThe Bullish & Bearish First Bar Marker is a simple yet powerful indicator designed to highlight the first bullish and bearish bars in a sequence, helping traders identify key momentum shifts in the market. It marks:Bullish Bars: The first bar where the high and low are both higher than the previous bar (high > high and low > low ), painted green with a "Bullish" label.
Bearish Bars: The first bar where the high and low are both lower than the previous bar (high < high and low < low ), painted red with a "Bearish" label.
To avoid clutter, consecutive bullish or bearish bars are not marked until a non-bullish or non-bearish bar resets the sequence. This makes it ideal for spotting the start of strong upward or downward price movements.

Strong Bullish And Bearish Engulfing PatternCONDITIONS:
🔹 1st Condition — Bullish Engulfing ➜ BUY
Previous Candle (Red): close < open
Current Candle (Green): close > open
Opens below previous red candle’s close: open < close
Closes above previous red candle’s open: close > open
➡️ Plot BUY below the green candle
🔸 2nd Condition — Bearish Engulfing ➜ SELL
Previous Candle (Green): close > open
Current Candle (Red): close < open
Opens above previous green candle’s close: open > close
Closes below previous green candle’s open: close < open
➡️ Plot SELL above the red candle
What this Script Does:
Detects Bullish Engulfing patterns ➜ plots BUY below the green candle.
Detects Bearish Engulfing patterns ➜ plots SELL above the red candle.
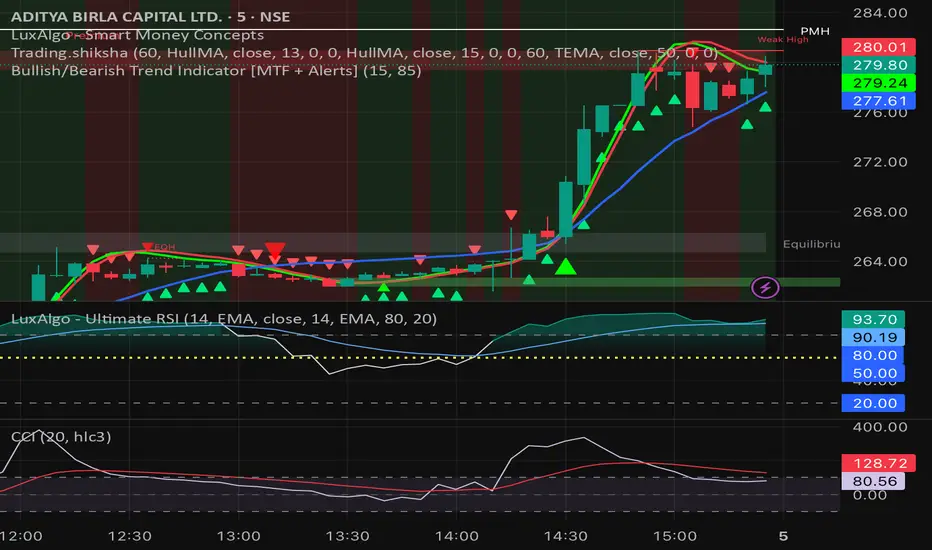
Bullish/Bearish Trend Indicator [MTF + Alerts] by Dow theory Summary of Logic:
✅ Bullish Trend:
Setup Bar: High > Previous High AND Low ≥ Previous Low
Confirmation Bar: High > Highest High of last 3 candles, Low ≥ Setup Bar Low
Trend Continues Until: Latest candle breaks 2nd last candle’s low → then trend becomes Bearish
🔻 Bearish Trend:
Setup Bar: Low < Previous Low AND High ≤ Previous High
Confirmation Bar: Low < Lowest Low of last 3 candles, High ≤ Setup Bar High
Trend Continues Until: Latest candle breaks 2nd last candle’s high → then trend becomes Bullish
ATR % of yesterday close with SMA (Bull/Bear colored)This script visualizes the Average True Range (ATR) as a percentage of a user-selected price point for a quick view of volatility.
ATR % values are plotted as a color-coded histogram. Bullish days (close > prior close) paint the bar green; bearish days (close < prior close) paint it red; unchanged days are gray.
Two simple moving average (SMA) overlays to reveal volatility trends.
Variables:
Histogram bars represent ATR as a % of one of:
- Previous Close (default option)
- Previous Open
- Today Close
- Today Open
Two SMA lines (default: blue for 20-period, orange for 5-period) shown on ATR % for trend/range regime tracking.
Optionally display the ATR % in continuous line (yellow)—hidden by default.
If you find it helpful, feel free to share any feedback and how you incorporate it into your trading strategy with the community!

Bullish & Bearish Wick MarkerMarks bullish and bearish engulfing candles
Bullish engulfing candle:
when the low is lower than the previous candle low and the body close is higher than the previous candle body
Bearish engulfing cande:
when the high is higher than the previous candle high and the body close is lower than the previous candle body
