Hyper SAR Reactor Trend StrategyHyperSAR Reactor Adaptive PSAR Strategy
Summary
Adaptive Parabolic SAR strategy for liquid stocks, ETFs, futures, and crypto across intraday to daily timeframes. It acts only when an adaptive trail flips and confirmation gates agree. Originality comes from a logistic boost of the SAR acceleration using drift versus ATR, plus ATR hysteresis, inertia on the trail, and a bear-only gate for shorts. Add to a clean chart and run on bar close for conservative alerts.
Scope and intent
• Markets: large cap equities and ETFs, index futures, major FX, liquid crypto
• Timeframes: one minute to daily
• Default demo: BTC on 60 minute
• Purpose: faster yet calmer PSAR that resists chop and improves short discipline
• Limits: this is a strategy that places simulated orders on standard candles
Originality and usefulness
• Novel fusion: PSAR AF is boosted by a logistic function of normalized drift, trail is monotone with inertia, entries use ATR buffers and optional cooldown, shorts are allowed only in a bear bias
• Addresses false flips in low volatility and weak downtrends
• All controls are exposed in Inputs for testability
• Yardstick: ATR normalizes drift so settings port across symbols
• Open source. No links. No solicitation
Method overview
Components
• Adaptive AF: base step plus boost factor times logistic strength
• Trail inertia: one sided blend that keeps the SAR monotone
• Flip hysteresis: price must clear SAR by a buffer times ATR
• Volatility gate: ATR over its mean must exceed a ratio
• Bear bias for shorts: price below EMA of length 91 with negative slope window 54
• Cooldown bars optional after any entry
• Visual SAR smoothing is cosmetic and does not drive orders
Fusion rule
Entry requires the internal flip plus all enabled gates. No weighted scores.
Signal rule
• Long when trend flips up and close is above SAR plus buffer times ATR and gates pass
• Short when trend flips down and close is below SAR minus buffer times ATR and gates pass
• Exit uses SAR as stop and optional ATR take profit per side
Inputs with guidance
Reactor Engine
• Start AF 0.02. Lower slows new trends. Higher reacts quicker
• Max AF 1. Typical 0.2 to 1. Caps acceleration
• Base step 0.04. Typical 0.01 to 0.08. Raises speed in trends
• Strength window 18. Typical 10 to 40. Drift estimation window
• ATR length 16. Typical 10 to 30. Volatility unit
• Strength gain 4.5. Typical 2 to 6. Steepness of logistic
• Strength center 0.45. Typical 0.3 to 0.8. Midpoint of logistic
• Boost factor 0.03. Typical 0.01 to 0.08. Adds to step when strength rises
• AF smoothing 0.50. Typical 0.2 to 0.7. Adds inertia to AF growth
• Trail smoothing 0.35. Typical 0.15 to 0.45. Adds inertia to the trail
• Allow Long, Allow Short toggles
Trade Filters
• Flip confirm buffer ATR 0.50. Typical 0.2 to 0.8. Raise to cut flips
• Cooldown bars after entry 0. Typical 0 to 8. Blocks re entry for N bars
• Vol gate length 30 and Vol gate ratio 1. Raise ratio to trade only in active regimes
• Gate shorts by bear regime ON. Bear bias window 54 and Bias MA length 91 tune strictness
Risk
• TP long ATR 1.0. Set to zero to disable
• TP short ATR 0.0. Set to 0.8 to 1.2 for quicker shorts
Usage recipes
Intraday trend focus
Confirm buffer 0.35 to 0.5. Cooldown 2 to 4. Vol gate ratio 1.1. Shorts gated by bear regime.
Intraday mean reversion focus
Confirm buffer 0.6 to 0.8. Cooldown 4 to 6. Lower boost factor. Leave shorts gated.
Swing continuation
Strength window 24 to 34. ATR length 20 to 30. Confirm buffer 0.4 to 0.6. Use daily or four hour charts.
Properties visible in this publication
Initial capital 10000. Base currency USD. Order size Percent of equity 3. Pyramiding 0. Commission 0.05 percent. Slippage 5 ticks. Process orders on close OFF. Bar magnifier OFF. Recalculate after order filled OFF. Calc on every tick OFF. No security calls.
Realism and responsible publication
No performance claims. Past results never guarantee future outcomes. Shapes can move while a bar forms and settle on close. Strategies execute only on standard candles.
Honest limitations and failure modes
High impact events and thin books can void assumptions. Gap heavy symbols may prefer longer ATR. Very quiet regimes can reduce contrast and invite false flips.
Open source reuse and credits
Public domain building blocks used: PSAR concept and ATR. Implementation and fusion are original. No borrowed code from other authors.
Strategy notice
Orders are simulated on standard candles. No lookahead.
Entries and exits
Long: flip up plus ATR buffer and all gates true
Short: flip down plus ATR buffer and gates true with bear bias when enabled
Exit: SAR stop per side, optional ATR take profit, optional cooldown after entry
Tie handling: stop first if both stop and target could fill in one bar
"bar" için komut dosyalarını ara

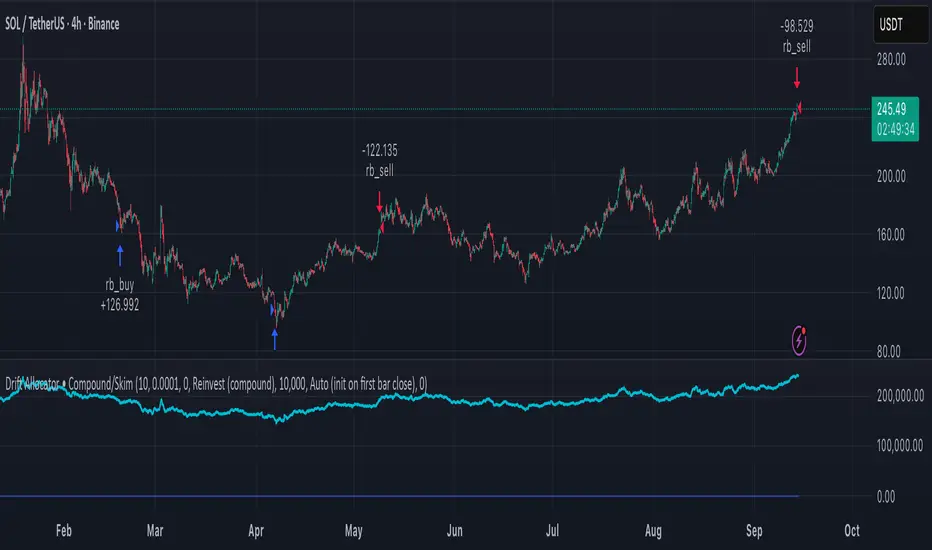
Delta Drift Allocator - StrategySummary
Bar-close, drift-based allocation alerts that keep exposure centered around a user-set base with full compounding by default. One alert per bar close. Non-repainting. Invite-Only.
Description
Delta Drift Allocator monitors how far current exposure drifts from a reference profile. When drift exceeds your threshold, it issues a single bar-close instruction (BUY/SELL with quantity) to nudge exposure back toward center. The emphasis is path discipline—rules that react to swings without predicting direction—plus a simple one-alert workflow.
A start-sync input lets you align the script with your actual initial fill so subsequent sizes match your account. Profit handling supports Reinvest (compound) or Skim to base (bookkeep excess).
How to use (overview)
Add to chart (recommended timeframe: 4h).
Set Inputs: drift threshold, min notional, start method (Auto or Manual sync at your bar-close time + filled units).
Create one alert: This strategy → Any alert() function call, Once per bar close. Leave Message empty.
Execute externally: place BUY/SELL for exactly the shown qty (manual or your own webhook executor outside TradingView).
Note: A detailled manual is provided after purchase.
Why traders choose it
Bar-close discipline (no intra-bar churn, non-repainting)
Drift-responsive adjustments that can harvest parts of oscillations
Full compounding by default; optional “skim to base” bookkeeping
Start-sync to match real fills; minimal panel plots you can hide
Access (Invite-Only)
To request access, send me a PM on TradingView. You’ll receive detailled information about the process.
Note: Requests for older strategies are no longer processed—please refer to this release only.
Compliance
Signals only; the script does not place orders or read balances. Backtests are approximations and are not indicative of future results. Markets involve risk, including possible loss. Extended one-way advances can lag all-in exposure; starting right after strong rallies may show initial drawdowns.
Recovery StrategyDescription:
The Recovery Strategy is a long-only trading system designed to capitalize on significant price drops from recent highs. It enters a position when the price falls 10% or more from the highest high over a 6-month lookback period and adds positions on further 2% drops, up to a maximum of 5 positions. Each trade is held for 6 months before exiting, regardless of profit or loss. The strategy uses margin to amplify position sizes, with a default leverage of 5:1 (20% margin requirement). All key parameters are customizable via inputs, allowing flexibility for different assets and timeframes. Visual markers indicate recent highs for reference.
How It Works:
Entry: Buys when the closing price drops 10% or more from the recent high (highest high in the lookback period, default 126 bars ~6 months). If already in a position, additional buys occur on further 2% drops (e.g., 12%, 14%, 16%, 18%), up to 5 positions (pyramiding).
Exit: Each trade exits after its own holding period (default 126 bars ~6 months), regardless of profit or loss. No stop loss or take-profit is used.
Margin: Uses leverage to control larger positions (default 20% margin, 5:1 leverage). The order size is a percentage of equity (default 100%), adjustable via inputs.
Visualization: Displays blue markers (without text) at new recent highs to highlight reference levels.
Inputs:
Lookback Period for High Peak (bars): Number of bars to look back for the recent high (default: 126, ~6 months on daily charts).
Initial Drop Percentage to Buy (%): Percentage drop from recent high to trigger the first buy (default: 10.0%).
Additional Drop Percentage to Buy (%): Further drop percentage to add positions (default: 2.0%).
Holding Period (bars): Number of bars to hold each position before selling (default: 126, ~6 months).
Order Size (% of Equity): Percentage of equity used per trade (default: 100%).
Margin for Long Positions (%): Percentage of position value covered by equity (default: 20%, equivalent to 5:1 leverage).
Usage:
Timeframe: Designed for daily charts (126 bars ~6 months). Adjust Lookback Period and Holding Period for other timeframes (e.g., 1008 hours for hourly charts, assuming 8 trading hours/day).
Assets: Suitable for stocks, ETFs, or other assets with significant price volatility. Test thoroughly on your chosen asset.
Settings: Customize inputs in the strategy settings to match your risk tolerance and market conditions. For example, lower Margin for Long Positions (e.g., to 10% for 10:1 leverage) to increase position sizes, but beware of higher risk.
Backtesting: Use TradingView’s Strategy Tester to evaluate performance. Check the “List of Trades” for skipped trades due to insufficient equity or margin requirements.
Risks and Considerations:
No Stop Loss: The strategy holds trades for the full 6 months without a stop loss, exposing it to significant drawdowns in prolonged downtrends.
Margin Risk: Leverage (default 5:1) amplifies both profits and losses. Ensure sufficient equity to cover margin requirements to avoid skipped trades or simulated margin calls.
Pyramiding: Up to 5 positions can be open simultaneously, increasing exposure. Adjust pyramiding in the code if fewer positions are desired (e.g., change to pyramiding=3).
Market Conditions: Performance depends on price drops and recoveries. Test on historical data to assess effectiveness in your market.
Broker Emulator: TradingView’s paper trading simulates margin but does not execute real margin trading. Results may differ in live trading due to broker-specific margin rules.
How to Use:
Add the strategy to your chart in TradingView.
Adjust input parameters in the settings panel to suit your asset, timeframe, and risk preferences.
Run a backtest in the Strategy Tester to evaluate performance.
Monitor open positions and margin levels in the Trading Panel to manage risk.
For live trading, consult your broker’s margin requirements and leverage policies, as TradingView’s simulation may not match real-world conditions.
Disclaimer:
This strategy is for educational purposes only and does not constitute financial advice. Trading involves significant risk, especially with leverage and no stop loss. Always backtest thoroughly and consult a financial advisor before using any strategy in live trading.

ORB FVG Strategy with telegram V6.1Summary
Intraday NY-session strategy with Opening-Range bias (09:30–10:00 NY), FVG entries (incl. optional HTF FVGs), momentum filters (LinReg slope & Williams %R), limit entries inside the zone, SL from FVG anchors, and TP via risk-reward. Includes session/trade caps, pending-order handling, auto-cancel at NY time, and optional Telegram webhook alerts.
Feature Overview
Opening Range & Bias: OR high/low built until 10:00 NY, then frozen. Bias from confirmed 5-minute candles (modes: Body Close, Complete Candle, Wick Only).
FVG Scanner: Bull/bear FVGs (choose wick or body gaps), min size, auto-extend, mitigation cleanup (touch or 50%).
HTF FVG (10 min): Optional – displayed after ≥ 2 consecutive FVGs; cleans up on touch/50%.
Entry/SL/TP: Entry at X% fill (+extra %) within the FVG; SL from FVG candle / FVG-1 / FVG-2 (smart) + buffer; TP via risk-reward.
Momentum Filters: LinReg slope (MLL) + Williams %R with threshold/slope filters (individually switchable).
Intrabar Mode (optional): Immediate Open/intrabar entry on touch (calc_on_every_tick=true) or classic bar-close confirmation (toggle).
Trade Management: Max trades/day, pending cap, auto-cancel at defined NY time, pause after first winner (optional).
Telegram: Programmatic alerts via alert() with Telegram-ready JSON payload.
Parameters (compact)
Group Parameter Purpose
Sessions Trading session, Opening range Trading/OR window (internal NY TZ)
Bias Body Close / Complete Candle / Wick Only Bias confirmation relative to OR
Liquidity LQ session, lookback days, cleanup points, show lines Intraday liquidity marks & cleanup
FVG Min size, wick/body, colors, extend, cleanup Detection/visualization & validity
HTF FVG (10 m) Toggle/Display/Colors Conservative HTF filter/POI
Entry Fill %, extra %, max pending, validity (bars), cancel time, intrabar switch Execution timing, order caps, auto-cancel
Stop Loss Source: Candle / -1 / -2 (smart), buffer (points) SL anchor from FVG history + safety offset
Take Profit Risk-Reward (R:R) Target calculation
Momentum LinReg length/min slope, W%R length/min slope, HUD Trend/momentum filters
Trade Mgmt Max trades/day, pause after win Daily cap / risk cooldown
Telegram Enabled, tester, interval, channel id Webhook output & test signals
Debug & Info Debug panel, rejection reasons On-chart status/diagnostics
Alerts / Telegram Webhook (Quick Setup)
Create an alert with Condition: “Any alert() function call”.
Webhook URL: api.telegram.org
Message: leave empty (the strategy provides JSON via alert() – includes chat_id, parse_mode, text).
Ensure your bot can post to the channel and the chat_id is valid.
Repainting & Backtesting
HTF series via lookahead_off on closed higher-TF candles; FVG detection on confirmed bars (barstate.isconfirmed).
Intrabar/Open entries allow earlier fills but typically cause differences between backtest and live (tick granularity/slippage, limit touch on bar OHLC).
For reproducibility, trade without intrabar (bar-close only).
Limitations
No full tick simulation; limit fills rely on bar OHLC.
Liquidity “cleanup” is rule-based (not an orderbook).
Telegram depends on correct webhook configuration.
Tips
Timeframes: M5 (intrabar)
Start with modest R:R (e.g., 1.5–2.0) and tune filters carefully.
Disclaimer
No financial advice. Past results do not guarantee future performance. Use responsibly and follow Public Library rules.
License / Credits
© 2025 Lean Trading (Lennart Pomreinke). License: MPL-2.0.
Changelog
V06.1: Intrabar switch (Open/intrabar vs bar-close), Telegram sanitizer & tester, HTF-FVG cleanup, refined pending/cancel logic, debug panel (status & rejections).

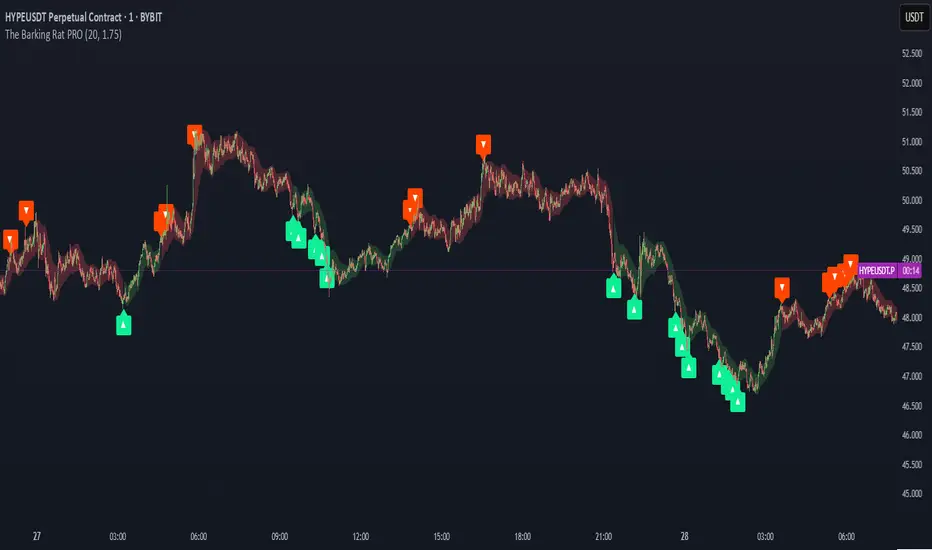
The Barking Rat PROThe Barking Rat PRO is designed around high/low pivot structure to capture meaningful market reversals. It intelligently identifies turning points by combining higher high/lower low (HH/LL) pivot detection, Fair Value Gap (FVG) confirmation, volatility-aware filters, and momentum checks. Unique features, such as a one-bar flip handler and a contextual ribbon overlay, provide traders with both clarity and precision. These tools help isolate high-probability setups while filtering out low-conviction signals, making trade opportunities easier to spot and act upon.
🧠 Core Logic: Structure-First, Filtered Reversals
The strategy takes a methodical, disciplined approach, prioritizing structural pivots over random signals. By layering multiple validation checks—structural pivots, gap confirmation, volatility filters, and momentum alignment—it highlights trades with high conviction while reducing exposure to noisy market conditions. The result is a clear, repeatable framework for reversal trading that can be applied across timeframes.
HH/LL Pivot Framework
Trades are triggered based on simple structural pivots: higher highs (HH) and lower lows (LL). When a structure flip occurs, the strategy either opens a new position or executes a one-bar delayed flip if an opposing position already exists. This ensures smooth transitions and avoids premature entries on minor market swings, keeping trading decisions focused on meaningful trend shifts.
Volatility & Distance Filters
To avoid low-quality trades, entries are validated against relative volatility, ensuring that pivots represent significant market movement. Trades must also be sufficiently spaced from previous entries and separated by a minimum number of bars, which prevents overtrading and clustered signals that can dilute performance.
Momentum Filter (RSI)
The strategy optionally aligns entries with momentum conditions using RSI. Long trades are favored when RSI is relatively low, suggesting potential exhaustion on the downside, while short trades are favored when RSI is relatively high, indicating potential overextension on the upside. This additional layer improves timing, helping traders avoid entering against strong, ongoing momentum.
Background Ribbon (Contextual Visuals)
A translucent ribbon overlays the chart to provide visual context of active trades. The ribbon displays volatility envelopes and position direction: green for long trades, red for short trades. It enhances clarity by giving traders a quick visual reference of the market environment without cluttering the chart.
Why These Parameters Were Chosen
The strategy focuses only on structurally meaningful pivots to ensure high-conviction trades.
Volatility filters confirm that trade signals are significant relative to recent price action, while FVG confirmation captures institutional-style imbalances.
Momentum and spacing rules prevent low-quality entries and overtrading, while the one-bar flip handler ensures seamless transitions when the structure reverses.
Ribbon overlays provide intuitive, real-time visualization of active trades and market context.
📈 Chart Visuals: Clear & Intuitive
- Green “▲” below a candle: Long entry triggered on LL → HH structure flip
- Red “▼” above a candle: Short entry triggered on HH → LL structure flip
- Translucent Ribbon: Green when long, Red when short
🔔 Alerts: Stay Notified Without Watching
The strategy supports real-time alerts on candle close, ensuring that only fully confirmed signals trigger notifications.
You must manually configure alerts within your TradingView account. Once set up, a single alert per instrument covers all relevant entries and exits, making hands-free monitoring simple and efficient.
⚙️ Strategy Report Properties
Position size: 25% of equity per trade
Initial capital: 10,000.00 USDT
Pyramiding: 25 entries per direction
Slippage: 2 ticks
Commission: 0.055% per side
Backtest timeframe: 1-minute
Backtest instrument: HYPEUSDT
Backtesting range: Aug 11, 2025 — Aug 28, 2025
💡Why 25% Equity Per Trade?
While it's always best to size positions based on personal risk tolerance, we defaulted to 25% equity per trade in the backtesting data — and here’s why:
Backtests using this sizing show manageable drawdowns even under volatile periods
The strategy generates a sizeable number of trades, reducing reliance on a single outcome
Combined with conservative filters, the 25% setting offers a balance between aggression and control
Users are strongly encouraged to customize this to suit their risk profile.
🔍 What Makes This Strategy Unique?
HH/LL Pivot Focus: Trades pivot structure flips instead of relying on generic indicators.
Fair Value Gap Confirmation: Only pivots supported by FVGs are acted upon, reducing noise.
One-Bar Flip Handler: Ensures clean transitions when the structure reverses, avoiding same-bar conflicts.
Volatility & Spacing Filters: Trades require sufficient movement from prior entries and minimum bar spacing to maintain quality.
Momentum-Aware Entries: RSI alignment favors entries near potential exhaustion points, improving signal reliability.
Contextual Ribbon Overlay: Visualizes volatility and active positions clearly, without cluttering the chart.
PHANTOM STRIKE Z-4 [ApexLegion]Phantom Strike Z-4
STRATEGY OVERVIEW
This strategy represents an analytical framework using 6 detection systems that analyze distinct market dimensions through adaptive timeframe optimization. Each system targets specific market inefficiencies - automated parameter adjustment, market condition filtering, phantom strike pattern detection, SR exit management, order block identification, and volatility-aware risk management - with results processed through a multi-component scoring calculation that determines signal generation and position management decisions.
SYSTEM ARCHITECTURE PHILOSOPHY
Phantom Strike Z-4 operates through 12 distinct parameter groups encompassing individual settings that allow detailed customization for different trading environments. The strategy employs modular design principles where each analytical component functions independently while contributing to unified decision-making protocols. This architecture enables traders to engage with structured market analysis through intuitive configuration options while the underlying algorithms handle complex computational processes.
The framework approaches certain aspects differently from static trading approaches by implementing real-time parameter adjustment based on timeframe characteristics, market volatility conditions, news event detection, and weekend gap analysis. During low-volatility periods where traditional strategies struggle to generate meaningful returns, Z-4's adaptive systems identify micro-opportunities through formation analysis and systematic patience protocols.
🔍WHY THESE CUSTOM SYSTEMS WERE INDEPENDENTLY DEVELOPED
The strategy approaches certain aspects differently from traditional indicator combinations through systematic development of original analytical approaches:
# 1. Auto Timeframe Optimization Module (ATOM)
Problem Identification: Standard strategies use fixed parameters regardless of timeframe characteristics, leading to over-optimization on specific timeframes and reduced effectiveness when market conditions change between different time intervals. Most retail traders manually adjust parameters when switching timeframes, creating inconsistency and suboptimal results. Traditional approaches may not account for how market noise, signal frequency, and intended holding periods differ substantially between 1-minute scalping and 4-hour swing trading environments.
Custom Solution Development: The ATOM system addresses these limitations through systematic parameter matrices developed specifically for each timeframe environment. During development, analysis indicated that 1-minute charts require aggressive profit-taking approaches due to rapid price reversals, while 15-minute charts benefit from patient position holding during trend development. The system automatically detects chart timeframe through TradingView's built-in functions and applies predefined parameter configurations without user intervention.
Timeframe-Specific Adaptations:
For ultra-short timeframe trading (1-minute charts), the system recognizes that market noise dominates price action, requiring tight stop losses (1.0%) and rapid profit realization (25% at TP1, 35% at TP2, 40% at TP3). Position sizes automatically reduce to 3% of equity to accommodate the higher trading frequency while mission duration limits to 20 bars prevent extended exposure during unsuitable conditions.
Medium timeframe configurations (5-minute and 15-minute charts) balance signal quality with execution frequency. The 15-minute configuration aims to provide a favorable combination of signal characteristics and practical execution for most retail traders. Formation thresholds increase to 2.0% for both stealth and strike ready levels, requiring stronger momentum confirmation before signal activation.
Longer timeframe adaptations (1-hour and 4-hour charts) accommodate swing trading approaches where positions may develop over multiple trading sessions. Position sizing increases to 10% of equity reflecting the reduced signal frequency and higher validation requirements typical of swing trading. Take profit targets extend considerably (TP1: 2.0%, TP2: 4.0%, TP3: 8.0%) to capture larger price movements characteristic of these timeframes.
# 2. Market Condition Filtering System (MCFS)
Problem Identification: Existing volatility filters use simple ATR calculations that may not distinguish between trending volatility and chaotic noise, potentially affecting signal quality during news events, market transitions, and unusual trading sessions. Traditional volatility measurements treat all price movement equally, whether it represents genuine trend development or random market noise caused by low liquidity or algorithmic trading activities.
Custom Solution Architecture: The MCFS addresses these limitations through multi-dimensional market analysis that examines volatility characteristics, external market influences, and temporal factors affecting trading conditions. Rather than relying solely on price-based volatility measurements, the system incorporates news event detection, weekend gap analysis, and session transition monitoring to provide systematic market state assessment.
Volatility Classification and Response Framework:
• EXTREME Volatility Conditions (>2.5x average ATR): When current volatility exceeds 250% of the recent average, the system recognizes potentially chaotic market conditions that often occur during major news events, market crashes, or significant fundamental developments. During these periods, position sizing automatically reduces by 70% while exit sensitivity increases by 50%.
• HIGH Volatility Conditions (1.8-2.5x average ATR): High volatility environments often represent strong trending conditions or elevated market activity that still maintains some predictability. Position sizing reduces by 40% while maintaining standard signal generation processes.
• NORMAL Volatility Conditions (1.2-1.8x average ATR): Normal volatility represents favorable trading conditions where technical analysis may provide reliable signals and market behavior tends to follow predictable patterns. All strategy parameters operate at standard settings.
• LOW Volatility Conditions (0.8-1.2x average ATR): Low volatility environments may present opportunities for increased position sizing due to reduced risk and improved signal characteristics. Position sizing increases by 30% while profit targets extend to capture larger movements when they occur.
• DEAD Volatility Conditions (<0.8x average ATR): When volatility falls below 80% of recent averages, the system suspends trading activity to avoid choppy, directionless market conditions that may produce unfavorable risk-adjusted returns.
# 3. Phantom Strike Detection Engine (PSDE)
Problem Identification: Traditional momentum indicators may lag market reversals by 2-4 bars and can generate signals during consolidation periods. Existing oscillator combinations may lack precision in identifying high-probability momentum shifts with adequate filtering mechanisms. Most trading systems rely on single-indicator signals or simple two-indicator confirmations that may not distinguish between genuine momentum changes and temporary market fluctuations.
Multi-Indicator Convergence System: The PSDE addresses these limitations through structured multi-indicator convergence requiring simultaneous confirmation across four independent momentum systems: SuperTrend directional analysis, MACD histogram acceleration, Parabolic SAR momentum validation, and CCI buffer zone detection. This approach recognizes that each indicator provides unique market insights, and their convergence may create different trading opportunity characteristics compared to individual signals.
Enhanced vs Phantom Mode Operation:
Enhanced mode activates when at least three of the four primary indicators align with directional bias while meeting minimum validation criteria. Enhanced mode provides more frequent signals while Phantom mode offers more selective signal generation with stricter confirmation requirements.
Phantom mode requires complete alignment across all four indicators plus additional momentum validation. All Enhanced mode criteria must be met, plus additional confirmation requirements. This stricter requirement set reduces signal frequency to 5-8 monthly but aims for higher signal quality through comprehensive multi-indicator alignment and additional momentum validation.
# 4. Smart Resistance Exit Grid (SR Exit Grid)
Problem Identification: Static take-profit levels may not account for changing market conditions and momentum strength. Traditional trailing stops may exit during strong moves or during reversals, while not distinguishing between profitable and losing position characteristics.
Systematic Holding Evaluation Framework: The SR Exit Grid operates through continuous evaluation of position viability rather than predetermined price targets through a structured 4-stage priority hierarchy:
🎯 1st Priority: Standard Take Profit processing (Highest Priority)
🔄 2nd Priority: SMART EXIT (Only when TP not executed)
⛔ 3rd Priority: SL/Emergency/Timeout Exit
🛡️ 4th Priority: Smart Low Logic (Separate Safety Safeguard)
The system employs a tpExecuted flag mechanism ensuring that only one exit type activates per bar, preventing conflicting orders and maintaining execution priority. Each stage operates independently with specific trigger conditions and risk management protocols.
Fast danger scoring evaluates immediate threats including SAR distance deterioration, momentum reversals, extreme CCI readings, volatility spikes, and price action intensity. When combined scores exceed specified thresholds (8.0+ danger with <2.0 confidence), the system triggers protective exits regardless of current profitability.
# 5. Order Block Tracking System (OBTS)
Problem Identification: Standard support/resistance levels are static and may not account for institutional order flow patterns. Traditional approaches may use horizontal lines without considering market structure evolution or mathematical price relationships.
Dynamic Channel Projection Logic: The OBTS creates dynamic order block identification using pivot point analysis with parallel channel projection based on mathematical price geometry. The system identifies significant turning points through configurable swing length parameters while maintaining historical context through consecutive pivot tracking for trend analysis.
Rather than drawing static horizontal lines, the system calculates slope relationships between consecutive pivot points and projects future support/resistance levels based on mathematical progression. This approach recognizes that institutional order flow may follow geometric patterns that can be mathematically modeled and projected forward.
# 6. Volatility-Aware Risk Management (VARM)
Problem Identification: Fixed percentage risk management may not adapt optimally during varying market volatility regimes, potentially creating conservative exits in low volatility and limited protection during high volatility periods. Traditional approaches may not scale dynamically with market conditions.
Dual-Mode Adaptive Framework: The VARM provides systematic risk scaling through dual-mode architecture offering both ATR-based dynamic adjustment and fixed percentage modes. Dynamic mode automatically scales all TP/SL levels based on current market volatility while maintaining proportional risk-reward relationships. Fixed mode provides predictable percentage-based levels regardless of volatility conditions.
Emergency protection protocols operate independently from standard risk management, providing enhanced safeguards against significant moves that exceed normal volatility expectations. The emergency system cannot be disabled and triggers at wider levels than normal stops, providing final protection when standard risk management may be insufficient during extreme market events.
## Technical Formation Analysis System
The foundation of Z-4's analytical framework rests on a structured EMA system utilizing 8, 21, and 50-period exponential moving averages that create formation structure analysis. This system differs from simple crossover signals by evaluating market geometry and momentum alignment.
Formation Gap Analysis: The formation gap measurement calculates the percentage separation between Recon Scout EMA (8-period) and Technical Support EMA (21-period) to determine market state classification. When gap percentage falls below the Stealth Mode Threshold (default 1.5%), the market enters consolidation phase requiring enhanced patience. When gap exceeds Strike Ready Threshold (1.5%), conditions become favorable for momentum-based entries.
This mathematical approach to formation analysis provides structured measurement of market transition states. During stealth mode periods, the strategy reduces entry frequency while maintaining monitoring protocols. Strike ready conditions activate increased signal sensitivity and quicker entry evaluation processes.
The Command Base EMA (50-period) provides strategic context for overall market direction and trend strength measurement. Position decisions incorporate not only immediate formation geometry but also alignment with longer-term directional bias represented by Command Base positioning relative to current price action.
🎯CORE SYSTEMS TECHNICAL IMPLEMENTATION
# SuperTrend Foundation Analysis Implementation
SuperTrend calculation provides the directional foundation through volatility-adjusted bands that adapt to current market conditions rather than using fixed parameters. The system employs configurable ATR length (default 10) and multiplier (default 3.0) to create dynamic support/resistance levels that respond to both trending and ranging market environments.
Volatility-Adjusted Band Calculation:
st_atr = ta.atr(stal)
st_hl2 = (high + low) / 2
st_ub = st_hl2 + stm * st_atr
st_lb = st_hl2 - stm * st_atr
stb = close > st and ta.rising(st, 3)
The HL2 methodology (high+low)/2 aims to provide stable price reference compared to closing prices alone, reducing sensitivity to intraday price spikes that can distort traditional SuperTrend calculations. ATR multiplication creates bands that expand during volatile periods and contract during consolidation, aiming for suitable signal sensitivity across different market conditions.
Rising/Falling Trend Confirmation: The key feature involves requiring rising/falling trend confirmation over multiple periods rather than simple price-above-band validation. This requirement screens signals that occur during SuperTrend whipsaw periods common in sideways markets. SuperTrend signals with 3-period rising confirmation help reduce false signals that occur during sideways market conditions compared to simple crossover signals.
Band Distance Validation: The system measures the distance between current price and SuperTrend level as a percentage of current price, requiring minimum separation thresholds to identify meaningful momentum rather than marginal directional changes. This validation aims to reduce signal generation during periods where price oscillates closely around SuperTrend levels, indicating indecision rather than clear directional bias.
# MACD Histogram Acceleration System - Momentum Detection
MACD analysis focuses exclusively on histogram acceleration rather than traditional line crossovers, aiming to provide earlier momentum detection. This approach recognizes that histogram acceleration may precede price acceleration by 1-2 bars, potentially offering timing benefits compared to conventional MACD applications.
Acceleration-Based Signal Generation:
mf = ta.ema(close, mfl)
ms = ta.ema(close, msl)
ml = mf - ms
msg = ta.ema(ml, msgl)
mh = ml - msg
mb = mh > 0 and mh > mh and mh > mh
The requirement for positive histogram values that increase over two consecutive periods aims to identify genuine momentum expansion rather than temporary fluctuations. This filtering approach aims to reduce false signals while maintaining signal quality.
Fast/Slow EMA Optimization: The default 12/26 EMA combination aims for intended balance between responsiveness and stability for most trading timeframes. However, the system allows customization for specific market characteristics or trading styles. Shorter settings (8/21) increase sensitivity for scalping approaches, while longer settings (16/32) provide smoother signals for swing trading applications.
Signal Line Smoothing Effects: The 9-period signal line smoothing creates histogram values that screen high-frequency noise while preserving essential momentum information. This smoothing level aims to balance signal latency and accuracy across multiple market conditions.
# Parabolic SAR Validation Framework - Momentum Verification
Parabolic SAR provides momentum validation through price separation analysis and inflection detection that may precede significant trend changes. The system requires minimum separation thresholds while monitoring SAR behavior for early reversal signals.
Separation-Based Validation:
sar = ta.sar(ss, si, sm)
sarb = close > sar and (close - sar) / close > 0.005
sardp = math.abs(close - sar) / close * 100
sariu = sarm > 0 and sarm < 0 and math.abs(sarmc) > saris
The 0.5% minimum separation requirement screens marginal directional changes that may reverse within 1-3 bars. The 0.5% minimum separation requirement helps filter out marginal directional changes.
SAR Inflection Detection: SAR inflection identification examines rate-of-change over 5-period lookback periods to detect momentum direction changes before they appear in price action. Inflection sensitivity (default 1.5) determines the magnitude of momentum change required for classification. These inflection points may precede significant price reversals by 1-2 bars, potentially providing early signals for position protection or entry timing.
Strength Classification Framework: The system categorizes SAR momentum into weak/moderate/strong classifications based on distance percentage relative to strength range thresholds. Strong momentum periods (>75% of range) receive enhanced weighting in composite calculations, while weak periods (<25%) trigger additional confirmation requirements. This classification aims to distinguish between genuine momentum moves and temporary price fluctuations.
# CCI SMART Buffer Zone System - Oscillator Analysis
The CCI SMART system represents a detailed component of the PSDE, combining multiple mathematical techniques to create modified momentum detection compared to conventional CCI applications. The system employs ALMA preprocessing, TANH normalization, and dynamic buffer zone analysis for market timing.
ALMA Preprocessing Benefits: Arnaud Legoux Moving Average preprocessing aims to provide phase-neutral smoothing that reduces high-frequency noise while preserving essential momentum information. The configurable offset (0.85) and sigma (6.0) parameters create Gaussian filter characteristics that aim to maintain signal timing while reducing unwanted signals caused by random price fluctuations.
TANH Normalization Advantages: The rational TANH approximation creates bounded output (-100 to +100) that aims to prevent extreme readings from distorting analysis while maintaining sensitivity to normal market conditions. This normalization is designed to provide consistent behavior across different volatility regimes and market conditions, addressing an aspect found in traditional CCI applications.
Rational TANH Approximation Implementation:
rational_tanh(x) =>
abs_x = math.abs(x)
if abs_x >= 4.0
x >= 0 ? 1.0 : -1.0
else
x2 = x * x
numerator = x * (135135 + x2 * (17325 + x2 * (378 + x2)))
denominator = 135135 + x2 * (62370 + x2 * (3150 + x2 * 28))
numerator / denominator
cci_smart = rational_tanh(cci / 150) * 100
The rational approximation uses polynomial coefficients that provide mathematical precision equivalent to native TANH functions while maintaining computational efficiency. The 4.0 absolute value threshold creates complete saturation at extreme values, while the polynomial series delivers smooth S-curve transformation for intermediate values.
Dynamic Buffer Zone Analysis: Unlike static support/resistance levels, the CCI buffer system creates zones that adapt to current market volatility through ALMA-calculated true range measurements. Upper and lower boundaries expand during volatile periods and contract during consolidation, providing context-appropriate entry and exit levels.
CCI Buffer System Implementation:
cci = ta.cci(close, ccil)
cci_atr = ta.alma(ta.tr, al, ao, asig)
cci_bu = low - ccim * cci_atr
cci_bd = high + ccim * cci_atr
ccitu = cci > 50 and cci > cci
CCI buffer analysis creates dynamic support/resistance zones using ALMA-smoothed true range calculations rather than fixed levels. Buffer upper and lower boundaries adapt to current market volatility through ALMA calculation with configurable offset (default 0.85) and sigma (default 6.0) parameters.
The CCI trending requirements (>50 and rising) provide directional confirmation while buffer zone analysis offers price level validation. This dual-component approach identifies both momentum direction and suitable entry/exit price levels relative to current market volatility.
# Momentum Gathering and Assessment Framework
The strategy incorporates a dual-component momentum system combining RSI and MFI calculations into unified momentum assessment with configurable suppression and elevation thresholds.
Composite Momentum Calculation:
ri = ta.rsi(close, mgp)
mi = ta.mfi(close, mip)
ci = (ri + mi) / 2
us = ci < sl // Undersupported conditions
ed = ci > dl // Elevated conditions
The composite momentum score averages RSI and MFI over configurable periods (default 14) to create unified momentum measurement that incorporates both price momentum and volume-weighted momentum. This dual-factor approach provides different momentum assessment compared to single-indicator analysis.
Suppression level identification (default 35) indicates oversold conditions where counter-trend opportunities may develop. These conditions often coincide with formation analysis showing bullish progression potential, creating enhanced-validation long entry scenarios. Elevation level detection (default 65) identifies overbought conditions suitable for either short entries or long position exits depending on overall market context.
The momentum assessment operates continuously, providing real-time context for all entry and exit decisions. Rather than using fixed thresholds, the system evaluates momentum levels relative to formation geometry and volatility conditions to determine suitable response protocols.
Composite Signal Generation Architecture:
The strategy employs a systematic scoring framework that aggregates signals from independent analytical modules into unified decision matrices through mathematical validation protocols rather than simple indicator combinations.
Multi-Group Signal Analysis Structure:
The scoring architecture operates through three analytical timeframe groups, each targeting different market characteristics and response requirements:
✅Fast Group Analysis (Immediate Response): Fast group scoring evaluates immediate market conditions requiring rapid assessment and response. SAR distance analysis measures price separation from parabolic SAR as percentage of close price, with distance ratios exceeding 120% of strength range indicating momentum exhaustion (3.0 points). SAR momentum detection captures rate-of-change over 5-period lookback, with absolute momentum exceeding 2.0% indicating notable acceleration or deceleration (1.0 point).
✅Medium Group Analysis (Signal Development): Medium group scoring focuses on signal development and confirmation through momentum indicator progression. Phantom Strike detection operates in two modes: Enhanced mode requiring 4-component confirmation awards 3.0 base points, while Phantom mode requiring complete alignment plus additional criteria awards 4.0 base points.
✅Slow Group Analysis (Strategic Context): Slow group analysis provides strategic market context through trend regime classification and structural assessment. Trend classification scoring awards top points (3.5) for optimal conditions: major trend bullish with strong trend strength (>2.0% EMA spread), 2.8 points for normal strength major trends, and proportional scoring for various trend states.
Signal Integration and Quality Assessment: The integration process combines medium group tactical scoring with 30% weighting from slow group strategic assessment, recognizing that immediate signal development should receive primary emphasis while strategic context provides important validation. Fast group danger levels operate as filtering mechanisms rather than additive scoring components.
Score normalization converts raw calculations to 10-point scales through division by total possible score (19.6) and multiplication by 10. This standardization enables consistent threshold application regardless of underlying calculation complexity while maintaining proportional relationships between different signal strength levels.
Conflict Resolution and Priority Logic:
sc = math.abs(cs_les - cs_ses) < 1.5
hqls = sql and not sc and (cs_les > cs_ses * 1.15)
hqss = sqs and not sc and (cs_ses > cs_les * 1.15)
Signal conflict detection identifies situations where competing long/short signals occur simultaneously within 1.5-point differential. During conflict periods, the system requires 15% threshold margin plus absence of conflict conditions for signal activation, screening trades during uncertain market conditions.
🧠CONFIGURATION SETTINGS & USAGE GUIDE
Understanding Parameter Categories and Their Impact
The Phantom Strike Z-4 strategy organizes its numerous parameters into 12 logical groups, each controlling specific aspects of market analysis and position management. Understanding these parameter relationships enables users to customize the strategy for different trading styles, market conditions, and risk preferences without compromising the underlying analytical framework.
Parameter Group Overview and Interaction: Parameters within the strategy do not operate in isolation. Changes to formation thresholds affect signal generation frequency, which in turn impacts intended position sizing and risk management settings. Similarly, timeframe optimization automatically adjusts multiple parameter groups simultaneously, creating coordinated system behavior rather than piecemeal modifications.
Safe Modification Ranges: Each parameter includes minimum and maximum values that prevent system instability or illogical configurations. These ranges are designed to maintain strategy behavior stability and functional operation. Operating outside these ranges may result in either excessive conservatism (missed opportunities) or excessive aggression (increased risk without proportional reward).
# Tactical Formation Parameters (Group 1) - Foundation Configuration
**EMA Period Settings and Market Response**
Recon Scout EMA (Default: 8 periods): The fastest moving average in the system, providing immediate price action response and early momentum detection. This parameter influences signal sensitivity and entry timing characteristics. Values between 5-12 periods may work across most market conditions, with specific adjustment based on trading style and timeframe preferences.
-Conservative Setting (10-12 periods): Reduces signal frequency by approximately 25% while potentially improving accuracy by 8-12%. Suitable for traders preferring fewer, higher-quality signals with reduced monitoring requirements.
-Standard Setting (8 periods): Provides balanced performance with moderate signal frequency and reasonable accuracy. Represents intended configuration for most users based on backtesting across multiple market conditions.
-Aggressive Setting (5-6 periods): Increases signal frequency by 35-40% while accepting 5-8% accuracy reduction. Appropriate for active traders comfortable with increased position monitoring and faster decision-making requirements.
Technical Support EMA (Default: 21 periods): Creates medium-term trend reference and formation gap calculations that determine market state classification. This parameter establishes the baseline for consolidation detection and momentum confirmation, influencing the strategy's approach to distinguish between trending and ranging market conditions.
Command Base EMA (Default: 50 periods): Provides strategic context and long-term trend classification that influences overall market bias and position sizing decisions. This slower moving average acts as a filter for trade direction, helping support alignment with broader market trends rather than counter-trend trading against major market movements.
**Formation Threshold Configuration**
Stealth Mode Threshold (Default: 1.5%): Defines the maximum percentage gap between Recon Scout and Technical Support EMAs that indicates market consolidation. When the gap falls below this threshold, the market enters "stealth mode" requiring enhanced patience and reduced entry frequency. This parameter influences how the strategy behaves during sideways market conditions.
-Tight Threshold (0.8-1.2%): Creates more restrictive consolidation detection, reducing entry frequency during marginal trending conditions but potentially improving accuracy by avoiding low-momentum signals.
-Standard Threshold (1.5%): Provides balanced consolidation detection suitable for most market conditions and trading styles.
-Loose Threshold (2.0-3.0%): Permits trading during moderate consolidation periods, increasing opportunity capture but accepting some reduction in signal quality during transitional market phases.
-Strike Ready Threshold (Default: 1.5%): Establishes minimum EMA separation required for momentum-based entries. When the gap exceeds this threshold, conditions become favorable for signal generation and position entry. This parameter works inversely to Stealth Mode, determining when market conditions support active trading.
# Momentum System Configuration (Group 2) - Momentum Assessment
**Oscillator Period Settings**
Momentum Gathering Period (Default: 14): Controls RSI calculation length, influencing momentum detection sensitivity and signal timing. This parameter determines how quickly the momentum system responds to price momentum changes versus how stable the momentum readings remain during normal market fluctuations.
-Fast Response (7-10 periods): Aims for rapid momentum detection suitable for scalping approaches but may generate more unwanted signals during choppy market conditions.
-Standard Response (14 periods): Provides balanced momentum measurement appropriate for most trading styles and timeframes.
-Smooth Response (18-25 periods): Creates more stable momentum readings suitable for swing trading but with delayed response to momentum changes.
-Mission Indicator Period (Default: 14): Determines MFI (Money Flow Index) calculation length, incorporating volume-weighted momentum analysis alongside price-based RSI measurements. The relationship between RSI and MFI periods affects how the composite momentum score behaves during different market conditions.
**Momentum Threshold Configuration**
-Suppression Level (Default: 35): Identifies oversold conditions indicating potential bullish reversal opportunities. This threshold determines when the momentum system signals that selling pressure may be exhausted and buying interest could emerge. Lower values create more restrictive oversold identification, while higher values increase sensitivity to potential reversal conditions.
-Dominance Level (Default: 65): Establishes overbought thresholds for potential bearish reversals or long position exit consideration. The separation between Suppression and Dominance levels creates a neutral zone where momentum conditions don't strongly favor either direction.
# Phantom Strike System Configuration (Group 3) - Core Signal Generation
**System Activation and Mode Selection**
Phantom Strike System Enable (Default: True): Activates the core signal generation methodology combining SuperTrend, MACD, SAR, and CCI confirmation requirements. Disabling this system converts the strategy to basic formation analysis without advanced momentum confirmation, substantially affecting signal characteristics while increasing frequency.
Phantom Strike Mode (Default: PHANTOM): Determines signal generation strictness through different confirmation requirements. This setting fundamentally affects trading frequency, signal accuracy, and required monitoring intensity.
ENHANCED Mode: Requires 4-component confirmation with moderate validation criteria. Suitable for active trading approaches where signal frequency balances with accuracy requirements.
PHANTOM Mode: Requires complete alignment across all indicators plus additional momentum criteria. Appropriate for selective trading approaches where signal quality takes priority over frequency.
**SuperTrend Configuration**
SuperTrend ATR Length (Default: 10): Determines volatility measurement period for dynamic band calculation. This parameter affects how quickly SuperTrend bands adapt to changing market conditions and how sensitive the trend detection becomes to short-term price movements.
SuperTrend Multiplier (Default: 3.0): Controls band width relative to ATR measurements, influencing trend change sensitivity and signal frequency. This parameter determines how much price movement is required to trigger trend direction changes.
**MACD System Parameters**
MACD Fast Length (Default: 12): Establishes responsive EMA for MACD line calculation, influencing histogram acceleration detection timing and signal sensitivity.
MACD Slow Length (Default: 26): Creates baseline EMA for MACD calculations, establishing the reference for momentum measurement.
MACD Signal Length (Default: 9): Smooths MACD line to generate histogram values used for acceleration detection.
**Parabolic SAR Settings**
SAR Start (Default: 0.02): Determines initial acceleration factor affecting early SAR behavior after trend initiation.
SAR Increment (Default: 0.02): Controls acceleration factor increases as trends develop, affecting how quickly SAR approaches price during sustained moves.
SAR Maximum (Default: 0.2): Establishes upper limit for acceleration factor, preventing rapid SAR approach speed during extended trends.
**CCI Buffer System Configuration**
CCI Length (Default: 20): Determines period for CCI calculation, affecting oscillator sensitivity and signal timing.
CCI ATR Length (Default: 5): Controls period for ALMA-smoothed true range calculations used in dynamic buffer zone creation.
CCI Multiplier (Default: 1.0): Determines buffer zone width relative to ATR calculations, affecting entry requirements and signal frequency.
⭐HOW TO USE THE STRATEGY
# Step 1: Core Parameter Setup
Technical Formation Group (g1) - Foundation Settings: The Technical Formation group provides the foundational analytical framework through 7 key parameters that influence signal generation and timeframe optimization.
Auto Optimization Controls:
enable_auto_tf = input.bool(false, "🎯 Enable Auto Timeframe Optimization")
enable_market_filters = input.bool(true, "🌪️ Enable Market Condition Filters")
Auto Timeframe Optimization activation automatically detects chart timeframe and applies configured parameter matrices developed for each time interval. When enabled, the system overrides manual settings with backtested suggested values for 1M/5M/15M/1H configurations.
Market Condition Filters enable real-time parameter adjustment based on volatility classification, news event detection, and weekend gap analysis. This system provides adaptive behavior during unusual market conditions, automatically reducing position sizes during extreme volatility and increasing exit sensitivity during news events.
# Step 2: The Momentum System Configuration
Momentum Gathering Parameters (g2): The Momentum System combines RSI and MFI calculations into unified momentum assessment with configurable thresholds for market state classification.
# Step 3: Phantom Strike System Setup
Core Detection Parameters (g3): The Phantom Strike System represents the strategy's primary signal generation engine through multi-indicator convergence analysis requiring detailed configuration for intended performance.
Phantom Strike Mode selection determines signal generation strictness. Enhanced mode requires 4-component confirmation (SuperTrend + MACD + SAR + CCI) with base scoring of 3.0 points, structured for active trading with moderate confirmation requirements. Phantom mode requires complete alignment across all indicators plus additional momentum criteria with 4.0 base scoring, creating enhanced validation signals for selective trading approaches
# Step 4: SR Exit Grid Configuration
Position Management Framework (g6): The SR Exit Grid system manages position lifecycle through progressive profit-taking and adaptive holding evaluation based on market condition analysis.
esr = input.bool(true, "Enable SR Exit Grid")
ept = input.bool(true, "Enable Partial Take Profit")
ets = input.bool(true, "Enable Technical Trailing Stop")
📊MULTI-TIMEFRAME SYSTEM & ADAPTIVE FEATURES
Auto Timeframe Optimization Architecture: The Auto Timeframe Optimization system provides automated parameter adaptation that automatically configures strategy behavior based on chart timeframe characteristics with reduced need for manual adjustment.
1-Minute Ultra Scalping Configuration:
get_1M_params() =>
StrategyParams.new(
smt = 0.8, srt = 1.0, mcb = 2, mmd = 20,
smartThreshold = 0.1, consecutiveLimit = 20,
positionSize = 3.0, enableQuickEntry = true,
ptp1 = 25, ptp2 = 35, ptp3 = 40,
tm1 = 1.5, tm2 = 3.0, tm3 = 4.5, tmf = 6.0,
isl = 1.0, esl = 2.0, tsd = 0.5, dsm = 1.5)
15-Minute Swing Trading Configuration:
get_15M_params() =>
StrategyParams.new(
smt = 2.0, srt = 2.0, mcb = 8, mmd = 100,
smartThreshold = 0.3, consecutiveLimit = 12,
positionSize = 7.0, enableQuickEntry = false,
ptp1 = 15, ptp2 = 25, ptp3 = 35,
tm1 = 4.0, tm2 = 8.0, tm3 = 12.0, tmf = 18.0,
isl = 2.0, esl = 3.5, tsd = 1.2, dsm = 2.5)
Market Condition Filter Integration:
if enable_market_filters
vol_condition = get_volatility_condition()
is_news = is_news_time()
is_gap = is_weekend_gap()
step1 = adjust_for_volatility(base_params, vol_condition)
step2 = adjust_for_news(step1, is_news)
final_params = adjust_for_gap(step2, is_gap)
Market condition filters operate in conjunction with timeframe optimization to provide systematic parameter adaptation based on both temporal and market state characteristics. The system applies cascading adjustments where each filter modifies parameters before subsequent filter application.
Volatility Classification Thresholds:
- EXTREME: >2.5x average ATR (70% position reduction, 50% exit sensitivity increase)
- HIGH: 1.8-2.5x average (40% position reduction, increased monitoring)
- NORMAL: 1.2-1.8x average (standard operations)
- LOW: 0.8-1.2x average (30% position increase, extended targets)
- DEAD: <0.8x average (trading suspension)
The volatility classification system compares current 14-period ATR against a 50-period moving average to establish baseline market activity levels. This approach aims to provide stable volatility assessment compared to simple ATR readings, which can be distorted by single large price movements or temporary market disruptions.
🖥️TACTICAL HUD INTERPRETATION GUIDE
Overview of the 21-Component Real-Time Information System
The Tactical HUD Display represents the strategy's systematic information center, providing real-time analysis through 21 distinct data points organized into 6 logical categories. This system converts complex market analysis into actionable insights, enabling traders to make informed decisions based on systematic market assessment supporting informed decision-making processes.
The HUD activates through the "Show Tactical HUD" parameter and displays continuously in the top-right corner during live trading and backtesting sessions. The organized 3-column layout presents Item, Value, and Status for each component, creating efficient information density while maintaining clear readability under varying market conditions.
# Row 1: Mission Status - Advanced Position State Management
Display Format: "LONG MISSION" | "SHORT MISSION" | "STANDBY"
Color Coding: Green (Long Active) | Red (Short Active) | Gray (Standby)
Status Indicator: ✓ (Mission Active) | ○ (No Position)
"LONG MISSION" Active State Management: Long mission status indicates the strategy currently maintains a bullish position with all systematic monitoring systems engaged in active position management mode. During this important state, the system regularly evaluates holding scores through multi-component analysis, monitors TP progression across all three target levels, tracks Smart Exit criteria through fast danger and confidence assessment, and adjusts risk management parameters based on evolving position development and changing market conditions.
"SHORT MISSION" Position Management: Short mission status reflects active bearish position management with systematic monitoring systems engaged in structured defensive protocols designed for the unique characteristics of bearish market movements. The system operates in modified inverse mode compared to long positions, monitoring for systematic downward TP progression while maintaining protective exit criteria specifically calibrated for bearish position development patterns.
"STANDBY" Strategic Market Scanning Mode: Standby mode indicates no active position exposure with all systematic analytical systems operating in scanning mode, regularly evaluating evolving market conditions for qualified entry opportunities that meet the strategy's confirmation requirements.
# Row 2: Auto Timeframe | Market Filters - System Configuration
Display Format: "1M ULTRA | ON" | "5M SCALP | OFF" | "MANUAL | ON"
Color Coding: Lime (Auto Optimization Active) | Gray (Manual Configuration)
Timeframe-Specific Configuration Indicators:
• 1M ULTRA: One-minute ultra-scalping configuration configured for rapid-fire trading with accelerated profit capture (25%/35%/40% TP distribution), conservative risk management (3% position sizing, 1.0% initial stops), and increased Smart Exit sensitivity (0.1 threshold, 20-bar consecutive limit).
• 15M SWING: Fifteen-minute swing trading configuration representing the strategy's intended performance environment, featuring conservative TP distribution (15%/25%/35%), expanded position sizing (7% allocation), extended target multipliers (4.0/8.0/12.0/18.0 ATR).
• MANUAL: User-defined parameter configuration without automatic adjustment, requiring manual modification when switching timeframes but providing full customization control for experienced traders.
Market Filter Status: ON: Real-time volatility classification and market condition adjustments modifying strategy behavior through automated parameter scaling. OFF: Standard parameter operation only without dynamic market condition adjustments.
# Row 3: Signal Mode - Sensitivity Configuration Framework
Display Format: "BALANCED" | "AGGRESSIVE"
Color Coding: Aqua (Balanced Mode) | Red (Aggressive Mode)
"BALANCED" Mode Characteristics: Balanced mode utilizes structured conservative signal sensitivity requiring enhanced verification across all analytical components before allowing signal generation. This rigorous configuration requires Medium Group scoring ≥5.5 points, Slow Group confirmation ≥3.5 points, and Fast Danger levels ≤2.0 points.
"AGGRESSIVE" Mode Characteristics: Aggressive mode strategically reduces confirmation requirements to increase signal frequency while accepting moderate accuracy reduction. Threshold requirements decrease to Medium Group ≥4.5 points, Slow Group ≥2.5 points, and Fast Danger ≤1.0 points.
# Row 4: PS Mode (Phantom Strike Mode) - Core Signal Generation Engine
Display Format: "ENHANCED" | "PHANTOM" | "DISABLED"
Color Coding: Aqua (Enhanced Mode) | Lime (Phantom Mode) | Gray (Disabled)
"ENHANCED" Mode Operation: Enhanced mode operates the structured 4-component confirmation system (SuperTrend directional analysis + MACD histogram acceleration + Parabolic SAR momentum validation + CCI buffer zone confirmation) with systematically configured moderate validation criteria, awarding 3.0 base points for signal strength calculation.
"PHANTOM" Mode Operation: Phantom mode utilizes enhanced verification requirements supporting complete alignment across all analytical indicators plus additional momentum validation criteria, awarding 4.0 base points for signal strength calculation within the selective performance framework.
# Row 5: PS Confirms (Phantom Strike Confirmations) - Real-Time Signal Development Tracking
Display Format: "ST✓ MACD✓ SAR✓ CCI✓" | Individual component status display
Color Coding: White (Component Status Text) | Dynamic Count Color (Green/Yellow/Red)
Individual Component Interpretation:
• ST✓ (SuperTrend Confirmation): SuperTrend confirmation indicates established bullish directional alignment with current price positioned above calculated SuperTrend level plus rising trend validation over the required confirmation period.
• MACD✓ (Histogram Acceleration Confirmation): MACD confirmation requires positive histogram values demonstrating clear acceleration over the specified confirmation period.
• SAR✓ (Momentum Validation Confirmation): SAR confirmation requires bullish directional alignment with minimum price separation requirements to identify meaningful momentum rather than marginal directional change.
• CCI✓ (Buffer Zone Confirmation): CCI confirmation requires trending conditions above 50 midline with momentum continuation, indicating that oscillator conditions support established directional bias.
# Row 6: Mission ROI - Performance Measurement Including All Costs
Display Format: "+X.XX%" | "-X.XX%" | "0.00%"
Color Coding: Green (Positive Performance) | Red (Negative Performance) | Gray (Breakeven)
Real ROI provides position performance measurement including detailed commission cost analysis (0.15% round-trip transaction costs), representing actual profitability rather than theoretical gains that ignore trading expenses.
# Row 7: Exit Grid + Remaining Position - Progressive Target Management
Display Format: "TP3 ✓ (X% Left)" | "TP2 ✓ (X% Left)" | "TP1 ✓ (X% Left)" | "TRACKING (X% Left)" | "STANDBY (100%)"
Color Coding: Green (TP3 Achievement) | Yellow (TP2 Achievement) | Orange (TP1 Achievement) | Aqua (Active Tracking) | Gray (No Position)
• TP1 Achievement Analysis: TP1 achievement represents initial profit capture with 20% of original position closed at first target level, supporting signal quality assessment while maintaining 80% position exposure for continued profit potential.
• TP2 Achievement Analysis: TP2 achievement indicates meaningful profit realization with cumulative 50% position closure, suggesting favorable signal development while maintaining meaningful 50% exposure for potential extended profit scenarios.
• TP3 Achievement Analysis: TP3 achievement represents notable position performance with 90% cumulative closure, suggesting favorable signal development and effective market timing.
# Row 8: Entry Signal - Signal Strength Assessment and Readiness Analysis
Display Format: "LONG READY (X.X/10)" | "SHORT READY (X.X/10)" | "WAITING (X.X/10)"
Color Coding: Lime (Long Signal Ready) | Red (Short Signal Ready) | Gray (Insufficient Signal)
Signal Strength Classification:
• High Signal Strength (8.0-10.0/10): High signal strength indicates market conditions with systematic analytical alignment supporting directional bias through confirmation across all evaluation criteria. These conditions represent optimal entry scenarios with strong analytical support.
• Strong Signal Quality (6.0-7.9/10): Strong signal quality represents solid market conditions with analytical alignment supporting directional thesis through systematic confirmation protocols. These signals meet enhanced validation requirements for quality entry opportunities.
• Moderate Signal Strength (4.5-5.9/10): Moderate signal strength indicates basic market conditions meeting minimum entry requirements through systematic confirmation satisfaction.
# Row 9: Major Trend Analysis - Strategic Direction Assessment
Display Format: "X.X% STRONG BULL" | "X.X% BULL" | "X.X% BEAR" | "X.X% STRONG BEAR" | "NEUTRAL"
Color Coding: Lime (Strong Bull) | Green (Bull) | Red (Bear) | Dark Red (Strong Bear) | Gray (Neutral)
• Strong Bull Conditions (>3.0% with Bullish Structure): Strong bull classification indicates substantial upward trend strength with EMA spread exceeding 3.0% combined with favorable bullish structure alignment. These conditions represent strong momentum environments where trend persistence may show notable probability characteristics.
• Standard Bull Conditions (1.5-3.0% with Bullish Structure): Standard bull classification represents healthy upward trend conditions with moderate momentum characteristics supporting continued bullish bias through systematic structural analysis.
# Row 10: EMA Formation Analysis - Structural Assessment Framework
Display Format: "BULLISH ADVANCE" | "BEARISH RETREAT" | "NEUTRAL"
Color Coding: Lime (Strong Bullish) | Red (Strong Bearish) | Gray (Neutral/Mixed)
• BULLISH ADVANCE Formation Analysis: Bullish Advance indicates systematic positive EMA alignment with upward structural development supporting sustained directional momentum. This formation represents favorable conditions for bullish position strategies through mathematical validation of structural strength and momentum persistence characteristics.
• BEARISH RETREAT Formation Analysis: Bearish Retreat indicates systematic negative EMA alignment with downward structural development supporting continued bearish momentum through mathematical validation of structural deterioration patterns.
# Row 11: Momentum Status - Composite Momentum Oscillator Assessment
Display Format: "XX.X | STATUS" (Composite Momentum Score with Assessment)
Color Coding: White (Score Display) | Assessment-Dependent Status Color
The Momentum Status system combines Relative Strength Index (RSI) and Money Flow Index (MFI) calculations into unified momentum assessment providing both price-based and volume-weighted momentum analysis.
• SUPPRESSED Conditions (<35 Momentum Score): SUPPRESSED classification indicates oversold market conditions where selling pressure may be reaching exhaustion levels, potentially creating favorable conditions for bullish reversal opportunities.
• ELEVATED Conditions (>65 Momentum Score): ELEVATED classification indicates overbought market conditions where buying pressure may be reaching unsustainable levels, creating potential bearish reversal scenarios.
# Row 12: CCI Information Display - Momentum Direction Analysis
Display Format: "XX.X | UP" | "XX.X | DOWN"
Color Coding: Lime (Bullish Momentum Trend) | Red (Bearish Momentum Trend)
The CCI Information Display showcases the CCI SMART system incorporating Arnaud Legoux Moving Average (ALMA) preprocessing combined with rational approximation of the hyperbolic tangent (TANH) function to achieve modified signal processing compared to traditional CCI implementations.
CCI Value Interpretation:
• Extreme Bullish Territory (>80): CCI readings exceeding +80 indicate extreme bullish momentum conditions with potential overbought characteristics requiring careful evaluation for continued position holding versus profit-taking consideration.
• Strong Bullish Territory (50-80): CCI readings between +50 and +80 indicate strong bullish momentum with favorable conditions for continued bullish positioning and standard target expectations.
• Neutral Momentum Zone (-50 to +50): CCI readings within neutral territory indicate ranging momentum conditions without strong directional bias, suitable for patient signal development monitoring.
• Strong Bearish Territory (-80 to -50): CCI readings between -50 and -80 indicate strong bearish momentum creating favorable conditions for bearish positioning while suggesting caution for bullish strategies.
• Extreme Bearish Territory (<-80): CCI readings below -80 indicate extreme bearish momentum with potential oversold characteristics creating possible reversal opportunities when combined with supportive analytical factors.
# Row 13: SAR Network - Multi-Component Momentum Analysis
Display Format: "X.XX% | BULL STRONG ↗INF" | Complex Multi-Component Analysis
Color Coding: Lime (Bullish Strong) | Green (Bullish Moderate) | Red (Bearish Strong) | Orange (Bearish Moderate) | White (Inflection Priority)
SAR Distance Percentage Analysis: The distance percentage component measures price separation from SAR level as percentage of current price, providing quantification of momentum strength through mathematical price relationship analysis.
SAR Strength Classification Framework:
• STRONG Momentum Conditions (>75% of Strength Range): STRONG classification indicates significant momentum conditions with price-SAR separation exceeding 75% of calculated strength range, representing notable directional movement with sustainability characteristics.
• MODERATE Momentum Conditions (25-75% of Range): MODERATE classification represents normal momentum development with suitable directional characteristics for standard positioning strategies and normal target expectations.
• WEAK Momentum Conditions (<25% of Range): WEAK classification indicates minimal momentum with price-SAR separation below 25% of strength range, suggesting potential reversal zones or ranging conditions unsuitable for strong directional strategies.
Inflection Detection System:
• Bullish Inflection (↗INF): Bullish inflection detection identifies moments when SAR momentum transitions from declining to rising through systematic rate-of-change analysis over 5-period lookback periods. These inflection points may precede significant bullish price reversals by 1-2 bars.
• Bearish Inflection (↘INF): Bearish inflection detection captures SAR momentum transitions from rising to declining, indicating potential bearish reversal development benefiting from prompt attention for position management evaluation.
# Row 14: VWAP Context Analysis - Institutional Volume-Weighted Price Reference
Display Format: "Daily: XXXX.XX (+X.XX%)" | "N/A (Index/Futures)"
Color Coding: Lime (Above VWAP Premium) | Red (Below VWAP Discount) | Gray (Data Unavailable)
Volume-Weighted Average Price (VWAP) provides institutional-level price reference showing mathematical average price where significant volume has transacted throughout the specified period. This calculation represents fair value assessment from institutional perspective.
• Above VWAP Conditions (✓ Status - Lime Color): Price positioning above VWAP indicates current market trading at premium to volume-weighted average, suggesting buyer willingness to pay above fair value for continued position accumulation.
• Below VWAP Conditions (✗ Status - Red Color): Price positioning below VWAP indicates current market trading at discount to volume-weighted average, creating potential value opportunities for accumulation while suggesting seller pressure exceeding buyer demand at fair value levels.
# Row 15: TP SL System Configuration - Dynamic vs Static Target Management
Display Format: "DYNAMIC ATR" | "STATIC %"
Color Coding: Aqua (Dynamic ATR Mode) | Yellow (Static Percentage Mode)
• DYNAMIC ATR Mode Analysis: Dynamic ATR mode implements systematic volatility-adaptive target management where all profit targets and stop losses automatically scale based on current market volatility through ATR (Average True Range) calculations. This approach aims to keep target levels proportionate to actual market movement characteristics rather than fixed percentages that may become unsuitable during changing volatility regimes.
• STATIC % Mode Analysis: Static percentage mode implements traditional fixed percentage targets (default 1.0%/2.5%/3.8%/4.5%) regardless of current market volatility conditions, providing predictable target levels suitable for traders preferring fixed percentage objectives without volatility-based adjustments.
# Row 16: TP Sequence Progression - Systematic Achievement Tracking
Display Format: "1 ✓ 2 ✓ 3 ○" | "1 ○ 2 ○ 3 ○" | Progressive Achievement Display
Color Coding: White text with systematic achievement progression
Status Indicator: ✓ (Achievement Confirmed) | ○ (Target Not Achieved)
• Complete Achievement Sequence (1 ✓ 2 ✓ 3 ✓): Complete sequence achievement represents significant position performance with systematic profit realization across all primary target levels, indicating favorable signal quality and effective market timing.
• Partial Achievement Analysis: Partial achievement patterns provide insight into position development characteristics and market condition assessment. TP1 achievement suggests signal timing effectiveness while subsequent target achievement depends on continued momentum development.
• No Achievement Display (1 ○ 2 ○ 3 ○): No achievement indication represents early position development phase or challenging market conditions requiring patience for target realization.
# Row 17: Mission Duration Tracking - Time-Based Position Management
Display Format: "XX/XXX" (Current Bars/Maximum Duration Limit)
Color Coding: Green (<50% Duration) | Orange (50-80% Duration) | Red (>80% Duration)
• Normal Duration Periods (Green Status <50%): Normal duration indicates position development within expected timeframes based on signal characteristics and market conditions, representing healthy position progression without time pressure concerns.
• Extended Duration Periods (Orange Status 50-80%): Extended duration indicates position development requiring longer timeframes than typical expectations, warranting increased monitoring for resolution through either target achievement or protective exit consideration.
• Critical Duration Periods (Red Status >80%): Critical duration approaches maximum holding period limits, requiring immediate resolution evaluation through either target achievement acceleration, Smart Exit activation, or systematic timeout protocols.
# Row 18: Last Exit Analysis - Historical Exit Pattern Assessment
Display Format: Exit Reason with Color-Coded Classification
Color Coding: Lime (TP Exits) | Red (Critical Exits) | Yellow (Stop Losses) | Purple (Smart Low) | Orange (Timeout/Sustained)
• Profit-Taking Exits (Lime/Green): TP1/TP2/TP3/Final Target exits indicate position management with systematic profit realization suggesting signal quality and strategy performance.
• Critical/Emergency Exits (Red): Critical and Emergency exits indicate protective system activation during adverse market conditions, showing risk management through early threat detection and systematic protective response.
• Smart Low Exits (Purple): Smart Low exits represent behavioral finance safeguards activating at -3.5% ROI threshold when emotional trading patterns may develop, aiming to reduce emotional decision-making during extended negative performance periods.
# Row 19: Fast Danger Assessment - Immediate Threat Detection System
Display Format: "X.X/10" (Danger Score out of 10)
Color Coding: Green (<3.0 Safe) | Yellow (3.0-5.0 Moderate) | Red (>5.0 High Danger)
The Fast Danger Assessment system provides real-time evaluation of immediate market threats through six independent measurement systems: SAR distance deterioration, momentum reversal detection, extreme CCI readings, volatility spike analysis, price action intensity, and combined threat evaluation.
• Safe Conditions (Green <3.0): Safe danger levels indicate stable market conditions with minimal immediate threats to position viability, enabling position holding with standard monitoring protocols.
• Moderate Concern (Yellow 3.0-5.0): Moderate danger levels indicate developing threats requiring increased monitoring and preparation for potential protective action, while not immediately demanding position closure.
• High Danger (Red >5.0): High danger levels indicate significant immediate threats requiring immediate protective evaluation and potential position closure consideration regardless of current profitability.
# Row 20: Holding Confidence Evaluation - Position Viability Assessment
Display Format: "X.X/10" (Confidence Score out of 10)
Color Coding: Green (>6.0 High Confidence) | Yellow (3.0-6.0 Moderate Confidence) | Red (<3.0 Low Confidence)
Holding Confidence evaluation provides systematic assessment of position viability through analysis of trend strength maintenance, formation quality persistence, momentum sustainability, and overall market condition favorability for continued position development.
• High Confidence (Green >6.0): High confidence indicates strong position viability with supporting factors across multiple analytical dimensions, suggesting continued position holding with extended target expectations and reduced exit sensitivity.
• Moderate Confidence (Yellow 3.0-6.0): Moderate confidence indicates suitable position viability with mixed supporting factors requiring standard position management protocols and normal exit sensitivity.
• Low Confidence (Red <3.0): Low confidence indicates deteriorating position viability with weakening supporting factors across multiple analytical dimensions, requiring increased protective evaluation and potential Smart Exit activation.
# Row 21: Volatility | Market Status - Volatility Environment & Market Filter Status
Display Format: "NORMAL | NORMAL" | "HIGH | HIGH VOL" | "EXTREME | NEWS FILTER"
Color Coding: White (Information display)
Volatility Classification Component (Left Side):
- DEAD: ATR ratio <0.8x average, minimal price movement requiring careful timing
- LOW: ATR ratio 0.8-1.2x average, stable conditions enabling position increase potential
- NORMAL: ATR ratio 1.2-1.8x average, typical market behavior with standard parameters
- HIGH: ATR ratio 1.8-2.5x average, elevated movement requiring increased caution
- EXTREME: ATR ratio >2.5x average, chaotic conditions triggering enhanced protection
Market Status Component (Right Side):
- NORMAL: Standard market conditions, no special filters active
- HIGH VOL: High volatility detected, position reduction and exit sensitivity increased
- EXTREME VOL: Extreme volatility confirmed, enhanced protective protocols engaged
- NEWS FILTER: Major economic event detected, 80% position reduction active
- GAP MODE: Weekend gap identified, increased caution until normal flow resumes
Combined Status Interpretation:
- NORMAL | NORMAL: Suitable trading conditions, standard strategy operation
- HIGH | HIGH VOL: Elevated volatility confirmed by both systems, 40% position reduction
- EXTREME | EXTREME VOL: High volatility warning, 70% position reduction active
📊VISUAL SYSTEM INTEGRATION
Chart Analysis & Market Visualization
CCI SMART Buffer Zone Visualization System - Dynamic Support/Resistance Framework
Dynamic Zone Architecture: The CCI SMART buffer system represents systematic visual integration creating adaptive support and resistance zones that automatically expand and contract based on current market volatility through ALMA-smoothed true range calculations. These dynamic zones provide real-time support and resistance levels that adapt to evolving market conditions rather than static horizontal lines that quickly become obsolete.
Adaptive Color Intensity Algorithm: The buffer visualization employs color intensity algorithms where transparency and saturation automatically adjust based on CCI momentum strength and directional persistence. Stronger momentum conditions produce more opaque visual representations with increased saturation, while weaker momentum creates subtle transparency indicating reduced prominence or significance.
Color Interpretation Framework for Strategic Decision Making:
-Intense Blue/Purple (High Opacity): Strong CCI readings exceeding ±80 with notable momentum strength indicating support/resistance zones suitable for increased position management decisions
• Moderate Blue/Purple (Medium Opacity): Standard CCI readings ranging ±40-80 with normal momentum indicating support/resistance areas for standard position management protocols
• Faded Blue/Purple (High Transparency): Weak CCI readings below ±40 with minimal momentum suggesting cautious interpretation and conservative position management approaches
• Dynamic Color Transitions: Automatic real-time shifts between bullish (blue spectrum) and bearish (purple spectrum) based on CCI trend direction and momentum persistence characteristics
CCI Inflection Circle System - Momentum Reversal Identification: The inflection detection system creates distinctive visual alerts through dual-circle design combining solid cores with transparent glow effects for enhanced visibility across different chart backgrounds and timeframe configurations.
Inflection Circle Classification:
• Neon Green Circles: CCI extreme bullish inflection detected (>80 threshold) with systematic core + glow effect indicating bearish reversal warning for position management evaluation
• Hot Pink Circles: CCI extreme bearish inflection detected (<-80 threshold) with dual-layer visualization indicating bullish reversal opportunity for strategic entry consideration
• Dual-Circle Design Architecture: Solid tiny core providing location identification with large transparent glow ensuring visibility without chart obstruction across multiple timeframe analyses
SAR Visual Network - Multi-Layer Momentum Display Architecture
SAR Visualization Framework: The SAR visual system implements structured multi-layer display architecture incorporating trend lines, strength classification markers, and momentum analysis through various visual elements that automatically adapt to current momentum conditions and strength characteristics.
SAR Strength Visual Classification System:
• Bright Triangles (High Intensity): Strong SAR momentum exceeding 75% of calculated strength range, indicating significant momentum quality suitable for increased positioning considerations and extended target scenarios
• Standard Circles (Medium Intensity): Moderate SAR momentum within 25-75% strength range, representing normal momentum development appropriate for standard positioning approaches and regular target expectations
• Faded Markers (Low Intensity): Weak SAR momentum below 25% strength range, suggesting caution and conservative positioning during minimal momentum conditions with increased exit sensitivity
⚠️IMPORTANT DISCLAIMERS AND RISK WARNINGS
Past Performance Limitations: The backtesting results presented represent hypothetical performance based on historical market data and do not guarantee future results. All trading involves substantial risk of loss. This strategy is provided for informational purposes and does not constitute financial advice. No trading strategy can guarantee 100% success or eliminate the risk of loss.
Users must approach trading with appropriate caution, never risking more than they can afford to lose.
Users are responsible for their own trading decisions, risk management, and compliance with applicable regulations in their jurisdiction.

Ticker Pulse Meter + Fear EKG StrategyDescription
The Ticker Pulse Meter + Fear EKG Strategy is a technical analysis tool designed to identify potential entry and exit points for long positions based on price action relative to historical ranges. It combines two proprietary indicators: the Ticker Pulse Meter (TPM), which measures price positioning within short- and long-term ranges, and the Fear EKG, a VIX-inspired oscillator that detects extreme market conditions. The strategy is non-repainting, ensuring signals are generated only on confirmed bars to avoid false positives. Visual enhancements, such as optional moving averages and Bollinger Bands, provide additional context but are not core to the strategy's logic. This script is suitable for traders seeking a systematic approach to capturing momentum and mean-reversion opportunities.
How It Works
The strategy evaluates price action using two key metrics:
Ticker Pulse Meter (TPM): Measures the current price's position within short- and long-term price ranges to identify momentum or overextension.
Fear EKG: Detects extreme selling pressure (akin to "irrational selling") by analyzing price behavior relative to historical lows, inspired by volatility-based oscillators.
Entry signals are generated when specific conditions align, indicating potential buying opportunities. Exits are triggered based on predefined thresholds or partial position closures to manage risk. The strategy supports customizable lookback periods, thresholds, and exit percentages, allowing flexibility across different markets and timeframes. Visual cues, such as entry/exit dots and a position table, enhance usability, while optional overlays like moving averages and Bollinger Bands provide additional chart context.
Calculation Overview
Price Range Calculations:
Short-Term Range: Uses the lowest low (min_price_short) and highest high (max_price_short) over a user-defined short lookback period (lookback_short, default 50 bars).
Long-Term Range: Uses the lowest low (min_price_long) and highest high (max_price_long) over a user-defined long lookback period (lookback_long, default 200 bars).
Percentage Metrics:
pct_above_short: Percentage of the current close above the short-term range.
pct_above_long: Percentage of the current close above the long-term range.
Combined metrics (pct_above_long_above_short, pct_below_long_below_short) normalize price action for signal generation.
Signal Generation:
Long Entry (TPM): Triggered when pct_above_long_above_short crosses above a user-defined threshold (entryThresholdhigh, default 20) and pct_below_long_below_short is below a low threshold (entryThresholdlow, default 40).
Long Entry (Fear EKG): Triggered when pct_below_long_below_short crosses under an extreme threshold (orangeEntryThreshold, default 95), indicating potential oversold conditions.
Long Exit: Triggered when pct_above_long_above_short crosses under a profit-taking level (profitTake, default 95). Partial exits are supported via a user-defined percentage (exitAmt, default 50%).
Non-Repainting Logic: Signals are calculated using data from the previous bar ( ) and only plotted on confirmed bars (barstate.isconfirmed), ensuring reliability.
Visual Enhancements:
Optional moving averages (SMA, EMA, WMA, VWMA, or SMMA) and Bollinger Bands can be enabled for trend context.
A position table displays real-time metrics, including open positions, Fear EKG, and Ticker Pulse values.
Background highlights mark periods of high selling pressure.
Entry Rules
Long Entry:
TPM Signal: Occurs when the price shows strength relative to both short- and long-term ranges, as defined by pct_above_long_above_short crossing above entryThresholdhigh and pct_below_long_below_short below entryThresholdlow.
Fear EKG Signal: Triggered by extreme selling pressure, when pct_below_long_below_short crosses under orangeEntryThreshold. This signal is optional and can be toggled via enable_yellow_signals.
Entries are executed only on confirmed bars to prevent repainting.
Exit Rules
Long Exit: Triggered when pct_above_long_above_short crosses under profitTake.
Partial exits are supported, with the strategy closing a user-defined percentage of the position (exitAmt) up to four times per position (exit_count limit).
Exits can be disabled or adjusted via enable_short_signal and exitPercentage settings.
Inputs
Backtest Start Date: Defines the start of the backtesting period (default: Jan 1, 2017).
Lookback Periods: Short (lookback_short, default 50) and long (lookback_long, default 200) periods for range calculations.
Resolution: Timeframe for price data (default: Daily).
Entry/Exit Thresholds:
entryThresholdhigh (default 20): Threshold for TPM entry.
entryThresholdlow (default 40): Secondary condition for TPM entry.
orangeEntryThreshold (default 95): Threshold for Fear EKG entry.
profitTake (default 95): Exit threshold.
exitAmt (default 50%): Percentage of position to exit.
Visual Options: Toggle for moving averages and Bollinger Bands, with customizable types and lengths.
Notes
The strategy is designed to work across various timeframes and assets, with data sourced from user-selected resolutions (i_res).
Alerts are included for long entry and exit signals, facilitating integration with TradingView's alert system.
The script avoids repainting by using confirmed bar data and shifted calculations ( ).
Visual elements (e.g., SMA, Bollinger Bands) are inspired by standard Pine Script practices and are optional, not integral to the core logic.
Usage
Apply the script to a chart, adjust input settings to suit your trading style, and use the visual cues (entry/exit dots, position table) to monitor signals. Enable alerts for real-time notifications.
Designed to work best on Daily timeframe.

Aftershock Playbook: Stock Earnings Drift EngineStrategy type
Event-driven post-earnings momentum engine (long/short) built for single-stock charts or ADRs that publish quarterly results.
What it does
Detects the exact earnings bar (request.earnings, lookahead_off).
Scores the surprise and launches a position on that candle’s close.
Tracks PnL: if the first leg closes green, the engine automatically re-enters on the very next bar, milking residual drift.
Blocks mid-cycle trades after a loss until the next earnings release—keeping the risk contained to one cycle.
Think of it as a sniper that fires on the earnings pop, reloads once if the shot lands, then goes silent until the next report.
Core signal inputs
Component Default Purpose
EPS Surprise % +0 % / –5 % Minimum positive / negative shock to trigger longs/shorts.
Reverse signals? Off Quick flip for mean-reversion experiments.
Time Risk Mgt. Off Optional hard exit after 45 calendar days (auto-scaled to any TF).
Risk engine
ATR-based stop (ATR × 2 by default, editable).
Bar time stop (15-min → Daily: Have to select the bar value ).
No pyramiding beyond the built-in “double-tap”.
All positions sized as % of equity via Strategy Properties.
Visual aids
Yellow triangle marks the earnings bar.
Diagnostics table (top-right) shows last Actual, Estimate, and Surprise %.
Status-line tool-tips on every input.
Default inputs
Setting Value
Positive surprise ≥ 0 %
Negative surprise ≤ –5 %
ATR stop × 2
ATR length 50
Hold horizon 350 ( 1h timeframe chart bars)
Back-test properties
Initial capital 10 000
Order size 5 % of equity
Pyramiding 1 (internal re-entry only)
Commission 0.03 %
Slippage 5 ticks
Fills Bar magnifier ✔ · On bar close ✔ · Standard OHLC ✔
How to use
Add the script to any earnings-driven stock (AAPL, MSFT, TSLA…).
Turn on Time Risk Management if you want stricter risk management
Back-test different ATR multipliers to fit the stock’s volatility.
Sync commission & slippage with your broker before forward-testing.
Important notes
Works on every timeframe from 15 min to 1 D. Sweet spot around 30min/1h
All request.earnings() & request.security() calls use lookahead_off—zero repaint.
The “double-tap” re-entry occurs once per winning cycle to avoid drift-chasing loops.
Historical stats ≠ future performance. Size positions responsibly.

AI Volume StrategyAI Volume Strategy detects significant volume spikes and combines them with trend direction and candlestick color to generate buy and sell signals. The strategy uses an Exponential Moving Average (EMA) of volume to identify abnormal volume spikes that may indicate strong market activity. Additionally, it uses a 50-period EMA of price to filter the trend and decide on entry direction.
Key Features:
Volume Spike Detection: The strategy detects when the current volume exceeds the EMA of volume by a user-defined multiplier, signaling abnormal increases in market activity.
Trend Direction Filter: The strategy uses a 50-period EMA of price to determine the market trend. Buy signals are generated when the price is above the EMA (uptrend), and sell signals are generated when the price is below the EMA (downtrend).
Candle Color Filter: The strategy generates a buy signal only when the current candle is bullish (green) and a sell signal only when the current candle is bearish (red).
Exit after X Bars: The strategy automatically closes the position after a specified number of bars (default is 5 bars), but the exit condition can be adjusted based on user preference, timeframe, and backtesting results. The default exit is after 5 bars, but users can set it to 1 bar or any other number depending on their preferences and strategy.
Signals:
Buy Signal: Generated when a volume spike occurs, the trend is upward, and the current candle is bullish.
Sell Signal: Generated when a volume spike occurs, the trend is downward, and the current candle is bearish.
Alerts:
Buy Alert: Alerts the user when a buy signal is triggered.
Sell Alert: Alerts the user when a sell signal is triggered.
Visualization:
Buy Signal: A green label appears below the bar when the buy conditions are met.
Sell Signal: A red label appears above the bar when the sell conditions are met.
Volume EMA: Optionally, the Volume EMA line can be plotted on the chart to visualize volume trends.
This strategy helps traders identify potential entry points based on increased volume activity while considering trend direction and candlestick patterns. With the ability to adjust the exit condition, users can fine-tune the strategy to their specific needs and backtest results.

VWAP StrategyVWAP and volatility filters for structured intraday trades.
How the Strategy Works
1. VWAP Anchored to Session
VWAP is calculated from the start of each trading day.
Standard deviations are used to create bands above/below the VWAP.
2. Entry Triggers: Al Brooks H1/H2 and L1/L2
H1/H2 (Long Entry): Opens below 2nd lower deviation, closes above it.
L1/L2 (Short Entry): Opens above 2nd upper deviation, closes below it.
3. Volatility Filter (ATR)
Skips trades when deviation bands are too tight (< 3 ATRs).
4. Stop Loss
Based on the signal bar’s high/low ± stop buffer.
Longs: signalBarLow - stopBuffer
Shorts: signalBarHigh + stopBuffer
5. Take Profit / Exit Target
Exit logic is customizable per side:
VWAP, Deviation Band, or None
6. Safety Exit
Exits early if X consecutive bars go against the trade.
Longs: X red bars
Shorts: X green bars
Explanation of Strategy Inputs
- Stop Buffer: Distance from signal bar for stop-loss.
- Long/Short Exit Rule: VWAP, Deviation Band, or None
- Long/Short Target Deviation: Standard deviation for target exit.
- Enable Safety Exit: Toggle emergency exit.
- Opposing Bars: Number of opposing candles before safety exit.
- Allow Long/Short Trades: Enable or disable entry side.
- Show VWAP/Entry Bands: Toggle visual aids.
- Highlight Low Vol Zones: Orange shading for low volatility skips.
Tuning Tips
- Stop buffer: Use 1–5 points.
- Target deviation: Start with VWAP. In strong trends use 2nd deviation and turn off the counter-trend entry.
- Safety exit: 3 bars recommended.
- Disable short/long side to focus on one type of reversal.
Backtest Setup Suggestions
- initial_capital = 2000
- default_qty_value = 1 (fixed contracts or percent-of-equity)

3Commas Multicoin Scalper PRO [SwissAlgo]Introduction
Are you tired of tracking dozens of cryptocurrency charts and placing orders manually on your Exchange?
The 3Commas Multicoin Scalper PRO is an automated trading system designed to simultaneously identify and execute potential trading setups on multiple cryptocurrencies on your preferred Exchange (Binance, Bybit, OKX, Gate.io, Bitget) via 3Commas integration.
It analyzes price action, volume, momentum, volatility, and trend patterns across 180+ USDT Perpetual coins divided into 17 crypto categories , providing real-time signals directly to your 3Commas bots for automated trade execution. This indicator aims to identify potential trend-following and contrarian setups in both bull and bear markets.
-------------------------------------
What it Does
The 3Commas Multicoin Scalper PRO is a technical analysis tool that monitors multiple cryptocurrency pairs simultaneously and connects with 3Commas for signal delivery and execution.
Here's how the strategy works:
🔶 Technical Analysis : Analyzes price action, volume, momentum, volatility, and trend patterns across multiple USDT Perpetual Futures contracts simultaneously.
🔶 Pattern Detection : Identifies specific candle patterns and technical confluences that suggest potential trading setups across all USDT.P contracts of the selected categories
🔶 Signal Generation : When technical criteria are met at bar close, the indicator creates deal-start signals for the relevant pairs.
🔶 3Commas Integration : Packages these signals and delivers them to 3Commas through TradingView alerts, allowing 3Commas bots to receive specific pair information ('Deal-Start' signals).
🔶 Category Management : Each TradingView alert monitors an entire category (approximately 11 pairs), allowing selective activation of different crypto categories.
🔶 Visual Feedback : Provides color-coded candles and backgrounds to visualize technical conditions, with optional pivot points and trend visualization.
Candle types:
Signals:
-------------------------------------
Quick Start Guide
1. Setup 3Commas Bots : Configure two DCA bots in 3Commas (All USDT pairs) - one for LONG positions and one for SHORT positions.
2. Define Trading Parameters : Set your budget for each trade and adjust your preferred sensitivity within the indicator settings.
3. Create Category Alerts : Set up one TradingView alert for each crypto category you want to trade.
That's it! Once configured, the system automatically sends signals to your 3Commas bots when predefined trading setups are detected across coins in your selected/activated categories. The indicator scans all coins at bar close (for example, every hour on the 1H timeframe) and triggers trade execution only for those showing technical confluences.
Important : The more categories you activate by setting TradingView alerts, the more signals your 3Commas bots will receive. Consider your total capital when enabling multiple categories. More details about the setup process are provided below (see paragraph "Detailed Setup & Configuration")
-------------------------------------
Built-in Backtesting
The 3Commas Multicoin Scalper PRO includes backtesting visualization for each coin. When viewing any USDT Perpetual pair on your chart, you can visualize how the strategy would have performed historically on that specific asset.
Color-coded candles and signal markers show past trading setups, helping you evaluate which coins responded best to the strategy. This built-in backtesting capability can support your selection of assets/categories to trade before deploying real capital.
As backtesting results are hypothetical and do not guarantee future performance, your research and analysis are essential for selecting the crypto categories/coins to trade.
The default strategy settings are: Start Capital 1.000$, leverage 25X, Commissions 0.1% (average Taker Fee on Exchanges for average users), Order Amount 200$ for Longs/150$ for Shorts, Slippage 4
-------------------------------------
Key Features
🔶 Multi-Exchange Support : Compatible with BINANCE, BYBIT, BITGET, GATEIO, and OKX USDT Perpetual markets (USDT.P)
🔶 Wide Asset Coverage : Simultaneously analyzes 180+ cryptocurrencies across 17 specialized crypto categories
🔶 Custom Category Option : Create your watchlist with up to 10 custom USDT Perpetual pairs
🔶 3Commas Integration : Seamlessly connects with 3Commas bots to automate trade entries and exits
🔶 Dual Strategy Approach : Identifies both "trend following" and "contrarian" potential setups
🔶 Confluence-Based Signals : Uses a combination of multiple technical factors - price spikes, price momentum, volume spikes, volume momentum, trend analysis, and volatility spikes - to generate potential trading setups
🔶 Risk Management : Adjustable sensitivity/risk levels, leverage settings, and budget allocation for each trade
🔶 Visual Indicators : Color-coded candles and trading signals provide visual feedback on market conditions
🔶 Trend Indication : Background colors showing ongoing uptrends/downtrends
🔶 Pivot Points & Daily Open : Optional display of pivot points and daily open price for additional context
🔶 Liquidity Analysis : Optional display of high/low liquidity timeframes throughout the trading week
🔶 Trade Control : Configurable limit for the maximum number of signals sent to 3Commas for execution (per bar close and category)
Available Exchanges
Categories
Custom Category
Trend following/contrarian signals
-------------------------------------
Methodology
The 3Commas Multicoin Scalper PRO utilizes a multi-faceted approach to identify potential trading setups:
1. Price Action Analysis : Detects abnormal price movements by comparing the current candle's range to historical averages and standard deviations, helping identify potential "pump and dump" scenarios or new-trends start
2. Price Momentum : Evaluates the relative strength of bullish vs. bearish price movements over time, indicating the build-up of buying or selling pressure.
3. Volume Analysis: Identifies unusual volume spikes by comparing current volume to historical averages, signaling strong market interest in a particular direction.
4. Volume Momentum : Measures the ratio of bullish to bearish volume, revealing the dominance of buyers or sellers over time.
5. Trend Analysis : Combines EMA slopes, RSI, and Stochastic RSI to determine overall trend direction and strength.
6. Volatility : Monitors the ATR (Average True Range) to detect periods of increased market volatility, which may indicate potential breakouts or reversals
7. Candle Wick Analysis : Evaluates upper and lower wick percentages to detect potential rejection patterns and reversals.
8. Pivot Point Analysis : Uses pivot points (PP, R1-R3, S1-S3) for identifying key support/resistance areas and potential breakout/breakdown levels.
9. Daily Open Reference: Analyzes price action relative to the daily open for potential setups related to price movement vs. the opening price
10. Market Timing/Liquidity : Evaluates high/low liquidity periods, specific days/times of heightened risk, and potential market manipulation timeframes.
11. Boost Factors : Applies additional weight to certain confluence patterns to adjust global scores
These factors are combined into a "Global Score" ranging from -1 to +1 , applied at bar close to the newly formed candles.
Scores above predefined thresholds (configurable via the Sensitivity Settings) indicate strong bullish or bearish conditions and trigger signals based on predefined patterns. The indicator then applies additional filters to generate specific "Trend Following" and "Contrarian" trading signals. The identified signals are packaged and sent to 3Commas for execution.
Pivot Points
Daily open
Market Trend
Liquidity patterns by weekday
-------------------------------------
Who This Strategy Is For?
The 3Commas Multicoin Scalper PRO may benefit:
Crypto Traders seeking to automate their trading across multiple coins simultaneously
3Commas Users looking to enhance their bot performance with advanced technical signals
Busy Traders who want to monitor many market opportunities without constant chart-watching
Multi-strategy traders interested in both trend-following and reversal trading approaches
Traders of Various Experience Levels from intermediate traders wanting to save time to advanced traders seeking to scale their operations
Perpetual Futures Traders on major exchanges (Binance, Bybit, OKX, Gate.io, Bitget)
Swing and Scalp Traders seeking to identify short to medium-term profit opportunities
-------------------------------------
Visual Indicators
The indicator provides visual feedback through:
1. Candlestick Colors :
* Lime: Strong bullish candle (High positive score)
* Blue: Moderate bullish candle (Medium positive score)
* Red: Strong bearish candle (High negative score)
* Purple: Moderate bearish candle (Medium negative score)
* Pale Green/Red: Mild bullish/bearish candle
2. Signal Markers :
* ↗: Trend Following Long signal
* ↘: Trend Following Short signal
* ⤴: Contrarian Long signal
* ⤵: Contrarian Short signal
3. Optional Elements :
* Pivot Points: Daily support/resistance levels (R1-R3, S1-S3, PP)
* Daily Open: Reference price level for the current trading day
* Trend Background: Color-coded background suggesting potential ongoing uptrend/downtrend
* Liquidity Highlighting: Background colors indicating typical high/low market liquidity periods
4. TradingView Strategy Plots and Backtesting Data : Standard performance metrics showing entry/exit points, equity curves, and trade statistics, based on the signals generated by the script.
-------------------------------------
Detailed Setup & Configuration
The indicator features a user-friendly input panel organized in sequential steps to guide you through the complete setup process. Tooltips for each step provide additional information to help you understand the actions required to get the strategy running.
Informative tables provide additional details and instructions for critical setup steps such as 3Commas bot configuration and TradingView alert creation (to activate trading on specific categories).
1. Choose Exchange, Crypto Category & Sensitivity
* Select your USDT Perpetual Exchange (BINANCE, BYBIT, BITGET, GATEIO, or OKX) - i.e. the same Exchange connected in your 3Commas account
* Browse and choose your preferred crypto category, or define your watchlist
* Choose from three sensitivity levels: Default, Aggressive, or Test Mode (test mode is designed to generate way more signals, a potentially helpful feature when you are testing the indicator and alerts)
2. Setup 3Commas Bots and integrate them with the algo
* Create both LONG and SHORT DCA Bots in 3Commas
* Configure bots to accept signals for 'All USDT Pairs' with "TradingView Custom Signal" as deal start condition
* Enter your Bot IDs and Email Token in the indicator settings
* Set a maximum budget for LONG and SHORT trades
* Choose whether to allow LONG trades, SHORT trades, or both, according to your preference and market analysis
* Set maximum trades per bar/category (i.e. the max. number of simultaneous signals that the algo may send to your 3Commas bots for execution at every bar close - every hour if you set the 1H timeframe)
* Access the detailed setup guide table for step-by-step 3Commas configuration instructions
3Commas integration
3. Choose Visuals
* Toggle various optional visual elements to add to the chart: category metrics, fired alerts, coin metrics, daily open, pivot points
* Select a color theme: Dark or Light
4. Activate Trading via Alerts
* Create TradingView alerts for each category you want to trade
* Set alert condition to "3Commas Multicoin Scalper" with "Any alert() function call"
* Set the content of the message filed to: {{Message}}, deleting the default content shown in this text field, to enable proper 3Commas integration (any other text than {{Message}}, would break the delivery trading signals from Tradingview to 3Commas)
* View the alerts setup instruction table for visual guidance on this critical step
Alerts
Fired Alerts
Important Configuration Notes
Ensure that the TradingView chart's exchange matches your selected exchange in the indicator settings and your 3Commas bot settings.
You must configure the same leverage in both the script and your 3Commas bots
Your 3Commas bots must be configured for All USDT pairs
You must enter the exact Bot IDs and Email Token from 3Commas (these remain confidential - no one, including us, has access to them)
If you activate multiple categories without sufficient capital, 3Commas will display " insufficient funds " errors - align your available capital with the number of categories you activate (each deal will use the budget amount specified in user inputs)
You are free to set your Take Profit % / trailing on 3Commas
We recommend not to use DCA orders (i.e. set the number of DCA orders at zero)
Legend of symbols
-------------------------------------
FAQs
General Questions
❓ Q: What is Global Score? A: The Global Score serves as a foundation for signal generation. When a candle's score exceeds certain thresholds (defined by your Risk Level setting), it becomes a candidate for signal generation. However, not all high-scoring candles generate trading signals - the indicator applies additional pattern recognition and contextual filters. For example, a strongly positive score (lime candle) in an established uptrend may trigger a "Trend Following" signal, while a strongly negative score (red candle) in a downtrend might generate a "Trend Following Short" signal. Similarly, contrarian signals are generated when specific reversal patterns occur alongside appropriate Global Score values, often involving wick analysis and pivot point interactions. This multi-layer approach helps filter out false positives and identify higher-probability trading setups.
❓ Q: What's the difference between "Trend following" and "Contrarian" signals in the script? A: "Trend Following" signals follow the identified trends while "Contrarian" signals anticipate potential trend reversals.
❓ Q: Why can't I configure all the parameters? A: We've designed the solution to be plug-and-play to prevent users from getting lost in endless configurations. The preset values have been tested against their trade-offs in terms of financial performance, average trade duration, and risk levels.
❓ Q: Why don't I see any signals on my chart? A: Make sure you're viewing a USDT Perpetual pair from your selected exchange that belongs to the crypto category you've chosen to analyze. For example, if you've selected the "Top Major Coins" category with Binance as your exchange, you need to view a chart of one of those specific pairs (like BINANCE:BTCUSDT.P) to see signals. If you switch exchanges, for example from Binance to Bybit, you need to pull a Bybit pair on the chart to see backtesting data and signals.
❓ Q: Does this indicator guarantee profits? A: No. Trading cryptocurrencies involves significant risk, and past performance is not indicative of future results. This indicator is a tool to help you identify potential trading setups, but it does not and cannot guarantee profits.
❓ Q: Does this indicator repaint or use lookahead bias? A: No. All trading signals generated by this indicator are based only on completed price data and do not repaint. The system is designed to ensure that backtesting results reflect as closely as possible what you should experience in live trading.
While reference levels like pivot points are kept stable throughout the day using lookahead on, the actual buy and sell signals are calculated using only historical data (lookahead off) that would have been available at that moment in time. This ensures reliability and consistency between backtesting and real-time trading performance.
Technical Setup
❓ Q: What exchanges are supported? A: The strategy supports BINANCE, BYBIT, BITGET, GATEIO, and OKX USDT Perpetual markets (i.e. all the Exchanges you can connect to your 3Commas account for USDT Perpetual trading, excluding Coinbase Perpetual that offers UDSC pairs, instead of USDT).
❓ Q: What timeframe should I use? A: The indicator is optimized for the 1-hour (1H) timeframe but may run on any timeframe.
❓ Q: How many coins can I trade at once? A: You can trade all coins within each selected category (up to 11 coins per category in standard categories). You can activate multiple categories by setting up multiple alerts.
❓ Q: How many alerts do I need to set up? A: You need to set up one alert for each crypto category you want to trade. For example, if you want to trade both the "Top Major Coins" and the "DeFi" categories, you'll need to create two separate alerts, one for each category. We recommend starting with one category, testing the results carefully, monitoring performance daily, and perhaps activating additional categories in a second stage.
❓ Q: Are there any specific risk management features built into the indicator? A: Yes, the indicator includes risk management features: adjustable maximum trades per hour/category, the ability to enable/disable long or short signals depending on market conditions, customizable trade size for both long and short positions, and different sensitivity/risk level settings.
❓ Q: What happens if 3Commas can't execute a signal? A: If 3Commas cannot execute a signal (due to insufficient funds, bot offline, etc.), the trade will be skipped. The indicator will continue sending signals for other valid setups, but it doesn't retry failed signals.
❓ Q: Can I run this indicator on multiple charts at once? A: Yes, but it's not necessary. The indicator analyzes all coins in your selected categories regardless of which chart you apply it to. For optimal resource usage, apply it to a single chart of a USDT Perpetual pair from your selected exchange. To stop trading a category delete the alert created for that category.
❓ Q: How frequently does the indicator scan for new signals? A: The indicator scans all coins in your selected categories at the close of each bar (every hour if you selected the 1H timeframe).
3Commas Integration
❓ Q: Do I need a 3Commas account? A: Yes, a 3Commas account with active DCA bots (both LONG and SHORT) is required for automated trade execution. A paid subscription is needed, as multipair Bots and multiple simultaneous deals are involved.
❓ Q: How do I set the leverage? A: Set the leverage identically in both the indicator settings and your 3Commas DCA bots (the max supported leverage is 50x). Always be careful about leverage, as it amplifies both profits and losses.
❓ Q: Where do I find my 3Commas Bot IDs and Email Token? A: Open your 3Commas DCA bot and scroll to the "Messages" section. You'll find the Bot ID and Email Token within any message (e.g., "Start Deal").
Display Settings
❓ Q: What does the Sensitivity setting do? A: It adjusts the sensitivity of signal generation. "Default" provides a balanced approach with moderate signal frequency. "Aggressive" lowers the thresholds for signal generation, potentially increasing trade frequency but may include more noise. "Test Mode" is the most sensitive setting, useful for testing alert configurations but not recommended for live trading. Higher risk levels may generate more signals but with potentially lower average quality, while lower risk levels produce fewer but potentially better signals.
❓ Q: What does "Show fired alerts" do? A: The "Show fired alerts" option displays a label on your chart showing which signals have been fired and sent to 3Commas during the most recent candle closes. This visual indicator helps you confirm that your alerts are working properly and shows which coins from your selected category have triggered signals. It's useful when setting up and testing the system, allowing you to verify that signals are being sent to 3Commas as expected and their frequency over time.
❓ Q: What does "Show coin/token metrics" do? A: This toggle displays detailed technical metrics for the specific coin/token currently shown on your chart. When enabled, it shows statistics for the last closed candle for that coin.
❓ Q: What does "Show most liquid days/times" do? A: This toggle displays color-coded background highlighting to indicate periods of varying market liquidity throughout the trading week. Green backgrounds show generally higher liquidity periods (typically weekday trading hours), yellow highlights potentially manipulative periods (often Sunday/Monday overnight), and gray indicates low liquidity periods (when major markets are closed or during late hours).
⚠️ Disclaimer
This indicator is for informational and educational purposes only and does not constitute financial advice. Trading cryptocurrencies involves significant risk, including the potential loss of all invested capital, and past performance is not indicative of future results.
Always conduct your own thorough research (DYOR) and understand the risks involved before making any trading decisions. Trading with leverage significantly amplifies both potential profits and losses - exercise extreme caution when using leverage and never risk more than you can afford to lose.
The Bot ID and Email Token information are transmitted directly from TradingView to 3Commas via secure connections. No third party or entity will ever have access to this data (including the Author). Do not share your 3Commas credentials with anyone.
This indicator is not affiliated with, endorsed by, or sponsored by TradingView or 3Commas.

PSE, Practical Strategy EnginePSE, Practical Strategy Engine
A ready-to-use engine that is simple to connect your indicator to, simple to use, and effective at generating alerts for order-filled events during the real-time candle.
Great for
• Evaluating indicators on important metrics without the need to write a strategy script for backtesting.
• Using indicators with built-in risk management.
About The PSE
This engine accepts entry and exit signals from your indicator to provide trade signals for both long and short positions. The PSE was written for trading Funds (e.g. ETF’s), Stocks, Forex, Futures, and Cryptocurrencies. The trades on the chart indicate market, limit, and stop orders. The PSE allows for backtesting of trades along with metrics of performance based on trade-groups with many great features.
Note: A link to a video of how to connect your indicator(s) to the PSE is provided below.
Key Features
Trade-Grp’s
A Trade-Grp makes up one or more trade positions from the first position entering to the last position exiting. Using Trade-Grp’s instead of positions should help you better assess if the metric results fit your trading style.
Below are two (2) examples of a Trade-Grp with three (3) positions.
Metrics
A table of metrics is available if the “Show Metrics Table” checkbox is enabled on the Inputs tab, but metrics always show in the Data Window.
Examples of the Metrics Table are shown below.
• ROI (Return on Investment) and CAGR (Compound Annual Growth Rate) are based on the Avg Invest/Trade-Grp and are adjusted for dividends if the “Include Dividends in Profit” checkbox is enabled.
• Profit/Risked is based on Trade-Grp’s. Also known as reward/risk, as well as expectancy per amount risked. It determines the effectiveness of your strategy and provides a measure of comparison between your strategies. This is adjusted for dividends if the “Include Dividends in Profit” checkbox is enabled. In the Data Window the color is green when above the breakeven point of making a profit and red when below the breakeven point. In the Table the color is red if below the breakeven point, otherwise it is the default color. For example, using the 3 metrics tables above:
For every USD risked the profit is 1.709 USD.
For every BTC risked the profit is 0.832 BTC.
For every JPY risked the profit is 0.261 JPY.
• Winning % is based on Trade-Grp’s. In the Data Window the color is green when above the breakeven point of making a profit and red when below the breakeven point. In the Table the color is red if below the breakeven point, otherwise it is the default color.
The breakeven point is a relationship between the Profit/Risked and Winning % to indicate system profitability potential. Another way to assess trading system performance. For example, for a low Winning % a high Profit/Risked is needed for the system to be potentially profitable.
• Profit Factor (PF) is based on Trade-Grp’s. The dividend payment, if any, is not considered in the calculation of a win or loss. The “Include Dividends in Profit Factor” checkbox allows you the option to either include or not include dividends in the calculation of Profit Factor. The default is enabled.
Must enable the “Include Dividends in Profit” checkbox to include dividends in PF.
Including dividends in PF evaluates the trading strategy with a more overall profitability performance view.
Enable/Disable “Include Dividends in Profit Factor” checkbox also affects the Avg Trade-Grp Loss, and thus Equity Loss from ECL and % Equity Loss from ECL.
• Max Consecutive Losses are based on Trade-Grp’s.
• Nbr of Trade-Grp’s and Nbr of Positions.
These help you to determine if enough trades have occurred to validate your strategy. The Nbr of Positions is the count of positions on the chart. The TV list of trades in the Strategy Tester may indicate more than what is actually shown on the chart. The Data Window includes 'Nbr Strat Tester Trades', which equals the TV listing trades, to help you locate specific trades on the chart.
• Time in Market (%) is based on Trade-Grp’s and date range selected.
• Avg Invest/Trade-Grp will indicate the average amount of money invested in a Trade-Grp. This is adjusted for dividends if the “Include Dividends in Profit” checkbox is enabled.
• Equivalent Consecutive Losses, labeled as Equiv. Cons. Losses (ECL).
This value is determined by the Winning % and Nbr of Trade-Grp’s. This simulates the more likely case of a series of losses, then a small win, then another series of losses to form an equivalent consecutive losing streak. To lower the value, increase the Winning %.
• Equity Loss from ECL is the equity loss from the equivalent consecutive losses.
• % Equity Loss from ECL is the percent of equity loss from the equivalent consecutive losses.
Risk Management
• Pyramid rules enforce and maintain position sizing designated by you on the Inputs tab (% Equity to Risk, Up/Dwn Gap) & Properties tab (number of pyramids, slippage, and commission).
A pyramid position will not occur unless both its stop covers the last entry price with gap/slippage and commission cost of previous trade is covered. If take profit is enabled, a pyramid position will not occur unless commission cost of the trade is covered when take profit target is reached.
• Position sizing, stop-loss (SL), trailing stop-loss (TSL), and take profit (TP) are used.
• Wash sale prevention for applicable assets is enforced. Wash sale assets include stock and fund (e.g. ETF’s).
• No more than one entry position per candle is enforced .
Other Great Features
• Losing Trade-Grp’s indicated at the exit with label text in the color blue. Used to easily find consecutive losses affecting your strategy’s performance. The dividend payment, if any, is not considered in the calculation of a win or loss.
• Position values can be displayed on the chart. The number format is based on the min tick value, but is limited to 8 decimal places only for display purposes.
• Dividends per share and the amount can be displayed on the chart.
• Hold Days . This is the number of days to hold before allowing the next Trade-Grp. Can be a decimal number. This feature may help those trading on a cash account to avoid any settlement violations when trading the same asset.
• Date Filter. Partition the time when trading is allowed to see if the strategy works well across the date range selected. The metrics should be acceptable across all four (4) time ranges: entire range, 1st half, IQR (inter-quartile range), and 2nd half.
• Price gap amount identification. Used in determining if a pyramid entry may be profitable, and may be used in determining slippage amount to use.
• When TP is enabled, the PSE will only allow a pyramid position if the potential is profitable based on commission and price gap selected.
• Trade-Grp’s shown in background color: green for long positions and red for short positions.
• The PSE will alert you to update your stop-loss as the market changes if your exchange/broker does not allow for trailing stop-loss orders. Enable this option on the Inputs tab with Alert Chg TSL.
• The PSE will alert you if your drawdown exceeds Max % Equity Drawdown set on the Inputs tab.
• The PSE will send an alert to warn you of an expiring GTC order.
Some brokers will indicate the order is GTC, Good 'Till Cancelled, but there really is a time limit on the order and is typically 60-120 days. Therefore, the PSE will alert you if you've been in position for close to 60 days so you can refresh your order. The alert is typically a few days before the 60-day time period.
• For order fill alerts just use a {{placeholder}} in the Message of the alert. Details on how to enter placeholders is explained below.
• Identify same bar enter/exit for first entries and pyramids. This is shown in the Data Window as well. This can help you determine what stop-loss % works best for your trading style.
• Leverage trading information is displayed in the Data Window and applies to Trade-Grps.
Failed PosSize or Margin (%): Shows a zero if the failed-to-trade position size was less than 1 or shows the margin % which failed to meet the margin requirement set in the Properties tab. A flag will show on the bar where a failed-to-trade occurred. This is only applicable to the first position of a Trade-Grp. Position the cursor over the flag for the value to show in the Data Window.
Notional Value: total Trade-Grp position size x latest entry price x point value. The equity must be > notional value x margin requirement for a trade to occur.
Current Margin (%): must be greater than margin requirement set on the Properties tab in order for a trade to occur.
Margin Call Price: when enabled on the Style tab is displayed on both the chart and the Data Window as shown below.
PSE Settings
Pyramids
• Pyramiding requires the Stop Method to be set to either TSL or Both (meaning SL & TSL).
• The maximum number of pyramids is determined by the value entered in the Properties tab.
• Pyramid orders require the enter price to be higher than the previous close for Longs and lower than the previous close for Shorts.
• Pyramids also require the stop with gap/slippage to be higher than the last entry price for Longs, and lower than the last entry price for Shorts. This covers all previous positions and maintains position sizing.
• When take profit, TP, is enabled, the pyramids also require that they will be profitable when opening a position assuming they will reach TP. This is automatically adjusted by you with the Dwn Gap/Up Gap, Slippage, and Commission settings.
Inputs Tab
General Settings
Color Traded Background
Enable to change background color where in a trade. Green for long positions and red for short positions.
Show Losing Trade-Grp
Enable to show if losing Trade-Grp and is indicated by text in blue color. The last position may be at a loss, but if there was profit for the Trade-Grp, then it will not be shown as a loss .
Show Position Values
Enable to show the currency value of each position in gold color.
Include Dividends in Profit
This feature is only applicable if the asset pays dividends and the time frame period of the chart is 1D or less, otherwise ignored. The PSE assumes dividends are taken as cash and not reinvested.
Enable to adjust ROI, CAGR, Profit/Risked, Avg Invest/Trade-Grp, and Equity to include dividend payments. This feature considers if you were in position at least one day prior to the ex-dividend date and had not exited until after the ex-dividend date.
When Show Dividends is enabled it will display the payout in currency/share, as well as the total amount based on the number of shares the position(s) of the Trade-Grp are currently holding.
Include Dividends in Profit Factor
This checkbox allows you the option to either include or not include dividends in the calculation of Profit Factor. Must enable the “Include Dividends in Profit” checkbox to include dividends in PF. The dividend payment, if any, is not considered in the calculation of a win or loss.
Show Metrics Table
Options are font size and table location.
Alert Failed to Trade
Enable for the strategy to alert you when a trade did not happen due to low equity or low order size. Applicable only for the first position of a Trade-Grp.
Trade Direction
Options are 'Longs Only', 'Both', 'Shorts Only'.
Hold Days
This is the number of days to hold before allowing the next Trade-Grp. Applies only to the first trade position of a Trade-Grp. Where a Trade-Grp consists of the first position plus any pyramid positions.
The value entered will be overwritten to >= 31 to prevent wash sale for applicable assets in the event the last Trade-Grp was a loss. Wash sale assets include stock and fund (i.e. ETF’s).
The minimum value is the equivalent of 1 candle and is automatically assigned by the PSE if the entered value is equivalent to less than one candle. To calculate Hold Days in # of candles on the Hour chart divide the chart period by 24 x #candles. On the Minute chart divide the chart period by 60 then by 24 x #candles.
Show Vertical Lines at From Date & To Date
Shows a vertical dotted line at the From Date and To Date for visual inspection of the setting.
Date Filter
When enabled, trades are allowed between the From Date and To Date, i.e., the date range.
When disabled, trades are allowed for all candles.
Partition the time when trading is allowed to see if your indicator settings work well across the date range. Click 1st Half, IQR (inter-quartile range), or 2nd Half buttons to trade a portion of the date range.
Select only one at-a-time to partition the time when trading is allowed.
When 1st Half is enabled only trades for the 1st half of the date range are allowed.
When IQR is enabled only trades for the inter-quartile date range are allowed.
When 2nd Half is enabled only trades for the 2nd half of the date range are allowed.
Position Sizing
The % of Equity to Risk has been separated into two (2) areas: for initial trades and for pyramid trades. This allows for greater ability to maximize profits within your acceptable drawdown. A variation of the Anti-Martingale method from the initial trade if you choose to use it in that manner.
% Equity to Risk for Initial Trades: enter the percent of equity you want to risk per position for the initial trades of each Trade-Grp. For example, for 1% enter 1.
% Equity to Risk for Pyramid Trades: enter the percent of equity you want to risk per position for the pyramid trades of each Trade-Grp. For example, for 2% enter 2.
% Equity for Max Position Size: the position size will not exceed this amount. For example, for 25% enter 25.
Max % Equity Drawdown Warning: an alert will be triggered if the maximum drawdown exceeds this v alue. For example, for 10% enter 10.
Stop Methods
NOTE: The Stop Method must be either Both or TSL in order for the pyramids to work. This feature enforces position sizing.
Stop-loss, SL, and trailing stop-loss, TSL, are other features that enforce risk management.
The trailing stop-loss, TSL, is activated immediately if Stop Method = TSL. If Stop Method = Both, then the TSL is activated when its value is above stop-loss, SL, for Longs and below the SL for Shorts.
The calculated TSL value (shown on the chart by + symbol) of the previous bar is used for the current bar and the plot value is off by default, but you can it turn on via the Style tab. This is available so you can better understand how the TSL value used was calculated from. It is beneficial to show when monitoring the real-time candle.
Alert Chg TSL
When enabled, this feature will alert you to update your stop price if it moves greater than the change amount in %. The amount is the absolute % so will work for both Longs and Shorts. For example, for 1% enter 1 . This is provided since some exchanges/brokers do not offer TSL orders and you must manually adjust as price action plays out.
The alert will also suggest a stop limit price based on the gap selected and explained below.
The alert will occur at the close of the candle at the calculated TSL value of the candle just prior to the real-time candle.
Dwn Gap/Up Gap Input Settings
A price gap is the difference between the closing price of the previous candle and the opening price of the current candle. Dwn Gap and Up Gap are illustrated here.
The values of the Dwn Gap and Up Gap can be seen in the Data Window and are based on the settings of the Date Filter.
The options are “zero gap”, "median gap", "avg gap", "80 pct gap", "90 pct gap". The X pct gap stands for X percentile rank. For example, "80 pct gap" means that 80% of the gaps are less than or equal to the value shown in the Data Window. Select “zero gap” to disable this feature.
If Show Stop Limit is enabled, it will show a dotted-line below or above the current stop price where a stop-limit order should be taken. It is shown based on the gap option selected. Again, the PSE trades market, limit, and stop orders, but a stop-limit may be shown if you wanted to see where one would be set using the Up/Dwn Gap.
Dwn Gap: Affects Short Take Profit, Long Pyramid Entries, and to show the Long Stop Limit.
Up Gap : Affects Long Take Profit, Short Pyramid Entries, and to show the Short Stop Limit.
Fixed Take Profit (TP)
When take profit (TP) is enabled, the PSE will determine if opening a pyramid position will be in profit assuming the TP will be hit while considering commission costs (on Properties tab).
The larger of Up Gap or Slippage value is used with Long positions regarding TP.
The larger of Dwn Gap or Slippage value is used with Short positions regarding TP.
Properties Tab
• Initial Capital: Set as desired.
• Base Currency: Leave as Default. The PSE is designed to use the instrument’s currency, therefore leave as Default.
• Order Size: Leave as default. This setting has been disabled and position sizing is handled on the Inputs tab and is based on % of equity.
• Pyramiding: Set as desired.
• Commission: Set as number %. The PSE is designed to only work with commission as a percent of the position value.
• Verify Price for Limit Orders: Set as desired.
Slippage
Adjust Slippage on the Properties tab to account for a realistic bid-ask spread. You can use one of Dwn/Up Gap values or other guidelines. Again, the Dwn/Up Gap values are based on the Date Filter input settings.
Heed warnings from the TradingView Pine Script™ manual about values entered into the Slippage field.
The Slippage (ticks) have a noticeable influence on entry price and exit price especially at the beginning when the date range includes prices from $0.01 to $100,000.00 like that for BTC-USD INDEX. When this is the case, it is best to use different slippage values when partitioning time with the Date Filter.
To minimize the effects of slippage, yet account for it select ‘median gap’ on the Input Tab and use that value for slippage on the Properties tab.
The slippage value is included in the placeholder {{strategy.order.price}}.
Leverage Trading
The PSE is designed to be used both without leverage (the default) and with leverage.
These two settings apply to Trade-Grps. For example, for 5x leverage enter 20 (1/5x100=20).
Margin for Long Positions: Set as desired. The default is 100%.
Margin for Short Positions: Set as desired. The default is 100%.
This setting on the Inputs tab applies to each trade position within a Trade-Grp.
Max % Equity per Position: Set as desired. The default is 20% and intended for non-leverage trading. For leverage trading set as desired. For example, for 3x leverage enter 300 (3x100=300).
Recalculate After Order Is Filled
The PSE uses the strategy parameter calc_on_order_fills=true to allow for enter/exit on the same bar and generate alerts immediately after an order is filled. This parameter is on the Properties tab and is named ‘Recalculate After order is filled’ and is enabled by default.
Disabling this feature will cause the PSE to not work as intended.
You will see the following Caution! on the TV Strategy Tester
This occurs because the PSE has the strategy parameter calc_on_order_fills = true.
Again, the PSE will only work as intended if this parameter is enabled and set to true.
Therefore, you can close the caution sign and be confident of receiving realistic results.
Recalculate On every tick: Disable.
Fill Orders
• Using bar magnifier: Set as desired.
• On Bar Close: Disable. The PSE will not work as intended if this is enabled.
• Using Standard OHLC: Set as desired.
Using The Alert Message Box From TV Strategy Alert
Set alerts to gain access to all the alerts from PSE. This allows for both order filled alerts, as well as the alert function calls related to refresh GTC orders, drawdown exceeded, update stop-loss order, and Failed to Trade.
Example Message for Manual Trading Alerts
(This is just an example. Consult TV manual for possible placeholders to use.)
{
Alert for {{plot("position_for_alert")}} position. (long = 1; short = -1)
{{exchange}}:{{ticker}} on TF of {{interval}} at Broker Name
{{strategy.order.action}} Equity x Equity_Multiplier USD in shares at price = {{strategy.order.price}},
where Equity_Multiplier = {{strategy.order.contracts}} x {{strategy.order.price}} / {{plot("Equity")}}
or {{strategy.order.action}} {{strategy.order.contracts}} shares at price = {{strategy.order.price}}.
}
Note: Use the Equity x Equity_Multiplier method if you have several accounts with different initial capital.
Example Message for Bot Trading Alerts
(You must consult your specific bot for configuring the alert message. This is just an example.)
{
"action": "{{strategy.order.action}}",
“price”: {{strategy.order.price}}
"amount": {{strategy.order.contracts}},
"botId": "1234"
}
Connecting to the PSE
The diagram below illustrates how to connect indicators to the PSE.
The Aroon and MACD indicators are only used here as an example. Substitute your own indicators and add as many as you like.
Connection Indicator for the PSE
A video of how to connect your indicator(s) to the PSE is below.
The Connection Indicator for the PSE, also called here the connection-indicator.
Below is a description of how to connect your chosen indicators to the connection-indicator. Two (2) indicators were chosen for the example, but you may have one (1) or many indicators.
If you have source code access to your indicators you can paste the code directly into the connection-indicator to eliminate the need to have those indicators on the chart and the additional connection of them to the connection-indicator. Below will assume source code to the indicators are not available.
The MACD and Aroon Oscillator are from TV built standard indicators and are shown here just as an example for inputs (i.e. source) to the connection-indicator. They were configured as follows:
The source code for the connection-indicator is shown below. Substitute your own chosen indicators and add as many as you like to create your connection-indicator that feeds into the PSE. The MACD and Aroon Oscillator were simply chosen as an example. Configure your connection-indicator in the manner shown below.
// This Pine Script™ code is subject to the terms of the Mozilla Public License 2.0 at mozilla.org
// This is just an example Indicator to show how to interface with the PSE.
// The indicators used in the example are standard TV built indicators.
//@version=5
indicator(title="Connection Indicator for the PSE", overlay=false, max_lines_count=500, max_labels_count=500, max_boxes_count=500)
// Ind_1 INDICATOR ++++++++++++++++++++++++++++++++++++++++++++++++++++++++
// This is just and example and used MACD histogram as the source.
Filter_Ind_1 = input.bool(false, 'Ind_1', group='Ind_1 INDICATOR ~~~~~~~~~~~~~~~~~', tooltip='Click ON to enable the indicator')
input_Ind_1 = input.source(title = "input_Ind_1", defval = close, group='Ind_1 INDICATOR ~~~~~~~~~~~~~~~~~')
Entry_Ind_1_Long = Filter_Ind_1 ? input_Ind_1 > 0 ? 1 : 0 : 0
Entry_Ind_1_Short = Filter_Ind_1 ? input_Ind_1 < 0 ? 1 : 0 : 0
Exit_Ind_1_Long = Entry_Ind_1_Short
Exit_Ind_1_Short = Entry_Ind_1_Long
// Ind_2 INDICATOR ++++++++++++++++++++++++++++++++++++++++++++++++++++++++
// This is just an example and used Aroon Oscillator as the source. Included limits to use with the oscillator to determine enter and exit.
Filter_Ind_2 = input.bool(false, "Ind_2", group='Ind_2 INDICATOR ~~~~~~~~~~~~~~', tooltip='Click ON to enable the indicator')
Filter_Ind_2_Limit = input.int(35, minval=0, step=5, group='Ind_2 INDICATOR ~~~~~~~~~~~~~~')
Filter_Ind_2_UL = Filter_Ind_2_Limit
Filter_Ind_2_LL = -Filter_Ind_2_Limit
up = input.source(title = "input_Ind_2A Up", defval = close, group='Ind_2 INDICATOR ~~~~~~~~~~~~~~')
down = input.source(title = "input_Ind_2B Down", defval = close, group='Ind_2 INDICATOR ~~~~~~~~~~~~~~')
oscillator = up - down
Entry_Ind_2_Long = Filter_Ind_2? oscillator > Filter_Ind_2_UL ? 1 : 0 : 0
Entry_Ind_2_Short = Filter_Ind_2? oscillator < Filter_Ind_2_LL ? 1 : 0 : 0
Exit_Ind_2_Long = Entry_Ind_2_Short
Exit_Ind_2_Short = Entry_Ind_2_Long
//#region ~~~~~~~ASSEMBLY OF FILTERS ~~~~~~~~~~~~~~~~~~~~~~~~~~~~~~~~~~~~~~~~~~~~~~~~~~~~~~~~~~~~~~~~~}
// You may have as many indicators as you like. Assemble them in similar fashion as below.
// ——————— Assembly of Entry Filters
Nbr_Entries = input.int(1, minval=1, title='Min Nbr Entries', inline='nbr_in_out', group='Assembly of Indicators')
// Update the assembly based on the number of indicators connected.
EntryLongOK = Entry_Ind_1_Long + Entry_Ind_2_Long >= Nbr_Entries? true: false
EntryShortOK = Entry_Ind_1_Short + Entry_Ind_2_Short >= Nbr_Entries? true: false
entry_signal = EntryLongOK ? 1 : EntryShortOK ? -1 : 0
plot(entry_signal, title="Entry_Signal", color=color.new(color.blue, 0))
// ——————— Assembly of Exit Filters
Nbr_Exits = input.int(1, minval=1, title='Min Nbr of Exits', inline='nbr_in_out', group='Assembly of Indicators', tooltip='Enter the minimum number of entries & exits
required for a signal.')
// Update the assembly based on the number of indicators connected.
ExitLongOK = Exit_Ind_1_Long + Exit_Ind_2_Long >= Nbr_Exits? true: false
ExitShortOK = Exit_Ind_1_Short + Exit_Ind_2_Short >= Nbr_Exits? true: false
exit_signal = ExitLongOK ? 1 : ExitShortOK ? -1 : 0
plot(exit_signal, title="Exit_Signal", color=color.new(color.red, 0))
//#endregion ~~~~~~~END OF ASSEMBLY OF FILTERS ~~~~~~~~~~~~~~~~~~~~~~~~~~~~~~~~~~~~~~~~~~~~~~~~~~~~~~~~~~~~~~~~~}
The input box for the connection-indicator is shown below. The default for input source is “close”. For Input_Ind_1 click the dropdown and select the MACD Histogram. For Input_Ind_2 click the dropdown and select Aroon Up and Aroon Down as shown.
Signal Connection Section of PSE
Below is a description of how to connect your chosen indicators to the PSE from the connection-indicator.
At the PSE Input tab, the Signal Connection Section is where you select the source of the Entry and Exit Signal to the PSE. These are the outputs from connection-indicator.
The default source is “close”. Click the dropdown and select the entry and exit signal to establish a connection as shown below.

Support Resistance Pivot EMA Scalp Strategy [Mauserrifle]A strategy that creates signals based on: pivots, EMA 9+20, RSI, ATR, VWAP, wicks and volume.
The strategy is developed as a helper for quick long option scalping. This strategy is primarily designed for intraday trading on the 2m SPY chart with extended hours. However, users can adapt it for use on different symbols and timeframes. These signals are meant as a helper rather than fully automated trading bots.
One of the key elements is its pivot-based calculation, driven by my integrated indicator "Support and Resistance Pivot Points/Lines ". It enables multi-timeframe pivot calculations which are used to generate the signals and offers customizability, allowing you to define rounding methods and cooldown periods to refine pivot levels. The pivots, in combination with EMA crossovers, VWAP trend, and additional filters (RSI, ATR, VWAP, wicks and volume), create an entry and exit strategy for scalping opportunities that is useful for 0/1 DTE options with an average trade time of six minutes with the default setup for SPY. Option trading should be done outside TradingView. At this moment of release there is no option trading support.
All parameters used in the strategy are tweaked based on deep backtests results and real-time behavior. Be mindful that past performance does not guarantee future results.
The strategy is designed for intermediate and advanced users who are familiar intraday option scalping techniques.
How It Works
The strategy identifies entries based on multiple conditions, including: recently above pivot, recent EMA crossovers, RSI range, candle patterns, and VWAP uptrend. It avoids trades below the VWAP lower band due to poor backtesting results in those conditions. It creates a great number of signals when it detects an uptrend, which entails: VWAP and its lower/upper band slopes are going up, and the number of next high pivot points is greater than the number of lower pivot points. This indicates that we hope it will keep going up. In historical testing, this showed favorable results. This uptrend criteria runs on 15m charts max (where up to the VWAP effectiveness is the greatest).
The strategy also checks for candle and volume patterns, identified in backtesting to improve entry levels on historic data. Which include:
A red candle after multiple green ones, hoping to jump on a trend during a small pullback
Zero lower wick
Percentage and volume is up after lower volume candles
Percentage is up and the first and second EMA slopes are going up
Percentage is up, the first EMA is higher than the second, the price low is below the second EMA and price close above it
The VWAP uptrend overrules the candle and volume conditions (thus lots of signals during those moments).
The above is the base for many signals. There is a strict mode that adds extra checks such as:
not trading when there is no next low or high pivot
requiring a VWAP uptrend only
minimum candle percentages
This mode is for analyzing history and seeing performance during these conditions. It is worth it to create a separate alert for strict mode so you are aware of these conditions during trading.
When no stop has been defined, exits will always happen on pivot crossunder confirmations. If a stop is defined (default config), the strategy exits a position when:
the position is negative or no trail has been set
at least 1 bar has past
OR no stop has been defined (overrules previous)
trail has not been activated
The second exit condition happens when the close is below first EMA(9 by default) and when:
the position has been above first EMA
the gap between close and last pivot isn't small
the position is negative or no trail has been set
OR no stop has been defined (overrules above)
trail has not been activated
There are some more variations on this but the above are the most common. These exit conditions are a safety net because the strategy heavily relies on and favors stops. The settings allow changing stops, profit takers and trails. You can configure it to always sell without the conditions above.
The script will paint the pivot lines, trailing activation/stops, EMAs and entry/exits; with extra information in the data panel. For a complete view add VWAP and RSI to your chart, which are available from TradingView official indicator library. The strategy will not rely on those added indicators since VWAP and RSI are programmed in. You can add them to track the behavior of the signals based on these filters you have configured and have a complete view trading this strategy.
As mentioned earlier, the default settings are built for SPY 2m charts, with extended hours and real-time data. Open the strategy on this chart to study how all input parameters are used. If you don't have real-time data you need to adjust the minimum volume settings (set it to 0 at first).
The backtest
The default backtest configuration is set up to simulate SPY option trading.
Start capital is set to 10,000 and we risk around 5% of that per trade (1 contract)
Commission is set to 0.005%. The reason: at the time of this publication the SPY index price is approximately $580. Two ITM 0/1 DTE options contracts, each priced around $280, which is approximately $560. The typical commission for such a trade is around $3. To simulate this commission in the backtest on the SPY index itself, a commission of 0.005% per trade has been applied, approximating the options trading costs.
Slippage of 3 is set reflecting liquid SPY
The bar magnifier feature is turned on to have more realistic fills
Trading
In backtesting, setting commission and slippage to 0 on the SPY 2m chart shows many trades result around breaking even. Personally, I view them as an opportunity and safety net to help manage emotional decisions for exits. The signals are designed for short option scalps, allowing traders to take small profits and potentially re-enter during the strategy’s position window. It's advisable to take small potential profits, such as 4%, whenever the opportunity arises and consider re-entering if the setup still looks favorable, for example price still above ema9. Exiting a long position below ema9 is a common strategy for 2m scalping.
The average trade duration is approximately 6 minutes (3 bars). The choice between ITM (in-the-money), ATM (at-the-money), or OTM (out-of-the-money) options will depend on your trading style. Personally, I’ve seen better results with ITM options because they tend to move more in sync with the underlying index, thanks to their higher delta.
It’s important to note that the signals are designed to be a helper for manual trading rather than to automate a bot. Users are encouraged to take small profits and re-enter positions if favorable conditions persist. Be mindful that past performance does not guarantee future results.
For the default SPY setup the losses will mostly be 4-10% for ITM options. Be mindful of extreme volatile conditions where losses may reach 30% quickly, especially when trading ATM/OTM options.
The following settings can be changed:
8 pivot timeframes with left/right bars and days rendered
Here you can configure the timeframes for the pivots, which are crucial. The strategy wants that a crossover has happened recently (so it might enter after a crossunder if the crossover was recent) or the price is still above the crossed pivot.
When you decide to use a pivot timeframe higher than your chart, make sure it aligns the same starting point as the chart timeframe. As stated in the 43000478429 docs, there is a dependency between the resolution and the alignment of a starting point:
1–14 minutes — aligns to the beginning of a week
15–29 minutes — aligns to the beginning of a month
from 30 minutes and higher — aligns to the beginning of a year
This alignment also affects the setting of rendered days. I recommend a max value of 5 days for 1-14 minutes timeframes.
Also make sure a higher pivot timeframe can be divided by the lower. For instance I had repaint issues using 3m pivots on a 2m chart. But 4m pivots work fine.
Please look up docs 43000478429 to make sure this information is still up to date.
Pivot rounding
The pivot rounding option is used to add pivots based on a rounded price and limit the number of pivots. While this feature is disabled by default it can be useful with tweaking strategy variations, because many orders are placed at rounded levels and tend to act as strong price barriers.
There are multiple rounding methods: round, ceil/floor, roundn (decimal) and rounding to the minimal tick.
The next feature is a powerful extension called "Cooldown rounding":
Pivot cooldown rounding
This rounds new pivot levels for a cooldown period to keep the previous pivot line instead of adding a new line when they match the rounded value within the cooldown period. The existing line will be extended. This feature is useful because it makes sure the initial line is added to the exact high/low pivot level but any future lines within the rounding will just extend the existing line. This limits the number of pivots while still having precise levels (which normal rounding lacks) and allows more precise pivot trading.
This feature also helps ensure that the number of rendered lines will not exceed 500 too much, which is the render limit on TradingView.
You can set a maximum minutes for the cooldown. The default is 3 years which will enable the cooldown rounding permanently on the intraday (due to the max bar limit).
Pivot always added when new higher/lower pivot
When using cooldown rounding, one may find it useful to override this behavior when a new lower or higher pivot level has been reached. When enabled the new level will be added despite the fact that they may be rounded the same in the cooldown check. This is a good balance between limiting pivots but also allowing preciser trading.
VWAP bands multiplier
This is used to tweak the inner VWAP working for the upper and lower band. The default VWAP multiplier (0.9) is set based on backtesting since it performed better on historic data (the strategy does not trade below the lowerband). When you add the VWAP indicator from the TradingView library to the chart, make sure it uses the same multiplier setting as within this strategy so you have a correct view of the conditions the strategy acts on.
ATR EMA smoothing length
Used to tweak the ATR EMA smoothing. By default it is set up to 4 based on deep backtesting historic data.
EMA lengths
Changing the EMA length allows you to fine tune the EMA crossing behavior. By default the strategy is set up to EMA 9 and 20 which are considered commonly used values on the 2-minute chart.
Trading intraday time restrictions
For intraday charts you can configure when the strategy starts trading after market open and when it stops, including a hard sell. This makes sure there are no open positions left for the day during backtesting and can also aid in your trading style. For example some scalpers will not trade in the first two hours. Having no signals during this time can be beneficial. It is possible to configure these settings based on the number of bars or minutes.
Not trading on days the market closes earlier
By default the strategy does not trade on days the market closes earlier in the US. This makes sure there are no open positions left open during backtesting. Make sure to change it when using it on such a day. The days are: day before independence day, day after thanksgiving, Christmas eve and new years eve.
Not trading below VWAP lowerband
Backtesting has shown poor performance when trading below the VWAP lowerband but you are free to allow it to trade in such conditions. Past performance does not guarantee future results.
Minimum volume
A minimum volume can be set up. The current value is based on better deep backtest results for SPY using real-time data (48000). When you do not have a data plan for SPY, please set it to 0 and tweak based on backtests.
Minimum ATRP
The strategy has shown during my trading that it is sensitive to higher ATRP values and more volatile market conditions. There is more chance the index moves and we can profit from this during option scalping (if it moves in your favor). The default is based on SPY backtesting (0.04%), as a balance to have a lot of trades but also capture minimal movement.
RSI range
A RSI range can be set using a minimum and maximum value so we can limit trading during overbought/oversold conditions. Backtesting for SPY has shown the strategy performs better on historic data within a tighter range, so a default range has been set to 40-65.
Allow orders on every tick (no effect on stop/profit/trail)
This setting is used to allow orders on every tick. The strategy has been developed without trading on every tick but you can change this, for example when you have configured a setup different than the default configuration that you know works well with this. The default setup will not work well with it due to too many constant signals.
Stop percentage + ATRP threshold
One of the most important settings for managing the risk. I recommend setting a stop percentage first and later the ATRP threshold where the stop is calculated based on the current ATRP value. The calculated value will only be in effect when it is greater than the normal stop--the normal stop acts as baseline. The default stop is low (0.03). With a default ATRP threshold stop of 1.12, the calculated value overrules the normal stop when the value is greater. 0.03 acts as a minimum value but in reality the stop will most likely be higher on average for SPY with the default ATRP threshold.
For the default SPY setup the losses will be around 4-10% for ITM options. Be mindful of extreme volatile conditions where losses may reach 30% quickly, especially when trading ATM/OTM options.
Profit taker percentage + ATRP threshold
Same principles as the stop percentage above, but for profit taking. There is a very high ATRP threshold of 4 set by default. Backtests showed that trailing stops perform better on historic data.
Trailing stop
Used to set up a trailing stop. A useful feature to secure profit after a run-up, or get out with a small loss after initial activation. It is important to not use too tight values because they will give unrealistic backtest results and trigger too fast in real-time. Both the trail activation level and trail stop itself can be configured with a percentage value and ATRP value. I recommend setting up the ATRP last. By default the values are 0.05 for activation and 0.03 for the stop based on SPY real-time behavior.
Always sell on pivot crossunder confirmation
The strategy includes pivot crossunder confirmations as sell condition. By default it will not sell on every crossunder confirmation but checks for different conditions (explained in detail earlier in this description). You can change this behavior.
Always sell below first EMA when position has been above
The strategy sells below the first EMA when the position has been above it. By default it will not always sell but checks for different conditions (mentioned earlier in this description). You can change this behavior.
Buy modes pivot
By default the strategy buys between pivots as long as there has been a pivot crossover and EMAs crossover recently or price is still above it. You can change the behavior so it only buys on pivot crossovers or pivot crossover confirmations. Backtesting on the default setup shows decreased performance but for other strategy variations and pivot setups this feature can be useful since many scalpers do not buy between pivots.
Strict mode
There is a strict mode that adds extra checks such as not trading when there is no next low or high pivot, requiring a VWAP uptrend only and minimum candle percentages. This mode is for analyzing history and seeing performance during these conditions. It is worth it to create a separate alert for strict mode so you are aware of these conditions during trading. The deep backtests improved with these setting but past performance does not guarantee future results.
In the strict mode section you can override the stop, minimum ATRP, set up a minimum percentage, only trade VWAP uptrends and to not trade candles without a wick.
A summary and some extra detail
At the time of release only long trades are supported
The strategy is meant for quick scalping but one might find other uses for it
Enable extended hours on intraday charts so it captures more pivots
It does not trade extended hours (pre and post market) since options do not trade during those times
real-time data is recommended and required if a symbol has delayed data by default
You can configure that it trades minutes after market open and hard sells minutes after market open
The entries have a specific label text, example: "833 LE1 / 569.71 / P:569.8". This means: / / . The condition number is only for development/debug purposes for me when you have an issue.
The strategy cannot be tweaked to work on multiple symbols and timeframes with a single config. So you will have to make a config for every timeframe and symbol. I recommend using the Indicator Templates feature of TradingView. This way you can save the settings per timeframe and symbol
The strategy is per default config very dependent on (trailing) stops because it trades between pivots too. It wants that a pivot and EMA crossover has happened more recently than a crossunder. But you can change this behavior to always force crossover buys and crossunder sells.
It’s recommended to set up alerts to notify you of entry and exit signals. Watching the chart alone might cause you to miss trades, especially in fast-moving markets.
Only a max of 500 lines can be rendered on the chart, but the strategy will function with more under the hood. When you exceed 500 you will notice the beginning of the chart has no pivots, but beneath everything functions for backtesting.
Changing settings
Changing the settings for a different symbol and/or timeframe can be a challenging task. Here's a how-to you could use the first time to help you get going:
Set commission and slippage to 0. I prefer to do this so it is more clear whether you are balancing on break-even trades
Enable the pivot timeframe equal or above your chart timeframe. Avoid repainting as discussed earlier by choosing timeframes that align with the same timeframe
Set all volume, ATR, stop, profit takers and trail values to 0
Make sure strict mode is disabled at the bottom of the settings
You now have a clean state and you should see the backtest results purely based on pivot and EMA conditions
Tweak the stop and profit taker, beginning with the simple values and then ATRP threshold
At the last moment tweak the trailing stops. Tight trailing stops create an unrealistic backtest so you will need to tweak them based on real-time behavior of the symbol you're using which you will have to monitor during signals while the market is open. The default values are low (2m intraday SPY). Only with the bar magnifier feature it is somewhat possible to tweak realistic with history data. The tighter they are, the more unrealistic your backtest results. As a starting point, set the trailing stop low and find the highest activation level that doesn't change the results drastically, then increase the stop to the value you think reflects real-time behavior.
Keep refining by testing it during real-time behavior. Does it exit too early according to your own judgment? You need to increase the stop and maybe the activation level.
I hope you will find this useful!
DISCLAIMER
Trading is risky & most day traders lose money. This indicator is purely for informational & educational purposes only. Past performance does not guarantee future results.

Strategy Container_Variable Pyramiding & Leverage [Tradingwhale]This is a strategy container . It doesn’t provide a trading strategy. What it does is provide functionality that is not readily available with standard strategy ’shells.’
More specifically, this Strategy Container enables Tradingview users to create trading strategies without knowing any Pine Script code .
Furthermore, you can use most indicators on tradingview to build a strategy without any coding at all, whether or not you have access to the code.
To illustrate a possible output in the image (buy and sell orders) of this strategy container, we are using here an indicator that provides buy and sell signals, only for illustration purposes. Again, this is a strategy container, not a strategy. So we need to include an indicator with this published strategy to be able to show the strategy execution.
What can you do with this strategy container? Please read below.
Trade Direction
You can select to trade Long trades only, Short trades only, or both, assuming that whatever strategy you create with this container will produce buy and sell signals.
Exit on Opposite
You can select if Long signals cause the exit of Short positions and vice versa. If you turn this on, then a sell/short signal will cause the closing of your entire long position, and a buy/long signal will cause the closing of your entire short position.
Use external data sources (indicators) to (a) import signals, or (b) create trading signals using almost any of the indicators available on Tradingview.
Option 1:
When you check the box ‘Use external indicator Buy & Sell signals?’ and continue to select an external indicator that plots LONG/BUY signals as value '1' and SHORT/SELL signals as value '-1, then this strategy container will use those signals for the strategy, in combination with all other available settings.
Here an example of code in an indicator that you could use to import signals with this strategy container:
buy = long_cond and barstate.isconfirmed
sell = short_cond and barstate.isconfirmed
//—------- Signal for Strategy
signal = buy ? 1 : sell ? -1 : 0
plot(plot_connector? signal : na, title="OMEGA Signals", display = display.none)
Option 2:
You can create buy/long and sell/short signals from within this strategy container under the sections called “ Define 'LONG' Signal ” and “ Define 'SHORT' Signal .”
You can do this with a single external indicator, by comparing two external indicators, or by comparing one external indicator with a fixed value. The indicator/s you use need to be on the same chart as this strategy container. You can add up to two (2) external indicators that can be compared to each other at a time. A checkbox allows you to select whether the logical operation is executed between Source #1 and #2, between Source # 1 and an absolute value, or just by analyzing the behavior of Source #1.
Without an image of the strategy container settings it’s a bit hard to explain. However, below you see a list of all possible operations.
Operations available , whenever possible based on source data, include:
- "crossing"
- "crossing up"
- "crossing down"
- "rejected from resistance (Source #1) in the last bar", which means ‘High’ was above Source #1 (resistance level) in the last completed bar and 'Close' (current price of the symbol) is now below Source #1" (resistance level).
- "rejected from resistance (Source #1) in the last 2 bars", which means ‘High’ was above Source #1 (resistance level) in one of the last two (2) completed bars and 'Close' (current price of the symbol) is now below Source #1" (resistance level).
- "rejected from support (Source #1) in the last bar" --- similar to above except with Lows and rejection from support level
- "rejected from support (Source #1) in the last 2 bars" --- similar to above except with Lows and rejection from support level
- "greater than"
- "less than"
- "is up"
- "is down"
- "is up %"
- "is down %"
Variable Pyramiding, Leverage, and Pyramiding Direction
Variable Pyramiding
With this strategy container, you can define how much capital you want to invest for three consecutive trades in the same direction (pyramiding). You can define what percentage of your equity you want to invest for each pyramid-trade separately, which means they don’t have to be identical.
As an example: You can invest 5% in the first trade let’s call this pyramid trade #0), 10% in the second trade (pyramid trade #1), and 7% in the third trade (pyramid trade #2), or any other combination. If your trading strategy doesn’t produce pyramid trading opportunities (consecutive trades in the same direction), then the pyramid trade settings won’t come to bear for the second and third trades, because only the first trade will be executed with each signal.
Leverage
You can enter numbers for the three pyramid trades that are combined greater than 100%. Once that is the case, you are using leverage in your trades and have to manage the risk that is associated with that.
Pyramiding Direction
You can decide to scale only into Winners, Losers, or Both. Pyramid into a:
- Losers : A losing streak occurs when the price of the underlying security at the current signal is lower than the average cost of the position.
- Winners : A winning streak occurs when the price of the underlying security at the current signal is higher than the average cost of the position.
- Both means that you are selecting to scale/pyramid into both Winning and Losing streaks.
Other Inputs that influence signal execution:
You can choose to turn these on or off.
1. Limit Long exits with a WMA to stay longer in Long positions: If you check this box and enter a Length number (integer) for the WMA (Weighted Moving Average), then Long positions can only be exited with short signals when the current WMA is lower than on the previous bar/candle. Short signals sometimes increase with uptrends. We’re using this WMA here to limit short signals by adding another condition (WMA going down) for the short signal to be valid.
2. Maximum length of trades in the number of candles. Positions that have been in place for the specified number of trades are excited automatically.
3. Set the backtest period (from-to). Only trades within this range will be executed.
4. Market Volatility Adjustment Settings
- Use ATR to limit when Long trades can be entered (enter ATR length and Offset). We’re using the 3-day ATR here, with your entries for ATR length and offset. When the 3-day ATR is below its signal line, then Long trades are enabled; otherwise, they are not.
- Use VIX to limit when Short trades can be entered (enter VIX). If you select this checkbox, then Short trades will only be executed if the daily VIX is above your set value.
- Use Momentum Algo functions to limit Short trades. This uses the average distance of Momentum Highs and Lows over the lookback period to gauge whether markets are calm or swinging more profoundly. Based on that you can limit short entries to more volatile market regimes.
Set:
- Fast EMA and Slow EMA period lengths
- Number of left and right candles for High and Low pivots
- Lookback period to calculate the High/Low average and then the distance between the two.
The assumption here is that greater distances between momentum highs and lows correlate positively with greater volatility and greater swings in the underlying security.
Stop-Loss
Set separate stop-losses based on % for Long and Short positions. If the position loses X% since entry, then the position will be closed.
Take-Profit
Set separate take-profit levels based on % for Long and Short positions. If the position wins X% since entry, then the position will be closed.

FluxFilter Trend Strategy [BITsPIP]Hello fellow traders, I'm excited to share with you the FluxFilter Trend Strategy, a trading approach I've developed for those interested in exploring trend-following strategies. My goal was to create something straightforward and accessible, so traders looking to refine their portfolios can easily integrate its features. By the end of this guide, I hope you'll have a solid grasp of how the FluxFilter Trend Strategy functions, appreciate its benefits, understand its potential drawbacks, and see how it might fit into various trading contexts.
I) Overview
The FluxFilter Trend Strategy is tailored to align with the market's long-term trend. It examines the price data from the previous year to gauge the market's overall trajectory by employing moving averages. Subsequently, within shorter timeframes, the strategy utilizes a combination of modified Supertrend, Hull Suite, and various trend-following and filtering techniques to generate buy or sell signals. Although its advanced take profit and stop loss mechanisms might initially present a learning curve, they are integral to the strategy's effectiveness. They are designed to secure gains by capturing prevailing trends and mitigating the impact of false reversal signals.
II) Deep Backtesting
Deep backtesting stands as a cornerstone in the development of trading strategies, offering a robust method for traders to assess the performance of their strategy against historical data. This process yields a retrospective view, illustrating how the strategy might have navigated through past market fluctuations, thereby shedding light on its potential robustness and areas for refinement. However, it's crucial to acknowledge that a strategy's performance can be influenced by a myriad of factors including market dynamics, the chosen timeframe, and the inherent attributes of the traded asset. Consequently, it's advisable to conduct thorough backtesting under various conditions to ascertain the strategy's reliability before applying it to actual trading scenarios.
III) Benefits
A primary advantage of the FluxFilter Trend Strategy is its proficiency in discerning genuine market trends from mere price fluctuations, thereby avoiding premature or uncertain trades. Unlike approaches that take high risks on speculative trades, this strategy prioritizes a high degree of confidence in the direction of the trade. It meticulously waits for a clear confirmation of the market trend. Once this certainty is established, the strategy promptly generates trade signals, ensuring that traders are positioned to capitalize on optimal market entry points without delay. This approach not only enhances the potential for profit but also aligns with a disciplined and methodical trading ethos.
IV) Applications
FluxFilter Trend Strategy can be applied across various timeframes, with a particular efficacy in those under 15 minutes. Its adaptable framework means it can be customized to cater to a variety of asset classes, encompassing stocks, commodities, forex, and cryptocurrencies. Initially, the strategy was specifically calibrated for low-volatile cryptocurrencies, as reflected in the default settings for stop loss and take profit values. It's important to recognize that the unique volatility and trend patterns of your selected market necessitate careful adjustments to these parameters. This fine-tuning of profit targets and stop loss thresholds is crucial for aligning the strategy with the specific dynamics of your chosen market, which I will discuss shortly.
V) Strategy's Logic
1. Trend Identification: My conviction lies in the power of trend trading to yield long-term gains. Central to the FluxFilter Trend Strategy is the Hull Suite indicator, a tool developed by InSilico, serving as one of the confirmation indicators. This indicator acts as a compass for trend direction; a price residing above the Hull Suite line signals an uptrend, potentially marking an entry point for a buy position or confirming it. In contrast, a price positioned below this line suggests a downtrend, potentially indicating a strategic moment to sell or confirming the sell.
2. Noise Reduction: The financial markets are known for their 'noise'—short-lived price movements that can obscure the true market direction. The FluxFilter Trend Strategy is designed to sift through this noise, thereby facilitating more lucid and informed trading decisions. It employs a set of straightforward yet innovative techniques to single out significant misleading fluctuations. This is achieved by analyzing recent bars to spot bars with unusually large bodies, which often represent misleading market noise.
3. Risk Management: A key facet of the strategy is its emphasis on pragmatic risk management. Traders are empowered to establish practical stop-loss and take-profit levels, tailoring these crucial parameters to the specific market they are engaging in. This customization is instrumental in optimizing long-term profitability, ensuring that the strategy adapts fluidly to the unique characteristics and volatility patterns of different trading environments.
VI) Strategy's Input Settings and Default Values
1. Modified Supertrend
i. Factor: Serving as a multiplier in the Average True Range (ATR) calculation, this parameter adjusts the distance of the Supertrend line relative to the price chart. Elevating the factor value widens the gap between the Supertrend line and price, offering a more conservative stance. On the flip side, diminishing the factor value pulls the Supertrend line closer to the price action, heightening its sensitivity. While the preset value is 1, you have the flexibility to modify this to suit your trading approach.
ii. ATR Length: This defines the count of bars that are incorporated into the ATR computation, directly influencing the Supertrend's adaptability to market changes. With a default setting of 30 bars, it strikes a balance, smoothing over short-term fluctuations while maintaining a meaningful sensitivity to market trends. Adjusting this parameter allows you to tailor the indicator's responsiveness to suit your trading strategy, considering the volatility and behavioral patterns of the asset you are trading.
2. Hull Suite
i. Hull Suite Length: Designed for capturing long-term trends, the Hull Suite Length is configured at 1000. Functioning comparably to moving averages, the Hull Suite features upper and lower bands, though these are not employed in our current strategy.
ii. Length Multiplier: It's advisable to maintain a minimal value for the Length Multiplier, prioritizing the optimization of the Hull Suite Length. Presently, it is set to 1.
3. Filtering Indicators
i. Fluctuation Filtering Percentage: It's advisable to set this parameter to ten times the size of the average bar in your specific market, as this helps effectively mitigate the impact of market fluctuations. While the initial default is 0.4(%), based on the BTCUSDT market, it's crucial to adjust this figure to align with the characteristics of different assets or markets you're trading in.
ii. Fluctuation Filtering Bars: This parameter designates the count of preceding bars to consider when assessing market fluctuations. It's fully customizable, allowing you to tailor it based on your market insights. The preset default is 3, a balance chosen to minimize susceptibility to potentially misleading signals.
iii. Trend Confirmation Percentage: This metric is pivotal for verifying the viability of a trend post-entry. If the trade doesn't achieve this percentage in profit, it indicates a deviation from the expected trend. Under such circumstances, it may be prudent to exit the trade prematurely rather than awaiting the stop-loss trigger. It's recommended to set this parameter at half the size of the average candle body for the market you're analyzing. The initial default is set at 0.2(%).
4. StopLoss and TakeProfit
i. StopLoss and TakeProfit Settings: Two distinct approaches are available. Semi-Automatic StopLoss/TakeProfit Setting and Manual StopLoss/TakeProfit Setting. The Semi-Automatic mode streamlines the process by allowing you to input values for a 5-minute timeframe, subsequently auto-adjusting these values across various timeframes, both lower and higher. Conversely, the Manual mode offers full control, enabling you to meticulously define TakeProfit values for each individual timeframe.
ii. TakeProfit Threshold # and TakeProfit Value #: Imagine this mechanism as an ascending staircase. Each step represents a range, with the lower boundary (TakeProfit Value) designed to close the trade upon being reached, and the upper boundary (TakeProfit Threshold) upon being hit, propelling the trade to the next level, and forming a new range. This stair-stepping approach enhances risk management and has the potential to increase profitability. The pre-set configurations are tailored for volatile markets, such as BTCUSDT. It's advisable to devote time to tailoring these settings to your specific market, aiming to achieve optimal results based on backtesting.
iii. StopLoss Value: In line with its name, this value marks the limit of loss you're prepared to accept should the market trend go against your expectations. It's crucial to note that once your asset reaches the first TakeProfit range, the initial StopLoss value becomes obsolete, supplanted by the first TakeProfit Value. The default StopLoss value is pegged at 1.8(%), a figure worth considering in your trading strategy.
VII) Entry Conditions
The principal element that triggers the signal is the Modified Supertrend. Additional indicators serve as confirmatory tools. Nonetheless, to refine your strategy effectively, it's crucial to fine-tune the parameters. This involves adjusting input variables such as take profit levels, threshold parameters, and the filtering values discussed previously.
VIII) Exit Conditions
The strategy stipulates exit conditions primarily governed by stop loss and take profit parameters. On infrequent occasions, if the trend lacks confirmation post-entry, the strategy mandates an exit upon the issuance of a reverse signal (whether confirmed or unconfirmed) by the strategy itself.
Good Luck!!

Megabar Breakout (Range & Volume & RSI)Hey there,
This strategy is based on the idea that certain events lead to what are called Megabars. Megabars are bars that have a very large range and volume. I wanted to verify whether these bars indicate the start of a trend and whether one should follow the trend.
Summary of the Code:
The code is based on three indicators: the range of the bar, the volume of the bar, and the RSI. When certain values of these indicators are met, a Megabar is identified. The direction of the Megabar indicates the direction in which we should trade.
Why do I combine these indicators?
I want to identify special bars that have the potential to mark the beginning of a breakout. Therefore, a bar needs to exhibit high volume, have a large range (huge price movement), and we also use the Relative Strength Index (RSI) to assess potential momentum. Only if all three criteria are met within one candle, do we use this as an identifier for a megabar.
Explanation of Drawings on the Chart:
As you can see, there is a green background on my chart. The green background symbolizes the time when I'm entering a trade. Only if a Megabar happens during that time, I'm ready to enter a trade. The time is between 6 AM and 4 PM CET. It's just because I prefer that time. Also, the strategy draws an error every time a Megabar happens based on VOL and Range only (not on the RSI). That makes it pretty easy to go through your chart and check the biggest bars manually. You can activate or deactivate these settings via the input data of the strategy.
When Do We Enter a Trade?
We wait for a Megabar to happen during our trading session. If the Megabar is bullish, we open a LONG trade at the opening price of the next candle. If the Megabar is bearish, we open a SHORT trade at the opening price of the next candle.
Where Do We Put Our Take Profit & Stop Loss?
The default setting is TP = 40 Pips and SL = 30 Pips. In that case, we are always trading with a risk-reward ratio of 1.33 by default. You can easily change these settings via the input data of the strategy.
Strategy Results
The criteria for Megabars were chosen by me in a way that makes Megabars something special. They are not intended to occur too frequently, as the fundamental idea of this strategy would otherwise not hold. This results in only 37 closed trades within the last 12 months. If you change the criterias for a megabar to a milder one, you will create more Megabars and therefore more trades. It's up to you. I have adapted this strategy to the 30-minute chart of the EURUSD. In the evaluation, we consider a period of 12 months, which I believe is sufficient.
My default settings for the indicators look like this:
Avg Length Vol 20
Avg Multiplier Vol 3
Avg Length Range 20
Avg Multiplier Range 4
Value SMA RSI for Long Trades 50
Value SMA RSI for Short Trades 70
IMPORTANT: The current performance overview does not display the results of these settings. Please change the settings to my default ones so that you can see how I use this strategy.
I do not recommend trading this strategy without further testing. The script is meant to reflect a basic idea and be used as a tool to identify Megabars. I have made this strategy completely public so that it can be further developed. One can take this framework and test it on different timeframes and different markets.

Sine Wave TheoryThere are some ideas out there that the market is like a collection of quantum events and that it could all be broken down into sine waves. I created this script to put that to the test.
The idea is simple, I tested 3 different factors that could be put into sine wave form.
1.) Bar Change
2.) Volume Average Change
3.) Coin Flip
For the bar change, I simply allow the sine wave to move upwards or downwards if the bars have changed color in their sequence. For example, if there were 3 red bars and 1 green bar, it would not move the sine wave up or down until the green bar appeared.
For the average volume change, it was the same idea, except that the sine wave could only move up or down if the volume had moved up or below the average value of the length given for calculating the average volume.
Finally, the coin flip simply simulates flipping a coin, and allows the sine wave to move one direction or the other once it has a side that is different from the previous chosen side. For example, heads, heads, heads, tails (once it flipped to tails, this would allow it to move a direction).
The sine wave trading theory that I watched claimed that if you know the correct sine wave # (which is how large the peak is, and/or the sine wave count which is how many peaks and valleys occur) that you can successfully predict future trades. Their claims that the reason it does not look like a perfect sine wave for these events is because there is different amounts of trading going on, thus the timing will be slightly off.
I am posting this to disagree with their ideas. For example, if you select to turn on trading for coin flip and turn off bar change, you will see the coin flip did better on the default settings!
It just so happens that any setting will eventually be good, making all the sine wave variations just completely random if you win or not.
I posted this to demonstrate how silly trading sine waves is. The real trick is using cosine and tangent waves... lol j/k
I hope this helps someone avoid this scam concept.
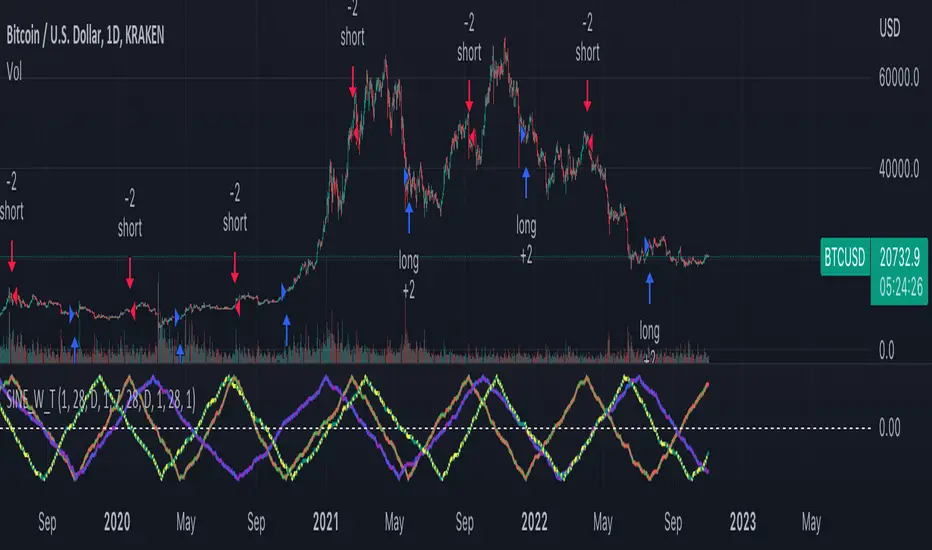
Probabilistic Analysis Table - The Quant ScienceProbabilistic Analysis Table - The Quant Science ™ is the quantitative table measuring the probability of price changes and quantifies the ratio of sessions for three different assets.
This table measures the ratios of bull and bear events and measures the probability of each event through data generated automatically by the algorithm.
The data are calculated for three different assets:
1. Main asset: set on the chart.
2. Second asset: set by user interface.
3. Third asset: set by the user interface.
The timeframe is set by the chart and is the same for all three assets. You can change the timeframes directly from the chart.
The user can add tickers and adjust the analysis period directly from the user interface. The user can edit the percentage changes and the values to be analyzed for each asset, directly from the user interface.
TABLE DESCRIPTION
1. Total global trade session: are the total number of bars for each asset.
2. Total positive trade session: are the number of positive bars for each asset.
3. Probability positive trade session: is the ratio of total sessions to positive sessions.
4. Total negative trade session: are the number of negative bars for each asset.
5. Probability negative trade session: is the ratio of total sessions to negative sessions.
6. Positive trade session 0.50%: are the number of positive bars greater than 0.50% for each asset.
7. Probability positive trade session 0.50%: is the ratio of total sessions to positive sessions with increases greater than 0.50% (this value is set by default, you can change it from the user interface).
8. Negative trade session -0.50%: are the number of negative bars smaller than -0.50% for each asset.
9. Probability negative trade session -0.50%: is the ratio of total sessions to negative sessions with declines less than -0.50% (this value is set by default, you can change it from the user interface).
10. Positive trade session 1%: are the number of positive bars greater than 1% for each asset.
11. Probability positive trade session 1%: is the ratio of total sessions to positive sessions with increases greater than 1% (this value is set by default, you can change it from the user interface).
12. Negative trade session -1%: are the number of negative bars less than -1% for each asset.
13. Probability negative trade session -1%: is the ratio of total sessions to negative sessions with declines less than -1% (this value is set by default, you can change it from the user interface).
This table was created for traders and quantitative investors who need to quickly analyze session ratios and probabilities.

Customizable OCC Non Repainting Scalper Bot v7.0bThis strategy is intended to be used on an automated trading platform and should be run on a one minute chart for fastest confirmations and signal relay to crypto automation platform. The strategy has been modded to only go long at this time to focus on profitability for one direction. The open long and close long text fields allow you to use your own webhook message for this purpose.
I have spent quite a bit of time and I figured I would put it out to the community to share the work and also get some feedback.
Ok, so let me say that I have done absolutely everything I can to make the strategy not repaint while still maintaining it's profitability. It has been a challenge so I am publishing this to the community to help test this.
What I have observed: the strategy will not repaint in real time. That is, if you have the chart open and keep it open, the signals are the same as the ones that are sent out by the strategy. In certain cases, when I reload the chart- the signals might be off from what was sent. In some ways, that is repainting, but it is repainting based on losing the real time data and recalculating from a different set of bars- since I am running it on a one minute chart then the start becomes different when you refresh.
To address repainting while keeping the strategy calculating as quickly as possibly I have altered the logic in the following ways:
I have made an assumption which might not work for everyone- at the first tick of the next bar, you can almost safefly assume in crypto that if you are looking at the previous bar for information, the open of the current bar was the close of the previous bar. This for the most part holds true in crypto with good liquidity. If you are trading a pair that jumps around due to low volume- this might not be the strategy to use. I might publish a different version with a different logic.
I have altered the security repaint to use isbarconfirmed, so at the very end of the bar (as soon as the bar is confirmed), we recalculate to the higher time frames. So as soon as the data is available, it is at that point that we can then safely calculate higher time frames. This is unique and experimental, but seems to do well at creating good signals for entry.
I have employed my own intervals by utilizing the resolution as an integer (used by the previous authors)- but in this case, I use the interval to take a snapshot of the higher time frame. With open close cross, the different moving averages can cause the repainting as they change to show the exact point of the cross. The interval feature I created minimizes this by utilizing the previous bar info until the interval is closed and then we recalculate the variants. You can use the interval offset feature to denote which minute is the one that starts and ends the interval. So for instance, Trading View uses minue 1 and minute 31 for 30 minute intervals. If you offset your 30 minute interval would start on minute 16 and do its calculations based on the last 30 minutes,
As with most of my scripts, I have started using filters and a "show data" feature that will give you the ability to see the values of indicators that you cannot plot in the overlay. This allows you to figure out how to filter losing trades or market conditions.
I have also added a trailing stop and created a fixed stop loss as seems to perform better than the original occ strategy. The original one seemed to repaint enough that it would close too quickly and not give the posiition enough time to become profitable. In certain cases where there was a large move, it would perform well, but for the most part the trades would not close profitably even though the backtest said that it did - probably due to the delay in execution and pinescript not having a confirmation on what the actual position price was.
This is still in beta mode, so please forward test first and use at your own risk.
If you spot repaint issues, please send me a message and try to explain the situation.

Bjorgum Double Tap█ OVERVIEW
Double Tap is a pattern recognition script aimed at detecting Double Tops and Double Bottoms. Double Tap can be applied to the broker emulator to observe historical results, run as a trading bot for live trade alerts in real time with entry signals, take profit, and stop orders, or to simply detect patterns.
█ CONCEPTS
How Is A Pattern Defined?
Doubles are technical formations that are both reversal patterns and breakout patterns. These formations typically have a distinctive “M” or a “W” shape with price action breaking beyond the neckline formed by the center of the pattern. They can be recognized when a pivot fails to break when tested for a second time and the retracement that follows breaks beyond the key level opposite. This can trap entrants that were playing in the direction of the prior trend. Entries are made on the breakout with a target projected beyond the neckline equal to the height of the pattern.
Pattern Recognition
Patterns are recognized through the use of zig-zag; a method of filtering price action by connecting swing highs and lows in an alternating fashion to establish trend, support and resistance, or derive shapes from price action. The script looks for the highest or lowest point in a given number of bars and updates a list with the values as they form. If the levels are exceeded, the values are updated. If the direction changes and a new significant point is made, a new point is added to the list and the process starts again. Meanwhile, we scan the list of values looking for the distinctive shape to form as previously described.
█ STRATEGY RESULTS
Back Testing
Historical back testing is the most common method to test a strategy due in part to the general ease of gathering quick results. The underlying theory is that any strategy that worked well in the past is likely to work well in the future, and conversely, any strategy that performed poorly in the past is likely to perform poorly in the future. It is easy to poke holes in this theory, however, as for one to accept it as gospel, one would have to assume that future results will match what has come to pass. The randomness of markets may see to it otherwise, so it is important to scrutinize results. Some commonly used methods are to compare to other markets or benchmarks, perform statistical analysis on the results over many iterations and on differing datasets, walk-forward testing, out-of-sample analysis, or a variety of other techniques. There are many ways to interpret the results, so it is important to do research and gain knowledge in the field prior to taking meaningful conclusions from them.
👉 In short, it would be naive to place trust in one good backtest and expect positive results to continue. For this reason, results have been omitted from this publication.
Repainting
Repainting is simply the difference in behaviour of a strategy in real time vs the results calculated on the historical dataset. The strategy, by default, will wait for confirmed signals and is thus designed to not repaint. Waiting for bar close for entires aligns results in the real time data feed to those calculated on historical bars, which contain far less data. By doing this we align the behaviour of the strategy on the 2 data types, which brings significance to the calculated results. To override this behaviour and introduce repainting one can select "Recalculate on every tick" from the properties tab. It is important to note that by doing this alerts may not align with results seen in the strategy tester when the chart is reloaded, and thus to do so is to forgo backtesting and restricts a strategy to forward testing only.
👉 It is possible to use this script as an indicator as opposed to a full strategy by disabling "Use Strategy" in the "Inputs" tab. Basic alerts for detection will be sent when patterns are detected as opposed to complex order syntax. For alerts mid-bar enable "Recalculate on every tick" , and for confirmed signals ensure it is disabled.
█ EXIT ORDERS
Limit and Stop Orders
By default, the strategy will place a stop loss at the invalidation point of the pattern. This point is beyond the pattern high in the case of Double Tops, or beneath the pattern low in the case of Double Bottoms. The target or take profit point is an equal-legs measurement, or 100% of the pattern height in the direction of the pattern bias. Both the stop and the limit level can be adjusted from the user menu as a percentage of the pattern height.
Trailing Stops
Optional from the menu is the implementation of an ATR based trailing stop. The trailing stop is designed to begin when the target projection is reached. From there, the script looks back a user-defined number of bars for the highest or lowest point +/- the ATR value. For tighter stops the user can look back a lesser number of bars, or decrease the ATR multiple. When using either Alertatron or Trading Connector, each change in the trail value will trigger an alert to update the stop order on the exchange to reflect the new trail price. This reduces latency and slippage that can occur when relying on alerts only as real exchange orders fill faster and remain in place in the event of a disruption in communication between your strategy and the exchange, which ensures a higher level of safety.
👉 It is important to note that in the case the trailing stop is enabled, limit orders are excluded from the exit criteria. Rather, the point in time that the limit value is exceeded is the point that the trail begins. As such, this method will exit by stop loss only.
█ ALERTS
Five Built-in 3rd Party Destinations
The following are five options for delivering alerts from Double Tap to live trade execution via third party API solutions or chat bots to share your trades on social media. These destinations can be selected from the input menu and alert syntax will automatically configure in alerts appropriately to manage trades.
Custom JSON
JSON, or JavaScript Object Notation, is a readable format for structuring data. It is used primarily to transmit data between a server and a web application. In regards to this script, this may be a custom intermediary web application designed to catch alerts and interface with an exchange API. The JSON message is a trade map for an application to read equipped with where its been, where its going, targets, stops, quantity; a full diagnostic of the current state and its previous state. A web application could be configured to follow the messages sent in this format and conduct trades in sync with alerts running on the TV server.
Below is an example of a rendered JSON alert:
{
"passphrase": "1234",
"time": "2022-05-01T17:50:05Z",
"ticker": "ETHUSDTPERP",
"plot": {
"stop_price": 2600.15,
"limit_price": 3100.45
},
"strategy": {
"position_size": 0.1,
"order_action": "buy",
"market_position": "long",
"market_position_size": 0,
"prev_market_position": "flat",
"prev_market_position_size": 0
}
}
Trading Connector
Trading Connector is a third party fully autonomous Chrome extension designed to catch alert webhooks from TradingView and interface with MT4/MT5 to execute live trades from your machine. Alerts to Trading Connector are simple; just select the destination from the input drop down menu, set your ticker in the "TC Ticker" box in the "Alert Strings" section and enter your URL in the alert window when configuring your alert.
Alertatron
Alertatron is an automated algo platform for cryptocurrency trading that is designed to automate your trading strategies. Although the platform is currently restricted to crypto, it offers a versatile interface with high flexibility syntax for complex market orders and conditions. To direct alerts to Alertatron, select the platform from the 3rd party drop down, configure your API key in the ”Alertatron Key” box and add your URL in the alert message box when making alerts.
3 Commas
3 Commas is an easy and quick to use click-and-go third party crypto API solution. Alerts are simple without overly complex syntax. Messages are simply pasted into alerts and executed as alerts are triggered. There are 4 boxes at the bottom of the "Inputs" tab where the appropriate messages to be placed. These messages can be copied from 3 Commas after the bots are set up and pasted directly into the settings menu. Remember to select 3 Commas as a destination from the third party drop down and place the appropriate URL in the alert message window.
Discord
Some may wish to share their trades with their friends in a Discord chat via webhook chat bot. Messages are configured to notify of the pattern type with targets and stop values. A bot can be configured through the integration menu in a Discord chat to which you have appropriate access. Select Discord from the 3rd party drop down menu and place your chat bot URL in the alert message window when configuring alerts.
👉 For further information regarding alert setup, refer to the platform specific instructions given by the chosen third party provider.
█ IMPORTANT NOTES
Setting Alerts
For alert messages to be properly delivered on order fills it is necessary to place the following placeholder in the alert message box when creating an alert.
{{strategy.order.alert_message}}
This placeholder will auto-populate the alert message with the appropriate syntax that is designated for the 3rd party selected in the user menu.
Order Sizing and Commissions
The values that are sent in alert messages are populated from live metrics calculated by the strategy. This means that the actual values in the "Properties" tab are used and must be set by the user. The initial capital, order size, commission, etc. are all used in the calculations, so it is important to set these prior to executing live trades. Be sure to set the commission to the values used by the exchange as well.
👉 It is important to understand that the calculations on the account size take place from the beginning of the price history of the strategy. This means that if historical results have inflated or depleted the account size from the beginning of trade history until now, the values sent in alerts will reflect the calculated size based on the inputs in the "Properties" tab. To start fresh, the user must set the date in the "Inputs" tab to the current date as to remove trades from the trade history. Failure to follow this instruction can result in an unexpected order size being sent in the alert.
█ FOR PINECODERS
• With the recent introduction of matrices in Pine, the script utilizes a matrix to track pivot points with the bars they occurred on, while tracking if that pivot has been traded against to prevent duplicate detections after a trade is exited.
• Alert messages are populated with placeholders ; capability that previously was only possible in alertcondition() , but has recently been extended to `strategy.*()` functions for use in the `alert_message` argument. This allows delivery of live trade values to populate in strategy alert messages.
• New arguments have been added to strategy.exit() , which allow differentiated messages to be sent based on whether the exit occurred at the stop or the limit. The new arguments used in this script are `alert_profit` and `alert_loss` to send messages to Discord

Multi-Market Swing Trader Webhook Ready [HullBuster]
Introduction
This is an all symbol swing trading strategy intended for webhook integration to live accounts. This script employs an adjustable bandwidth ping pong algorithm which can be run in long only, short only or bidirectional modes. Additionally, this script provides advanced features such as pyramiding and DCA. It has been in development for nearly three years and exposes over 90 inputs to accommodate varying risk reward ratios. Equipped with a proper configuration it is suitable for professional traders seeking quality trades from a cloud based platform. This is my most advanced Pine Script to date which combines my RangeV3 and TrendV2 scripts. Using this combination it tries to bridge the gap between range bound and trending markets. I have put a lot of time into creating a system that could transition by itself so as to require less human intervention and thus be able to withstand long periods in full automation mode.
As a Pine strategy, hypothetical performance can be easily back-tested. Allowing you to Iron out the configuration of your target instrument. Now with recent advancements from the Pine development team this same script can be connected to a webhook through the alert mechanism. The requirement of a separate study script has been completely removed. This really makes things a lot easier to get your trading system up and running. I would like to also mention that TradingView has made significant advancements to the back-end over the last year. Notably, compile times are much faster now permitting more complex algorithms to be implemented. Thank you TradingView!
I used QuantConnect as my role model and strived to produce a base script which could compete with higher end cloud based platforms while being attractive to similarly experienced traders. The versatility of the Pine Language combined with the greater selection of end point execution systems provides a powerful alternative to other cloud based platforms. At the very least, with the features available today, a modular trading system for everyday use is a reality. I hope you'll agree.
This is a swing trading strategy so the behavior of this script is to buy on weakness and sell on strength. In trading parlance this is referred to as Support and Resistance Trading. Support being the point at which prices stop falling and start rising. Resistance being the point at which prices stop rising and fall. The chart real estate between these two points being defined as the range. This script seeks to implement strategies to profit from placing trades within this region. Short positions at resistance and long positions at support. Just to be clear, the range as well as trends are merely illusions as the chart only receives prices. However, this script attempts to calculate pivot points from the price stream. Rising pivots are shorts and falling pivots are longs. I refer to pivots as a vertex in this script which adds structural components to the chart formation (point, sides and a base). When trading in “Ping Pong” mode long and short positions are interleaved continuously as long as there exists a detectable vertex.
This is a non-hedging script so those of us subject to NFA FIFO Rule 2-43(b) should be generally safe to webhook into signals emitted from this script. However, as covered later in this document, there are some technical limitations to this statement. I have tested this script on various instruments for over two years and have configurations for forex, crypto and stocks. This script along with my TrendV2 script are my daily trading vehicles as a webhook into my forex and crypto accounts. This script employs various high risk features that could wipe out your account if not used judiciously. You should absolutely not use this script if you are a beginner or looking for a get-rich-quick strategy. Also please see my CFTC RULE 4.41 disclosure statement at the end of the document. Really!
Does this script repaint? The short answer is yes, it does, despite my best efforts to the contrary. EMAs are central to my strategy and TradingView calculates from the beginning of the series so there is just no getting around this. However, Pine is improving everyday and I am hopeful that this issue will be address from an architectural level at some point in the future. I have programmed my webhook to compensate for this occurrence so, in the mean time, this my recommended way to handle it (at the endpoint and before the broker).
Design
This strategy uses a ping pong algorithm of my own design. Basically, trades bounce off each other along the price stream. Trades are produced as a series of reversals. The point at which a trade reverses is a pivot calculation. A measurement is made between the recent valley to peak which results in a standard deviation value. This value is an input to implied probability calculation.Yes, the same implied probability used in sports betting. Odds are then calculated to determine the likelihood of price action continuing or retracing to the pivot. Based on where the account is at alert time, the action could be an entry, take profit or pyramid signal. In this design, trades must occur in alternating sequence. A long followed by a short then another long followed by a short and so on. In range bound price action trades appear along the outer bands of the channel in the aforementioned sequence. Shorts on the top and longs at the bottom. Generally speaking, the widths of the trading bands can be adjusted using the vertex dynamics in Section 2. There are a dozen inputs in this section used to describe the trading range. It is not a simple adjustment. If pyramids are enabled the strategy overrides the ping pong reversal pattern and begins an accumulation sequence. In this case you will see a series of same direction trades.
This script uses twelve indicators on a single time frame. The original trading algorithms are a port from a C++ program on proprietary trading platform. I’ve converted some of the statistical functions to use standard indicators available on TradingView. The setups make heavy use of the Hull Moving Average in conjunction with EMAs that form the Bill Williams Alligator as described in his book “New Trading Dimensions” Chapter 3. Lag between the Hull and the EMAs play a key role in identifying the pivot points. I really like the Hull Moving Average. I use it in all my systems, including 3 other platforms. It’s is an excellent leading indicator and a relatively light calculation.
The trend detection algorithms rely on several factors:
1. Smoothed EMAs in a Willams Alligator pattern.
2. Number of pivots encountered in a particular direction.
3. Which side debt is being incurred.
4. Settings in Section 4 and 5 (long and short)
The strategy uses these factors to determine the probability of prices continuing in the most recent direction. My TrendV2 script uses a higher time frame to determine trend direction. I can’t use that method in this script without exceeding various TradingView limitations on code size. However, the higher time frame is the best way to know which trend is worth pursuing or better to bet against.
The entire script is around 2400 lines of Pine code which pushes the limits of what can be created on this platform given the TradingView maximums for: local scopes, run-time duration and compile time. The module has been through numerous refactoring passes and makes extensive use of ternary statements. As such, It takes a full minute to compile after adding it to a chart. Please wait for the hovering dots to disappear before attempting to bring up the input dialog box. Scrolling the chart quickly may bring up an hour glass.
Regardless of the market conditions: range or trend. The behavior of the script is governed entirely by the 91 inputs. Depending on the settings, bar interval and symbol, you can configure a system to trade in small ranges producing a thousand or more trades. If you prefer wider ranges with fewer trades then the vertex detection settings in Section 2 should employ stiffer values. To make the script more of a trend follower, adjustments are available in Section 4 and 5 (long and short respectively). Overall this script is a range trader and the setups want to get in that way. It cannot be made into a full blown trend trading system. My TrendV2 is equipped for that purpose. Conversely, this script cannot be effectively deployed as a scalper either. The vertex calculation require too much data for high frequency trading. That doesn’t work well for retail customers anyway. The script is designed to function in bar intervals between 5 minutes and 4 hours. However, larger intervals require more backtest data in order to create reliable configurations. TradingView paid plans (Pro) only provide 10K bars which may not be sufficient. Please keep that in mind.
The transition from swing trader to trend follower typically happens after a stop is hit. That means that your account experiences a loss first and usually with a pyramid stack so the loss could be significant. Even then the script continues to alternate trades long and short. The difference is that the strategy tries to be more long on rising prices and more short on falling prices as opposed to simply counter trend trading. Otherwise, a continuous period of rising prices results in a distinctly short pyramid stack. This is much different than my TrendV2 script which stays long on peaks and short on valleys. Basically, the plan is to be profitable in range bound markets and just lose less when a trend comes along. How well this actually plays out will depend largely on the choices made in the sectioned input parameters.
Sections
The input dialog for this script contains 91 inputs separated into six sections.
Section 1: Global settings for the strategy including calculation model, trading direction, exit levels, pyramid and DCA settings. This is where you specify your minimum profit and stop levels. You should setup your Properties tab inputs before working on any of the sections. It’s really important to get the Base Currency right before doing any work on the strategy inputs. It is important to understand that the “Minimum Profit” and “Limit Offset” are conditional exits. To exit at a profit, the specified value must be exceeded during positive price pressure. On the other hand, the “Stop Offset” is a hard limit.
Section 2: Vertex dynamics. The script is equipped with four types of pivot point indicators. Histogram, candle, fractal and transform. Despite how the chart visuals may seem. The chart only receives prices. It’s up to the strategy to interpret patterns from the number stream. The quality of the feed and the symbol’s bar characteristics vary greatly from instrument to instrument. Each indicator uses a fundamentally different pattern recognition algorithm. Use trial and error to determine the best fit for your configuration. After selecting an indicator type, there are eight analog fields that must be configured for that particular indicator. This is the hardest part of the configuration process. The values applied to these fields determine how the range will be measured. They have a big effect on the number of trades your system will generate. To see the vertices click on the “Show Markers” check box in this section. Red markers are long positions and blue markers are short. This will give you an idea of where trades will be placed in natural order.
Section 3: Event thresholds. Price spikes are used to enter and exit trades. The magnitude which define these spikes are configured here. The rise and fall events are primarily for pyramid placement. The rise and fall limits determine the exit threshold for the conditional “Limit Offset” field found in Section 1. These fields should be adjusted one at a time. Use a zero value to disengage every one but the one you are working on. Use the fill colors found in Section 6 to get a visual on the values applied to these fields. To make it harder for pyramids to enter stiffen the Event values. This is more of a hack as the formal pyramid parameters are in Section 1.
Section 4 and 5: Long and short settings. These are mirror opposite settings with all opposing fields having the same meaning. Its really easy to introduce data mining bias into your configuration through these fields. You must combat against this tendency by trying to keep your settings as uniform as possible. Wildly different parameters for long and short means you have probably fitted the chart. There are nine analog and thirteen Boolean fields per trade direction. This section is all about how the trades themselves will be placed along the range defined in Section 2. Generally speaking, more restrictive settings will result in less trades but higher quality. Remember that this strategy will enter long on falling prices and short on rising prices. So getting in the trade too early leads to a draw-down. However, this could be what you want if pyramiding is enabled. I, personally, have found that the best configurations come from slightly skewing one side. I just accept that the other side will be sub-par.
Section 6: Chart rendering. This section contains one analog and four Boolean fields. More or less a diagnostic tool. Of particular interest is the “Symbol Debt Sequence” field. This field contains a whole number which paints regions that have sustained a run of bad trades equal or greater than specified value. It is useful when DCA is enabled. In this script Dollar Cost Averaging on new positions continues only until the symbol debt is recouped. To get a better understanding on how this works put a number in this field and activate DCA. You should notice how the trade size increases in the colored regions. The “Summary Report” checkbox displays a blue information box at the live end of the chart. It exposes several metrics which you may find useful if manually trading this strategy from audible alerts or text messages.
Pyramids
This script features a downward pyramiding strategy which increases your position size on losing trades. On purely margin trades, this feature can be used to, hypothetically, increase the profit factor of positions (not individual trades). On long only markets, such as crypto, you can use this feature to accumulate coins at depressed prices. The way it works is the stop offset, applied in the Section 1 inputs, determines the maximum risk you intend to bear. Additional trades will be placed at pivot points calculated all the way down to the stop price. The size of each add on trade is increased by a multiple of its interval. The maximum number of intervals is limited by the “Pyramiding” field in the properties tab. The rate at which pyramid positions are created can be adjusted in Section 1. To see the pyramids click on the “Mark Pyramid Levels” check box in the same section. Blue triangles are painted below trades other than the primary.
Unlike traditional Martingale strategies, the result of your trade is not dependent on the profit or loss from the last trade. The position must recover the R1 point in order to close. Alternatively, you can set a “Pyramid Bale Out Offset” in Section 1 which will terminate the trade early. However, the bale out must coincide with a pivot point and result in a profitable exit in order to actually close the trade. Should the market price exceed the stop offset set in Section 1, the full value of the position, multiplied by the accepted leverage, will be realized as a loss to the trading account. A series of such losses will certainly wipe out your account.
Pyramiding is an advanced feature intended for professional traders with well funded accounts and an appropriate mindset. The availability of this feature is not intended to endorse or promote my use of it. Use at your own risk (peril).
DCA
In addition to pyramiding this script employs DCA which enables users to experiment with loss recovery techniques. This is another advanced feature which can increase the order size on new trades in response to stopped out or winning streak trades. The script keeps track of debt incurred from losing trades. When the debt is recovered the order size returns to the base amount specified in the properties tab. The inputs for this feature are found in section 3 and include a limiter to prevent your account from depleting capital during runaway markets. The main difference between DCA and pyramids is that this implementation of DCA applies to new trades while pyramids affect open positions. DCA is a popular feature in crypto trading but can leave you with large “bags” if your not careful. In other markets, especially margin trading, you’ll need a well funded account and much experience.
To be sure pyramiding and dollar cost averaging is as close to gambling as you can get in respectable trading exchanges. However, if you are looking to compete in a spot trading contest or just want to add excitement to your trading life style those features could find a place in your strategies. Although your backtest may show spectacular gains don’t expect your live trading account to do the same. Every backtest has some measure of data mining bias. Please remember that.
Webhook Integration
The TradingView alerts dialog provides a way to connect your script to an external system which could actually execute your trade. This is a fantastic feature that enables you to separate the data feed and technical analysis from the execution and reporting systems. Using this feature it is possible to create a fully automated trading system entirely on the cloud. Of course, there is some work to get it all going in a reliable fashion. To that end this script has several things going for it. First off, it is a strategy type script. That means that the strategy place holders such as {{strategy.position_size}} can be embedded in the alert message text. There are more than 10 variables which can write internal script values into the message for delivery to the specified endpoint. Additionally, my scripts output the current win streak and debt loss counts in the {{strategy.order.alert_message}} field. Depending on the condition, this script will output other useful values in the JSON “comment” field of the alert message. Here is an excerpt of the fields I use in my webhook signal:
"broker_id": "kraken",
"account_id": "XXX XXXX XXXX XXXX",
"symbol_id": "XMRUSD",
"action": "{{strategy.order.action}}",
"strategy": "{{strategy.order.id}}",
"lots": "{{strategy.order.contracts}}",
"price": "{{strategy.order.price}}",
"comment": "{{strategy.order.alert_message}}",
"timestamp": "{{time}}"
Though TradingView does a great job in dispatching your alert this feature does come with a few idiosyncrasies. Namely, a single transaction call in your script may cause multiple transmissions to the endpoint. If you are using placeholders each message describes part of the transaction sequence. A good example is closing a pyramid stack. Although the script makes a single strategy.close() call, the endpoint actually receives a close message for each pyramid trade. The broker, on the other hand, only requires a single close. The incongruity of this situation is exacerbated by the possibility of messages being received out of sequence. Depending on the type of order designated in the message, a close or a reversal. This could have a disastrous effect on your live account. This broker simulator has no idea what is actually going on at your real account. Its just doing the job of running the simulation and sending out the computed results. If your TradingView simulation falls out of alignment with the actual trading account lots of really bad things could happen. Like your script thinks your are currently long but the account is actually short. Reversals from this point forward will always be wrong with no one the wiser. Human intervention will be required to restore congruence. But how does anyone find out this is occurring? In closed systems engineering this is known as entropy. In practice your webhook logic should be robust enough to detect these conditions. Be generous with the placeholder usage and give the webhook code plenty of information to compare states. Both issuer and receiver. Don’t blindly commit incoming signals without verifying system integrity.
Operation
This is a swing trading strategy so the fundamental behavior of this script is to buy on weakness and sell on strength. As such trade orders are placed in a counter direction to price pressure. What you will see on the chart is a short position on peaks and a long position on valleys. This is slightly misleading since a range as well as a trend are best recognized, in hindsight, after the patterns occur on the chart. In the middle of a trade, one never knows how deep valleys will drop or how high peaks will rise. For certain, long trades will continue to trigger as the market prices fall and short trades on rising prices. This means that the maximum efficiency of this strategy is achieved in choppy markets where the price doesn’t extend very far from its adjacent pivot point. Conversely, this strategy will be the least efficient when market conditions exhibit long continuous single direction price pressure. Especially, when measured in weeks. Translation, the trend is not your friend with this strategy. Internally, the script attempts to recognize prolonged price pressure and changes tactics accordingly. However, at best, the goal is to weather the trend until the range bound market returns. At worst, trend detection fails and pyramid trades continue to be placed until the limit specified in the Properties tab is reached. In all likelihood this could trigger a margin call and if it hits the stop it could wipe out your account.
This script has been in beta test four times since inception. During all that time no one has been successful in creating a configuration from scratch. Most people give up after an hour or so. To be perfectly honest, the configuration process is a bear. I know that but there is no way, currently, to create libraries in Pine. There is also no way specify input parameters other than the flattened out 2-D inputs dialog. And the publish rules clearly state that script variations addressing markets or symbols (suites) are not permitted. I suppose the problem is systemic to be-all-end-all solutions like my script is trying to be. I needed a cloud strategy for all the symbols that I trade and since Pine does not support library modules, include files or inter process communication this script and its unruly inputs are my weapon of choice in the war against the market forces. It takes me about six hours to configure a new symbol. Also not all the symbols I configure are equally successful. I should mention that I have a facsimile of this strategy written in another platform which allows me to run a backtest on 10 years of historical data. The results provide me a sanity check on the inputs I select on this platform.
My personal configurations use a 10 minute bar interval on forex instruments and 15 minutes on crypto. I try to align my TradingView scripts to employ standard intervals available from the broker so that I can backtest longer durations than those available on TradingView. For example, Bitcoin at 15 minute bars is downloadable from several sources. I really like the 10 minute bar. It provides lots of detectable patterns and is easy to store many years in an SQL database.
The following steps provide a very brief set of instructions that will get you started but will most certainly not produce the best backtest. A trading system that you are willing to risk your hard earned capital will require a well crafted configuration that involves time, expertise and clearly defined goals. As previously mentioned, I have several example configurations that I use for my own trading that I can share with you if you like. To get hands on experience in setting up your own symbol from scratch please follow the steps below.
Step 1. Setup the Base currency and order size in the properties tab.
Step 2. Select the calculation presets in the Instrument Type field.
Step 3. Select “No Trade” in the Trading Mode field
Step 4. Select the Histogram indicator from Section 2. You will be experimenting with different ones so it doesn’t matter which one you try first.
Step 5. Turn on Show Markers in Section 2.
Step 6. Go to the chart and checkout where the markers show up. Blue is up and red is down. Long trades show up along the red markers and short trades on the blue.
Step 7. Make adjustments to “Base To Vertex” and “Vertex To Base” net change and ROC in Section 2. Use these fields to move the markers to where you want trades to be.
Step 8. Try a different indicator from Section 2 and repeat Step 7 until you find the best match for this instrument on this interval. This step is complete when the Vertex settings and indicator combination produce the most favorable results.
Step 9. Go to Section 4 and enable “Apply Red Base To Base Margin”.
Step 10. Go to Section 5 and enable “Apply Blue Base To Base Margin”.
Step 11. Go to Section 2 and adjust “Minimum Base To Base Blue” and “Minimum Base To Base Red”. Observe the chart and note where the markers move relative to each other. Markers further apart will produce less trades but will reduce cutoffs in “Ping Pong” mode.
Step 12. Turn off Show Markers in Section 2.
Step 13. Put in your Minimum Profit and Stop Loss in the first section. This is in pips or currency basis points (chart right side scale). Percentage is not currently supported. Note that the profit is taken as a conditional exit on a market order not a fixed limit. The actual profit taken will almost always be greater than the amount specified. The stop loss, on the other hand, is indeed a hard number which is executed by the TradingView broker simulator when the threshold is breached.
Step 14. Return to step 3 and select a Trading Mode (Long, Short, BiDir, Ping Pong). If you are planning to trade bidirectionally its best to configure long first then short. Combine them with “BiDir” or “Ping Pong” after setting up both sides of the trade individually. The difference between “BiDir” and “Ping Pong” is that “Ping Pong” uses position reversal and can cut off opposing trades less than the specified minimum profit. As a result “Ping Pong” mode produces the greatest number of trades.
Step 15. Take a look at the chart. Trades should be showing along the markers plotted earlier.
Step 16. Make adjustments to the Vertex fields in Section 2 until the TradingView performance report is showing a profit. This includes the “Minimum Base To Base” fields. If a profit cannot be achieved move on to Step 17.
Step 17. Improve the backtest profitability by adjusting the “Entry Net Change” and “Entry ROC” in Section 4 and 5.
Step 18. Enable the “Mandatory Snap” checkbox in Section 4 and 5 and adjust the “Snap Candle Delta” and “Snap Fractal Delta” in Section 2. This should reduce some chop producing unprofitable reversals.
Step 19. Increase the distance between opposing trades by adding an “Interleave Delta” in Sections 4 and 5. This is a floating point value which starts at 0.01 and typically does not exceed 2.0.
Step 20. Increase the distance between opposing trades even further by adding a “Decay Minimum Span” in Sections 4 and 5. This is an absolute value specified in the symbol’s quote currency (right side scale of the chart). This value is similar to the minimum profit and stop loss fields in Section 1.
Step 21. The “Buy Composite Strength” input works in tandem with “Long Decay Minimum Span” in Section 4. Try enabling and see if it improves the performance. This field is only relevant when there is a value in “Long Decay Minimum Span”.
Step 22. The “Sell Composite Weakness” input works in tandem with “Short Decay Minimum Span” in Section 5. Try enabling and see if it improves the performance. This field is only relevant when there is a value in “Short Decay Minimum Span”.
Step 23. Improve the backtest profitability by adjusting the “Adherence Delta” in Section 4 and 5. This field requires the “Adhere to Rising Trend” checkbox to be enabled.
Step 24. At this point your strategy should be more or less working. Experiment with the remaining check boxes in Section 4 and 5. Keep the ones which seem to improve the performance.
Step 25. Examine the chart and see that trades are being placed in accordance with your desired trading goals. This is an important step. If your desired model requires multiple trades per day then you should be seeing hundreds of trades on the chart. Alternatively, you may be looking to trade fewer steep peaks and deep valleys in which case you should see trades at major turning points. Don’t simply settle for what the backtest serves you. Work your configuration until the system aligns with your desired model. Try changing indicators and even intervals if you cannot reach your simulation goals. Generally speaking, the histogram and Candle indicators produce the most trades. The Fractal indicator captures the tallest peaks and valleys. The Transform indicator is the most reliable but doesn’t well work on all instruments.
Example Settings
To reproduce the performance shown on the chart please use the following configuration:
1. Select XBTUSD Kraken as the chart symbol.
2. On the properties tab set the Order Size to: 0.01 Bitcoin
3. On the properties tab set the Pyramiding to: 10
4. In Section 1: Select “Forex” for the Instrument Type
5. In Section 1: Select “Ping Pong” for the Trading Mode
6. In Section 1: Input 1200 for the Minimum Profit
7. In Section 1: Input 15000 for the Stop Offset
8. In Section 1: Input 1200 for the Pyramid Minimum Span
9. In Section 1: Check mark the Ultra Wide Pyramids
10. In Section 2: Check mark the Use Transform Indicator
So to be clear, I used a base position size of one - one hundredth of a Bitcoin and allow the script to add up to 10 downward pyramids. The example back-test did hit eight downward pyramids. That means the account would have to be able to withstand a base position size (0.01) times 28. The resulting position size is 0.28 of a Bitcoin. If the price of Bitcoin is 35K then the draw down amount (not including broker fees) would be $9800 dollars. Since I have a premium subscription my backtest chart includes 20K historical bars. That's roughly six months of data. As of today, pro accounts only get 10K bars so the performance cannot be exactly matched with such a difference in historical data. Please keep that in mind.
There are, of course, various ways to reduce the risk incurred from accumulating pyramids. You can increase the “Pyramid Minimum Span” input found in Section 2 which increases the space between each pyramid trade. Also you can set a “Pyramid Bale Out Offset” in the same input section. This lets you out of the trade faster on position recovery. For example: Set a value of 8000 into this input and the number of trades increase to 178 from 157. Since the positions didn’t go full term, more trades were created at less profit each. The total brute force approach would be to simply limit the number of pyramids in the Properties tab.
It should be noted that since this is crypto, accumulating on the long side may be what you want. If you are not trading on margin and thus outright buying coins on the Kraken exchange you likely are interested in increasing your Bitcoin position at depressed prices. This is a popular feature on some of the other crypto trading packages like CryptoHopper and Profit Trailer. Click on Enable TV Long Only Rule in Section 1. This switches the signal emitter to long only. However, you may still see short trades on the chart. They are treated as a close instead of a reversal.
Feel free to PM me with any questions related to this script. Thank you and happy trading!
CFTC RULE 4.41
These results are based on simulated or hypothetical performance results that have certain inherent limitations. Unlike the results shown in an actual performance record, these results do not represent actual trading. Also, because these trades have not actually been executed, these results may have under-or over-compensated for the impact, if any, of certain market factors, such as lack of liquidity. Simulated or hypothetical trading programs in general are also subject to the fact that they are designed with the benefit of hindsight. No representation is being made that any account will or is likely to achieve profits or losses similar to these being shown.

MomentumInvest TrendFollower [@TradersVenue]VSA CheatSheet - Have kept the chart clean and clear not by putting each signal pattern name. What matters is identifying the real price action than the pattern name. To keep the charts clutter free, haven't put the signal name under/above the candle.
Rejection or reversal patterns
Green Circle - Typical SellingClimax, Stopping Volume and Bag Holding signal patterns as per VSA. Strong price volume action but price rejection at lower level.
Red Circle - Typical Buying Climax, End Of Rising, Supply Overcoming Demand signal patterns as per VSA. Strong price volume action but price rejection at higher level.
Green Square - Typical bullish TrendReversal candle as per VSA. Bullish breakout bar immediately after a bearish breakout bar and engulfing the previous one or cover max part of it.
Red Square - Typical bearish TrendReversal candle as per VSA. Bearish breakout bar immediately after a bullish breakout bar and engulfing the previous one or cover max part of it.
Momentum breakout patterns
Blue/Green Star - Bullish breakouts. Downthrust bars with significant price volume action. Green if smaller low weak otherwise blue.
Red/Pink Star - Bearish breakouts. Downthrust bars with significant price volume action. Red if low higher weak else pink.
Candle Color
Green - Bullish with strong price action. Good to enter long towards close with SL of day low. System suggests quantity as per 2% trading rule. One can play with risk defined option strategies or cash segment as per quantity suggested.
Red - Bearish with strong price action. Good to enter short towards close with SL of day high. System suggests quantity as per 2% trading rule. One can play with risk defined option strategies like bear put spread or bear call spreads or go for hedged shorts.
Pink - Bearish with muted price action. Trail SL. Better to avoid trading these candles.
Light blue - Bullish with muted price action. Trail SL. Better to avoid trading these candles.
Plotted EMA Ribbon gives a sense of the strength of momentum. When each MA is placed with wide gaps momentum is strong. When there is EMA confluence, chances of trend strength are weakening. Background color of the chart green indicates bullishness in the underlying and red indicates that bearish pressure in the scrip. If the background color is green and you see one Blue/Green star candle it's good to go long. If the background color is red and you see one Red/Pink star candle it's good to go short.
A word of caution: Trading breakouts is very good. But you need to prepare for breakout failures. Here the system picks wide range bars for going long or short that means SL is wide probably 3% and above. Also if you notice after a strong PV breakout if price sustains below that it can see long unwinding pressure and simillary after a strong PV breakdown, if price sustains above the breakdown candle, chances of short covering is higher. Here money management and risk management becomes very important. Same has been included as part of the indicator to give you an optimal quantity for trade to keep the drawdowns lower. If you enable (1) RECO message and (2) Show Strategy (Else Study)? options then it shows a RECO box with quantity calculated as per 2% loss per trade rule. Lot of risk management, scale up/down for compounding is also available. You may try out those options one by one.
This indicator needs to be used along with the “VSA + Volume Oscillator ”, because this setup relies on VSA (Volume Spread Analysis). The overall usage will be provided through a demo to the subscribing users. In order to gain access to this indicator you may contact me using the below signature.

Cyatophilum Levels [BACKTEST]Cyatophilum Levels - Version 1.0 - Backtest
This indicator allows you to build your own strategy based on Fibonacci levels, and see the backtest results in the Strategy Tester.
The Fibonacci levels are printed automatically in real time and without repainting on the chart.
You configure your own strategy in the indicator parameters. You can choose to go long or to go short, or both, on which Fib levels to enter Long/Short, and on which Fib levels to exit (up to 2 entry levels and exit levels).
Detailed Guide:
This is a guide that can be useful if you do not understand the strategy or an indicator parameter. Instructions on how to get access are at the bottom.
To configure your strategy, you need to open the indicator settings. You can either right-click on the indicator and click "settings", or click the settings button near the indicator's name.
You should know that the Fibonnaci levels are calculated from the support and resistance levels, which are calculated using the last swing high and swing low. This behavior can be tweaked in the settings with the first 2 parameters:
· Noise reduction
Dropdown menu. Options are "NONE", "SMALL", "MEDIUM", "HUGE". Used to get a smoother level behavior. The higher it is, the less often the support and resistance levels will move. Can be useful to cut off fakeouts.
· Swings lookback
This is the number of historical bars used to calculate the last swing high and swing low.
In TradingView, we usually wait bar close to validate a signal (trade entry or exit), in order to avoid repainting. But since this indicator is purely based on price action, there is an option called Alert Type if you want to receive intra-bar alerts or not.
· Entry Alert Type
2 options : "Once Per Bar Close", "Once Per Bar". These correspond to the alerts options. You must use the same alert type in the indicator settings and in the alert options. When using "Once Per Bar", the candle high and low are used for the cross conditions, otherwise, candle close is used.
· Exit Alert Type
Same but for exit alerts.
The long trades setup can be configured independantly from the short trade setup, but the parameters are the same.
■ Go Long/Short
Check this box to enable/disable long/short trades.
· Long/Short Entry Condition
Dropdown menu from which you can pick the condition for your entry. Options available are "Cross Over","Cross Under" and "Just Cross".
· Long/Short Entry 1
Dropdown menu from which you can pick the level for your entry n°1. Options available are "Support","FIB 23", "FIB 38", "FIB 50","FIB 61","FIB 78" and "Resistance".
· Long/Short Entry 2
Additional FIB level entry.
· Long/Short Exit 1
Dropdown menu from which you can pick the level for your exit. Options available are "Support","FIB 23", "FIB 38", "FIB 50","FIB 61","FIB 78" and "Resistance".
· Long/Short Exit 2
Additional FIB level exit.
■ Trend Filter
Optionnal Tilson T3 TrendLine to make the strategy go long only when price is above T3 (green) and short only when price is below (red). The length in bars is configurable.
· Backtest period
The day of the start and end period of the backtest can be configured, as long as it is included in the available chart data which is around 20 000 candles. For example a 3 minutes chart data is around 41 days. (20000x3/60/24 = 41.3)
· Limit orders
By default the strategy tester uses market orders. With this option you can simulate limit orders with a limit price.
· Configuration Panel
It should appear on the left of the chart. This panel displays the whole indicator settings in a compact and easy-to-read way. You can replicate a strategy from just this info panel. Can be turned off if needed.
· Graphic options
A red/green background corresponding to the strategy position (short/long) can be turned off.
The Fib levels labels can be turned off all at once.
Backtesting Guide:
To open the backtest parameters, open the indicator settings and go to the "properties" tab.
The commission is set by to 0.1 % by default. You can change it to suit your exchange's fees.
Futures, Forex:
- The Order Size must be set to "contracts", or else you will get "no data".
Stocks, CFD, Cryptocurrency, Index:
- Both "% equity" and "contracts" can be used as Order Size.
Note: the net profit percentage is related to the initial capital set in the backtest properties.
Risk management
Place your secondary exit one or two levels above/below your entry to act as a stop loss.
Backtest Settings:
· Initial Capital: 10 000 $
· Order Size: 5 000 contracts
· Commission : 0.1€ per order (total commission paid: 20.00 €)
Oldest trade: 2019-10-01
Backtest Period: From 2019-10-01 to 2020-07-14
Default settings set for 15m.
Use the link below to obtain access to this indicator
