Range Trading StrategyOVERVIEW
The Range Trading Strategy is a systematic trading approach that identifies price ranges
from higher timeframe candles or trading sessions, tracks pivot points, and generates
trading signals when range extremes are mitigated and confirmed by pivot levels.
CORE CONCEPT
The strategy is based on the principle that when a candle (or session) closes within the
range of the previous candle (or session), that previous candle becomes a "range" with
identifiable high and low extremes. When price breaks through these extremes, it creates
trading opportunities that are confirmed by pivot levels.
RANGE DETECTION MODES
1. HTF (Higher Timeframe) Mode:
Automatically selects a higher timeframe based on the current chart timeframe
Uses request.security() to fetch HTF candle data
Range is created when an HTF candle closes within the previous HTF candle's range
The previous HTF candle's high and low become the range extremes
2. Sessions Mode:
- Divides the trading day into 4 sessions (UTC):
* Session 1: 00:00 - 06:00 (6 hours)
* Session 2: 06:00 - 12:00 (6 hours)
* Session 3: 12:00 - 20:00 (8 hours)
* Session 4: 20:00 - 00:00 (4 hours, spans midnight)
- Tracks high, low, and close for each session
- Range is created when a session closes within the previous session's range
- The previous session's high and low become the range extremes
PIVOT DETECTION
Pivots are detected based on candle color changes (bullish/bearish transitions):
1. Pivot Low:
Created when a bullish candle appears after a bearish candle
Pivot low = minimum of the current candle's low and previous candle's low
The pivot bar is the actual bar where the low was formed (current or previous bar)
2. Pivot High:
Created when a bearish candle appears after a bullish candle
Pivot high = maximum of the current candle's high and previous candle's high
The pivot bar is the actual bar where the high was formed (current or previous bar)
IMPORTANT: There is always only ONE active pivot high and ONE active pivot low at any
given time. When a new pivot is created, it replaces the previous one.
RANGE CREATION
A range is created when:
(HTF Mode) An HTF candle closes within the previous HTF candle's range AND a new HTF
candle has just started
(Sessions Mode) A session closes within the previous session's range AND a new session
has just started
Or Range Can Be Created when the Extreme of Another Range Gets Mitigated and We Have a Pivot low Just Above the Range Low or Pivot High just Below the Range High
Range Properties:
rangeHigh: The high extreme of the range
rangeLow: The low extreme of the range
highStartTime: The timestamp when the range high was actually formed (found by looping
backwards through bars)
lowStartTime: The timestamp when the range low was actually formed (found by looping
backwards through bars)
highMitigated / lowMitigated: Flags tracking whether each extreme has been broken
isSpecial: Flag indicating if this is a "special range" (see Special Ranges section)
RANGE MITIGATION
A range extreme is considered "mitigated" when price interacts with it:
High is mitigated when: high >= rangeHigh (any interaction at or above the level)
Low is mitigated when: low <= rangeLow (any interaction at or below the level)
Mitigation can happen:
At the moment of range creation (if price is already beyond the extreme)
At any point after range creation when price touches the extreme
SIGNAL GENERATION
1. Pending Signals:
When a range extreme is mitigated, a pending signal is created:
a) BEARISH Pending Signal:
- Triggered when: rangeHigh is mitigated
- Confirmation Level: Current pivotLow
- Signal is confirmed when: close < pivotLow
- Stop Loss: Current pivotHigh (at time of confirmation)
- Entry: Short position
Signal Confirmation
b) BULLISH Pending Signal:
- Triggered when: rangeLow is mitigated
- Confirmation Level: Current pivotHigh
- Signal is confirmed when: close > pivotHigh
- Stop Loss: Current pivotLow (at time of confirmation)
- Entry: Long position
IMPORTANT: There is only ever ONE pending bearish signal and ONE pending bullish signal
at any given time. When a new pending signal is created, it replaces the previous one
of the same type.
2. Signal Confirmation:
- Bearish: Confirmed when price closes below the pivot low (confirmation level)
- Bullish: Confirmed when price closes above the pivot high (confirmation level)
- Upon confirmation, a trade is entered immediately
- The confirmation line is drawn from the pivot bar to the confirmation bar
TRADE EXECUTION
When a signal is confirmed:
1. Position Management:
- Any existing position in the opposite direction is closed first
- Then the new position is entered
2. Stop Loss:
- Bearish (Short): Stop at pivotHigh
- Bullish (Long): Stop at pivotLow
3. Take Profit:
- Calculated using Risk:Reward Ratio (default 2:1)
- Risk = Distance from entry to stop loss
- Target = Entry ± (Risk × R:R Ratio)
- Can be disabled with "Stop Loss Only" toggle
4. Trade Comments:
- "Range Bear" for short trades
- "Range Bull" for long trades
SPECIAL RANGES
Special ranges are created when:
- A range high is mitigated AND the current pivotHigh is below the range high
- A range low is mitigated AND the current pivotLow is above the range low
In these cases:
- The pivot value is stored in an array (storedPivotHighs or storedPivotLows)
- A "special range" is created with only ONE extreme:
* If pivotHigh < rangeHigh: Creates a range with rangeHigh = pivotLow, rangeLow = na
* If pivotLow > rangeLow: Creates a range with rangeLow = pivotHigh, rangeHigh = na
- Special ranges can generate signals just like normal ranges
- If a special range is mitigated on the creation bar or the next bar, it is removed
entirely without generating signals (prevents false signals)
Special Ranges
REVERSE ON STOP LOSS
When enabled, if a stop loss is hit, the strategy automatically opens a trade in the
opposite direction:
1. Long Stop Loss Hit:
- Detects when: position_size > 0 AND position_size <= 0 AND low <= longStopLoss
- Action: Opens a SHORT position
- Stop Loss: Current pivotHigh
- Trade Comment: "Reverse on Stop"
2. Short Stop Loss Hit:
- Detects when: position_size < 0 AND position_size >= 0 AND high >= shortStopLoss
- Action: Opens a LONG position
- Stop Loss: Current pivotLow
- Trade Comment: "Reverse on Stop"
The reverse trade uses the same R:R ratio and respects the "Stop Loss Only" setting.
VISUAL ELEMENTS
1. Range Lines:
- Drawn from the time when the extreme was formed to the mitigation point (or current
time if not mitigated)
- High lines: Blue (or mitigated color if mitigated)
- Low lines: Red (or mitigated color if mitigated)
- Style: SOLID
- Width: 1
2. Confirmation Lines:
- Drawn when a signal is confirmed
- Extends from the pivot bar to the confirmation bar
- Bearish: Red, solid line
- Bullish: Green, solid line
- Width: 1
- Can be toggled on/off
STRATEGY SETTINGS
1. Range Detection Mode:
- HTF: Uses higher timeframe candles
- Sessions: Uses trading session boundaries
2. Auto HTF:
- Automatically selects HTF based on current chart timeframe
- Can be disabled to use manual HTF selection
3. Risk:Reward Ratio:
- Default: 2.0 (2:1)
- Minimum: 0.5
- Step: 0.5
4. Stop Loss Only:
- When enabled: Trades only have stop loss (no take profit)
- Trades close on stop loss or when opposite signal confirms
5. Reverse on Stop Loss:
- When enabled: Hitting a stop loss opens opposite trade with stop at opposing pivot
6. Max Ranges to Display:
- Limits the number of ranges kept in memory
- Oldest ranges are purged when limit is exceeded
KEY FEATURES
1. Dynamic Pivot Tracking:
- Pivots update on every candle color change
- Always maintains one high and one low pivot
2. Range Lifecycle:
- Ranges are created when price closes within previous range
- Ranges are tracked until mitigated
- Mitigation creates pending signals
- Signals are confirmed by pivot levels
3. Signal Priority:
- Only one pending signal of each type at a time
- New signals replace old ones
- Confirmation happens on close of bar
4. Position Management:
- Closes opposite positions before entering new trades
- Tracks stop loss levels for reverse functionality
- Respects pyramiding = 1 (only one position per direction)
5. Time-Based Drawing:
- Uses time coordinates instead of bar indices for line drawing
- Prevents "too far from current bar" errors
- Lines can extend to any historical point
USAGE NOTES
- Best suited for trending and ranging markets
- Works on any timeframe, but HTF mode adapts automatically
- Sessions mode is ideal for intraday trading
- Pivot detection requires clear candle color changes
- Range detection requires price to close within previous range
- Signals are generated on bar close, not intra-bar
The strategy combines range identification, pivot tracking, and signal confirmation to
create a systematic approach to trading breakouts and reversals based on price structure, past performance does not in any way predict future performance
"bar" için komut dosyalarını ara

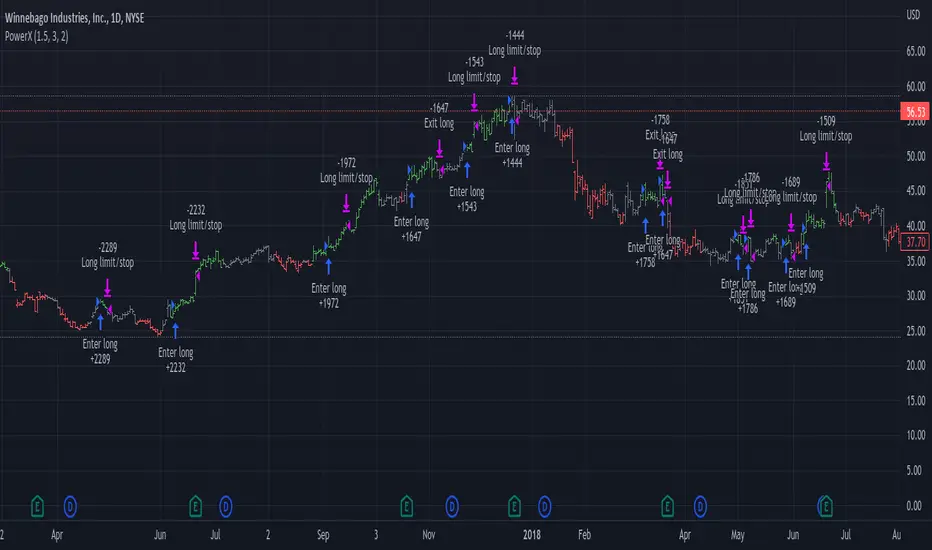
D Money – EMA/TEMA Touch Strategy (Distance) What it’s trying to capture
You want mean-reversion “tags” back to a moving average after price has stretched away and momentum flips:
Bearish setup (short): price has been above EMA(9) for a few bars, then MACD turns bearish, and price is far enough above the EMA (by an adaptive threshold). Exit when price tags the EMA.
Bullish setup (long): price has been below your chosen TEMA rail (actually an EMA of 50/100/200 you pick) for a few bars, then MACD turns bullish, and price is far enough below that TEMA. Exit when price tags that TEMA.
The moving averages it uses
EMA(9) — your fast “tag” for short take-profits.
“TEMA line” input = one of EMA(50) / EMA(100) / EMA(200). (Labelled “Chosen TEMA” in the plot; it’s an EMA rail you pick.)
When it will enter trades
It requires four things per side:
Short (EMA-Touch Short)
MACD bearish cross on the signal bar
If “Require NO MA touch on cross bar” = true, the bar’s low must be above EMA(9), so it didn’t touch EMA on the cross bar (fake-out guard).
Extension/Context: you’ve had at least barsAbove consecutive closes above EMA(9) (default 3), so it’s truly stretched.
Distance test: absolute % distance from price to EMA(9) must be ≥ minDistEMA_eff (an adaptive threshold; details below).
Bounce filter: there was no bullish bounce off the EMA in the last bounceLookback bars (excluding the current one).
If all pass and you’re inside the backtest window → strategy.entry short.
Long (TEMA-Touch Long)
MACD bullish cross on the signal bar
With the same fake-out guard: the bar’s high must be below the chosen TEMA if the guard is on.
Extension/Context: at least barsAbove consecutive closes below the chosen TEMA.
Distance test: absolute % distance from price to TEMA must be ≥ minDistTEMA_eff (adaptive).
Bounce filter: there was no bearish bounce off the TEMA in the last bounceLookback bars.
If all pass and you’re in the window → strategy.entry long.
MACD timing option:
If Pure MACD Timing = ON, it only checks for the cross.
If OFF (default), it also enforces “no touch on the cross bar” if that checkbox is true. That’s your “fake-out” filter.
The adaptive distance threshold (the “secret sauce”)
You can choose how “far enough away” is determined—per side:
Fixed %
Short uses Fixed: Min distance ABOVE EMA (%)
Long uses Fixed: Min distance BELOW TEMA (%)
Auto (ATR%) (default)
Short threshold = max(floorEMA, kAtrShort × ATR%)
Long threshold = max(floorTEMA, kAtrLong × ATR%)
This scales distance by recent volatility, with a floor.
Auto (AvgDist%)
Short threshold = max(floorEMA, kAvgShort × average(|Dist to EMA|) over avgLen)
Long threshold = max(floorTEMA, kAvgLong × average(|Dist to TEMA|) over avgLen)
This adapts to the instrument’s typical stretch away from the rails.
These become minDistEMA_eff and minDistTEMA_eff and are re-computed each bar.
Fake-out / bounce logic (the “don’t get tricked” part)
A touch means the bar’s high/low overlapped the MA ± a small buffer % (touchBufPct).
A bounce is a touch plus a close on the “wrong” side (e.g., touch EMA and close above it on shorts = bullish bounce).
The script blocks entries if a bounce happened within bounceLookback bars (excluding the current signal bar).
Exits & risk
Take profit: when price touches the target MA:
Short TP = touch EMA(9)
Long TP = touch chosen TEMA
Stop loss: either
ATR stop: entry ± (atrMultStop × ATR) (default ON), or
Percent stop: entry × (1±stopPct%)
Time stop: if timeExitBars > 0, close after that many bars if still open.
Quality-of-life features
Backtest window (btFrom, btTo) so you can limit evaluation.
Labels on signal bars that show:
MACD bucket (Small/Moderate/HUGE/Violent — based on % separation on the bar),
the current absolute distance to the target MA,
and the effective minimum the engine used (plus which engine mode).
Data Window fields so you can audit:
abs distance to EMA/TEMA,
the effective min distance used on each side,
ATR%,
average absolute distances (for the AvgDist mode).
Alerts fire when a short/long signal is confirmed.
Optional debug panel to see the exact booleans & thresholds the bar had.
Quick mental model
Are we properly stretched away from the rail (by an adaptive threshold) and held on that side for a few bars?
Did MACD flip the way we want without price already tagging the rail that bar?
Have we avoided recent bounces off that rail (no fake-out)?
→ If yes, enter and aim for a tag back to the rail, with ATR/% stop and optional time stop.
If you want, I can add a simple on-chart “rating” (0–100) similar to your Python scorer (distance beyond min, MACD bucket, extension streak) so you can visually rank signals in TradingView too.

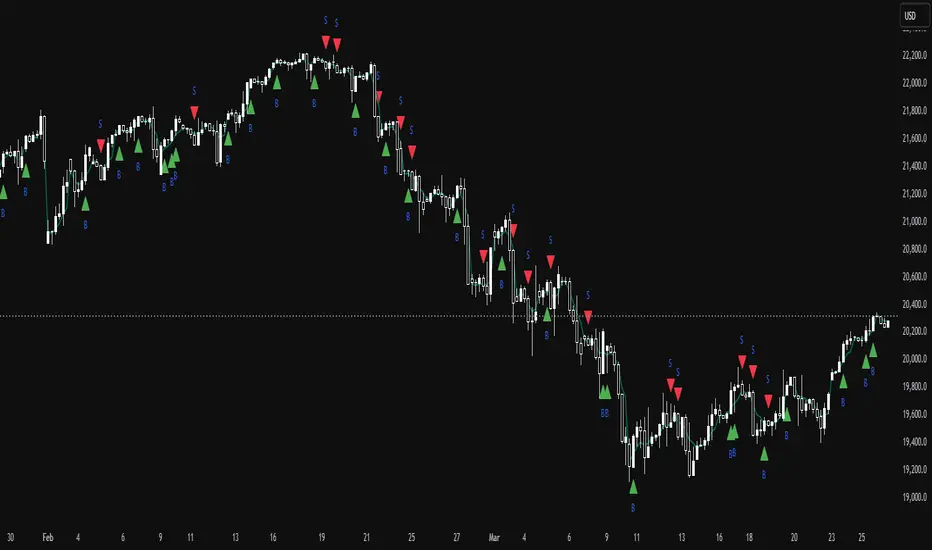
TrinityBar**TrinityBar Strategy Description**
The TrinityBar strategy is a price‐action based trading model that leverages Bill Williams’ bar thirds concept to generate entry signals and execute market orders automatically. Here’s how it works:
1. **Bar Thirds Calculation:**
The strategy calculates the range of both the current fully formed bar and the previous fully formed bar. It then divides each bar’s range into three equal parts (thirds).
- For the current bar, the lower third and upper third levels are computed.
- The same is done for the previous bar.
2. **Bar Type Classification:**
Each bar is classified into one of several types based on where its open and close fall relative to its thirds:
- **Bullish Patterns:**
- *1‑3 Bar:* Opens in the lower third and closes in the upper third.
- *2‑3 Bar:* Opens in the middle third and closes in the upper third.
- *3‑3 Bar:* Both open and close are in the upper third.
- **Bearish Patterns:**
- *3‑1 Bar:* Opens in the upper third and closes in the lower third.
- *2‑1 Bar:* Opens in the middle third and closes in the lower third.
- *1‑1 Bar:* Both open and close are in the lower third.
3. **Signal Generation:**
- **Bullish Signal:** A valid buy is generated when the previous bar exhibits any bullish pattern (1‑3, 2‑3, or 3‑3) and the current bar is either a 1‑3 or a 3‑3 bar.
- **Bearish Signal:** A valid sell is generated when the previous bar shows any bearish pattern (1‑1, 2‑1, or 3‑1) and the current bar is either a 1‑1 or a 3‑1 bar.
4. **Visual Alerts:**
When a valid signal is identified, the strategy plots a small triangle below the bar for a buy signal (labeled “B” in green) and a triangle above the bar for a sell signal (labeled “S” in red).
5. **Trade Execution:**
Once a signal is confirmed:
- If a bullish signal is generated, any short positions are closed, and if there is no existing long position, a market long order is entered.
- Conversely, if a bearish signal occurs, any long positions are closed, and a market short order is entered if not already in a short position.
This strategy is designed to capture significant price expansions by relying solely on price action and bar structure, without relying on lagging indicators. It provides a mechanical, systematic approach that removes emotional bias from trading decisions.
EXODUS EXODUS by (DAFE) Trading Systems
EXODUS is a sophisticated trading algorithm built by Dskyz (DAFE) Trading Systems for competitive and competition purposes, designed to identify high-probability trades with robust risk management. this strategy leverages a multi-signal voting system, combining three core components—SPR, VWMO, and VEI—alongside ADX, choppiness filters, and ATR-based volatility gates to ensure trades are taken only in favorable market conditions. the algo uses a take-profit to stop-loss ratio, dynamic position sizing, and a strict voting mechanism requiring all signals to align before entering a trade.
EXODUS was not overfitted for any specific symbol. instead, it uses a generic tuned setting, making it versatile across various markets. while it can trade futures, it’s not currently set up for it but has the potential to do more with further development. visuals are intentionally minimal due to its competition focus, prioritizing performance over aesthetics. a more visually stunning version may be released in the future with enhanced graphics.
The Unique Core Components Developed for EXODUS
SPR (Session Price Recalibration)
SPR measures momentum during regular trading hours (RTH, 0930-1600, America/New_York) to catch session-specific trends.
spr_lookback = input.int(15, "SPR Lookback") this sets how many bars back SPR looks to calculate momentum (default 15 bars). it compares the current session’s price-volume score to the score 15 bars ago to gauge momentum strength.
how it works: a longer lookback smooths out the signal, focusing on bigger trends. a shorter one makes SPR more sensitive to recent moves.
how to adjust: on a 1-hour chart, 15 bars is 15 hours (about 2 trading days). if you’re on a shorter timeframe like 5 minutes, 15 bars is just 75 minutes, so you might want to increase it to 50 or 100 to capture more meaningful trends. if you’re trading a choppy stock, a shorter lookback (like 5) can help catch quick moves, but it might give more false signals.
spr_threshold = input.float (0.7, "SPR Threshold")
this is the cutoff for SPR to vote for a trade (default 0.7). if SPR’s normalized value is above 0.7, it votes for a long; below -0.7, it votes for a short.
how it works: SPR normalizes its momentum score by ATR, so this threshold ensures only strong moves count. a higher threshold means fewer trades but higher conviction.
how to adjust: if you’re getting too few trades, lower it to 0.5 to let more signals through. if you’re seeing too many false entries, raise it to 1.0 for stricter filtering. test on your chart to find a balance.
spr_atr_length = input.int(21, "SPR ATR Length") this sets the ATR period (default 21 bars) used to normalize SPR’s momentum score. ATR measures volatility, so this makes SPR’s signal relative to market conditions.
how it works: a longer ATR period (like 21) smooths out volatility, making SPR less jumpy. a shorter one makes it more reactive.
how to adjust: if you’re trading a volatile stock like TSLA, a longer period (30 or 50) can help avoid noise. for a calmer stock, try 10 to make SPR more responsive. match this to your timeframe—shorter timeframes might need a shorter ATR.
rth_session = input.session("0930-1600","SPR: RTH Sess.") rth_timezone = "America/New_York" this defines the session SPR uses (0930-1600, New York time). SPR only calculates momentum during these hours to focus on RTH activity.
how it works: it ignores pre-market or after-hours noise, ensuring SPR captures the main market action.
how to adjust: if you trade a different session (like London hours, 0300-1200 EST), change the session to match. you can also adjust the timezone if you’re in a different region, like "Europe/London". just make sure your chart’s timezone aligns with this setting.
VWMO (Volume-Weighted Momentum Oscillator)
VWMO measures momentum weighted by volume to spot sustained, high-conviction moves.
vwmo_momlen = input.int(21, "VWMO Momentum Length") this sets how many bars back VWMO looks to calculate price momentum (default 21 bars). it takes the price change (close minus close 21 bars ago).
how it works: a longer period captures bigger trends, while a shorter one reacts to recent swings.
how to adjust: on a daily chart, 21 bars is about a month—good for trend trading. on a 5-minute chart, it’s just 105 minutes, so you might bump it to 50 or 100 for more meaningful moves. if you want faster signals, drop it to 10, but expect more noise.
vwmo_volback = input.int(30, "VWMO Volume Lookback") this sets the period for calculating average volume (default 30 bars). VWMO weights momentum by volume divided by this average.
how it works: it compares current volume to the average to see if a move has strong participation. a longer lookback smooths the average, while a shorter one makes it more sensitive.
how to adjust: for stocks with spiky volume (like NVDA on earnings), a longer lookback (50 or 100) avoids overreacting to one-off spikes. for steady volume stocks, try 20. match this to your timeframe—shorter timeframes might need a shorter lookback.
vwmo_smooth = input.int(9, "VWMO Smoothing")
this sets the SMA period to smooth VWMO’s raw momentum (default 9 bars).
how it works: smoothing reduces noise in the signal, making VWMO more reliable for voting. a longer smoothing period cuts more noise but adds lag.
how to adjust: if VWMO is too jumpy (lots of false votes), increase to 15. if it’s too slow and missing trades, drop to 5. test on your chart to see what keeps the signal clean but responsive.
vwmo_threshold = input.float(10, "VWMO Threshold") this is the cutoff for VWMO to vote for a trade (default 10). above 10, it votes for a long; below -10, a short.
how it works: it ensures only strong momentum signals count. a higher threshold means fewer but stronger trades.
how to adjust: if you want more trades, lower it to 5. if you’re getting too many weak signals, raise it to 15. this depends on your market—volatile stocks might need a higher threshold to filter noise.
VEI (Velocity Efficiency Index)
VEI measures market efficiency and velocity to filter out choppy moves and focus on strong trends.
vei_eflen = input.int(14, "VEI Efficiency Smoothing") this sets the EMA period for smoothing VEI’s efficiency calc (bar range / volume, default 14 bars).
how it works: efficiency is how much price moves per unit of volume. smoothing it with an EMA reduces noise, focusing on consistent efficiency. a longer period smooths more but adds lag.
how to adjust: for choppy markets, increase to 20 to filter out noise. for faster markets, drop to 10 for quicker signals. this should match your timeframe—shorter timeframes might need a shorter period.
vei_momlen = input.int(8, "VEI Momentum Length") this sets how many bars back VEI looks to calculate momentum in efficiency (default 8 bars).
how it works: it measures the change in smoothed efficiency over 8 bars, then adjusts for inertia (volume-to-range). a longer period captures bigger shifts, while a shorter one reacts faster.
how to adjust: if VEI is missing quick reversals, drop to 5. if it’s too noisy, raise to 12. test on your chart to see what catches the right moves without too many false signals.
vei_threshold = input.float(4.5, "VEI Threshold") this is the cutoff for VEI to vote for a trade (default 4.5). above 4.5, it votes for a long; below -4.5, a short.
how it works: it ensures only strong, efficient moves count. a higher threshold means fewer trades but higher quality.
how to adjust: if you’re not getting enough trades, lower to 3. if you’re seeing too many false entries, raise to 6. this depends on your market—fast stocks like NQ1 might need a lower threshold.
Features
Multi-Signal Voting: requires all three signals (SPR, VWMO, VEI) to align for a trade, ensuring high-probability setups.
Risk Management: uses ATR-based stops (2.1x) and take-profits (4.1x), with dynamic position sizing based on a risk percentage (default 0.4%).
Market Filters: ADX (default 27) ensures trending conditions, choppiness index (default 54.5) avoids sideways markets, and ATR expansion (default 1.12) confirms volatility.
Dashboard: provides real-time stats like SPR, VWMO, VEI values, net P/L, win rate, and streak, with a clean, functional design.
Visuals
EXODUS prioritizes performance over visuals, as it was built for competitive and competition purposes. entry/exit signals are marked with simple labels and shapes, and a basic heatmap highlights market regimes. a more visually stunning update may be released later, with enhanced graphics and overlays.
Usage
EXODUS is designed for stocks and ETFs but can be adapted for futures with adjustments. it performs best in trending markets with sufficient volatility, as confirmed by its generic tuning across symbols like TSLA, AMD, NVDA, and NQ1. adjust inputs like SPR threshold, VWMO smoothing, or VEI momentum length to suit specific assets or timeframes.
Setting I used: (Again, these are a generic setting, each security needs to be fine tuned)
SPR LB = 19 SPR TH = 0.5 SPR ATR L= 21 SPR RTH Sess: 9:30 – 16:00
VWMO L = 21 VWMO LB = 18 VWMO S = 6 VWMO T = 8
VEI ES = 14 VEI ML = 21 VEI T = 4
R % = 0.4
ATR L = 21 ATR M (S) =1.1 TP Multi = 2.1 ATR min mult = 0.8 ATR Expansion = 1.02
ADX L = 21 Min ADX = 25
Choppiness Index = 14 Chop. Max T = 55.5
Backtesting: TSLA
Frame: Jan 02, 2018, 08:00 — May 01, 2025, 09:00
Slippage: 3
Commission .01
Disclaimer
this strategy is for educational purposes. past performance is not indicative of future results. trading involves significant risk, and you should only trade with capital you can afford to lose. always backtest and validate any strategy before using it in live markets.
(This publishing will most likely be taken down do to some miscellaneous rule about properly displaying charting symbols, or whatever. Once I've identified what part of the publishing they want to pick on, I'll adjust and repost.)
About the Author
Dskyz (DAFE) Trading Systems is dedicated to building high-performance trading algorithms. EXODUS is a product of rigorous research and development, aimed at delivering consistent, and data-driven trading solutions.
Use it with discipline. Use it with clarity. Trade smarter.
**I will continue to release incredible strategies and indicators until I turn this into a brand or until someone offers me a contract.
2025 Created by Dskyz, powered by DAFE Trading Systems. Trade smart, trade bold.

Reversal Point Dynamics - Machine Learning⇋ Reversal Point Dynamics - Machine Learning
RPD Machine Learning: Self-Adaptive Multi-Armed Bandit Trading System
RPD Machine Learning is an advanced algorithmic trading system that implements genuine machine learning through contextual multi-armed bandits, reinforcement learning, and online adaptation. Unlike traditional indicators that use fixed rules, RPD learns from every trade outcome , automatically discovers which strategies work in current market conditions, and continuously adapts without manual intervention .
Core Innovation: The system deploys six distinct trading policies (ranging from aggressive trend-following to conservative range-bound strategies) and uses LinUCB contextual bandit algorithms with Random Fourier Features to learn which policy performs best in each market regime. After the initial learning phase (50-100 trades), the system achieves autonomous adaptation , automatically shifting between policies as market conditions evolve.
Target Users: Quantitative traders, algorithmic trading developers, systematic traders, and data-driven investors who want a system that adapts over time . Suitable for stocks, futures, forex, and cryptocurrency on any liquid instrument with >100k daily volume.
The Problem This System Solves
Traditional Technical Analysis Limitations
Most trading systems suffer from three fundamental challenges :
Fixed Parameters: Static settings (like "buy when RSI < 30") work well in backtests but may struggle when markets change character. What worked in low-volatility environments may not work in high-volatility regimes.
Strategy Degradation: Manual optimization (curve-fitting) produces systems that perform well on historical data but may underperform in live trading. The system never adapts to new market conditions.
Cognitive Overload: Running multiple strategies simultaneously forces traders to manually decide which one to trust. This leads to hesitation, late entries, and inconsistent execution.
How RPD Machine Learning Addresses These Challenges
Automated Strategy Selection: Instead of requiring you to choose between trend-following and mean-reversion strategies, RPD runs all six policies simultaneously and uses machine learning to automatically select the best one for current conditions. The decision happens algorithmically, removing human hesitation.
Continuous Learning: After every trade, the system updates its understanding of which policies are working. If the market shifts from trending to ranging, RPD automatically detects this through changing performance patterns and adjusts selection accordingly.
Context-Aware Decisions: Unlike simple voting systems that treat all conditions equally, RPD analyzes market context (ADX regime, entropy levels, volatility state, volume patterns, time of day, historical performance) and learns which combinations of context features correlate with policy success.
Machine Learning Architecture: What Makes This "Real" ML
Component 1: Contextual Multi-Armed Bandits (LinUCB)
What Is a Multi-Armed Bandit Problem?
Imagine facing six slot machines, each with unknown payout rates. The exploration-exploitation dilemma asks: Should you keep pulling the machine that's worked well (exploitation) or try others that might be better (exploration)? RPD solves this for trading policies.
Academic Foundation:
RPD implements Linear Upper Confidence Bound (LinUCB) from the research paper "A Contextual-Bandit Approach to Personalized News Article Recommendation" (Li et al., 2010, WWW Conference). This algorithm is used in content recommendation and ad placement systems.
How It Works:
Each policy (AggressiveTrend, ConservativeRange, VolatilityBreakout, etc.) is treated as an "arm." The system maintains:
Reward History: Tracks wins/losses for each policy
Contextual Features: Current market state (8-10 features including ADX, entropy, volatility, volume)
Uncertainty Estimates: Confidence in each policy's performance
UCB Formula: predicted_reward + α × uncertainty
The system selects the policy with highest UCB score , balancing proven performance (predicted_reward) with potential for discovery (uncertainty bonus). Initially, all policies have high uncertainty, so the system explores broadly. After 50-100 trades, uncertainty decreases, and the system focuses on known-performing policies.
Why This Matters:
Traditional systems pick strategies based on historical backtests or user preference. RPD learns from actual outcomes in your specific market, on your timeframe, with your execution characteristics.
Component 2: Random Fourier Features (RFF)
The Non-Linearity Challenge:
Market relationships are often non-linear. High ADX may indicate favorable conditions when volatility is normal, but unfavorable when volatility spikes. Simple linear models struggle to capture these interactions.
Academic Foundation:
RPD implements Random Fourier Features from "Random Features for Large-Scale Kernel Machines" (Rahimi & Recht, 2007, NIPS). This technique approximates kernel methods (like Support Vector Machines) while maintaining computational efficiency for real-time trading.
How It Works:
The system transforms base features (ADX, entropy, volatility, etc.) into a higher-dimensional space using random projections and cosine transformations:
Input: 8 base features
Projection: Through random Gaussian weights
Transformation: cos(W×features + b)
Output: 16 RFF dimensions
This allows the bandit to learn non-linear relationships between market context and policy success. For example: "AggressiveTrend performs well when ADX >25 AND entropy <0.6 AND hour >9" becomes naturally encoded in the RFF space.
Why This Matters:
Without RFF, the system could only learn "this policy has X% historical performance." With RFF, it learns "this policy performs differently in these specific contexts" - enabling more nuanced selection.
Component 3: Reinforcement Learning Stack
Beyond bandits, RPD implements a complete RL framework :
Q-Learning: Value-based RL that learns state-action values. Maps 54 discrete market states (trend×volatility×RSI×volume combinations) to 5 actions (4 policies + no-trade). Updates via Bellman equation after each trade. Converges toward optimal policy after 100-200 trades.
TD(λ) with Eligibility Traces: Extension of Q-Learning that propagates credit backwards through time . When a trade produces an outcome, TD(λ) updates not just the final state-action but all states visited during the trade, weighted by eligibility decay (λ=0.90). This accelerates learning from multi-bar trades.
Policy Gradient (REINFORCE): Learns a stochastic policy directly from 12 continuous market features without discretization. Uses gradient ascent to increase probability of actions that led to positive outcomes. Includes baseline (average reward) for variance reduction.
Meta-Learning: The system learns how to learn by adapting its own learning rates based on feature stability and correlation with outcomes. If a feature (like volume ratio) consistently correlates with success, its learning rate increases. If unstable, rate decreases.
Why This Matters:
Q-Learning provides fast discrete decisions. Policy Gradient handles continuous features. TD(λ) accelerates learning. Meta-learning optimizes the optimization. Together, they create a robust, multi-approach learning system that adapts more quickly than any single algorithm.
Component 4: Policy Momentum Tracking (v2 Feature)
The Recency Challenge:
Standard bandits treat all historical data equally. If a policy performed well historically but struggles in current conditions due to regime shift, the system may be slow to adapt because historical success outweighs recent underperformance.
RPD's Solution:
Each policy maintains a ring buffer of the last 10 outcomes. The system calculates:
Momentum: recent_win_rate - global_win_rate (range: -1 to +1)
Confidence: consistency of recent results (1 - variance)
Policies with positive momentum (recent outperformance) get an exploration bonus. Policies with negative momentum and high confidence (consistent recent underperformance) receive a selection penalty.
Effect: When markets shift, the system detects the shift more quickly through momentum tracking, enabling faster adaptation than standard bandits.
Signal Generation: The Core Algorithm
Multi-Timeframe Fractal Detection
RPD identifies reversal points using three complementary methods :
1. Quantum State Analysis:
Divides price range into discrete states (default: 6 levels)
Peak signals require price in top states (≥ state 5)
Valley signals require price in bottom states (≤ state 1)
Prevents mid-range signals that may struggle in strong trends
2. Fractal Geometry:
Identifies swing highs/lows using configurable fractal strength
Confirms local extremum with neighboring bars
Validates reversal only if price crosses prior extreme
3. Multi-Timeframe Confirmation:
Analyzes higher timeframe (4× default) for alignment
MTF confirmation adds probability bonus
Designed to reduce false signals while preserving valid setups
Probability Scoring System
Each signal receives a dynamic probability score (40-99%) based on:
Base Components:
Trend Strength: EMA(velocity) / ATR × 30 points
Entropy Quality: (1 - entropy) × 10 points
Starting baseline: 40 points
Enhancement Bonuses:
Divergence Detection: +20 points (price/momentum divergence)
RSI Extremes: +8 points (RSI >65 for peaks, <40 for valleys)
Volume Confirmation: +5 points (volume >1.2× average)
Adaptive Momentum: +10 points (strong directional velocity)
MTF Alignment: +12 points (higher timeframe confirms)
Range Factor: (high-low)/ATR × 3 - 1.5 points (volatility adjustment)
Regime Bonus: +8 points (trending ADX >25 with directional agreement)
Penalties:
High Entropy: -5 points (entropy >0.85, chaotic price action)
Consolidation Regime: -10 points (ADX <20, no directional conviction)
Final Score: Clamped to 40-99% range, classified as ELITE (>85%), STRONG (75-85%), GOOD (65-75%), or FAIR (<65%)
Entropy-Based Quality Filter
What Is Entropy?
Entropy measures randomness in price changes . Low entropy indicates orderly, directional moves. High entropy indicates chaotic, unpredictable conditions.
Calculation:
Count up/down price changes over adaptive period
Calculate probability: p = ups / total_changes
Shannon entropy: -p×log(p) - (1-p)×log(1-p)
Normalized to 0-1 range
Application:
Entropy <0.5: Highly ordered (ELITE signals possible)
Entropy 0.5-0.75: Mixed (GOOD signals)
Entropy >0.85: Chaotic (signals blocked or heavily penalized)
Why This Matters:
Prevents trading during choppy, news-driven conditions where technical patterns may be less reliable. Automatically raises quality bar when market is unpredictable.
Regime Detection & Market Microstructure - ADX-Based Regime Classification
RPD uses Wilder's Average Directional Index to classify markets:
Bull Trend: ADX >25, +DI > -DI (directional conviction bullish)
Bear Trend: ADX >25, +DI < -DI (directional conviction bearish)
Consolidation: ADX <20 (no directional conviction)
Transitional: ADX 20-25 (forming direction, ambiguous)
Filter Logic:
Blocks all signals during Transitional regime (avoids trading during uncertain conditions)
Blocks Consolidation signals unless ADX ≥ Min Trend Strength
Adds probability bonus during strong trends (ADX >30)
Effect: Designed to reduce signal frequency while focusing on higher-quality setups.
Divergence Detection
Bearish Divergence:
Price makes higher high
Velocity (price momentum) makes lower high
Indicates weakening upward pressure → SHORT signal quality boost
Bullish Divergence:
Price makes lower low
Velocity makes higher low
Indicates weakening downward pressure → LONG signal quality boost
Bonus: Adds probability points and additional acceleration factor. Divergence signals have historically shown higher success rates in testing.
Hierarchical Policy System - The Six Trading Policies
1. AggressiveTrend (Policy 0):
Probability Threshold: 60% (trades more frequently)
Entropy Threshold: 0.70 (tolerates moderate chaos)
Stop Multiplier: 2.5× ATR (wider stops for trends)
Target Multiplier: 5.0R (larger targets)
Entry Mode: Pyramid (scales into winners)
Best For: Strong trending markets, breakouts, momentum continuation
2. ConservativeRange (Policy 1):
Probability Threshold: 75% (more selective)
Entropy Threshold: 0.60 (requires order)
Stop Multiplier: 1.8× ATR (tighter stops)
Target Multiplier: 3.0R (modest targets)
Entry Mode: Single (one-shot entries)
Best For: Range-bound markets, low volatility, mean reversion
3. VolatilityBreakout (Policy 2):
Probability Threshold: 65% (moderate)
Entropy Threshold: 0.80 (accepts high entropy)
Stop Multiplier: 3.0× ATR (wider stops)
Target Multiplier: 6.0R (larger targets)
Entry Mode: Tiered (splits entry)
Best For: Compression breakouts, post-consolidation moves, gap opens
4. EntropyScalp (Policy 3):
Probability Threshold: 80% (very selective)
Entropy Threshold: 0.40 (requires extreme order)
Stop Multiplier: 1.5× ATR (tightest stops)
Target Multiplier: 2.5R (quick targets)
Entry Mode: Single
Best For: Low-volatility grinding moves, tight ranges, highly predictable patterns
5. DivergenceHunter (Policy 4):
Probability Threshold: 70% (quality-focused)
Entropy Threshold: 0.65 (balanced)
Stop Multiplier: 2.2× ATR (moderate stops)
Target Multiplier: 4.5R (balanced targets)
Entry Mode: Tiered
Best For: Divergence-confirmed reversals, exhaustion moves, trend climax
6. AdaptiveBlend (Policy 5):
Probability Threshold: 68% (balanced)
Entropy Threshold: 0.75 (balanced)
Stop Multiplier: 2.0× ATR (standard)
Target Multiplier: 4.0R (standard)
Entry Mode: Single
Best For: Mixed conditions, general trading, fallback when no clear regime
Policy Clustering (Advanced/Extreme Modes)
Policies are grouped into three clusters based on regime affinity:
Cluster 1 (Trending): AggressiveTrend, DivergenceHunter
High regime affinity (0.8): Performs well when ADX >25
Moderate vol affinity (0.6): Works in various volatility
Cluster 2 (Ranging): ConservativeRange, AdaptiveBlend
Low regime affinity (0.3): Better suited for ADX <20
Low vol affinity (0.4): Optimized for calm markets
Cluster 3 (Breakout): VolatilityBreakout
Moderate regime affinity (0.6): Works in multiple regimes
High vol affinity (0.9): Requires high volatility for optimal characteristics
Hierarchical Selection Process:
Calculate cluster scores based on current regime and volatility
Select best-matching cluster
Run UCB selection within chosen cluster
Apply momentum boost/penalty
This two-stage process reduces learning time - instead of choosing among 6 policies from scratch, system first narrows to 1-2 policies per cluster, then optimizes within cluster.
Risk Management & Position Sizing
Dynamic Kelly Criterion Sizing (Optional)
Traditional Fixed Sizing Challenge:
Using the same position size for all signal probabilities may be suboptimal. Higher-probability signals could justify larger positions, lower-probability signals smaller positions.
Kelly Formula:
f = (p × b - q) / b
Where:
p = win probability (from signal score)
q = loss probability (1 - p)
b = win/loss ratio (average_win / average_loss)
f = fraction of capital to risk
RPD Implementation:
Uses Fractional Kelly (1/4 Kelly default) for safety. Full Kelly is theoretically optimal but can recommend large position sizes. Fractional Kelly reduces volatility while maintaining adaptive sizing benefits.
Enhancements:
Probability Bonus: Normalize(prob, 65, 95) × 0.5 multiplier
Divergence Bonus: Additional sizing on divergence signals
Regime Bonus: Additional sizing during strong trends (ADX >30)
Momentum Adjustment: Hot policies receive sizing boost, cold policies receive reduction
Safety Rails:
Minimum: 1 contract (floor)
Maximum: User-defined cap (default 10 contracts)
Portfolio Heat: Max total risk across all positions (default 4% equity)
Multi-Mode Stop Loss System
ATR Mode (Default):
Stop = entry ± (ATR × base_mult × policy_mult)
Consistent risk sizing
Ignores market structure
Best for: Futures, forex, algorithmic trading
Structural Mode:
Finds swing low (long) or high (short) over last 20 bars
Identifies fractal pivots within lookback
Places stop below/above structure + buffer (0.1× ATR)
Best for: Stocks, instruments that respect structure
Hybrid Mode (Intelligent):
Attempts structural stop first
Falls back to ATR if:
Structural level is invalid (beyond entry)
Structural stop >2× ATR away (too wide)
Best for: Mixed instruments, adaptability
Dynamic Adjustments:
Breakeven: Move stop to entry + 1 tick after 1.0R profit
Trailing: Trail stop 0.8R behind price after 1.5R profit
Timeout: Force close after 30 bars (optional)
Tiered Entry System
Challenge: Equal sizing on all signals may not optimize capital allocation relative to signal quality.
Solution:
Tier 1 (40% of size): Enters immediately on all signals
Tier 2 (60% of size): Enters only if probability ≥ Tier 2 trigger (default 75%)
Example:
Calculated optimal size: 10 contracts
Signal probability: 72%
Tier 2 trigger: 75%
Result: Enter 4 contracts only (Tier 1)
Same signal at 80% probability
Result: Enter 10 contracts (4 Tier 1 + 6 Tier 2)
Effect: Automatically scales size to signal quality, optimizing capital allocation.
Performance Optimization & Learning Curve
Warmup Phase (First 50 Trades)
Purpose: Ensure all policies get tested before system focuses on preferred strategies.
Modifications During Warmup:
Probability thresholds reduced 20% (65% becomes 52%)
Entropy thresholds increased 20% (more permissive)
Exploration rate stays high (30%)
Confidence width (α) doubled (more exploration)
Why This Matters:
Without warmup, system might commit to early-performing policy without testing alternatives. Warmup forces thorough exploration before focusing on best-performing strategies.
Curriculum Learning
Phase 1 (Trades 1-50): Exploration
Warmup active
All policies tested
High exploration (30%)
Learning fundamental patterns
Phase 2 (Trades 50-100): Refinement
Warmup ended, thresholds normalize
Exploration decaying (30% → 15%)
Policy preferences emerging
Meta-learning optimizing
Phase 3 (Trades 100-200): Specialization
Exploration low (15% → 8%)
Clear policy preferences established
Momentum tracking fully active
System focusing on learned patterns
Phase 4 (Trades 200+): Maturity
Exploration minimal (8% → 5%)
Regime-policy relationships learned
Auto-adaptation to market shifts
Stable performance expected
Convergence Indicators
System is learning well when:
Policy switch rate decreasing over time (initially ~50%, should drop to <20%)
Exploration rate decaying smoothly (30% → 5%)
One or two policies emerge with >50% selection frequency
Performance metrics stabilizing over time
Consistent behavior in similar market conditions
System may need adjustment when:
Policy switch rate >40% after 100 trades (excessive exploration)
Exploration rate not decaying (parameter issue)
All policies showing similar selection (not differentiating)
Performance declining despite relaxed thresholds (underlying signal issue)
Highly erratic behavior after learning phase
Advanced Features
Attention Mechanism (Extreme Mode)
Challenge: Not all features are equally important. Trading hour might matter more than price-volume correlation, but standard approaches treat them equally.
Solution:
Each RFF dimension has an importance weight . After each trade:
Calculate correlation: sign(feature - 0.5) × sign(reward)
Update importance: importance += correlation × 0.01
Clamp to range
Effect: Important features get amplified in RFF transformation, less important features get suppressed. System learns which features correlate with successful outcomes.
Temporal Context (Extreme Mode)
Challenge: Current market state alone may be incomplete. Historical context (was volatility rising or falling?) provides additional information.
Solution:
Includes 3-period historical context with exponential decay (0.85):
Current features (weight 1.0)
1 bar ago (weight 0.85)
2 bars ago (weight 0.72)
Effect: Captures momentum and acceleration of market features. System learns patterns like "rising volatility with falling entropy" that may precede significant moves.
Transfer Learning via Episodic Memory
Short-Term Memory (STM):
Last 20 trades
Fast adaptation to immediate regime
High learning rate
Long-Term Memory (LTM):
Condensed historical patterns
Preserved knowledge from past regimes
Low learning rate
Transfer Mechanism:
When STM fills (20 trades), patterns consolidated into LTM . When similar regime recurs later, LTM provides faster adaptation than starting from scratch.
Practical Implementation Guide - Recommended Settings by Instrument
Futures (ES, NQ, CL):
Adaptive Period: 20-25
ML Mode: Advanced
RFF Dimensions: 16
Policies: 6
Base Risk: 1.5%
Stop Mode: ATR or Hybrid
Timeframe: 5-15 min
Forex Majors (EURUSD, GBPUSD):
Adaptive Period: 25-30
ML Mode: Advanced
RFF Dimensions: 16
Policies: 6
Base Risk: 1.0-1.5%
Stop Mode: ATR
Timeframe: 5-30 min
Cryptocurrency (BTC, ETH):
Adaptive Period: 20-25
ML Mode: Extreme (handles non-stationarity)
RFF Dimensions: 32 (captures complexity)
Policies: 6
Base Risk: 1.0% (volatility consideration)
Stop Mode: Hybrid
Timeframe: 15 min - 4 hr
Stocks (Large Cap):
Adaptive Period: 25-30
ML Mode: Advanced
RFF Dimensions: 16
Policies: 5-6
Base Risk: 1.5-2.0%
Stop Mode: Structural or Hybrid
Timeframe: 15 min - Daily
Scaling Strategy
Phase 1 (Testing - First 50 Trades):
Max Contracts: 1-2
Goal: Validate system on your instrument
Monitor: Performance stabilization, learning progress
Phase 2 (Validation - Trades 50-100):
Max Contracts: 2-3
Goal: Confirm learning convergence
Monitor: Policy stability, exploration decay
Phase 3 (Scaling - Trades 100-200):
Max Contracts: 3-5
Enable: Kelly sizing (1/4 Kelly)
Goal: Optimize capital efficiency
Monitor: Risk-adjusted returns
Phase 4 (Full Deployment - Trades 200+):
Max Contracts: 5-10
Enable: Full momentum tracking
Goal: Sustained consistent performance
Monitor: Ongoing adaptation quality
Limitations & Disclaimers
Statistical Limitations
Learning Sample Size: System requires minimum 50-100 trades for basic convergence, 200+ trades for robust learning. Early performance (first 50 trades) may not reflect mature system behavior.
Non-Stationarity Risk: Markets change over time. A system trained on one market regime may need time to adapt when conditions shift (typically 30-50 trades for adjustment).
Overfitting Possibility: With 16-32 RFF dimensions and 6 policies, system has substantial parameter space. Small sample sizes (<200 trades) increase overfitting risk. Mitigated by regularization (λ) and fractional Kelly sizing.
Technical Limitations
Computational Complexity: Extreme mode with 32 RFF dimensions, 6 policies, and full RL stack requires significant computation. May perform slowly on lower-end systems or with many other indicators loaded.
Pine Script Constraints:
No true matrix inversion (uses diagonal approximation for LinUCB)
No cryptographic RNG (uses market data as entropy)
No proper random number generation for RFF (uses deterministic pseudo-random)
These approximations reduce mathematical precision compared to academic implementations but remain functional for trading applications.
Data Requirements: Needs clean OHLCV data. Missing bars, gaps, or low liquidity (<100k daily volume) can degrade signal quality.
Forward-Looking Bias Disclaimer
Reward Calculation Uses Future Data: The RL system evaluates trades using an 8-bar forward-looking window. This means when a position enters at bar 100, the reward calculation considers price movement through bar 108.
Why This is Disclosed:
Entry signals do NOT look ahead - decisions use only data up to entry bar
Forward data used for learning only, not signal generation
In live trading, system learns identically as bars unfold in real-time
Simulates natural learning process (outcomes are only known after trades complete)
Implication: Backtested metrics reflect this 8-bar evaluation window. Live performance may vary if:
- Positions held longer than 8 bars
- Slippage/commissions differ from backtest settings
- Market microstructure changes (wider spreads, different execution quality)
Risk Warnings
No Guarantee of Profit: All trading involves substantial risk of loss. Machine learning systems can fail if market structure fundamentally changes or during unprecedented events.
Maximum Drawdown: With 1.5% base risk and 4% max total risk, expect potential drawdowns. Historical drawdowns do not predict future drawdowns. Extreme market conditions can exceed expectations.
Black Swan Events: System has not been tested under: flash crashes, trading halts, circuit breakers, major geopolitical shocks, or other extreme events. Such events can exceed stop losses and cause significant losses.
Leverage Risk: Futures and forex involve leverage. Adverse moves combined with leverage can result in losses exceeding initial investment. Use appropriate position sizing for your risk tolerance.
System Failures: Code bugs, broker API failures, internet outages, or exchange issues can prevent proper execution. Always monitor automated systems and maintain appropriate safeguards.
Appropriate Use
This System Is:
✅ A machine learning framework for adaptive strategy selection
✅ A signal generation system with probabilistic scoring
✅ A risk management system with dynamic sizing
✅ A learning system designed to adapt over time
This System Is NOT:
❌ A price prediction system (does not forecast exact prices)
❌ A guarantee of profits (can and will experience losses)
❌ A replacement for due diligence (requires monitoring and understanding)
❌ Suitable for complete beginners (requires understanding of ML concepts, risk management, and trading fundamentals)
Recommended Use:
Paper trade for 100 signals before risking capital
Start with minimal position sizing (1-2 contracts) regardless of calculated size
Monitor learning progress via dashboard
Scale gradually over several months only after consistent results
Combine with fundamental analysis and broader market context
Set account-level risk limits (e.g., maximum drawdown threshold)
Never risk more than you can afford to lose
What Makes This System Different
RPD implements academically-derived machine learning algorithms rather than simple mathematical calculations or optimization:
✅ LinUCB Contextual Bandits - Algorithm from WWW 2010 conference (Li et al.)
✅ Random Fourier Features - Kernel approximation from NIPS 2007 (Rahimi & Recht)
✅ Q-Learning, TD(λ), REINFORCE - Standard RL algorithms from Sutton & Barto textbook
✅ Meta-Learning - Learning rate adaptation based on feature correlation
✅ Online Learning - Real-time updates from streaming data
✅ Hierarchical Policies - Two-stage selection with clustering
✅ Momentum Tracking - Recent performance analysis for faster adaptation
✅ Attention Mechanism - Feature importance weighting
✅ Transfer Learning - Episodic memory consolidation
Key Differentiators:
Actually learns from trade outcomes (not just parameter optimization)
Updates model parameters in real-time (true online learning)
Adapts to changing market regimes (not static rules)
Improves over time through reinforcement learning
Implements published ML algorithms with proper citations
Conclusion
RPD Machine Learning represents a different approach from traditional technical analysis to adaptive, self-learning systems . Instead of manually optimizing parameters (which can overfit to historical data), RPD learns behavior patterns from actual trading outcomes in your specific market.
The combination of contextual bandits, reinforcement learning, random fourier features, hierarchical policy selection, and momentum tracking creates a multi-algorithm learning system designed to handle non-stationary markets better than static approaches.
After the initial learning phase (50-100 trades), the system achieves autonomous adaptation - automatically discovering which strategies work in current conditions and shifting allocation without human intervention. This represents an approach where systems adapt over time rather than remaining static.
Use responsibly. Paper trade extensively. Scale gradually. Understand that past performance does not guarantee future results and all trading involves risk of loss.
Taking you to school. — Dskyz, Trade with insight. Trade with anticipation.

Order Block Volumatic FVG StrategyInspired by: Volumatic Fair Value Gaps —
License: CC BY-NC-SA 4.0 (Creative Commons Attribution–NonCommercial–ShareAlike).
This script is a non-commercial derivative work that credits the original author and keeps the same license.
What this strategy does
This turns BigBeluga’s visual FVG concept into an entry/exit strategy. It scans bullish and bearish FVG boxes, measures how deep price has mitigated into a box (as a percentage), and opens a long/short when your mitigation threshold and filters are satisfied. Risk is managed with a fixed Stop Loss % and a Trailing Stop that activates only after a user-defined profit trigger.
Additions vs. the original indicator
✅ Strategy entries based on % mitigation into FVGs (long/short).
✅ Lower-TF volume split using upticks/downticks; fallback if LTF data is missing (distributes prior bar volume by close’s position in its H–L range) to avoid NaN/0.
✅ Per-FVG total volume filter (min/max) so you can skip weak boxes.
✅ Age filter (min bars since the FVG was created) to avoid fresh/immature boxes.
✅ Bull% / Bear% share filter (the 46%/53% numbers you see inside each FVG).
✅ Optional candle confirmation and cooldown between trades.
✅ Risk management: fixed SL % + Trailing Stop with a profit trigger (doesn’t trail until your trigger is reached).
✅ Pine v6 safety: no unsupported args, no indexof/clamp/when, reverse-index deletes, guards against zero/NaN.
How a trade is decided (logic overview)
Detect FVGs (same rules as the original visual logic).
For each FVG currently intersected by the bar, compute:
Mitigation % (how deep price has entered the box).
Bull%/Bear% split (internal volume share).
Total volume (printed on the box) from LTF aggregation or fallback.
Age (bars) since the box was created.
Apply your filters:
Mitigation ≥ Long/Short threshold.
Volume between your min and max (if enabled).
Age ≥ min bars (if enabled).
Bull% / Bear% within your limits (if enabled).
(Optional) the current candle must be in trade direction (confirm).
If multiple FVGs qualify on the same bar, the strategy uses the most recent one.
Enter long/short (no pyramiding).
Exit with:
Fixed Stop Loss %, and
Trailing Stop that only starts after price reaches your profit trigger %.
Input settings (quick guide)
Mitigation source: close or high/low. Use high/low for intrabar touches; close is stricter.
Mitigation % thresholds: minimal mitigation for Long and Short.
TOTAL Volume filter: skip FVGs with too little/too much total volume (per box).
Bull/Bear share filter: require, e.g., Long only if Bull% ≥ 50; avoid Short when Bull% is high (Short Bull% max).
Age filter (bars): e.g., ≥ 20–30 bars to avoid fresh boxes.
Confirm candle: require candle direction to match the trade.
Cooldown (bars): minimum bars between entries.
Risk:
Stop Loss % (fixed from entry price).
Activate trailing at +% profit (the trigger).
Trailing distance % (the trailing gap once active).
Lower-TF aggregation:
Auto: TF/Divisor → picks 1/3/5m automatically.
Fixed: choose 1/3/5/15m explicitly.
If LTF can’t be fetched, fallback allocates prior bar’s volume by its close position in the bar’s H–L.
Suggested starting presets (you should optimize per market)
Mitigation: 60–80% for both Long/Short.
Bull/Bear share:
Long: Bull% ≥ 50–70, Bear% ≤ 100.
Short: Bull% ≤ 60 (avoid shorting into strong support), Bear% ≥ 0–70 as you prefer.
Age: ≥ 20–30 bars.
Volume: pick a min that filters noise for your symbol/timeframe.
Risk: SL 4–6%, trailing trigger 1–2%, distance 1–2% (crypto example).
Set slippage/fees in Strategy Properties.
Notes, limitations & best practices
Data differences: The LTF split uses request.security_lower_tf. If the exchange/data feed has sparse LTF data, the fallback kicks in (it’s deliberate to avoid NaNs but is a heuristic).
Real-time vs backtest: The current bar can update until close; results on historical bars use closed data. Use “Bar Replay” to understand intrabar effects.
No pyramiding: Only one position at a time. Modify pyramiding in the header if you need scaling.
Assets: For spot/crypto, TradingView “volume” is exchange volume; in some markets it may be tick volume—interpret filters accordingly.
Risk disclosure: Past performance ≠ future results. Use appropriate position sizing and risk controls; this is not financial advice.
Credits
Visual FVG concept and original implementation: BigBeluga.
This derivative strategy adds entry/exit logic, volume/age/share filters, robust LTF handling, and risk management while preserving the original spirit.
License remains CC BY-NC-SA 4.0 (non-commercial, attribution required, share-alike).

Dskyz (DAFE) Aurora Divergence – Quant Master Dskyz (DAFE) Aurora Divergence – Quant Master
Introducing the Dskyz (DAFE) Aurora Divergence – Quant Master , a strategy that’s your secret weapon for mastering futures markets like MNQ, NQ, MES, and ES. Born from the legendary Aurora Divergence indicator, this fully automated system transforms raw divergence signals into a quant-grade trading machine, blending precision, risk management, and cyberpunk DAFE visuals that make your charts glow like a neon skyline. Crafted with care and driven by community passion, this strategy stands out in a sea of generic scripts, offering traders a unique edge to outsmart institutional traps and navigate volatile markets.
The Aurora Divergence indicator was a cult favorite for spotting price-OBV divergences with its aqua and fuchsia orbs, but traders craved a system to act on those signals with discipline and automation. This strategy delivers, layering advanced filters (z-score, ATR, multi-timeframe, session), dynamic risk controls (kill switches, adaptive stops/TPs), and a real-time dashboard to turn insights into profits. Whether you’re a newbie dipping into futures or a pro hunting reversals, this strat’s got your back with a beginner guide, alerts, and visuals that make trading feel like a sci-fi mission. Let’s dive into every detail and see why this original DAFE creation is a must-have.
Why Traders Need This Strategy
Futures markets are a battlefield—fast-paced, volatile, and riddled with institutional games that can wipe out undisciplined traders. From the April 28, 2025 NQ 1k-point drop to sneaky ES slippage, the stakes are high. Meanwhile, platforms are flooded with unoriginal, low-effort scripts that promise the moon but deliver noise. The Aurora Divergence – Quant Master rises above, offering:
Unmatched Originality: A bespoke system built from the ground up, with custom divergence logic, DAFE visuals, and quant filters that set it apart from copycat clutter.
Automation with Precision: Executes trades on divergence signals, eliminating emotional slip-ups and ensuring consistency, even in chaotic sessions.
Quant-Grade Filters: Z-score, ATR, multi-timeframe, and session checks filter out noise, targeting high-probability reversals.
Robust Risk Management: Daily loss and rolling drawdown kill switches, plus ATR-based stops/TPs, protect your capital like a fortress.
Stunning DAFE Visuals: Aqua/fuchsia orbs, aurora bands, and a glowing dashboard make signals intuitive and charts a work of art.
Community-Driven: Evolved from trader feedback, this strat’s a labor of love, not a recycled knockoff.
Traders need this because it’s a complete, original system that blends accessibility, sophistication, and style. It’s your edge to trade smarter, not harder, in a market full of traps and imitators.
1. Divergence Detection (Core Signal Logic)
The strategy’s core is its ability to detect bullish and bearish divergences between price and On-Balance Volume (OBV), pinpointing reversals with surgical accuracy.
How It Works:
Price Slope: Uses linear regression over a lookback (default: 9 bars) to measure price momentum (priceSlope).
OBV Slope: OBV tracks volume flow (+volume if price rises, -volume if falls), with its slope calculated similarly (obvSlope).
Bullish Divergence: Price slope negative (falling), OBV slope positive (rising), and price above 50-bar SMA (trend_ma).
Bearish Divergence: Price slope positive (rising), OBV slope negative (falling), and price below 50-bar SMA.
Smoothing: Requires two consecutive divergence bars (bullDiv2, bearDiv2) to confirm signals, reducing false positives.
Strength: Divergence intensity (divStrength = |priceSlope * obvSlope| * sensitivity) is normalized (0–1, divStrengthNorm) for visuals.
Why It’s Brilliant:
- Divergences catch hidden momentum shifts, often exploited by institutions, giving you an edge on reversals.
- The 50-bar SMA filter aligns signals with the broader trend, avoiding choppy markets.
- Adjustable lookback (min: 3) and sensitivity (default: 1.0) let you tune for different instruments or timeframes.
2. Filters for Precision
Four advanced filters ensure signals are high-probability and market-aligned, cutting through the noise of volatile futures.
Z-Score Filter:
Logic: Calculates z-score ((close - SMA) / stdev) over a lookback (default: 50 bars). Blocks entries if |z-score| > threshold (default: 1.5) unless disabled (useZFilter = false).
Impact: Avoids trades during extreme price moves (e.g., blow-off tops), keeping you in statistically safe zones.
ATR Percentile Volatility Filter:
Logic: Tracks 14-bar ATR in a 100-bar window (default). Requires current ATR > 80th percentile (percATR) to trade (tradeOk).
Impact: Ensures sufficient volatility for meaningful moves, filtering out low-volume chop.
Multi-Timeframe (HTF) Trend Filter:
Logic: Uses a 50-bar SMA on a higher timeframe (default: 60min). Longs require price > HTF MA (bullTrendOK), shorts < HTF MA (bearTrendOK).
Impact: Aligns trades with the bigger trend, reducing counter-trend losses.
US Session Filter:
Logic: Restricts trading to 9:30am–4:00pm ET (default: enabled, useSession = true) using America/New_York timezone.
Impact: Focuses on high-liquidity hours, avoiding overnight spreads and erratic moves.
Evolution:
- These filters create a robust signal pipeline, ensuring trades are timed for optimal conditions.
- Customizable inputs (e.g., zThreshold, atrPercentile) let traders adapt to their style without compromising quality.
3. Risk Management
The strategy’s risk controls are a masterclass in balancing aggression and safety, protecting capital in volatile markets.
Daily Loss Kill Switch:
Logic: Tracks daily loss (dayStartEquity - strategy.equity). Halts trading if loss ≥ $300 (default) and enabled (killSwitch = true, killSwitchActive).
Impact: Caps daily downside, crucial during events like April 27, 2025 ES slippage.
Rolling Drawdown Kill Switch:
Logic: Monitors drawdown (rollingPeak - strategy.equity) over 100 bars (default). Stops trading if > $1000 (rollingKill).
Impact: Prevents prolonged losing streaks, preserving capital for better setups.
Dynamic Stop-Loss and Take-Profit:
Logic: Stops = entry ± ATR * multiplier (default: 1.0x, stopDist). TPs = entry ± ATR * 1.5x (profitDist). Longs: stop below, TP above; shorts: vice versa.
Impact: Adapts to volatility, keeping stops tight but realistic, with TPs targeting 1.5:1 reward/risk.
Max Bars in Trade:
Logic: Closes trades after 8 bars (default) if not already exited.
Impact: Frees capital from stagnant trades, maintaining efficiency.
Kill Switch Buffer Dashboard:
Logic: Shows smallest buffer ($300 - daily loss or $1000 - rolling DD). Displays 0 (red) if kill switch active, else buffer (green).
Impact: Real-time risk visibility, letting traders adjust dynamically.
Why It’s Brilliant:
- Kill switches and ATR-based exits create a safety net, rare in generic scripts.
- Customizable risk inputs (maxDailyLoss, dynamicStopMult) suit different account sizes.
- Buffer metric empowers disciplined trading, a DAFE signature.
4. Trade Entry and Exit Logic
The entry/exit rules are precise, filtered, and adaptive, ensuring trades are deliberate and profitable.
Entry Conditions:
Long Entry: bullDiv2, cooldown passed (canSignal), ATR filter passed (tradeOk), in US session (inSession), no kill switches (not killSwitchActive, not rollingKill), z-score OK (zOk), HTF trend bullish (bullTrendOK), no existing long (lastDirection != 1, position_size <= 0). Closes shorts first.
Short Entry: Same, but for bearDiv2, bearTrendOK, no long (lastDirection != -1, position_size >= 0). Closes longs first.
Adaptive Cooldown: Default 2 bars (cooldownBars). Doubles (up to 10) after a losing trade, resets after wins (dynamicCooldown).
Exit Conditions:
Stop-Loss/Take-Profit: Set per trade (ATR-based). Exits on stop/TP hits.
Other Exits: Closes if maxBarsInTrade reached, ATR filter fails, or kill switch activates.
Position Management: Ensures no conflicting positions, closing opposites before new entries.
Built To Be Reliable and Consistent:
- Multi-filtered entries minimize false signals, a stark contrast to basic scripts.
- Adaptive cooldown prevents overtrading, especially after losses.
- Clean position handling ensures smooth execution, even in fast markets.
5. DAFE Visuals
The visuals are a DAFE hallmark, blending function with clean flair to make signals intuitive and charts stunning.
Aurora Bands:
Display: Bands around price during divergences (bullish: below low, bearish: above high), sized by ATR * bandwidth (default: 0.5).
Colors: Aqua (bullish), fuchsia (bearish), with transparency tied to divStrengthNorm.
Purpose: Highlights divergence zones with a glowing, futuristic vibe.
Divergence Orbs:
Display: Large/small circles (aqua below for bullish, fuchsia above for bearish) when bullDiv2/bearDiv2 and canSignal. Labels show strength (0–1).
Purpose: Pinpoints entries with eye-catching clarity.
Gradient Background:
Display: Green (bullish), red (bearish), or gray (neutral), 90–95% transparent.
Purpose: Sets the market mood without clutter.
Strategy Plots:
- Stop/TP Lines: Red (stops), green (TPs) for active trades.
- HTF MA: Yellow line for trend context.
- Z-Score: Blue step-line (if enabled).
- Kill Switch Warning: Red background flash when active.
What Makes This Next-Level?:
- Visuals make complex signals (divergences, filters) instantly clear, even for beginners.
- DAFE’s unique aesthetic (orbs, bands) sets it apart from generic scripts, reinforcing originality.
- Functional plots (stops, TPs) enhance trade management.
6. Metrics Dashboard
The top-right dashboard (2x8 table) is your command center, delivering real-time insights.
Metrics:
Daily Loss ($): Current loss vs. day’s start, red if > $300.
Rolling DD ($): Drawdown vs. 100-bar peak, red if > $1000.
ATR Threshold: Current percATR, green if ATR exceeds, red if not.
Z-Score: Current value, green if within threshold, red if not.
Signal: “Bullish Div” (aqua), “Bearish Div” (fuchsia), or “None” (gray).
Action: “Consider Buying”/“Consider Selling” (signal color) or “Wait” (gray).
Kill Switch Buffer ($): Smallest buffer to kill switch, green if > 0, red if 0.
Why This Is Important?:
- Consolidates critical data, making decisions effortless.
- Color-coded metrics guide beginners (e.g., green action = go).
- Buffer metric adds transparency, rare in off-the-shelf scripts.
7. Beginner Guide
Beginner Guide: Middle-right table (shown once on chart load), explains aqua orbs (bullish, buy) and fuchsia orbs (bearish, sell).
Key Features:
Futures-Optimized: Tailored for MNQ, NQ, MES, ES with point-value adjustments.
Highly Customizable: Inputs for lookback, sensitivity, filters, and risk settings.
Real-Time Insights: Dashboard and visuals update every bar.
Backtest-Ready: Fixed qty and tick calc for accurate historical testing.
User-Friendly: Guide, visuals, and dashboard make it accessible yet powerful.
Original Design: DAFE’s unique logic and visuals stand out from generic scripts.
How to Use
Add to Chart: Load on a 5min MNQ/ES chart in TradingView.
Configure Inputs: Adjust instrument, filters, or risk (defaults optimized for MNQ).
Monitor Dashboard: Watch signals, actions, and risk metrics (top-right).
Backtest: Run in strategy tester to evaluate performance.
Live Trade: Connect to a broker (e.g., Tradovate) for automation. Watch for slippage (e.g., April 27, 2025 ES issues).
Replay Test: Use bar replay (e.g., April 28, 2025 NQ drop) to test volatility handling.
Disclaimer
Trading futures involves significant risk of loss and is not suitable for all investors. Past performance is not indicative of future results. Backtest results may not reflect live trading due to slippage, fees, or market conditions. Use this strategy at your own risk, and consult a financial advisor before trading. Dskyz (DAFE) Trading Systems is not responsible for any losses incurred.
Backtesting:
Frame: 2023-09-20 - 2025-04-29
Fee Typical Range (per side, per contract)
CME Exchange $1.14 – $1.20
Clearing $0.10 – $0.30
NFA Regulatory $0.02
Firm/Broker Commis. $0.25 – $0.80 (retail prop)
TOTAL $1.60 – $2.30 per side
Round Turn: (enter+exit) = $3.20 – $4.60 per contract
Final Notes
The Dskyz (DAFE) Aurora Divergence – Quant Master isn’t just a strategy—it’s a movement. Crafted with originality and driven by community passion, it rises above the flood of generic scripts to deliver a system that’s as powerful as it is beautiful. With its quant-grade logic, DAFE visuals, and robust risk controls, it empowers traders to tackle futures with confidence and style. Join the DAFE crew, light up your charts, and let’s outsmart the markets together!
(This publishing will most likely be taken down do to some miscellaneous rule about properly displaying charting symbols, or whatever. Once I've identified what part of the publishing they want to pick on, I'll adjust and repost.)
Use it with discipline. Use it with clarity. Trade smarter.
**I will continue to release incredible strategies and indicators until I turn this into a brand or until someone offers me a contract.
Created by Dskyz, powered by DAFE Trading Systems. Trade fast, trade bold.

Scalping with Williams %R, MACD, and SMA (1m)Overview:
This trading strategy is designed for scalping in the 1-minute timeframe. It uses a combination of the Williams %R, MACD, and SMA indicators to generate buy and sell signals. It also includes alert functionalities to notify users when trades are executed or closed.
Indicators Used:
Williams %R : A momentum indicator that measures overbought and oversold conditions. The Williams %R values range from -100 to 0.
Length: 140 bars (i.e., 140-period).
MACD (Moving Average Convergence Divergence) : A trend-following momentum indicator that shows the relationship between two moving averages of a security's price.
Fast Length: 24 bars
Slow Length: 52 bars
MACD Length: 9 bars (signal line)
SMA (Simple Moving Average) : A trend-following indicator that smooths out price data to create a trend-following indicator.
Length: 7 bars
Conditions and Logic:
Timeframe Check :
The strategy is designed specifically for the 1-minute timeframe. If the current chart is not on the 1-minute timeframe, a warning label is displayed on the chart instructing the user to switch to the 1-minute timeframe.
Williams %R Conditions :
Buy Condition: The strategy looks for a crossover of Williams %R from below -94 to above -94. This indicates a potential buying opportunity when the market is moving out of an oversold condition.
Sell Condition: The strategy looks for a crossunder of Williams %R from above -6 to below -6. This indicates a potential selling opportunity when the market is moving out of an overbought condition.
Deactivate Buy: If Williams %R crosses above -40, the buy signal is deactivated, suggesting that the buying condition is no longer valid.
Deactivate Sell: If Williams %R crosses below -60, the sell signal is deactivated, suggesting that the selling condition is no longer valid.
MACD Conditions :
MACD Histogram: Used to identify the momentum and the direction of the trend.
Long Entry: The strategy initiates a buy order if the MACD histogram shows a positive bar after a negative bar while a buy condition is active and Williams %R is above -94.
Long Exit: The strategy exits the buy position if the MACD histogram turns negative and is below the previous histogram bar.
Short Entry: The strategy initiates a sell order if the MACD histogram shows a negative bar after a positive bar while a sell condition is active and Williams %R is below -6.
Short Exit: The strategy exits the sell position if the MACD histogram turns positive and is above the previous histogram bar.
Trend Confirmation (Using SMA) :
Bullish Trend: The strategy considers a bullish trend if the current price is above the 7-bar SMA. A buy signal is only considered if this condition is met.
Bearish Trend: The strategy considers a bearish trend if the current price is below the 7-bar SMA. A sell signal is only considered if this condition is met.
Alerts:
Long Entry Alert: An alert is triggered when a buy order is executed.
Long Exit Alert: An alert is triggered when the buy order is closed.
Short Entry Alert: An alert is triggered when a sell order is executed.
Short Exit Alert: An alert is triggered when the sell order is closed.
Summary:
Buy Signal: Activated when Williams %R crosses above -94 and the price is above the 7-bar SMA. A buy order is placed if the MACD histogram shows a positive bar after a negative bar. The buy order is closed when the MACD histogram turns negative and is below the previous histogram bar.
Sell Signal: Activated when Williams %R crosses below -6 and the price is below the 7-bar SMA. A sell order is placed if the MACD histogram shows a negative bar after a positive bar. The sell order is closed when the MACD histogram turns positive and is above the previous histogram bar.
This strategy combines momentum (Williams %R), trend-following (MACD), and trend confirmation (SMA) to identify trading opportunities in the 1-minute timeframe. It is designed for short-term trading or scalping.

LeafAlgo Premium Macro StrategiesA "macro score", as defined here, is created by giving various weights to different signals and adding them together to get one smooth score. Positive or negative values are assigned to each of the signals depending on if the statement is true or false (e.g. DPO > 0: +1, DPO < 0: -1). This manner of strategy allows for a subset of the available signals to be present at one time as opposed to every technical signal having to be active in order for a long/short signal to trigger.
This strategy contains SIX different macro score strategies -- "Base DFMA", "Base DFMG", "Ichimoku", "TSI", "Donchian DFMA", and "Donchian DFMG". These strategies have the signals and weights pre-determined in the code. The "Base DFMA" strategy is based on our Democratic Fibonacci Moving Average (DFMA) indicator; the "Donchian DFMA" is the same as the base DFMA strategy, but with a signal from our Donchian Cloud Score indicator as added confluence. The "Base DFMG" strategy is based on our Democratic Fibonacci McGinley Dynamics (DFMG) indicator; the "Donchian DFMG" is the same, but with the Donchian Cloud Score as added confluence. The "Ichimoku" strategy is based on the major sub-indicators found within an Ichimoku Cloud in addition to our Donchian Cloud Score. The "TSI" strategy is based on the True Strength Index.
The ability to select your strategy of choice can be found at the top of the strategy settings under "Strategy Options", then in the drop-down menu labeled "Strategy Choice".
The DFMA - Democratic Fibonacci Moving Average - is a separate indicator that we have released that takes 10 different Fibonacci MAs (lengths of 3 to 233, at Fibonacci intervals) and averages them to form the DFMA line. This helps by creating a consensus on the trend based on moving averages alone. Crossovers of the DFMA with the various Fib MA lengths as well as a cross of the price source and these lines can provide adequate long and short signals. In the two DFMA strategies, the heaviest weights have been given to crosses of the DFMA line/Fib MA (233) as well as the crosses of the Fib MA (3)/DFMA. Additionally, there are thresholds for DPO ( Detrended Price Oscillator , above or below 0), CMO ( Chande Momentum Oscillator , above or below 0), Jurik Volatility Bands (above or below 0), and Stoch RSI (above or below 50). These four signals hold a lighter weight than the MA cross signals. The macro score itself ranges between -10 and 10. In addition to the macro score line, a momentum line (sourced by the macro score itself) has been included. A crossover/crossunder of the macro score and the macro momentum line is included into the long/short signal syntax in addition to a threshold for the macro score.
The DFMG - Democratic Fibonacci McGinley Dynamics - is a separate indicator that we have released that takes 10 different Fibonacci McGinley Dynamic liness (lengths of 3 to 233, at Fibonacci intervals) and averages them to form the DFMG line. This helps by creating a consensus on the trend based on moving averages alone. Crossovers of the DFMG with the various Fib MG lengths as well as a cross of the price source and these lines can provide adequate long and short signals. This strategy has the signals and weights pre-determined in the code. Heaviest weights have been given to crosses of the DFMG line/ McGinley (233) as well as the crosses of the McGinley (3)/DFMG. Additionally, there are thresholds for DPO ( Detrended Price Oscillator , above or below 0), CMO ( Chande Momentum Oscillator , above or below 0), Jurik Volatility Bands (above or below 0), and Stoch RSI (above or below 50). These four signals hold a lighter weight than the McGinley cross signals. The macro score itself ranges between -10 and 10. In addition to the macro score line, a momentum line (sourced by the macro score itself) has been included. A crossover/crossunder of the macro score and the macro momentum line is included into the long/short signal syntax in addition to a threshold for the macro score.
For the Ichimoku macro score, five signals were considered and weighted equally:
- Kijun-sen < Ichimoku Source
- Tenkan-sen < Ichimoku Source
- Kijun-sen > Chikou-span
- Tenkan-sen > Kijun-sen
- Senkou Span A > Senkou Span B
In addition to these factors, the Ichimoku strategy utilizes the Donchian Cloud Score in the long and short entry signals. Thus, the Donchian Cloud settings are applicable to this strategy.
For the True Strength Index strategy, the heaviest weights have been given to various TSI signals, including a crossover/crossunder of TSI signal and TSI value, a threshold for the TSI Signal (above or below 0), and a crossover/crossunder of the CMO ( Chande Momentum Oscillator ) and the TSI signal line. Additionally, there are thresholds for DPO ( Detrended Price Oscillator , above or below 0), Jurik Volatility Bands (above or below 0), and Stoch RSI (above or below 50). These three signals hold a lighter weight than the three TSI signals. The macro score itself ranges between -10 and 10. In addition to the macro score line, a momentum line (sourced by the macro score itself) has been included. A crossover/crossunder of the macro score and the macro momentum line is included into the long/short signal syntax in addition to a threshold for the macro score.
The Donchian Cloud Score is derived from a set of 5 Donchian channels (upper, lower, and basis plotted) defaulted to lengths of 25, 50, 100, 150, and 200. A set of conditions associated with the channels aims to determine ranging versus trending markets. Weights are given to these conditions accordingly, then tallied up to determine the "cloud score", ranging between -25 and 25. In general, a ranging market is determined by a cloud score between -10 and 10, while a positive trending market has a score higher than 10 and a negative trending market has a score lower than -10. That said, long and short thresholds similar to the macro score itself are included in the user settings and set to a default of 5 or -5. The cloud score is plotted as a line in the underlay with coloration reflecting ranging or trending markets (green color above the long threshold, gray between the thresholds, and red below the short threshold). The cloud score is incorporated into the strategy syntax for long and short positions in that the score must be above or below the set threshold for a trade to be placed. A breakdown for the Donchian scoring is as follows:
- Broke the 25-length DC (DC(25)) upper band in the previous 3 bars - +1 if true, 0 if false
- Broke the DC(50) upper band in the previous 3 bars - +2 if true, 0 if false
- Broke the DC(100) upper band in the previous 3 bars - +3 if true, 0 if false
- Broke the DC(150) upper band in the previous 3 bars - +4 if true, 0 if false
- Broke the DC(200) upper band in the previous 3 bars - +5 if true, 0 if false
- Broke the DC(25) lower band in the previous 3 bars - -1 if true, 0 if false
- Broke the DC(50) lower band in the previous 3 bars - -2 if true, 0 if false
- Broke the DC(100) lower band in the previous 3 bars - -3 if true, 0 if false
- Broke the DC(150) lower band in the previous 3 bars - -4 if true, 0 if false
- Broke the DC(200) lower band in the previous 3 bars - -5 if true, 0 if false
- DC(25) basis line above the DC(50) basis line - +1 if true, -1 if false
- DC(25) basis line above the DC(100) basis line - +1 if true, -1 if false
- DC(25)basis line above the DC(150) basis line - +1 if true, -1 if false
- DC(25) basis line above the DC(200) basis line - +1 if true, -1 if false
- DC(50) basis line above the DC(100) basis line - +1 if true, -1 if false
- DC(50) basis line above the DC(150) basis line - +1 if true, -1 if false
- DC(50) basis line above the DC(200) basis line - +1 if true, -1 if false
- DC(100) basis line above the DC(150) basis line - +1 if true, -1 if false
- DC(100) basis line above the DC(200) basis line - +1 if true, -1 if false
- DC(150) basis line above the DC(200) basis line - +1 if true, -1 if false
Thresholds for both the respective macro score and the Donchian Cloud score have been included. Entry signals for each strategy require the score to be >= the respective thresholds for longs and <= the respective thresholds for shorts.
Additionally, a normalized z-score has been included. The z-score does not affect the entry and exit signals, however, it is displayed on the chart in the form of bar coloration. The z-score has been normalized to a range of -1 to +1. A z-score under -0.60 is displayed as a red bar color, a score between -0.60 and -0.2 is displayed as an orange bar color, a score between -0.2 and 0.2 is displayed as a gray bar color, a score between 0.2 and 0.6 is displayed as a lime bar color, and a score over 0.6 is displayed in green.
Data for each respective strategy will be displayed in an overlaid table. This includes the factors that comprise the macro score of choice, the values of each signal that adds up to the macro score, the macro score itself, the value of the momentum line of the macro score, the normalized z-score value, and the Donchian Cloud score (if applicable). Green coloration notes bullish sentiment within the signals or values, gray coloration is neutral, and red coloration notes bearish sentiment.
Take profit, stop loss, and trailing percentages are also included, found at the bottom of the Input tab under “TT and TTP” as well as “Stop Loss”. The take profit and stop loss levels will be reflected as green and red lines respectively on the chart as they occur. Make sure to understand the TP/SL ratio that you desire before use, as the desired hit rate/profitability percentage will be affected accordingly. The option for adding in a trailing stop has also been included, with options to choose between an ATR-based trail or a percentage-based trail. This strategy does NOT guarantee future returns. Apply caution in trading regardless of discretionary or algorithmic. Understand the concepts of risk/reward and the intricacies of each strategy choice before utilizing them in your personal trading.
Profitview/Pineconnector Settings:
If you wish to utilize Profitview’s automation system, find the included “Profitview Settings” under the Input tab of the strategy settings menu. If not, skip this section entirely as it can be left blank. Options will be “OPEN LONG TITLE”, “OPEN SHORT TITLE”, “CLOSE LONG TITLE”, and “CLOSE SHORT TITLE”. If you wished to trade SOL, for example, you would put “SOL LONG”, “SOL SHORT”, “SOL CLOSE LONG”, and “SOL CLOSE SHORT” in these areas. Within your Profitview extension, ensure that your Alerts all match these titles. To set an alert for use with Profitview, go to the “Alerts” tab in TradingView, then create an alert. Make sure that your desired asset and timeframe are currently displayed on your screen when creating the alert. Under the “Condition” option of the alert, select the strategy, then select the expiration time. If using TradingView Premium, this can be open-ended. Otherwise, select your desired expiration time and date. This can be updated whenever desired to ensure the strategy does not expire. Under “Alert actions”, nothing necessarily needs to be selected unless so desired. Leave the “Alert name” option empty. For the “Message”, delete the generated message and replace it with {{strategy.order.alert_message}} and nothing else. If using Pineconnector, follow the same directions for setting up an alert, but use the ",buy,,risk=" syntax as noted in the tooltips.
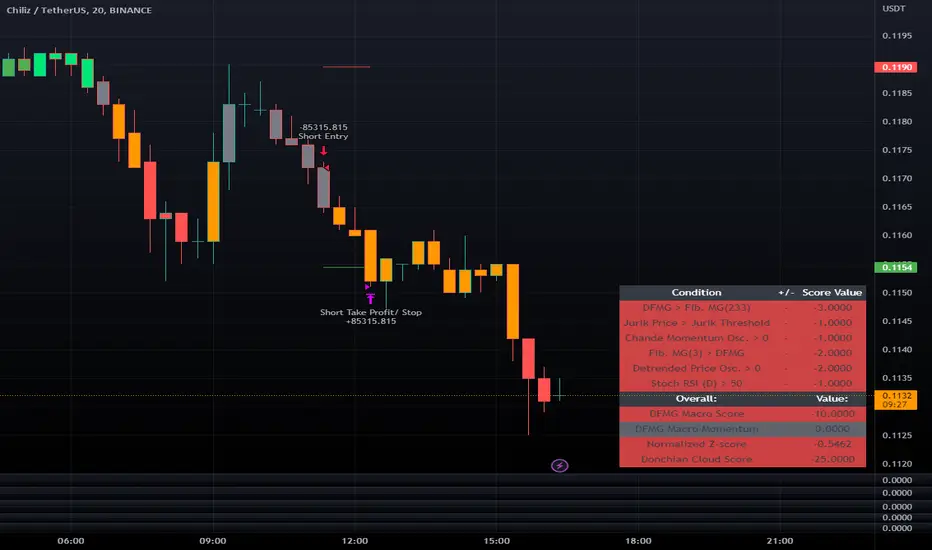
Smoothed Waddah ATR~~~All Credit to LAZY BEAR for posting the original Script which is an old MT4 indicator.~~~~
No this system does not repaint... if it does let me know. Either the code is wrong or you are using a repainting chart such as renko candles.
*PURPOSE*
This Is an "Enhanced or Smoothed" version of the script that captures the heiken-ashi closing price as its main calculation variable. While using normal bar or line charts. Enhancements integrate trade filters to reduce false signals.
*WHAT TYPE OF TRADING STRATEGY IS THIS?*
This is a Long Only, Trend Trading System. Is intended to be applied to Charts/Timeframes that produce sustainable trends for which ever asset you are trading.
*NOTE OF ADVICE REGARDING SETTINGS*
Settings can be tweaked but I have found that best results come with the given settings. If a chart is too choppy to trade this indicator successfully, it is advised not to change the settings but either find a different timeframe or different asset to apply this strategy to.
TLDR
Indicator measures the change of the MacD (difference between MAC D of given EMA's) and compares it to the difference between the Upper and Lower Bollinger bands. Green bar over trigger line= entry. Red bar over trigger line = close.
*SETTINGS AND INPUTS*
-MacD of HeikenAshi chart (will always be of the Heikenashi chart even when applied to different chart type)
sensitivity = input(150, title='Sensitivity') =range should be (125-175)multiplier so that MacD can be compared to BB
fastLength = input(20, title='MacD FastEMA Length')
slowLength = input(40, title='MacD SlowEMA Length')
-Bollinger Band of currently used price chart type
channelLength = input(20, title='BB Channel Length')
mult = input(1.5, title='BB Stdev Multiplier')
-14 Period RSI Trade Filter (set to 0 to Disable)
RSI14filter = input(40, title='RSI Value trade filter') =only gives entry when RSI is higher than given value
*ABSTRACT & CONCEPT*
TLDR - Indicator measures the change of the MacD (difference between MAC D of given EMA's) and compares it to the difference between the Upper and Lower Bollinger bands. Green bar over trigger line= entry. Red bar over trigger line = close.
Indicator plots -
Bars are the change in the MAC D and the indicator line is the difference in the BB.
When Bars are higher than the indicator line then it is considered a trend "Explosion"
Green Bars are Trend Explosion to the upside, Red Bars are Trend explosion to the downside.
GENERAL DETAIL-
the core calculation is measuring the change in MacD of current candle compared to the MacD of two previous candles.
This value is multiplied by the sensitivy so it can be compared to the change in Bollinger Band Width.
if the MACD change is positive then you get a green/lime bar for that value. If the MacDchange is negative you get a red/orange bar for that value.
and are determined by whether the actual change is increasing in that direction or decreasing. (bars getting taller or bars getting shorter)
Entry signal for long is A positive change in MACD difference (Green bar) that is greater than the change of the bollinger band (orange signal line) AND if the RSI value is above your filter.
Close signal or Trend Stop Warning Signal is given when a Negative MacD Difference (red bar) is greater than the change of the bollinger band (orange Line)
*CONSIDERATIONS AND THOUGHTS*
I have over 150 iterations of this indicator and this is the most consistent and best version of settings and filters I was able to generate. I built this indicator specifically for 3 charts. SPY monthly, QQQ monthly, BTC 3 Day. However this indicator works well on any long term bullish chart. (tech stocks are great) .
Trend trading systems are intended to be homerun hitting, plunge protecting indicators that allow for long legs and expanding volatility. This indicator does this as the trigger line is Dynamic with the expansion and contraction of the bollinger band.
I do not take every signal specifically not the close signals. Instead they more like warnings in ultra bullish environments.
If i had to pair this indicator with any other filter than the RSI, it would be a long term moving average i.e. the 50 week or equivalent for your chart. signals above rising moving averages means that you are trading with an upward trending market.
Hope this helps. Happy trades.
-SnarkyPuppy

Joseph Nemeth Heiken Ashi Renko MTF StrategyFor Educational Purposes. Results can differ on different markets and can fail at any time. Profit is not guaranteed. This only works in a few markets and in certain situations. Changing the settings can give better or worse results for other markets.
Nemeth is a forex trader that came up with a multi-time frame heiken ashi based strategy that he showed to an older audience crowd on a speaking event video. He seems to boast about his strategy having high success results and makes an astonishing claim that looking at heiken ashi bars instead of regular candlestick bar charts can show the direction of the trend better and simpler than many other slower non-price based indicators. He says pretty much every indicator is about the same and the most important indicator is price itself. He is pessimistic about the markets and seems to think it is rigged and there is a sort of cabal that created rules to favor themselves, such as the inability of traders to hedge in one broker account, and that to win you have to take advantage of the statistics involved in the game. He believes fundamentals, chart patterns such as cup and handle and head and shoulders, and fibonacci numbers don't matter, only price matters. The foundation of his trading strategy is based around heiken ashi bars because they show a statistical pattern that can supposedly be taken advantage of by them repeating around seventy or so percent of the time, and then combines this idea with others based on the lower time frames involved.
The first step he uses is to identify the trend direction in the higher time frame(daily or 4 hourly) using the color of the heiken ashi bar itself. If it is green then take only long position after the bar completes, if it is red then take only short position. Next, on a lower time frame(1 hour or 30 minutes) look for the slope of the 20 exponential moving average to be sloping upward if going long or the slope of the ema to be sloping downward if going short(the price being above the moving average can work too if it's too hard to visualize the slope). Then look for the last heiken ashi bar, similarly to the first step, if it is green take long position, if it is red take short position. Finally the entry indicator itself will decide the entry on the lowest time frame. Nemeth recommends using MACD or CCI or possibly combine the two indicators on a 5 min or 15 min or so time frame if one does not have access to renko or range bars. If renko bars are available, then he recommends a 5 or 10 tick bar for the size(although I'm not sure if it's really possible to remove the time frame from renko bars or if 5 or 10 ticks is universal enough for everything). The idea is that renko bars paint a bar when there is price movement and it's important to have movement in the market, plus it's a simple indicator to use visually. The exit strategy is when the renko or the lowest time frame indicator used gives off an exit signal or if the above conditions of the higher time frames are not being met(he was a bit vague on this). Enter trades with only one-fifth of your capital because the other fifths will be used in case the trades go against you by applying a hedging technique he calls "zero zone recovery". He is somewhat vague about the full workings(perhaps because he uses his own software to automate his strategy) but the idea is that the second fifth will be used to hedge a trade that isn't going well after following the above, and the other fifths will be used to enter on another entry condition or if the other hedges fail also. Supposedly this helps the trader always come out with a profit in a sort of bushido-like trading tactic of never accepting defeat. Some critics argue that this is simply a ploy by software automation to boost their trade wins or to sell their product. The other argument against this strategy is that trading while the heiken ashi bar has not completed yet can jack up the backtest results, but when it comes to trading in real time, the strategy can end up repainting, so who knows if Nemeth isn't involving repainting or not, however he does mention the trades are upon completion of the bar(it came from an audience member's question). Lastly, the 3 time frames in ascending or descending fashion seem to be spaced out by about factors of 4 if you want to trade other time frames other than 5/15min,30min/1hour, or 4hour/daily(he mentioned the higher time frame should be atleast a dozen times higher than the lower time frame).
Personally I have not had luck getting the seventy+ percent accuracy that he talks about, whether in forex or other things. I made the default on renko bars to an ATR size 1 setting because it looks like the most universal option if the traditional mode box size is too hard to guess, and I made it so that you can switch between ATR and Traditional mode just in case. I don't think the strategy repaints because I think TV set a default on the multi-time frame aspects of their code to not re-paint, but I could be wrong so you might want to watch out for that. The zero zone recovery technique is included in the code but I commented it out and/or remove it because TV does not let you apply hedging properly, as far as I know. If you do use a proper hedging strategy with this, you'll find a very interesting bushido type of trading style involved with the Japanese bars that can boost profits and win rates of around possibly atleast seventy percent on every trade but unfortunately I was not able to test this part out properly because of the limitation on hedging here, and who knows if the hedging part isn't just a plot to sell his product. If his strategy does involve the repainting feature of the heiken ashi bars then it's possible he might have been preaching fools-gold but it's hard to say because he did mention it is upon completion of the bars. If you find out if this strategy works or doesn't work or find out a good setting that I somehow didn't catch, please feel free to let me know, will gladly appreciate it. We are all here to make some money!

Hash Momentum Strategy# Hash Momentum Strategy
## 📊 Overview
The **Hash Momentum Strategy** is a professional-grade momentum trading system designed to capture strong directional price movements with precision timing and intelligent risk management. Unlike traditional EMA crossover strategies, this system uses momentum acceleration as its primary signal, resulting in earlier entries and better risk-to-reward ratios.
---
## ⚡ What Makes This Strategy Unique
### 1. Momentum-Based Entry System
Most strategies rely on lagging indicators like moving average crossovers. This strategy captures momentum *acceleration* - entering when price movement is gaining strength, not after the move has already happened.
### 2. Programmable Risk-to-Reward
Set your exact R:R ratio (1:2, 1:2.5, 1:3, etc.) and the strategy automatically calculates stop loss and take profit levels. No more guessing or manual calculations.
### 3. Smart Partial Profit Taking
Lock in profits at multiple stages:
- **First TP**: Take 50% off at 2R
- **Second TP**: Take 40% off at 2.5R
- **Final TP**: Let 10% ride to maximum target
This approach locks in gains while letting winners run.
### 4. Dynamic Momentum Threshold
Uses ATR (Average True Range) multiplied by your threshold setting to adapt to market volatility. Volatile markets = higher threshold. Quiet markets = lower threshold.
### 5. Trade Cooldown System
Prevents overtrading and revenge trading by enforcing a cooldown period between trades. Configurable from 1-24 bars.
### 6. Optional Session & Weekend Filters
Filter trades by Tokyo, London, and New York sessions. Optional weekend-off toggle to avoid low-liquidity periods.
---
## 🎯 How It Works
### Signal Generation
**STEP 1: Calculate Momentum**
- Momentum = Current Price - Price
- Check if Momentum > ATR × Threshold Multiplier
- Momentum must be accelerating (positive change in momentum)
**STEP 2: Confirm with EMA Trend Filter**
- Long: Price must be above EMA
- Short: Price must be below EMA
**STEP 3: Check Filters**
- Not in cooldown period
- Valid session (if enabled)
- Not weekend (if enabled)
**STEP 4: ENTRY SIGNAL TRIGGERED**
### Risk Management Example
**Example Long Trade:**
- Entry: $100
- Stop Loss: $97.80 (2.2% risk)
- Risk Amount: $2.20
**Take Profit Levels:**
- TP1: $104.40 (2R = $4.40) → Close 50%
- TP2: $105.50 (2.5R = $5.50) → Close 40%
- Final: $105.50 (2.5R) → Close remaining 10%
---
## ⚙️ Settings Guide
### Core Strategy
**Momentum Length** (Default: 13)
Number of bars for momentum calculation. Higher = stronger but fewer signals.
**Momentum Threshold** (Default: 2.25)
ATR multiplier. Higher = only trade biggest moves.
**Use EMA Trend Filter** (Default: ON)
Only long above EMA, short below EMA.
**EMA Length** (Default: 28)
Period for trend-confirming EMA.
### Filters
**Use Trading Session Filter** (Default: OFF)
Restrict trading to specific sessions.
**Tokyo Session** (Default: OFF)
Trade during Asian hours (00:00-09:00 JST).
**London Session** (Default: OFF)
Trade during European hours (08:00-17:00 GMT).
**New York Session** (Default: OFF)
Trade during US hours (08:00-17:00 EST).
**Weekend Off** (Default: OFF)
Disable trading on Saturdays and Sundays.
### Risk Management
**Stop Loss %** (Default: 2.2)
Fixed percentage stop loss from entry.
**Risk:Reward Ratio** (Default: 2.5)
Your target reward as multiple of risk.
**Use Partial Profit Taking** (Default: ON)
Take profits in stages.
**First TP R:R** (Default: 2.0)
First target as multiple of risk.
**First TP Size %** (Default: 50)
Percentage of position to close at TP1.
**Second TP R:R** (Default: 2.5)
Second target as multiple of risk.
**Second TP Size %** (Default: 40)
Percentage of position to close at TP2.
### Trade Management
**Use Trade Cooldown** (Default: ON)
Prevent overtrading.
**Cooldown Bars** (Default: 6)
Bars to wait after closing a trade.
---
## 🎨 Visual Elements
### Chart Indicators
🟢 **Green Dot** (below bar) = Long entry signal
🔴 **Red Dot** (above bar) = Short entry signal
🔵 **Blue X** (above bar) = Long position closed
🟠 **Orange X** (below bar) = Short position closed
**EMA Line** = Trend direction (green when bullish, red when bearish)
**White Line** = Entry price
**Red Line** = Stop loss level
**Green Lines** = Take profit levels (TP1, TP2, Final)
### Dashboard
When not in real-time mode, a dashboard displays:
- Current position (LONG/SHORT/FLAT)
- Entry price
- Stop loss price
- Take profit price
- R:R ratio
- Current momentum strength
- Total trades
- Win rate
- Net profit %
---
## 📈 Recommended Settings by Timeframe
### 1-Hour Timeframe (Default)
- Momentum Length: 13
- Momentum Threshold: 2.25
- EMA Length: 28
- Stop Loss: 2.2%
- R:R Ratio: 2.5
- Cooldown: 6 bars
### 4-Hour Timeframe
- Momentum Length: 24-36
- Momentum Threshold: 2.5
- EMA Length: 50
- Stop Loss: 3-4%
- R:R Ratio: 2.0-2.5
- Cooldown: 6-8 bars
### 15-Minute Timeframe
- Momentum Length: 8-10
- Momentum Threshold: 2.0
- EMA Length: 20
- Stop Loss: 1.5-2%
- R:R Ratio: 2.0
- Cooldown: 4-6 bars
---
## 🔧 Optimization Tips
### Want More Trades?
- Decrease Momentum Threshold (2.0 instead of 2.25)
- Decrease Momentum Length (10 instead of 13)
- Decrease Cooldown Bars (4 instead of 6)
### Want Higher Quality Trades?
- Increase Momentum Threshold (2.5-3.0)
- Increase Momentum Length (18-24)
- Increase Cooldown Bars (8-10)
### Want Lower Drawdown?
- Increase Cooldown Bars
- Use tighter stop loss
- Enable session filters (trade only high-liquidity sessions)
- Enable Weekend Off
### Want Higher Win Rate?
- Increase R:R Ratio (may reduce total profit)
- Increase Momentum Threshold (fewer but stronger signals)
- Use longer EMA for trend confirmation
---
## 📊 Performance Expectations
Based on typical backtesting results:
- **Win Rate**: 35-45%
- **Profit Factor**: 1.5-2.0
- **Risk:Reward**: 1:2.5 (configurable)
- **Max Drawdown**: 10-20%
- **Trades/Month**: 8-15 (1H timeframe)
**Note:** Win rate may appear low, but with 2.5:1 R:R, you only need ~29% win rate to break even. The strategy aims for quality over quantity.
---
## 🎓 Strategy Logic Explained
### Why Momentum > EMA Crossover?
**EMA Crossover Problems:**
- Signals lag behind price
- Late entries = poor R:R
- Many false signals in ranging markets
**Momentum Advantages:**
- Catches moves as they start accelerating
- Earlier entries = better R:R
- Adapts to volatility via ATR
### Why Partial Profit Taking?
**Without Partial TPs:**
- All-or-nothing approach
- Winners often turn to losers
- High stress watching open positions
**With Partial TPs:**
- Lock in 50% at first target
- Reduce risk to breakeven
- Let remainder ride for bigger gains
- Lower psychological pressure
### Why Trade Cooldown?
**Without Cooldown:**
- Revenge trading after losses
- Overtrading in choppy markets
- Emotional decision-making
**With Cooldown:**
- Forces discipline
- Waits for new setup to develop
- Reduces transaction costs
- Better signal quality
---
## ⚠️ Important Notes
1. **This is a momentum strategy, not an EMA strategy**
The EMA only confirms trend direction. Momentum generates the actual signals.
2. **Backtest thoroughly before live trading**
Past performance ≠ future results. Test on your specific asset and timeframe.
3. **Use proper position sizing**
Risk 1-2% of account per trade maximum. The strategy uses 100% equity by default (adjust in Properties).
4. **Dashboard auto-hides in real-time**
Clean chart for live trading. Visible during backtesting.
5. **Customize for your trading style**
All settings are fully adjustable. No single "best" configuration.
---
## 🚀 Quick Start Guide
1. **Add to Chart**: Apply to your preferred asset and timeframe
2. **Keep Defaults**: Start with default settings
3. **Backtest**: Review historical performance
4. **Paper Trade**: Test with simulated money first
5. **Go Live**: Start small and scale up
---
## 💡 Pro Tips
**Tip 1: Combine Timeframes**
Use higher timeframe (4H) for trend direction, lower timeframe (1H) for entries.
**Tip 2: Avoid News Events**
Major news can cause whipsaws. Consider manual intervention during high-impact events.
**Tip 3: Monitor Momentum Strength**
Dashboard shows momentum in sigma (σ). Values >1.0σ indicate very strong momentum.
**Tip 4: Adjust for Volatility**
In high-volatility markets, increase threshold and stop loss. In quiet markets, decrease them.
**Tip 5: Review Losing Trades**
Check if losses are hitting stop loss or reversing. Adjust stop accordingly.
---
## 📝 Changelog
**v1.0** - Initial Release
- Momentum-based signal generation
- EMA trend filter
- Programmable R:R ratio
- Partial profit taking (3 stages)
- Trade cooldown system
- Session filters (Tokyo/London/New York)
- Weekend off toggle
- Smart dashboard (auto-hides in real-time)
- Clean visual design
---
## 🙏 Credits
Developed by **Hash Capital Research**
If you find this strategy useful, please give it a like and share with others!
---
## ⚖️ Disclaimer
This strategy is for educational purposes only. Trading involves substantial risk of loss and is not suitable for all investors. Past performance is not indicative of future results. Always do your own research and consult with a qualified financial advisor before trading.
---
## 📬 Feedback
Have suggestions or found a bug? Leave a comment below! I'm continuously improving this strategy based on community feedback.
---
**Happy Trading! 🚀📈**

ATR GOD Strategy by TradeSmart (PineConnector-compatible)This is a highly-customizable trading strategy made by TradeSmart, focusing mainly on ATR-based indicators and filters. The strategy is mainly intended for trading forex , and has been optimized using the Deep Backtest feature on the 2018.01.01 - 2023.06.01 interval on the EUR/USD (FXCM) 15M chart, with a Slippage value of 3, and a Commission set to 0.00004 USD per contract. The strategy is also made compatible with PineConnector , to provide an easy option to automate the strategy using a connection to MetaTrader. See tooltips for details on how to set up the bot, and check out our website for a detailed guide with images on how to automate the strategy.
The strategy was implemented using the following logic:
Entry strategy:
A total of 4 Supertrend values can be used to determine the entry logic. There is option to set up all 4 Supertrend parameters individually, as well as their potential to be used as an entry signal/or a trend filter. Long/Short entry signals will be determined based on the selected potential Supertrend entry signals, and filtered based on them being in an uptrend/downtrend (also available for setup). Please use the provided tooltips for each setup to see every detail.
Exit strategy:
4 different types of Stop Losses are available: ATR-based/Candle Low/High Based/Percentage Based/Pip Based. Additionally, Force exiting can also be applied, where there is option to set up 4 custom sessions, and exits will happen after the session has closed.
Parameters of every indicator used in the strategy can be tuned in the strategy settings as follows:
Plot settings:
Plot Signals: true by default, Show all Long and Short signals on the signal candle
Plot SL/TP lines: false by default, Checking this option will result in the TP and SL lines to be plotted on the chart.
Supertrend 1-4:
All the parameters of the Supertrends can be set up here, as well as their individual role in the entry logic.
Exit Strategy:
ATR Based Stop Loss: true by default
ATR Length (of the SL): 100 by default
ATR Smoothing (of the SL): RMA/SMMA by default
Candle Low/High Based Stop Loss: false by default, recent lowest or highest point (depending on long/short position) will be used to calculate stop loss value. Set 'Base Risk Multiplier' to 1 if you would like to use the calculated value as is. Setting it to a different value will count as an additional multiplier.
Candle Lookback (of the SL): 50 by default
Percentage Based Stop Loss: false by default, Set the stop loss to current price - % of current price (long) or price + % of current price (short).
Percentage (of the SL): 0.3 by default
Pip Based Stop Loss: Set the stop loss to current price - x pips (long) or price + x pips (short). Set 'Base Risk Multiplier' to 1 if you would like to use the calculated value as is. Setting it to a different value will count as an additional multiplier.
Pip (of the SL): 10 by default
Base Risk Multiplier: 4.5 by default, the stop loss will be placed at this risk level (meaning in case of ATR SL that the ATR value will be multiplied by this factor and the SL will be placed that value away from the entry level)
Risk to Reward Ratio: 1.5 by default, the take profit level will be placed such as this Risk/Reward ratio is met
Force Exiting:
4 total Force exit on custom session close options: none applied by default. If enabled, trades will close automatically after the set session is closed (on next candle's open).
Base Setups:
Allow Long Entries: true by default
Allow Short Entries: true by default
Order Size: 10 by default
Order Type: Capital Percentage by default, allows adjustment on how the position size is calculated: Cash: only the set cash amount will be used for each trade Contract(s): the adjusted number of contracts will be used for each trade Capital Percentage: a % of the current available capital will be used for each trade
ATR Limiter:
Use ATR Limiter: true by default, Only enter into any position (long/short) if ATR value is higher than the Low Boundary and lower than the High Boundary.
ATR Limiter Length: 50 by default
ATR Limiter Smoothing: RMA/SMMA by default
High Boundary: 1000 by default
Low Boundary: 0.0003 by default
MA based calculation: ATR value under MA by default, If not Unspecified, an MA is calculated with the ATR value as source. Only enter into position (long/short) if ATR value is higher/lower than the MA.
MA Type: RMA/SMMA by default
MA Length: 400 by default
Waddah Attar Filter:
Explosion/Deadzone relation: Not specified by default, Explosion over Deadzone: trades will only happen if the explosion line is over the deadzone line; Explosion under Deadzone: trades will only happen if the explosion line is under the deadzone line; Not specified: the opening of trades will not be based on the relation between the explosion and deadzone lines.
Limit trades based on trends: Not specified by default, Strong Trends: only enter long if the WA bar is colored green (there is an uptrend and the current bar is higher then the previous); only enter short if the WA bar is colored red (there is a downtrend and the current bar is higher then the previous); Soft Trends: only enter long if the WA bar is colored lime (there is an uptrend and the current bar is lower then the previous); only enter short if the WA bar is colored orange (there is a downtrend and the current bar is lower then the previous); All Trends: only enter long if the WA bar is colored green or lime (there is an uptrend); only enter short if the WA bar is colored red or orange (there is a downtrend); Not specified: the color of the WA bar (trend) is not relevant when considering entries.
WA bar value: Not specified by default, Over Explosion and Deadzone: only enter trades when the WA bar value is over the Explosion and Deadzone lines; Not specified: the relation between the explosion/deadzone lines to the value of the WA bar will not be used to filter opening trades.
Sensitivity: 150 by default
Fast MA Type: SMA by default
Fast MA Length: 10 by default
Slow MA Type: SMA
Slow MA Length: 20 by default
Channel MA Type: EMA by default
BB Channel Length: 20 by default
BB Stdev Multiplier: 2 by default
Trend Filter:
Use long trend filter 1: false by default, Only enter long if price is above Long MA.
Show long trend filter 1: false by default, Plot the selected MA on the chart.
TF1 - MA Type: EMA by default
TF1 - MA Length: 120 by default
TF1 - MA Source: close by default
Use short trend filter 1: false by default, Only enter long if price is above Long MA.
Show short trend filter 1: false by default, Plot the selected MA on the chart.
TF2 - MA Type: EMA by default
TF2 - MA Length: 120 by default
TF2 - MA Source: close by default
Volume Filter:
Only enter trades where volume is higher then the volume-based MA: true by default, a set type of MA will be calculated with the volume as source, and set length
MA Type: RMA/SMMA by default
MA Length: 200 by default
Date Range Limiter:
Limit Between Dates: false by default
Start Date: Jan 01 2023 00:00:00 by default
End Date: Jun 24 2023 00:00:00 by default
Session Limiter:
Show session plots: false by default, show market sessions on chart: Sidney (red), Tokyo (orange), London (yellow), New York (green)
Use session limiter: false by default, if enabled, trades will only happen in the ticked sessions below.
Sidney session: false by default, session between: 15:00 - 00:00 (EST)
Tokyo session: false by default, session between: 19:00 - 04:00 (EST)
London session: false by default, session between: 03:00 - 11:00 (EST)
New York session: false by default, session between: 08:00 - 17:00 (EST)
Trading Time:
Limit Trading Time: true by default, tick this together with the options below to enable limiting based on day and time
Valid Trading Days Global: 123567 by default, if the Limit Trading Time is on, trades will only happen on days that are present in this field. If any of the not global Valid Trading Days is used, this field will be neglected. Values represent days: Sunday (1), Monday (2), ..., Friday (6), Saturday(7) To trade on all days use: 123457
(1) Valid Trading Days: false, 123456 by default, values represent days: Sunday (1), Monday (2), ..., Friday (6), Saturday(7) The script will trade on days that are present in this field. Please make sure that this field and also (1) Valid Trading Hours Between is checked
(1) Valid Trading Hours Between: false, 1800-2000 by default, hours between which the trades can happen. The time is always in the exchange's timezone
All other options are also disabled by default
PineConnector Automation:
Use PineConnector Automation: false by default, In order for the connection to MetaTrader to work, you will need do perform prerequisite steps, you can follow our full guide at our website, or refer to the official PineConnector Documentation. To set up PineConnector Automation on the TradingView side, you will need to do the following:
1. Fill out the License ID field with your PineConnector License ID;
2. Fill out the Risk (trading volume) with the desired volume to be traded in each trade (the meaning of this value depends on the EA settings in Metatrader. Follow the detailed guide for additional information);
3. After filling out the fields, you need to enable the 'Use PineConnector Automation' option (check the box in the strategy settings);
4. Check if the chart has updated and you can see the appropriate order comments on your chart;
5. Create an alert with the strategy selected as Condition, and the Message as {{strategy.order.comment}} (should be there by default);
6. Enable the Webhook URL in the Notifications section, set it as the official PineConnector webhook address and enjoy your connection with MetaTrader.
License ID: 60123456789 by default
Risk (trading volume): 1 by default
NOTE! Fine-tuning/re-optimization is highly recommended when using other asset/timeframe combinations.

Close v Open Moving Averages Strategy (Variable) [divonn1994]This is a simple moving average based strategy that works well with a few different coin pairings. It takes the moving average 'opening' price and plots it, then takes the moving average 'closing' price and plots it, and then decides to enter a 'long' position or exit it based on whether the two lines have crossed each other. The reasoning is that it 'enters' a position when the average closing price is increasing. This could indicate upwards momentum in prices in the future. It then exits the position when the average closing price is decreasing. This could indicate downwards momentum in prices in the future. This is only speculative, though, but sometimes it can be a very good indicator/strategy to predict future action.
What I've found is that there are a lot of coins that respond very well when the appropriate combination of: 1) type of moving average is chosen (EMA, SMA, RMA, WMA or VWMA) & 2) number of previous bars averaged (typically 10 - 250 bars) are chosen.
Depending on the coin.. each combination of MA and Number of Bars averaged can have completely different levels of success.
Example of Usage:
An example would be that the VWMA works well for BTCUSD (BitStamp), but it has different successfulness based on the time frame. For the 12 hour bar timeframe, with the 66 bar average with the VWMA I found the most success. The next best successful combo I've found is for the 1 Day bar timeframe with the 35 bar average with the VWMA.. They both have a moving average that records about a month, but each have a different successfulness. Below are a few pair combos I think are noticeable because of the net profit, but there are also have a lot of potential coins with different combos:
It's interesting to see the strategy tester change as you change the settings. The below pairs are just some of the most interesting examples I've found, but there might be other combos I haven't even tried on different coin pairs..
Some strategy settings:
BTCUSD (BitStamp) 12 Hr Timeframe : 66 bars, VWMA=> 10,387x net profit
BTCUSD (BitStamp) 1 Day Timeframe : 35 bars, VWMA=> 7,805x net profit
BNBUSD (Binance) 12 Hr Timeframe : 27 bars, VWMA => 15,484x net profit
ETHUSD (BitStamp) 16 Hr Timeframe : 60 bars, SMA => 5,498x net profit
XRPUSD (BitStamp) 16 Hr Timeframe : 33 bars, SMA => 10,178x net profit
I only chose these coin/combos because of their insane net profit factors. There are far more coins with lower net profits but more reliable trade histories.
Also, usually when I want to see which of these strategies might work for a coin pairing I will check between the different Moving Average types, for example the EMA or the SMA, then I also check between the moving average lengths (the number of bars calculated) to see which is most profitable over time.
Features:
-You can choose your preferred moving average: SMA, EMA, WMA, RMA & VWMA.
-You can also adjust the previous number of calculated bars for each moving average.
-I made the background color Green when you're currently in a long position and Red when not. I made it so you can see when you'd be actively in a trade or not. The Red and Green background colors can be toggled on/off in order to see other indicators more clearly overlayed in the chart, or if you prefer a cleaner look on your charts.
-I also have a plot of the Open moving average and Close moving average together. The Opening moving average is Purple, the Closing moving average is White. White on top is a sign of a potential upswing and purple on top is a sign of a potential downswing. I've made this also able to be toggled on/off.
Please, comment interesting pairs below that you've found for everyone :) thank you!
I will post more pairs with my favorite settings as well. I'll also be considering the quality of the trades.. for example: net profit, total trades, percent profitable, profit factor, trade window and max drawdown.
*if anyone can figure out how to change the date range, I woul really appreciate the help. It confuses me -_- *

Ruckard TradingLatinoThis strategy tries to mimic TradingLatino strategy.
The current implementation is beta.
Si hablas castellano o espanyol por favor consulta MENSAJE EN CASTELLANO más abajo.
It's aimed at BTCUSDT pair and 4h timeframe.
STRATEGY DEFAULT SETTINGS EXPLANATION
max_bars_back=5000 : This is a random number of bars so that the strategy test lasts for one or two years
calc_on_order_fills=false : To wait for the 4h closing is too much. Try to check if it's worth entering a position after closing one. I finally decided not to recheck if it's worth entering after an order is closed. So it is false.
calc_on_every_tick=false
pyramiding=0 : We only want one entry allowed in the same direction. And we don't want the order to scale by error.
initial_capital=1000 : These are 1000 USDT. By using 1% maximum loss per trade and 7% as a default stop loss by using 1000 USDT at 12000 USDT per BTC price you would entry with around 142 USDT which are converted into: 0.010 BTC . The maximum number of decimal for contracts on this BTCUSDT market is 3 decimals. E.g. the minimum might be: 0.001 BTC . So, this minimal 1000 amount ensures us not to entry with less than 0.001 entries which might have happened when using 100 USDT as an initial capital.
slippage=1 : Binance BTCUSDT mintick is: 0.01. Binance slippage: 0.1 % (Let's assume). TV has an integer slippage. It does not have a percentage based slippage. If we assume a 1000 initial capital, the recommended equity is 142 which at 11996 USDT per BTC price means: 0.011 BTC. The 0.1% slippage of: 0.011 BTC would be: 0.000011 . This is way smaller than the mintick. So our slippage is going to be 1. E.g. 1 (slippage) * 0.01 (mintick)
commission_type=strategy.commission.percent and commission_value=0.1 : According to: binance . com / en / fee / schedule in VIP 0 level both maker and taker fees are: 0.1 %.
BACKGROUND
Jaime Merino is a well known Youtuber focused on crypto trading
His channel TradingLatino
features monday to friday videos where he explains his strategy.
JAIME MERINO STANCE ON BOTS
Jaime Merino stance on bots (taken from memory out of a 2020 June video from him):
'~
You know. They can program you a bot and it might work.
But, there are some special situations that the bot would not be able to handle.
And, I, as a human, I would handle it. And the bot wouldn't do it.
~'
My long term target with this strategy script is add as many
special situations as I can to the script
so that it can match Jaime Merino behaviour even in non normal circumstances.
My alternate target is learn Pine script
and enjoy programming with it.
WARNING
This script might be bigger than other TradingView scripts.
However, please, do not be confused because the current status is beta.
This script has not been tested with real money.
This is NOT an official strategy from Jaime Merino.
This is NOT an official strategy from TradingLatino . net .
HOW IT WORKS
It basically uses ADX slope and LazyBear's Squeeze Momentum Indicator
to make its buy and sell decisions.
Fast paced EMA being bigger than slow paced EMA
(on higher timeframe) advices going long.
Fast paced EMA being smaller than slow paced EMA
(on higher timeframe) advices going short.
It finally add many substrats that TradingLatino uses.
SETTINGS
__ SETTINGS - Basics
____ SETTINGS - Basics - ADX
(ADX) Smoothing {14}
(ADX) DI Length {14}
(ADX) key level {23}
____ SETTINGS - Basics - LazyBear Squeeze Momentum
(SQZMOM) BB Length {20}
(SQZMOM) BB MultFactor {2.0}
(SQZMOM) KC Length {20}
(SQZMOM) KC MultFactor {1.5}
(SQZMOM) Use TrueRange (KC) {True}
____ SETTINGS - Basics - EMAs
(EMAS) EMA10 - Length {10}
(EMAS) EMA10 - Source {close}
(EMAS) EMA55 - Length {55}
(EMAS) EMA55 - Source {close}
____ SETTINGS - Volume Profile
Lowest and highest VPoC from last three days
is used to know if an entry has a support
VPVR of last 100 4h bars
is also taken into account
(VP) Use number of bars (not VP timeframe): Uses 'Number of bars {100}' setting instead of 'Volume Profile timeframe' setting for calculating session VPoC
(VP) Show tick difference from current price {False}: BETA . Might be useful for actions some day.
(VP) Number of bars {100}: If 'Use number of bars (not VP timeframe)' is turned on this setting is used to calculate session VPoC.
(VP) Volume Profile timeframe {1 day}: If 'Use number of bars (not VP timeframe)' is turned off this setting is used to calculate session VPoC.
(VP) Row width multiplier {0.6}: Adjust how the extra Volume Profile bars are shown in the chart.
(VP) Resistances prices number of decimal digits : Round Volume Profile bars label numbers so that they don't have so many decimals.
(VP) Number of bars for bottom VPOC {18}: 18 bars equals 3 days in suggested timeframe of 4 hours. It's used to calculate lowest session VPoC from previous three days. It's also used as a top VPOC for sells.
(VP) Ignore VPOC bottom advice on long {False}: If turned on it ignores bottom VPOC (or top VPOC on sells) when evaluating if a buy entry is worth it.
(VP) Number of bars for VPVR VPOC {100}: Number of bars to calculate the VPVR VPoC. We use 100 as Jaime once used. When the price bounces back to the EMA55 it might just bounce to this VPVR VPoC if its price it's lower than the EMA55 (Sells have inverse algorithm).
____ SETTINGS - ADX Slope
ADX Slope
help us to understand if ADX
has a positive slope, negative slope
or it is rather still.
(ADXSLOPE) ADX cut {23}: If ADX value is greater than this cut (23) then ADX has strength
(ADXSLOPE) ADX minimum steepness entry {45}: ADX slope needs to be 45 degrees to be considered as a positive one.
(ADXSLOPE) ADX minimum steepness exit {45}: ADX slope needs to be -45 degrees to be considered as a negative one.
(ADXSLOPE) ADX steepness periods {3}: In order to avoid false detection the slope is calculated along 3 periods.
____ SETTINGS - Next to EMA55
(NEXTEMA55) EMA10 to EMA55 bounce back percentage {80}: EMA10 might bounce back to EMA55 or maybe to 80% of its complete way to EMA55
(NEXTEMA55) Next to EMA55 percentage {15}: How much next to the EMA55 you need to be to consider it's going to bounce back upwards again.
____ SETTINGS - Stop Loss and Take Profit
You can set a default stop loss or a default take profit.
(STOPTAKE) Stop Loss % {7.0}
(STOPTAKE) Take Profit % {2.0}
____ SETTINGS - Trailing Take Profit
You can customize the default trailing take profit values
(TRAILING) Trailing Take Profit (%) {1.0}: Trailing take profit offset in percentage
(TRAILING) Trailing Take Profit Trigger (%) {2.0}: When 2.0% of benefit is reached then activate the trailing take profit.
____ SETTINGS - MAIN TURN ON/OFF OPTIONS
(EMAS) Ignore advice based on emas {false}.
(EMAS) Ignore advice based on emas (On closing long signal) {False}: Ignore advice based on emas but only when deciding to close a buy entry.
(SQZMOM) Ignore advice based on SQZMOM {false}: Ignores advice based on SQZMOM indicator.
(ADXSLOPE) Ignore advice based on ADX positive slope {false}
(ADXSLOPE) Ignore advice based on ADX cut (23) {true}
(STOPTAKE) Take Profit? {false}: Enables simple Take Profit.
(STOPTAKE) Stop Loss? {True}: Enables simple Stop Loss.
(TRAILING) Enable Trailing Take Profit (%) {True}: Enables Trailing Take Profit.
____ SETTINGS - Strategy mode
(STRAT) Type Strategy: 'Long and Short', 'Long Only' or 'Short Only'. Default: 'Long and Short'.
____ SETTINGS - Risk Management
(RISKM) Risk Management Type: 'Safe', 'Somewhat safe compound' or 'Unsafe compound'. ' Safe ': Calculations are always done with the initial capital (1000) in mind. The maximum losses per trade/day/week/month are taken into account. ' Somewhat safe compound ': Calculations are done with initial capital (1000) or a higher capital if it increases. The maximum losses per trade/day/week/month are taken into account. ' Unsafe compound ': In each order all the current capital is gambled and only the default stop loss per order is taken into account. That means that the maximum losses per trade/day/week/month are not taken into account. Default : 'Somewhat safe compound'.
(RISKM) Maximum loss per trade % {1.0}.
(RISKM) Maximum loss per day % {6.0}.
(RISKM) Maximum loss per week % {8.0}.
(RISKM) Maximum loss per month % {10.0}.
____ SETTINGS - Decimals
(DECIMAL) Maximum number of decimal for contracts {3}: How small (3 decimals means 0.001) an entry position might be in your exchange.
EXTRA 1 - PRICE IS IN RANGE indicator
(PRANGE) Print price is in range {False}: Enable a bottom label that indicates if the price is in range or not.
(PRANGE) Price range periods {5}: How many previous periods are used to calculate the medians
(PRANGE) Price range maximum desviation (%) {0.6} ( > 0 ): Maximum positive desviation for range detection
(PRANGE) Price range minimum desviation (%) {0.6} ( > 0 ): Mininum negative desviation for range detection
EXTRA 2 - SQUEEZE MOMENTUM Desviation indicator
(SQZDIVER) Show degrees {False}: Show degrees of each Squeeze Momentum Divergence lines to the x-axis.
(SQZDIVER) Show desviation labels {False}: Whether to show or not desviation labels for the Squeeze Momentum Divergences.
(SQZDIVER) Show desviation lines {False}: Whether to show or not desviation lines for the Squeeze Momentum Divergences.
EXTRA 3 - VOLUME PROFILE indicator
WARNING: This indicator works not on current bar but on previous bar. So in the worst case it might be VP from 4 hours ago. Don't worry, inside the strategy calculus the correct values are used. It's just that I cannot show the most recent one in the chart.
(VP) Print recent profile {False}: Show Volume Profile indicator
(VP) Avoid label price overlaps {False}: Avoid label prices to overlap on the chart.
EXTRA 4 - ZIGNALY SUPPORT
(ZIG) Zignaly Alert Type {Email}: 'Email', 'Webhook'. ' Email ': Prepare alert_message variable content to be compatible with zignaly expected email content format. ' Webhook ': Prepare alert_message variable content to be compatible with zignaly expected json content format.
EXTRA 5 - DEBUG
(DEBUG) Enable debug on order comments {False}: If set to true it prepares the order message to match the alert_message variable. It makes easier to debug what would have been sent by email or webhook on each of the times an order is triggered.
HOW TO USE THIS STRATEGY
BOT MODE: This is the default setting.
PROPER VOLUME PROFILE VIEWING: Click on this strategy settings. Properties tab. Make sure Recalculate 'each time the order was run' is turned off.
NEWBIE USER: (Check PROPER VOLUME PROFILE VIEWING above!) You might want to turn on the 'Print recent profile {False}' setting. Alternatively you can use my alternate realtime study: 'Resistances and supports based on simplified Volume Profile' but, be aware, it might consume one indicator.
ADVANCED USER 1: Turn on the 'Print price is in range {False}' setting and help us to debug this subindicator. Also help us to figure out how to include this value in the strategy.
ADVANCED USER 2: Turn on the all the (SQZDIVER) settings and help us to figure out how to include this value in the strategy.
ADVANCED USER 3: (Check PROPER VOLUME PROFILE VIEWING above!) Turn on the 'Print recent profile {False}' setting and report any problem with it.
JAIME MERINO: Just use the indicator as it comes by default. It should only show BUY signals, SELL signals and their associated closing signals. From time to time you might want to check 'ADVANCED USER 2' instructions to check that there's actually a divergence. Check also 'ADVANCED USER 1' instructions for your amusement.
EXTRA ADVICE
It's advised that you use this strategy in addition to these two other indicators:
* Squeeze Momentum Indicator
* ADX
so that your chart matches as close as possible to TradingLatino chart.
ZIGNALY INTEGRATION
This strategy supports Zignaly email integration by default. It also supports Zignaly Webhook integration.
ZIGNALY INTEGRATION - Email integration example
What you would write in your alert message:
||{{strategy.order.alert_message}}||key=MYSECRETKEY||
ZIGNALY INTEGRATION - Webhook integration example
What you would write in your alert message:
{ {{strategy.order.alert_message}} , "key" : "MYSECRETKEY" }
CREDITS
I have reused and adapted some code from
'Directional Movement Index + ADX & Keylevel Support' study
which it's from TradingView console user.
I have reused and adapted some code from
'3ema' study
which it's from TradingView hunganhnguyen1193 user.
I have reused and adapted some code from
'Squeeze Momentum Indicator ' study
which it's from TradingView LazyBear user.
I have reused and adapted some code from
'Strategy Tester EMA-SMA-RSI-MACD' study
which it's from TradingView fikira user.
I have reused and adapted some code from
'Support Resistance MTF' study
which it's from TradingView LonesomeTheBlue user.
I have reused and adapted some code from
'TF Segmented Linear Regression' study
which it's from TradingView alexgrover user.
I have reused and adapted some code from
"Poor man's volume profile" study
which it's from TradingView IldarAkhmetgaleev user.
FEEDBACK
Please check the strategy source code for more detailed information
where, among others, I explain all of the substrats
and if they are implemented or not.
Q1. Did I understand wrong any of the Jaime substrats (which I have implemented)?
Q2. The strategy yields quite profit when we should long (EMA10 from 1d timeframe is higher than EMA55 from 1d timeframe.
Why the strategy yields much less profit when we should short (EMA10 from 1d timeframe is lower than EMA55 from 1d timeframe)?
Any idea if you need to do something else rather than just reverse what Jaime does when longing?
FREQUENTLY ASKED QUESTIONS
FAQ1. Why are you giving this strategy for free?
TradingLatino and his fellow enthusiasts taught me this strategy. Now I'm giving back to them.
FAQ2. Seriously! Why are you giving this strategy for free?
I'm confident his strategy might be improved a lot. By keeping it to myself I would avoid other people contributions to improve it.
Now that everyone can contribute this is a win-win.
FAQ3. How can I connect this strategy to my Exchange account?
It seems that you can attach alerts to strategies.
You might want to combine it with a paying account which enable Webhook URLs to work.
I don't know how all of this works right now so I cannot give you advice on it.
You will have to do your own research on this subject. But, be careful. Automating trades, if not done properly,
might end on you automating losses.
FAQ4. I have just found that this strategy by default gives more than 3.97% of 'maximum series of losses'. That's unacceptable according to my risk management policy.
You might want to reduce default stop loss setting from 7% to something like 5% till you are ok with the 'maximum series of losses'.
FAQ5. Where can I learn more about your work on this strategy?
Check the source code. You might find unused strategies. Either because there's not a substantial increases on earnings. Or maybe because they have not been implemented yet.
FAQ6. How much leverage is applied in this strategy?
No leverage.
FAQ7. Any difference with original Jaime Merino strategy?
Most of the times Jaime defines an stop loss at the price entry. That's not the case here. The default stop loss is 7% (but, don't be confused it only means losing 1% of your investment thanks to risk management). There's also a trailing take profit that triggers at 2% profit with a 1% trailing.
FAQ8. Why this strategy return is so small?
The strategy should be improved a lot. And, well, backtesting in this platform is not guaranteed to return theoric results comparable to real-life returns. That's why I'm personally forward testing this strategy to verify it.
MENSAJE EN CASTELLANO
En primer lugar se agradece feedback para mejorar la estrategia.
Si eres un usuario avanzado y quieres colaborar en mejorar el script no dudes en comentar abajo.
Ten en cuenta que aunque toda esta descripción tenga que estar en inglés no es obligatorio que el comentario esté en inglés.
CHISTE - CASTELLANO
¡Pero Jaime!
¡400.000!
¡Tu da mun!

Pivot SuperTrend Auto-Opt + WFO + MultiObj + Filter/Diag# Pivot SuperTrend (NetProfit Auto-Optimization) — Summary & Quick Start
## What this strategy is
A self-optimizing **SuperTrend-style** strategy for TradingView Pine v6 that:
- builds a **walk-forward, net-profit optimizer** directly on the chart,
- adapts its trailing stop/entry logic to **market regime** and **volatility**, and
- exposes a **filter/gate suite** so you can dial aggressiveness vs. noise without breaking auto-optimization.
Default tuning: **Bybit ETHUSDT Perpetual, 30m** (works elsewhere once tuned).
---
## Core logic (high level)
### 1) SuperTrend backbone (with Center/Pivots)
- **Center line**: smoothed running pivot from `ta.pivothigh/low`.
- **SuperTrend bands**: `Center ± Factor × ATR(length)` with a carry rule to reduce whipsaws.
- **Trend state**: `+1` above band, `-1` below band.
- **Flip**: trend change; can require **1-bar confirmation**.
### 2) Adaptive smoothing (AMA of ST)
- Performance-weighted **alpha** smooths the trailing stop.
- Alpha clamped to `alpha_min…alpha_max` using optimizer’s fitness.
### 3) On-chart net-profit optimizer (walk-forward)
- Grid of parameters:
- ATR Length `len` (min…max…step)
- ATR Factor `F` (min…max…step)
- Performance memory `A` (min…max…step)
- Each grid point is paper-traded **each bar** including fees/slippage → **fitness = net profit EMA**.
- Every `opt_interval` bars the **best** candidate is activated (with hysteresis).
- Optional: apply only **ATR margin** gate inside the optimizer for speed/stability.
### 4) Regime detection & anti-chop
- Custom **ADX** + **Center slope** to classify **trend** vs **range**.
- Adaptive thresholds in range regime (distance-to-center, ST-near-center block, etc.).
- Optional **ATR fast/slow ratio** gate.
- Other tools: **min bars since flip**, **hold bars after flip**, **distance to center**, **ST near center** block.
### 5) Entry logic
- **Immediate on flip** or **1-bar confirm**.
- Must pass the **Filter Suite** (toggleable gates):
- ATR-margin cross (hard cross or wick reject)
- Trend Regime (require trend)
- Hold-after-flip
- Distance-to-center
- ST-near-center block
- Volatility ratio (ATR fast/slow)
- Min bars since flip (flip cooldown)
- Daily trade cap & post-loss cooldown
- Trading session window
### 6) Starter preset (failsafe)
- Lenient defaults so trades start quickly to build warm-up data; then you can tighten gates.
### 7) Position management
- Strategy entries for “LONG” / “SHORT”.
- Optional **50% take-profit on Center** (“usecenter”).
- **Only-Long** mode supported with separate exit logic if regime turns bearish.
### 8) Risk controls
- **Max trades per day**, **cooldown bars after loss**, **session window**.
- Optional **bar coloring**, **trend shading**, **signal markers**.
- **Diagnostics** labels show which gate blocked an entry (letters `M T H D N V F C CD S`).
### 9) Alerts & Bybit webhook
- Use alert condition: **Any alert() function call**.
- Fires `"LONG_CONFIRMED"` / `"SHORT_CONFIRMED"`.
---
## Inputs overview
- **Pivot / Center**: pivot length; show pivots & center.
- **Visual**: line widths, bar colors, shading; warm-up bars.
- **Execution / Costs**: fee (bps), slippage (bps), “Only long”, 50% center-close.
- **Auto-Optimize**: grids for `len`, `F`, `A`, interval, memory, acceptance floor.
- **Signal Controls**: 1-bar confirm, ATR margin, min bars since flip.
- **Anti-Chop**: distance to center, hold bars, slope len, ST-near-center ATR, ATR slow len & ratio.
- **Trend Regime**: ADX len/threshold, center slope threshold, “require trend”.
- **Risk Gates**: max trades/day, loss cooldown bars.
- **Session**: optional 07:00–22:00 UTC filter.
- **Diagnostics**: show gate diagnostics labels.
- **Filter Suite**: toggle each gate; optional “apply margin to optimizer”.
- **Starter preset** selector.
---
## Plots & UI
- **Adaptive SuperTrend** (active candidate),
- **PP Center** (optional),
- **Trend shading** (price vs ST zone),
- **Entry/Exit markers** (triangles),
- **Diagnostics** text labels (optional).
---
## Webhook notes (Bybit v5)
If you use a direct Bybit webhook:
- **Symbol**: TradingView may emit `ETHUSDT.P`. Bybit wants `ETHUSDT`. Your relay should **strip `.P`**.
- **Side**: TV provides `buy/sell`. Bybit expects `Buy/Sell` → normalize casing in the relay.
- **Reduce-only**: mark exits and partial closes reduce-only to avoid reversals in Hedge mode.
- **Market orders**: pass `"orderType":"Market"`; ignore price or set to `"marketPrice"` if your relay requires it.
**Entry (Market)**
```json
{
"exchange": "BYBIT",
"category": "linear",
"symbol": "{{ticker}}",
"side": "{{strategy.order.action}}",
"orderType": "Market",
"qty": "{{strategy.order.contracts}}",
"reduceOnly": false,
"timestamp": "{{timenow}}",
"clientOrderId": "pst_{{strategy.order.id}}_{{timenow}}"
}

Gabriel's Witcher Strategy [65 Minute Trading Bot]Strategy Description: Gabriel's Witcher Strategy
Author: Gabriel
Platform: TradingView Pine Script (Version 5)
Backtested Asset: Avalanche (Coinbase Brokage for Volume adjustment)
Timeframe: 65 Minutes
Strategy Type: Comprehensive Trend-Following and Momentum Strategy with Scalping and Risk Management Features
Overview
Gabriel's Witcher Strategy is an advanced trading bot designed for the Avalanche pair on a 65-minute timeframe. This strategy integrates a multitude of technical indicators to identify and execute high-probability trading opportunities. By combining trend-following, momentum, volume analysis, and range filtering, the strategy aims to capitalize on both long and short market movements. Additionally, it incorporates scalping mechanisms and robust risk management features, including take-profit (TP) levels and commission considerations, to optimize trade performance and profitability.
====Key Components====
Source Selection:
Custom Source Flexibility: Allows traders to select from a wide range of price and volume sources (e.g., Close, Open, High, Low, HL2, HLC3, OHLC4, VWAP, On-Balance Volume, etc.) for indicator calculations, enhancing adaptability to various trading styles.
Various curves of Volume Analysis are employed:
Tick Volume Calculation: Utilizes tick volume as a fallback when actual volume data is unavailable, ensuring consistency across different data feeds.
Volume Indicators: Incorporates multiple volume-based indicators such as On-Balance Volume (OBV), Accumulation/Distribution (AccDist), Negative Volume Index (NVI), Positive Volume Index (PVI), and Price Volume Trend (PVT) for comprehensive market analysis.
Trend Indicators:
ADX (Average Directional Index): Measures trend strength using either the Classic or Masanakamura method, with customizable length and threshold settings. It's used to open positions when the mesured trend is strong, or exit when its weak.
Jurik Moving Average (JMA): A smooth moving average that reduces lag, configurable with various parameters including source, resolution, and repainting options.
Parabolic SAR: Identifies potential reversals in market trends with adjustable start, increment, and maximum settings.
Custom Trend Indicator: Utilizes highest and lowest price points over a specified timeframe to determine current and previous trend bases, visually represented with color-filled areas.
Momentum Indicators:
Relative Strength Index (RSI): Evaluates the speed and change of price movements, smoothed with a custom length and source. It's used to not enter the market for shorts in oversold or longs for overbought conditions, and to enter for long in oversold or shorts for overboughts.
Momentum-Based Calculations: Employs both Double Exponential Moving Averages (DEMA) on a MACD-based RSI to enhance momentum signal accuracy which is then further accelerated by a Hull MA. This is the technical analysis tool that determines bearish or bullish momentum.
OBV-Based Momentum Conditions: Uses two exponential moving averages of OBV to determine bullish or bearish momentum shifts, anomalities, breakouts where banks flow their funds in or Smart Money Concepts trade.
Moving Averages (MA):
Multiple MA Types: Includes Simple Moving Average (SMA), Exponential Moving Average (EMA), Weighted Moving Average (WMA), Hull Moving Average (HMA), and Volume-Weighted Moving Average (VWMA), selectable via input parameters.
MA Speed Calculation: Measures the percentage change in MA values to determine the direction and speed of the trend.
Range Filtering:
Variance-Based Filter: Utilizes variance and moving averages to filter out trades during low-volatility periods, enhancing trade quality.
Color-Coded Range Indicators: Visualizes range filtering with color changes on the chart for quick assessment.
Scalping Mechanism:
Heikin-Ashi Candles: Optionally uses Heikin-Ashi candles for smoother price action analysis.
EMA-Based Trend Detection: Employs fast, medium, and slow EMAs to determine trend direction and potential entry points.
Fractal-Based Filtering: Detects regular or BW (Black & White) fractals to confirm trade signals.
Take Profit (TP) Management:
Dynamic TP Levels: Calculates TP levels based on the number of consecutive long or short entries, adjusting targets to maximize profits.
TP Signals and Re-Entry: Plots TP signals on the chart and allows for automatic re-entry upon TP hit, maintaining continuous trade flow.
Risk Management:
Commission Integration: Accounts for trading commissions to ensure net profitability.
Position Sizing: Configured to use a percentage of equity for each trade, adjustable via input parameters.
Pyramiding: Allows up to one additional position per direction to enhance gains during strong trends.
Alerts and Visual Indicators:
Buy/Sell Signals: Plots visual indicators (triangles and flags) on the chart to signify entry and TP points.
Bar Coloring: Changes bar colors based on ADX and trend conditions for immediate visual cues.
Price Levels: Marks significant price levels related to TP and position entries with cross styles.
Input Parameters
Source Settings:
Custom Sources (srcinput): Choose from various price and volume sources to tailor indicator calculations.
ADX Settings:
ADX Type (ADX_options): Select between 'CLASSIC' and 'MASANAKAMURA' methods.
ADX Length (ADX_len): Defines the period for ADX calculation.
ADX Threshold (th): Sets the minimum ADX value to consider a strong trend.
RSI Settings:
RSI Length (len_3): Period for RSI calculation.
RSI Source (src_3): Source data for RSI.
Trend Strength Settings:
Channel Length (n1): Period for trend channel calculation.
Average Length (n2): Period for smoothing trend strength.
Jurik Moving Average (JMA) Settings:
JMA Source (inp): Source data for JMA.
JMA Resolution (reso): Timeframe for JMA calculation.
JMA Repainting (rep): Option to allow JMA to repaint.
JMA Length (lengths): Period for JMA.
Parabolic SAR Settings:
SAR Start (start): Initial acceleration factor.
SAR Increment (increment): Acceleration factor increment.
SAR Maximum (maximum): Maximum acceleration factor.
SAR Point Width (width): Visual width of SAR points.
Trend Indicator Settings:
Trend Timeframe (timeframe): Period for trend indicator calculations.
Momentum Settings:
Source Type (srcType): Select between 'Price' and 'VWAP'.
Momentum Source (srcPrice): Source data for momentum calculations.
RSI Length (rsiLen): Period for momentum RSI.
Smooth Length (sLen): Smoothing period for momentum RSI.
OBV Settings:
OBV Line 1 (e1): EMA period for OBV line 1.
OBV Line 2 (e2): EMA period for OBV line 2.
Moving Average (MA) Settings:
MA Length (length): Period for MA calculations.
MA Type (matype): Select MA type (1: SMA, 2: EMA, 3: HMA, 4: WMA, 5: VWMA).
Range Filter Settings:
Range Filter Length (length0): Period for range filtering.
Range Filter Multiplier (mult): Multiplier for range variance.
Take Profit (TP) Settings:
TP Long (tp_long0): Percentage for long TP.
TP Short (tp_short0): Percentage for short TP.
Scalping Settings:
Scalping Activation (ACT_SCLP): Enable or disable scalping.
Scalping Length (HiLoLen): Period for scalping indicators.
Fast EMA Length (fastEMAlength): Period for fast EMA in scalping.
Medium EMA Length (mediumEMAlength): Period for medium EMA in scalping.
Slow EMA Length (slowEMAlength): Period for slow EMA in scalping.
Filter (filterBW): Enable or disable additional fractal filtering.
Pullback Lookback (Lookback): Number of bars for pullback consideration.
Use Heikin-Ashi Candles (UseHAcandles): Option to use Heikin-Ashi candles for smoother trend analysis.
Strategy Logic
Indicator Calculations:
Volume and Source Selection: Determines the primary data source based on user input, ensuring flexibility and adaptability.
ADX Calculation: Computes ADX using either the Classic or Masanakamura method to assess trend strength.
RSI Calculation: Evaluates market momentum using RSI, further smoothed with custom periods.
Trend Strength Assessment: Utilizes trend channel and average lengths to gauge the robustness of current trends.
Jurik Moving Average (JMA): Smooths price data to reduce lag and enhance trend detection.
Parabolic SAR: Identifies potential trend reversals with adjustable parameters for sensitivity.
Momentum Analysis: Combines RSI with DEMA and OBV-based conditions to confirm bullish or bearish momentum.
Moving Averages: Employs multiple MA types to determine trend direction and speed.
Range Filtering: Filters out low-volatility periods to focus on high-probability trades.
Trade Conditions:
Long Entry Conditions:
ADX Confirmation: ADX must be above the threshold, indicating a strong uptrend.
RSI and Momentum: RSI below 70 and positive momentum signals.
JMA and SAR: JMA indicates an uptrend, and Parabolic SAR is below the price.
Trend Indicator: Confirms the current trend direction.
Range Filter: Ensures market is in an upward range.
Scalping Option: If enabled, additional scalping conditions must be met.
Short Entry Conditions:
ADX Confirmation: ADX must be above the threshold, indicating a strong downtrend.
RSI and Momentum: RSI above 30 and negative momentum signals.
JMA and SAR: JMA indicates a downtrend, and Parabolic SAR is above the price.
Trend Indicator: Confirms the current trend direction.
Range Filter: Ensures market is in a downward range.
Scalping Option: If enabled, additional scalping conditions must be met.
Position Management:
Entry Execution: Places long or short orders based on the identified conditions and user-selected position types (Longs, Shorts, or Both).
Take Profit (TP): Automatically sets TP levels based on predefined percentages, adjusting dynamically with consecutive trades.
Re-Entry Mechanism: Allows for automatic re-entry upon TP hit, maintaining active trading positions.
Exit Conditions: Closes positions when TP levels are reached or when opposing trend signals are detected.
Visual Indicators:
Bar Coloring: Highlights bars in green for bullish conditions, red for bearish, and orange for neutral.
Plotting Price Levels: Marks significant price levels related to TP and trade entries with cross symbols.
Signal Shapes: Displays triangle and flag shapes on the chart to indicate trade entries and TP hits.
Alerts:
Custom Alerts: Configured to notify traders of long entries, short entries, and TP hits, enabling timely trade management and execution.
Usage Instructions
Setup:
Apply the Strategy: Add the script to your TradingView chart set to BTCUSDT with a 65-minute timeframe.
Configure Inputs: Adjust the input parameters under their respective groups (e.g., Source Settings, ADX, RSI, Trend Strength, etc.) to match your trading preferences and risk tolerance.
Position Selection:
Choose Position Type: Use the Position input to select Longs, Shorts, or Both based on your market outlook.
Execution: The strategy will automatically execute and manage positions according to the selected type, ensuring targeted trading actions.
Signal Interpretation:
Buy Signals: Blue triangles below the bars indicate potential long entry points.
Sell Signals: Red triangles above the bars indicate potential short entry points.
Take Profit Signals: Flags above or below the bars signify TP hits for long and short positions, respectively.
Bar Colors: Green bars suggest bullish conditions, red bars indicate bearish conditions, and orange bars represent neutral or consolidating markets.
Risk Management:
Default Position Size: Set to 100% of equity. Adjust the default_qty_value as needed for your risk management strategy.
Commission: Accounts for a 0.1% commission per trade. Adjust the commission_value to match your broker's fees.
Pyramiding: Allows up to one additional position per direction to enhance gains during strong trends.
Backtesting and Optimization:
Historical Testing: Utilize TradingView's backtesting features to evaluate the strategy's performance over historical data.
Parameter Tuning: Optimize input parameters to align the strategy with current market dynamics and personal trading objectives.
Alerts Configuration:
Set Up Alerts: Enable and configure alerts based on the predefined alertcondition statements to receive real-time notifications of trade signals and TP hits.
Additional Features
Comprehensive Indicator Integration: Combines multiple technical indicators to provide a holistic view of market conditions, enhancing trade signal accuracy.
Scalping Options: Offers an optional scalping mechanism to capitalize on short-term price movements, increasing trading flexibility.
Dynamic Take Profit Levels: Adjusts TP targets based on the number of consecutive trades, maximizing profit potential during favorable trends.
Advanced Volume Analysis: Utilizes various volume indicators to confirm trend strength and validate trade signals.
Customizable Range Filtering: Filters trades based on market volatility, ensuring trades are taken during optimal conditions.
Heikin-Ashi Candle Support: Optionally uses Heikin-Ashi candles for smoother price action analysis and reduced noise.
====Recommendations====
Thorough Backtesting:
Historical Performance: Before deploying the strategy in a live trading environment, perform comprehensive backtesting to understand its performance under various market conditions. These are the premium settings for Avalanche Coinbase.
Optimization: Regularly review and adjust input parameters to ensure the strategy remains effective amidst changing market volatility and trends. Backtest the strategy for each crypto and make sure you are in the right brokage when using the volume sources as it will affect the overall outcome of the trading strategy.
Risk Management:
Position Sizing: Adjust the default_qty_value to align with your risk tolerance and account size.
Stop-Loss Implementation: Although the strategy includes TP levels, they're also consided to be a stop-loss mechanisms to protect against adverse market movements.
Commission Adjustment: Ensure the commission_value accurately reflects your broker's fees to maintain realistic backtesting results. Generally, 0.1~0.3% are most of the average broker's comission fees.
Slipage: The slip comssion is 1 Tick, since the strategy is adjusted to only enter/exit on bar close where most positions are available.
Continuous Monitoring:
Strategy Performance: Regularly monitor the strategy's performance to ensure it operates as expected and make adjustments as needed. A max-drawndown hit has been added to operate in case the premium Avalanche settings go wrong, but you can turn it off an adjust the equity percentage to 50% if you are confortable with the high volatile max-drown or even 100% if your account allows you to borrow cash.
Customization:
Indicator Parameters: Tailor indicator settings (e.g., ADX length, RSI period, MA types) to better fit your specific trading style and market conditions.
Scalping Options: Enable or disable scalping based on your trading preferences and risk appetite.
Conclusion
Gabriel's Witcher Strategy is a robust and versatile trading solution designed to navigate the complexities of the Crypto market. By integrating a wide array of technical indicators and providing extensive customization options, this strategy empowers traders to execute informed and strategic trades. Its comprehensive approach, combining trend analysis, momentum detection, volume evaluation, and range filtering, ensures that trades are taken during optimal market conditions. Additionally, the inclusion of scalping features and dynamic take-profit management enhances the strategy's adaptability and profitability potential. Unlike any trading strategy, with both diligent testing and continuous monitoring under the strategy tester, it's possible to achieve sustained success by adjusting the settings to the individual Crypto that need it, for example this one is preset for Avalanche Coinbase 65 Miinutes but it can be adjust for BTCUSD or Etherium if you backtest and search for the right settings.

Overnight Gap AnalysisThere is a wide range of opinion on holding positions overnight due to gap risk. So, out of curiosity, I coded this analysis as a strategy to see what the result of only holding a position overnight on an asset would be. The results really surprised me. The script backtests 10+ years, and here are the findings:
Holding a position for 1 hour bar overnight on QQQ since January 2010 results in a 545% return. QQQ's entire return holding through the same period is 643%
The max equity drawdown on holding that position overnight is lower then the buy/hold drawdown on the underlying asset.
It doesn't matter if the last bar of the day is green or red, the results are similar.
It doesn't matter if it is a bull or bear market. Filtering the script to only trade when the price is above the 200-day moving average actually reduces its return from 545% to 301%, though it does also reduce drawdown.
I see similar patterns when applying the script to other index ETFs. Applying it to leveraged index ETFs can end up beating buy/hold of the underlying index.
Since this script holds through the 1st bar of the day, this could also speak to a day-opening price pattern
The default inputs are for the script to be applied to 1 hour charts only that have 7 bars on the chart per day. You can apply it to other chart types, but must follow the instructions below for it to work properly.
What the script is doing :
This script is buying the close of the last bar of the day and closing the trade at the close of the next bar. So, all trades are being held for 1 bar. By default, the script is setup for use on a 1hr chart that has 7 bars per day. If you try to apply it to a different timeframe, you will need to adjust the count of the last bar of the day with the script input. I.e. There are 7 bars per day on an hour chart on US Stocks/ETFs, so the input is set to 7 by default.
Other ways this script can be used :
This script can also test the result of holding a position over any 1 bar in the day using that same input. For instance, on an hour chart you can input 6 on the script input, and it will model buying the close of the 6th bar of the day while selling on the close of the next bar. I used this out of curiosity to model what only holding the last bar of the day would result in. On average, you lose money on the last bar every day.
The irony here is that the root cause of this last bar of the day losing may be people selling their positions at the end of day so that they aren't exposed to overnight gap risk.
Disclaimer: This is not financial advice. Open-source scripts I publish in the community are largely meant to spark ideas that can be used as building blocks for part of a more robust trade management strategy. If you would like to implement a version of any script, I would recommend making significant additions/modifications to the strategy & risk management functions. If you don’t know how to program in Pine, then hire a Pine-coder. We can help!

Aditya Signal 1.1 BankNifty Intra-Day Trading IndicatorThis is non-repainting indicator which can be used for Index, Stocks, Commodities and Bitcoin or any other securities depending upon the various parameter setting of the indicator. This particular strategy is for intra-day Bank Nifty Index which is traded on NSE(India). The same strategy can used for Nifty, Stocks and other indices also by adjusting the inputs.
The detailed description about the indicator is as follows:
Long Period: Period for calculating Primary Signal Line (Yellow).
Long Period Input Source: Input for calculating Primary Signal Line.
Short Period: Period for smoothing the Primary Signal Line.
Short Period MA: Method for smoothing the Primary Signal Line.
No. of ATR Bars: No. of ATR bars for calculating Primary Signal Line.
ATR Multiplier: ATR multiplier for ATR calculation.
Trade Trigger: Value above or below of Primary Signal Line for Long or Short signal. The dotted lines in Green and Red color represents the same.
Bar Crossover Input Source: Current bar input for additional signal confirmation above or below Primary Signal Line.
Bars Above Signal High: No. of bars closing above Secondary Signal Line (Blue)
Bars Below Signal Low: No. of bars closing above Secondary Signal Line (Purple)
No. of bars crossover method uses certain no. of bars for closing above High or Low of the crossover of closing price and the Primary Signal Line in combination with Trade Trigger. The idea behind this design is to avoid fake signal due sudden spike in price. Also, this ensures that price consolidates above High in case of Long signal confirmation and vice-versa. By increasing no. of such bars, we can anticipate, how much time it takes for short-term and long-term trend reversal.
Depending upon the time-frame, just by observing the High and Low of previous crossover of closing price and Primary Signal Line, we will have better understanding of undercurrent of market.
By using different combination of Trade Tigger value and no. of bars above and below, we can anticipate better trend confirmation.
The various combinations of price source of Long Period Input Source and Bar Crossover Input Source, the Short Period MA method shows promising results. Kindly PM me for these optimum settings for other financial instruments.
It always better to book partial profit after getting into the trade which increases the odds. The default trade quantity is 2. We book 1 quantity after our partial profit target is reached and let the remaining quantity be in the trade until the reversal of trend. By enabling or disabling the same we can determine the profit or loss from historical trade from when the trade quantity is 1. Just remember to change the default quantity to 1 in Order Size from properties when you disable the Take Partial Profit option.
Take Partial Profit: Whether to book partial or not as explained above.
Partial Profit Points: It always better to book partial profit after trend getting into the trade. The default trade quantity is 2. We book 1 quantity after our partial profit target is hit and let the remaining quantity in the trade until the reversal of trend.
Instrument Type: We can select the which instrument for analysis. By adjusting the Take Partial Profit value by selecting Other Option, you can analyze instrument of your choice other than mentioned in the list for Partial Profit depending upon stock tick value and lot quantity or you can PM me. I have adjusted value for Crude Oil and Silver for MCX(India) future contract values.
This is a premium indicator so send me a private message for 15 days free trial.
"Use the link below to obtain access to this indicator."
Disclaimer: This script/strategy is for educational purpose and individual use only. The author of this script/strategy will not accept any liability for loss or damage as a result of reliance on the information contained in the charts. Please be fully informed regarding the risks and costs associated with trading the financial markets.
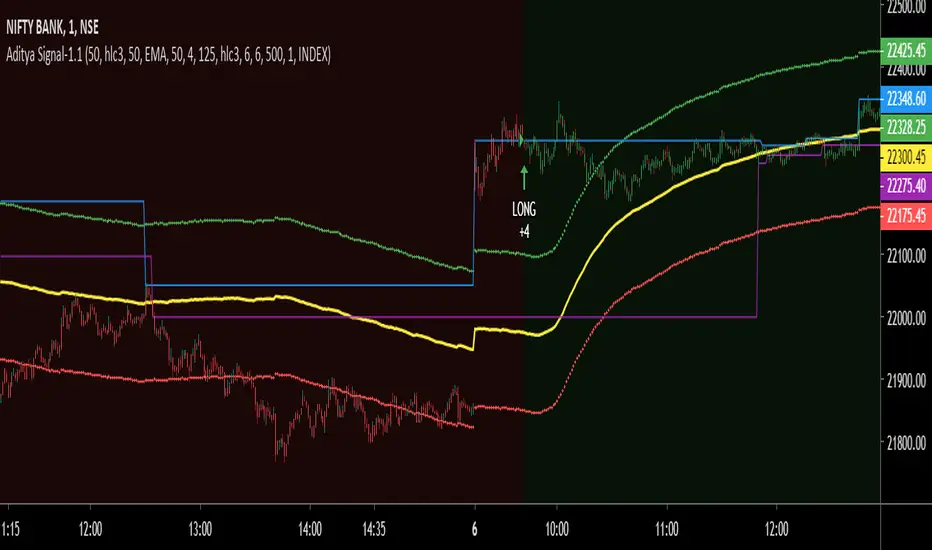
Aditya Signal-1.1 for Nifty and Bank NiftyThis is non-repainting indicator which can be used for Index, Stocks, Commodities and Bitcoin or any other securities depending upon the various parameter setting of the indicator. This particular strategy is for Nifty-50 Index which is traded on NSE(India).
The detailed description about the indicator is as follows:
Long Period: Period for calculating Primary Signal Line (Yellow).
Long Period Input Source: Input for calculating Primary Signal Line.
Short Period: Period for smoothing the Primary Signal Line.
Short Period MA: Method for smoothing the Primary Signal Line.
No. of ATR Bars: No. of ATR bars for calculating Primary Signal Line.
ATR Multiplier: ATR multiplier for ATR calculation.
Trade Trigger: Value above or below of Primary Signal Line for Long or Short signal. The dotted lines in Green and Red color represents the same.
Bar Crossover Input Source: Current bar input for additional signal confirmation above Primary Signal Line.
Bars Above Signal High: No. of bars closing above Secondary Signal Line (Blue)
Bars Below Signal Low: No. of bars closing above Secondary Signal Line (Purple)
No. of bars crossover method uses certain no. of bars for closing above High or Low of the crossover of closing price and the Primary Signal Line in combination with Trade Trigger. The idea behind this design is to avoid fake signal due sudden spike in price. Also, this ensures that price consolidates above High in case of Long signal confirmation and vice-versa. By increasing no. of such bars, we can anticipate, how much time it takes for short-term and long-term trend reversal.
Depending upon the time-frame, just by observing the High and Low of previous crossover of closing price and Primary Signal Line, we will have better understanding of undercurrent of market.
By using different combination of Trade Tigger value and no. of bars above and below, we can anticipate better trend confirmation.
The various combinations of price source of Long Period Input Source and Bar Crossover Input Source, the Short Period MA method shows promising results. Kindly PM me for these optimum settings for other financial instruments.
It always better to book partial profit after getting into the trade which increases the odds. The default trade quantity is 2. We book 1 quantity after our partial profit target is reached and let the remaining quantity be in the trade until the reversal of trend. By enabling or disabling the same we can determine the profit or loss from historical trade from when the trade quantity is 1. Just remember to change the default quantity to 1 in Order Size from properties when you disable the Take Partial Profit option.
Take Partial Profit: Whether to book partial or not as explained above.
Partial Profit Points: It always better to book partial profit after trend getting into the trade. The default trade quantity is 2. We book 1 quantity after our partial profit target is hit and let the remaining quantity in the trade until the reversal of trend.
Instrument Type: We can select the which instrument for analysis. By adjusting the Take Partial Profit value by selecting Other Option, you can analyze instrument of your choice other than mentioned in the list for Partial Profit depending upon stock tick value and lot quantity or you can PM me. I have adjusted value for Crude Oil and Silver for MCX(India) future contract values.
This is a premium indicator so send me a private message for 15 days free trial.
"Use the link below to obtain access to this indicator."
Disclaimer: This script/strategy is for educational purpose and individual use only. The author of this script/strategy will not accept any liability for loss or damage as a result of reliance on the information contained in the charts. Please be fully informed regarding the risks and costs associated with trading the financial markets.

Pressure Pivots - MPI (Strategy)⇋ PRESSURE PIVOTS — MARKET PRESSURE INDEX STRATEGY
A comprehensive reversal trading system that combines order flow pressure analysis, multi-factor confluence detection, and adaptive machine learning to identify high-probability turning points in liquid markets.
━━━━━━━━━━━━━━━━━━━━━━━━━━━━━━━━━━━━━
CORE INNOVATION: MARKET PRESSURE INDEX (MPI)
Traditional indicators measure price movement. The Market Pressure Index measures the force behind the movement.
How MPI Works:
Every bar tells two stories through volume distribution:
• Buy Pressure: Volume × (Close - Low) / (High - Low)
• Sell Pressure: Volume × (High - Close) / (High - Low)
• Net Pressure: Buy Pressure - Sell Pressure
This raw pressure is then normalized against baseline activity to create the bounded MPI (-1.0 to +1.0):
• Smooth Pressure: EMA(Net Pressure, period)
• Baseline Activity: SMA(|Net Pressure|, period × 2)
• MPI: (Smooth Pressure / Baseline) × Sensitivity
What MPI Reveals:
MPI > +0.7: Extreme buy pressure → Exhaustion potential
MPI = +0.2 to +0.7: Healthy bullish momentum
MPI = -0.2 to +0.2: Neutral/balanced pressure
MPI = -0.7 to -0.2: Healthy bearish momentum
MPI < -0.7: Extreme sell pressure → Exhaustion potential
Why It Works:
Two bars can both move 10 points, but if one closes at the high on high volume (aggressive buying) and the other closes mid-range on average volume (weak buying), only MPI distinguishes between sustainable momentum and exhaustion. This volume-weighted pressure analysis reveals conviction behind price moves—the key to timing reversals.
━━━━━━━━━━━━━━━━━━━━━━━━━━━━━━━━━━━━━
SEVEN-FACTOR CONFLUENCE SYSTEM
MPI extremes alone aren't enough. The system requires multiple independent confirmations through weighted scoring:
1. DIVERGENCE (Weight: 3.0) — Premium Signal Type: DIV
Price makes new high but MPI makes lower high (or inverse for bullish)
• Detection: Tracks pivots with 5-bar lookback, compares price vs MPI at pivot points
• Signal: Purple triangles, highest weight (pressure weakening while price extends)
2. LIQUIDITY SWEEP (Weight: 2.5) — Premium Signal Type: LIQ
Price breaks swing high/low within 0.3 ATR then reverses
• Detection: Break within tolerance + close back through level
• Signal: Orange triangles, second-highest weight (stop hunt reversal)
3. ORDER FLOW IMBALANCE (Weight: 2.0) — Premium Signal Type: OF
Aggressive buying/selling 50% above normal
• Detection: EMA(aggressive volume) vs SMA(imbalance) threshold
• Signal: Aqua triangles, institutional positioning
4. VELOCITY EXHAUSTION (Weight: 1.5)
Parabolic move (2+ ATRs in 3 bars) + extreme MPI
• Detection: |3-bar price change / ATR| > threshold + MPI > ±0.5
• Indicates: Momentum deceleration, blow-off top/bottom
5. WICK REJECTION (Weight: 1.5)
Single bar: wick > 60% of range, or sequence: 2 bars with 40% + 30% wicks
• Detection: Shooting stars (bearish) or hammers (bullish)
• Indicates: Intrabar rejection, battle won by opposing side
6. VOLUME SPIKE (Weight: 1.0)
Volume > 20-bar average × multiplier (default: 2.0x)
• Detection: Participation surge confirmation
• Lowest weight: Can be manipulated, better as confirmation
7. POSITION FACTOR (Weight: 1.0)
At 10-bar highest (bearish) or lowest (bullish)
• Detection: Structural positioning for reversal
• Base requirement: Must be at extreme to score
Scoring Logic:
Premium Signals (DIV/LIQ/OF): Must score ≥6.0 (default premiumThreshold)
Standard Signals (STD): Must score ≥4.0 (default standardThreshold)
Example Scoring:
Divergence (3.0) + Liquidity Sweep (2.5) + Volume (1.0) = 6.5 → FIRES (DIV signal)
Recent High (1.0) + Wick (1.5) + Volume (1.0) + Velocity (1.5) = 5.0 → FIRES (STD signal)
━━━━━━━━━━━━━━━━━━━━━━━━━━━━━━━━━━━━━
ADAPTIVE LEARNING ENGINE
Unlike static strategies, this system learns from every trade and optimizes itself.
Performance Tracking:
Every trade records:
• Entry Score: Confluence level at entry
• Signal Type: DIV / LIQ / OF / STD
• Win/Loss: Boolean outcome
• R-Multiple: (Exit - Entry) / (Entry - Stop)
• MAE: Maximum Adverse Excursion (worst drawdown)
• MFE: Maximum Favorable Excursion (best profit reached)
Three Adaptive Parameters:
1. Signal Threshold Adaptation
If Win Rate < Target (45%): RAISE threshold → fewer signals, better quality
If Win Rate > Target + 10% AND good R: LOWER threshold → more signals, profitable
2. Stop Distance Adaptation
If Avg MAE > 0.85 AND WR < 50%: WIDEN stops → reduce premature exits
If Avg MAE < 0.4 AND WR > 55%: TIGHTEN stops → reduce risk
3. Target Distance Adaptation
If Avg MFE > Target × 1.5: EXTEND targets → capture more of runners
If Avg MFE < Target × 0.7: SHORTEN targets → take profits faster
Signal Type Filtering:
The system tracks performance by type (DIV/LIQ/OF/STD):
• If Type WR < 40% AND Avg R < 0.8: Type DISABLED
• If Type WR ≥ 40% OR Avg R ≥ 0.8: Type RE-ENABLED
Example: If OF signals consistently lose while DIV signals win, system automatically stops taking OF signals and focuses on DIV.
Warmup Period:
First 30 trades (default) gather baseline data with relaxed thresholds. After warmup, full adaptation activates.
━━━━━━━━━━━━━━━━━━━━━━━━━━━━━━━━━━━━━
COMPLETE POSITION MANAGEMENT
Dynamic Position Sizing:
Base Contracts = (Equity × Risk%) / (Stop Distance × Point Value)
Then multiplied by:
• Score Bonus: Up to +50% for highest-scoring signals
• Signal Type Bonus: DIV signals +50%, LIQ signals +30%
• Streak Multiplier: After 3 losses: 50% reduction, After 3 wins: 25% increase
Example: High-scoring DIV signal on winning streak = 3-4× larger position than weak STD signal on losing streak
Entry Modes:
Single Entry: Full size at once, exit at TP2 (or partial at TP1)
Tiered Entry: 40% at TP1 (2R), 60% at TP2 (4R adaptive)
Stop Management (3 Modes):
Structural: Beyond recent 20-bar swing high/low + buffer
ATR: Fixed ATR multiplier (default: 2.0 ATR, then adapts)
Hybrid: Attempt structural, fallback to ATR if invalid
Plus:
• Breakeven: Move stop to entry ± 1 tick when 1R reached
• Trailing: Activate when 1.5R reached, trail 0.8R behind price
• Max Loss Override: Cap dollar risk regardless of calculation
Target Management:
Fixed Mode: TP1 = 2R, TP2 = 4R
Adaptive Mode: TP1 = 2R fixed, TP2 adapts based on MFE analysis
Partial Exits: Default 50% at TP1, remainder at TP2 or trailing stop
━━━━━━━━━━━━━━━━━━━━━━━━━━━━━━━━━━━━━
COMPREHENSIVE RISK CONTROLS
Daily Limits:
• Max Daily Loss: $2,000 default → HALT trading
• Max Daily Trades: 15 default → prevent overtrading
• Max Concurrent: 2 positions → limit correlation risk
Session Controls:
• Trading Hours: Specify start/end times + timezone
• Weekend Block: Optional (avoid crypto weekend volatility)
Prop Firm Protection (Live Trading Only):
• Daily Loss Limit: Stricter of general or prop limit ($1,000 default)
• Trailing Drawdown: Tracks high water mark, HALTS if breach ($2,500 default)
• Reset on Reload: Optional high water mark reset
Liquidity Filter (Optional):
• Time-Based: Avoid first/last X minutes of session
• Volume-Based: Require minimum volume ratio (0.5× average default)
Market Regime Filter (Optional):
• ADX-Based: Only trade when ADX > threshold (trending)
• Block: Consolidation (ADX < 20) or Transitional regimes
━━━━━━━━━━━━━━━━━━━━━━━━━━━━━━━━━━━━━
REAL-TIME DASHBOARD
MPI Gauge Section:
Shows current pressure: 🟢 STRONG BUY (+0.5 to +1.0), 🟩 BUY PRESSURE (+0.2 to +0.5), ⚪ NEUTRAL (-0.2 to +0.2), 🟥 SELL PRESSURE (-0.5 to -0.2), 🔴 STRONG SELL (-1.0 to -0.5)
Signal Status Section:
• Active Signals: "🔴 DIV SELL" (purple background), "🟢 LIQ BUY" (orange), "🔵 OF SELL" (aqua), "🟢 STD BUY" (green)
• Warnings: "⚠️ BEAR WARNING" / "⚠️ BULL WARNING" (yellow) — setup forming, not full signal
• Scanning: "⏳ SCANNING..." (gray) — no signal active
• Confidence Bar: Visual score display "██████░░░░" showing confluence strength
Divergence Indicator:
"🟣 BEARISH DIVERGENCE" or "🟡 BULLISH DIVERGENCE" when detected
Performance Statistics:
• Overall Win Rate: Wins/Total with visual bar (lime ≥70%, yellow 50-70%, red <50%)
• Directional: Bearish vs Bullish win rates separately
• By Signal Type: DIV / LIQ / OF / STD individual performance tracking
━━━━━━━━━━━━━━━━━━━━━━━━━━━━━━━━━━━━━
KEY PARAMETERS EXPLAINED
🎯 Pressure Engine:
• MPI Period (5-50, default: 14): Smoothing period — lower for scalping, higher for position trading
• MPI Sensitivity (0.5-5.0, default: 1.5): Amplification — lower compresses range, higher more extremes
🔍 Detection:
• Wick Threshold (0.3-0.9, default: 0.6): Minimum wick-to-range ratio for rejection
• Volume Spike (1.2-3.0x, default: 2.0): Multiplier above average for spike
• Aggressive Ratio (0.5-0.9, default: 0.65): Close position in range for aggressive orders
• Velocity Threshold (1.0-5.0 ATR, default: 2.0): ATR-normalized move for exhaustion
• MPI Extreme (0.5-0.95, default: 0.7): Level considered overbought/oversold
⚖️ Weights:
• Divergence: 3.0 (highest — pressure weakening)
• Liquidity: 2.5 (second — stop hunts)
• Order Flow: 2.0 (institutional positioning)
• Velocity: 1.5 (momentum exhaustion)
• Wick: 1.5 (rejection patterns)
• Volume: 1.0 (lowest — can be manipulated)
🎚️ Thresholds:
• Premium (4.0-15.0, default: 6.0): Score for DIV/LIQ/OF signals
• Standard (2.0-8.0, default: 4.0): Score for STD signals
• Warning Confluence (1-4, default: 2): Factors for yellow diamond warnings
🧬 Adaptive:
• Enable (true/false, default: true): Master learning switch
• Warmup Trades (5-100, default: 30): Data collection before adaptation
• Lookback (20-200, default: 50): Recent trades for performance calculation
• Adapt Speed (0.05-0.50, default: 0.15): Parameter adjustment rate
• Target Win Rate (30-70%, default: 45%): Optimization goal
• Target R-Multiple (0.5-5.0, default: 1.5): Risk/reward goal
💼 Position:
• Base Risk (0.1-10.0%, default: 1.5%): Equity risked per trade
• Max Contracts (1-100, default: 10): Hard position limit
• DIV Bonus (1.0-3.0x, default: 1.5): Size multiplier for divergence signals
• LIQ Bonus (1.0-3.0x, default: 1.3): Size multiplier for liquidity signals
🛡️ Stops:
• Mode (Structural/ATR/Hybrid, default: ATR): Stop placement method
• ATR Multiplier (0.5-5.0, default: 2.0): Stop distance in ATRs (adapts)
• Breakeven at (0.3-3.0R, default: 1.0R): When to move stop to entry
• Trail Trigger (0.5-5.0R, default: 1.5R): When to activate trailing
• Trail Offset (0.3-3.0R, default: 0.8R): Distance behind price
🎯 Targets:
• Mode (Fixed/Adaptive, default: Fixed): Target placement method
• TP1 (0.5-10.0R, default: 2.0R): First target for partial exit
• TP2 (1.0-15.0R, default: 4.0R): Final target (adapts in adaptive mode)
• Partial % (0-100%, default: 50%): Position percentage to exit at TP1
━━━━━━━━━━━━━━━━━━━━━━━━━━━━━━━━━━━━━
PROFESSIONAL USAGE PROTOCOL
Phase 1: Paper Trading (Weeks 1-4)
• Setup: Default settings, all adaptive features ON, 0.5% base risk
• Goal: 30+ trades for warmup, observe MPI behavior and signal frequency
• Adjust: MPI sensitivity if stuck near neutral or always at extremes
• Threshold: Raise/lower if too many/few signals
Phase 2: Micro Live (Weeks 5-8)
• Requirements: WR >43%, at least one type >55%, Avg R >0.8
• Setup: 10-25% intended size, 0.5-1.0% risk, 1 position max
• Focus: Execution quality, match dashboard performance
• Journal: Screenshot every signal, track outcomes
Phase 3: Full Scale (Month 3+)
• Requirements: WR >45% over 50+ trades, Avg R >1.2, drawdown <15%
• Progression: Months 3-4 (1.0-1.5% risk), 5-6 (1.5-2.0%), 7+ (1.5-2.5%)
• Maintenance: Weekly dashboard review, monthly deep analysis
• Warnings: Reduce size if WR drops >10%, consecutive losses >7, or drawdown >20%
━━━━━━━━━━━━━━━━━━━━━━━━━━━━━━━━━━━━━
DEVELOPMENT INSIGHTS
The Pressure Insight: Emerged from analyzing intrabar volume distribution. Within every candlestick, volume accumulates at different price levels. MPI deconstructs this to reveal conviction behind moves.
The Confluence Challenge: Early versions using MPI extremes alone achieved only 42% win rate. The seven-factor confluence system emerged from testing which combinations produced reliable reversals. Divergence + liquidity sweep became the strongest setup (68% win rate in isolation).
The Adaptive Breakthrough: Per-signal-type performance tracking revealed DIV signals winning at 71% while OF signals languished at 38%. Adaptive filtering disabled weak types automatically, recovering win rate from 39% to 54% during the 2022 volatility spike.
The Position Sizing Revelation: Dynamic sizing based on signal quality and recent performance increased Sharpe ratio from 1.2 to 1.9 while decreasing max drawdown from 18% to 12% over 500 trades. Bigger positions on better signals = geometric edge amplification.
The Risk Control Lesson: Testing with $50K accounts revealed catastrophic failure modes: daily loss cascades, overtrading commission bleed, weekend gap blowouts. Multi-layer controls (daily limits, concurrent caps, prop firm protection) became essential.
━━━━━━━━━━━━━━━━━━━━━━━━━━━━━━━━━━━━━
LIMITATIONS & ASSUMPTIONS
What This Is NOT:
• NOT a Holy Grail: Typical performance 52-58% WR, 1.3-1.8 avg R, probabilistic edge
• NOT Predictive: Identifies high-probability conditions, doesn't forecast prices
• NOT Market-Agnostic: Best on liquid auction-driven markets (futures, forex, major crypto)
• NOT Hands-Off: Requires oversight for news events, gaps, system anomalies
• NOT Immune to Regime Changes: Adaptive engine helps but cannot predict black swans
Critical Assumptions:
1. Volume reflects intent (valid for regulated markets, violated by wash trading)
2. Pressure extremes mean-revert (true in ranging/exhaustion, fails in paradigm shifts)
3. Stop hunts exist (valid in liquid markets, less in thin/random walk periods)
4. Past patterns persist (valid in stable regimes, fails when structure fundamentally changes)
Works Best On: Major futures (ES, NQ, CL), liquid forex pairs (EUR/USD, GBP/USD), large-cap stocks, BTC
Performs Poorly On: Low-volume stocks, illiquid crypto pairs, news-driven headline events
━━━━━━━━━━━━━━━━━━━━━━━━━━━━━━━━━━━━━
RISK DISCLOSURE
Trading futures, forex, and leveraged instruments involves substantial risk of loss and is not suitable for all investors. Past performance is not indicative of future results. This strategy is provided for educational purposes only and should not be construed as financial advice.
The adaptive engine learns from historical data—there is no guarantee that past relationships will persist. Market conditions change, volatility regimes shift, and black swan events occur. No strategy can eliminate the risk of loss.
Users must validate performance on their specific instruments and timeframes before risking capital. The developer makes no warranties regarding profitability or suitability. Users assume all responsibility for trading decisions and outcomes.
"The market doesn't care about your indicators. It only cares about pressure—who's willing to pay more, who's desperate to sell. Find the exhaustion. Trade the reversal. Let the system learn the rest."
Taking you to school. — Dskyz, Trade with insight. Trade with anticipation.

J12Matic Builder by galgoomA flexible Renko/tick strategy that lets you choose between two entry engines (Multi-Source 3-way or QBand+Moneyball), with a unified trailing/TP exit engine, NY-time trading windows with auto-flatten, daily profit/loss and trade-count limits (HALT mode), and clean webhook routing using {{strategy.order.alert_message}}.
Highlights
Two entry engines
Multi-Source (3): up to three long/short sources with Single / Dual / Triple logic and optional lookback.
QBand + Moneyball: Gate → Trigger workflow with timing windows, OR/AND trigger modes, per-window caps, optional same-bar fire.
Unified exit engine: Trailing by Bricks or Ticks, plus optional static TP/SL.
Session control (NY time): Evening / Overnight / NY Session windows; auto-flatten at end of any enabled window.
Day controls: Profit/Loss (USD) and Trade-count limits. When hit, strategy HALTS new entries, shows an on-chart label/background.
Alert routing designed for webhooks: Every order sets alert_message= so you can run alerts with:
Condition: this strategy
Notify on: Order fills only
Message: {{strategy.order.alert_message}}
Default JSONs or Custom payloads: If a Custom field is blank, a sensible default JSON is sent. Fill a field to override.
How to set up alerts (the 15-second version)
Create a TradingView alert with this strategy as Condition.
Notify on: Order fills only.
Message: {{strategy.order.alert_message}} (exactly).
If you want your own payloads, paste them into Inputs → 08) Custom Alert Payloads.
Leave blank → the strategy sends a default JSON.
Fill in → your text is sent as-is.
Note: Anything you type into the alert dialog’s Message box is ignored except the {{strategy.order.alert_message}} token, which forwards the payload supplied by the strategy at order time.
Publishing notes / best practices
Renko users: Make sure “Renko Brick Size” in Inputs matches your chart’s brick size exactly.
Ticks vs Bricks: Exit distances switch instantly when you toggle Exit Units.
Same-bar flips: If enabled, a new opposite signal will first close the open trade (with its exit payload), then enter the new side.
HALT mode: When day profit/loss limit or trade-count limit triggers, new entries are blocked for the rest of the session day. You’ll see a label and a soft background tint.
Session end flatten: Auto-closes positions at window ends; these exits use the “End of Session Window Exit” payload.
Bar magnifier: Strategy is configured for on-close execution; you can enable Bar Magnifier in Properties if needed.
Default JSONs (used when a Custom field is empty)
Open: {"event":"open","side":"long|short","symbol":""}
Close: {"event":"close","side":"long|short|flat","reason":"tp|sl|flip|session|limit_profit|limit_loss","symbol":""}
You can paste any text/JSON into the Custom fields; it will be forwarded as-is when that event occurs.
Input sections — user guide
01) Entries & Signals
Entry Logic: Choose Multi-Source (3) or QBand + Moneyball (pick one).
Enable Long/Short Signals: Master on/off switches for entering long/short.
Flip on opposite signal: If enabled, a new opposite signal will close the current position first, then open the other side.
Signal Logic (Multi-Source):
Single: any 1 of the 3 sources > 0
Dual: Source1 AND Source2 > 0
Triple (default): 1 AND 2 AND 3 > 0
Long/Short Signal Sources 1–3: Provide up to three series (often indicators). A positive value (> 0) is treated as a “pulse”.
Use Lookback: Keeps a source “true” for N bars after it pulses (helps catch late triggers).
Long/Short Lookback (bars): How many bars to remember that pulse.
01b) QBands + Moneyball (Gate -> Trigger)
Allow same-bar Gate->Trigger: If ON, a trigger can fire on the same bar as the gate pulse.
Trigger must fire within N bars after Gate: Size of the gate window (in bars).
Max signals per window (0 = unlimited): Cap the number of entries allowed while a gate window is open.
Buy/Sell Source 1 – Gate: Gate pulse sources that open the buy/sell window (often a regime/zone, e.g., QBands bull/bear).
Trigger Pulse Mode (Buy/Sell): How to detect a trigger pulse from the trigger sources (Change / Appear / Rise>0 / Fall<0).
Trigger A/B sources + Extend Bars: Primary/secondary triggers plus optional extension to persist their pulse for N bars.
Trigger Mode: Pick S2 only, S3 only, S2 OR S3, or S2 AND S3. AND mode remembers both pulses inside the window before firing.
02) Exit Units (Trailing/TP)
Exit Units: Choose Bricks (Renko) or Ticks. All distances below switch accordingly.
03) Tick-based Trailing / Stops (active when Exit Units = Ticks)
Initial SL (ticks): Starting stop distance from entry.
Start Trailing After (ticks): Start trailing once price moves this far in your favor.
Trailing Distance (ticks): Offset of the trailing stop from peak/trough once trailing begins.
Take Profit (ticks): Optional static TP distance.
Stop Loss (ticks): Optional static SL distance (overrides trailing if enabled).
04) Brick-based Trailing / Stops (active when Exit Units = Bricks)
Renko Brick Size: Must match your chart’s brick size.
Initial SL / Start Trailing After / Trailing Distance (bricks): Same definitions as tick mode, measured in bricks.
Take Profit / Stop Loss (bricks): Optional static distances.
05) TP / SL Switch
Enable Static Take Profit: If ON, closes the trade at the fixed TP distance.
Enable Static Stop Loss (Overrides Trailing): If ON, trailing is disabled and a fixed SL is used.
06) Trading Windows (NY time)
Use Trading Windows: Master toggle for all windows.
Evening / Overnight / NY Session: Define each session in NY time.
Flatten at End of : Auto-close any open position when a window ends (sends the Session Exit payload).
07) Day Controls & Limits
Enable Profit Limits / Profit Limit (Dollars): When daily net PnL ≥ limit → auto-flatten and HALT.
Enable Loss Limits / Loss Limit (Dollars): When daily net PnL ≤ −limit → auto-flatten and HALT.
Enable Trade Count Limits / Number of Trades Allowed: After N entries, HALT new entries (does not auto-flatten).
On-chart HUD: A label and soft background tint appear when HALTED; a compact status table shows Day PnL, trade count, and mode.
08) Custom Alert Payloads (used as strategy.order.alert_message)
Long/Short Entry: Payload sent on entries (if blank, a default open JSON is sent).
Regular Long/Short Exit: Payload sent on closes from SL/TP/flip (if blank, a default close JSON is sent).
End of Session Window Exit: Payload sent when any enabled window ends and positions are flattened.
Profit/Loss/Trade Limit Close: Payload sent when daily profit/loss limit causes auto-flatten.
Tip: Any tokens you include here are forwarded “as is”. If your downstream expects variables, do the substitution on the receiver side.
Known limitations
No bracket orders from Pine: This strategy doesn’t create OCO/attached brackets on the broker; it simulates exits with strategy logic and forwards your payloads for external automation.
alert_message is per order only: Alerts fire on order events. General status pings aren’t sent unless you wire a separate indicator/alert.
Renko specifics: Backtests on synthetic Renko can differ from live execution. Always forward-test on your instrument and settings.
Quick checklist before you publish
✅ Brick size in Inputs matches your Renko chart
✅ Exit Units set to Bricks or Ticks as you intend
✅ Day limits/Windows toggled as you want
✅ Custom payloads filled (or leave blank to use defaults)
✅ Your alert uses Order fills only + {{strategy.order.alert_message}}

PowerX by jwitt98This strategy attempts to replicate the PowerX strategy as described in the book by by Markus Heitkoetter
Three indicators are used:
RSI (7) - An RSI above 50 indicates and uptrend. An RSI below 50 indicates a downtrend.
Slow Stochastics (14, 3, 3) - A %K above 50 indicates an uptrend. A %K below 50 indicates a downtrend.
MACD (12, 26, 9) - A MACD above the signal line indicates an uptrend. A MACD below the signal line indicates a downtrend
In addition, multiples of ADR (7) is used for setting the stops and profit targets
Setup:
When all 3 indicators are indicating an uptrend, the OHLC bar is green.
When all 3 indicators are indicating a downtrend, the OHLC bar is red.
When one or more indicators are conflicting, the OHLC bar is black
The basic rules are:
When the OHLC bar is green and the preceding bar is black or Red, enter a long stop-limit order .01 above the high of the first green bar
When the OHLC bar is red and the preceding bar is black or green, enter a short stop-limit order .01 below the low of the first red bar
If a red or black bar is encountered while in a long trade, or a green or black bar for a short trade, exit the trade at the close of that bar with a market order.
Stop losses are set by default at a multiple of 1.5 times the ADR.
Profit targets are set by default at a multiple of 3 times the ADR.
Options:
You can adjust the start and end dates for the trading range
You can configure this strategy for long only, short only, or both long and short.
You can adjust the multiples used to set the stop losses and profit targets.
There is an option to use a money management system very similar to the one described in the PowerX book. Some assumptions had to be made for cases where the equity is underwater as those cases are not clearly defined in the book. There is an option to override this behavior and keep the risk at or above the set point (2% by default), rather than further reduce the risk when equity is underwater. Position sizing is limited when using money management so as not to exceed the current strategy equity. The starting risk can be adjusted from the default of 2%.
Final notes: If you find any errors, have any questions, or have suggestions for improvements, please leave your message in the comments.
Happy trading!