Elephant Bars
**Elephant Bars Indicator**
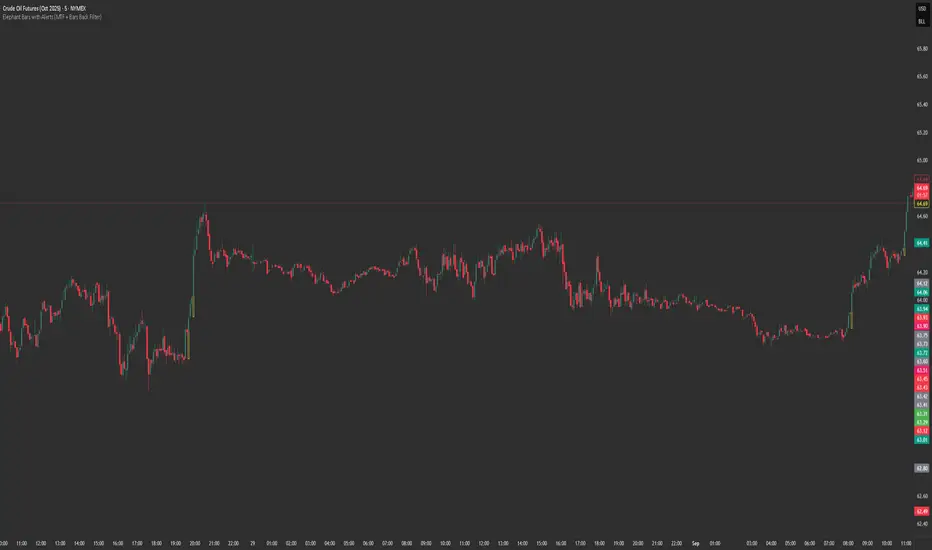
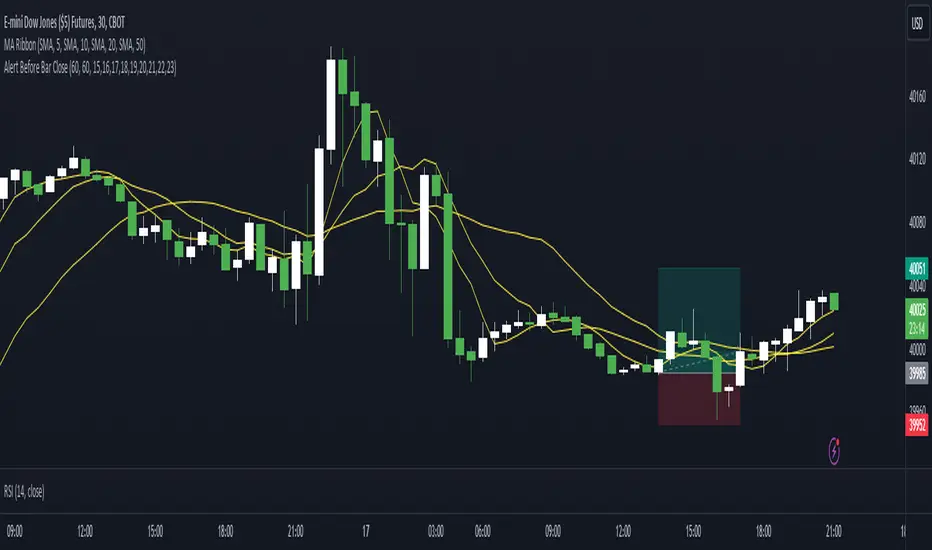
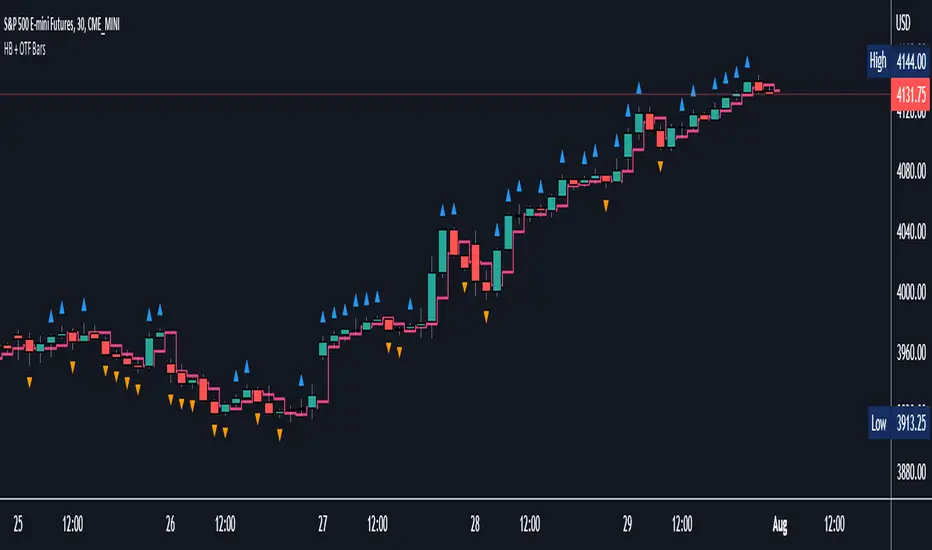
This indicator identifies and highlights candlesticks that are significantly larger than the recent average candlestick size. It helps traders quickly spot strong price movements.
- **Percentage Threshold:** The candlestick must be this much larger than the average of the last 5 candles (default is 50%).
- **Body Percentage Threshold:** The candle body must be at least this percentage of the total candle size (default is 80%).
- **Border Color:** Sets the color of the highlighted candle's border.
- **Border Thickness:** Sets the thickness of the border around the highlighted candle.
**How It Works:**
1. The script calculates the size of the current candlestick and its body.
2. It computes the average size of the last 5 candlesticks.
3. The indicator highlights candles that are both significantly larger than the average size and have a body that is a substantial portion of the total candle size.
This indicator is particularly useful for identifying potential breakout or reversal points, as large candlesticks often signify strong market sentiment.
Feel free to tweak the description to better fit your needs! 🚀
Pine Script® göstergesi