Two individual BB - AxeThis indicator combines two Bollinger Bands into a single script, designed for traders who utilize dual-band strategies but want to keep their chart and indicator list clean.
Instead of adding two separate indicators, this script allows you to manage two Bollinger Bands within one interface. It maintains the full flexibility of the classic Bollinger Bands while adding independent toggles for better visibility control.
"bands" için komut dosyalarını ara

NQ DDNQ DD - Day Displacement Bands
This indicator displays dynamic upper and lower bands designed specifically for NQ (Nasdaq-100 E-mini) futures contracts, including their micro variants (MNQ).
The bands are plotted as blue circles that update at the start of each new trading session, providing key reference levels for intraday trading. These levels help traders identify potential areas of price expansion and contraction throughout the trading day.

Quantrader📊 Overview
This custom indicator combines intraday session analysis with multi-timeframe trend confirmation to identify high-probability trading opportunities. It features:
Custom intraday session tracking (GMT+7 timezone)
Multi-level moving average confluence (SMA 20, 100, 200)
Bollinger Bands mean reversion signals
Key intraday reference levels
⚙️ Core Components
1. Custom Intraday Session Tracking
Session Start: 7:00 AM GMT+7 (Vietnamese market open)
Calculates per session:
Intraday High/Low (resets at 7:00 AM daily)
Intraday Midline = (Session High + Session Low) / 2
Pre-Day Center = Previous day's midline (carried forward)
Open Day = First 15-minute candle's open price
2. Trend Analysis Framework
SMA 20 (Short-term momentum)
SMA 100 (Medium-term trend)
SMA 200 (Long-term trend direction)
Bollinger Bands (20-period, 2 standard deviations)
3. Signal Detection Logic
Bullish Mean Reversion Setup:
javascript
Condition 1: Green candle closes ABOVE Upper Bollinger Band
Condition 2: Following candle is ALSO green
→ Triggers: Green highlight + Triangle below bar
Bearish Mean Reversion Setup:
javascript
Condition 1: Red candle closes BELOW Lower Bollinger Band
Condition 2: Following candle is ALSO red
→ Triggers: Red highlight + Triangle above bar
🎯 Visual Elements
Element Color Description
Intraday Midline Blue Real-time session midpoint
Pre-Day Center Yellow Yesterday's midline (reference)
Open Day Purple (dashed) Day's opening price
SMA 20 Red Short-term trend
SMA 100 Green Medium-term trend
SMA 200 Orange Long-term trend
Bollinger Bands Red/Green/Blue Volatility boundaries
Bull Signal Green triangle ↓ Oversold bounce potential
Bear Signal Red triangle ↑ Overbought rejection potential
📈 Trading Applications
1. Trend Confirmation
Bullish Alignment: Price > All SMAs + Above Intraday Midline
Bearish Alignment: Price < All SMAs + Below Intraday Midline
2. Mean Reversion Opportunities
Overbought Scenario: Consecutive green candles above Upper BB → Potential reversal
Oversold Scenario: Consecutive red candles below Lower BB → Potential bounce
3. Intraday Level Trading
Intraday Midline: Dynamic support/resistance
Pre-Day Center: Psychological reference level
Open Day: Key opening price level
⚡ Key Features
Automatic Session Reset: Daily at 7:00 AM GMT+7
Multi-Timeframe Confluence: Combines intraday, daily, and trend analysis
Clean Visual Design: Non-cluttered, focused on key levels
Real-Time Calculation: All levels update with each new candle
🛠️ Recommended Settings
Timeframe: 15-minute to 1-hour charts
Markets: Forex, Indices, Commodities
Best Pairs: EURUSD, XAUUSD, VN30, USDJPY
Trading Style: Swing trading, Day trading
📖 Usage Tips
Trend Trading: Enter in direction of SMA alignment (20 > 100 > 200 for bullish)
Mean Reversion: Use BB signals at key intraday levels (Midline, Pre-Day Center)
Confirmation: Wait for candle close above/below key levels
Risk Management: Place stops beyond opposite intraday extreme
🎨 Customization Options
Users can modify:
Session start time (line 6)
Bollinger Band parameters (length, multiplier)
SMA periods
Color schemes

Robin's Yoondohyun bandRobin’s Yoondohyun Band
This custom indicator plots dual Bollinger Bands on the active chart, allowing traders to monitor both the 2 standard deviation (2σ) and 3 standard deviation (3σ) envelopes simultaneously.
Key Features:
• Basis line: SMA (default) or EMA option for flexibility.
• 2σ Band (blue): Standard Bollinger Bands with 2 standard deviations.
• 3σ Band (purple): Extended Bollinger Bands with 3 standard deviations for identifying extreme price movements.
• Fill shading: Each band is shaded to provide clear visual distinction between normal and extended volatility ranges.
How to use:
• The 2σ band highlights typical volatility boundaries, where price often oscillates.
• The 3σ band captures rare, high-volatility events — price moving beyond this zone may indicate potential exhaustion or strong continuation.
• Combine both to assess whether a breakout is a standard deviation move or an exceptional volatility spike.
This tool is designed for traders who want a more nuanced view of market volatility beyond the conventional Bollinger setup.

Dual BB Candle ColoringDual Timeframe Bollinger Band Candle Coloring Indicator
What it does:
This indicator automatically colors candlesticks on your chart based on how price interacts with Bollinger Bands from two different timeframes - the 5-minute and 1-hour charts. It's designed to help traders quickly spot potential trading opportunities without cluttering their chart with multiple indicator lines.
How it works:
The indicator monitors when price touches or breaks through the upper and lower Bollinger Bands, then colors the candles according to specific rules:
For Bullish/Long Opportunities (Lower Band Signals):
Light Blue candles: When a bullish candle (closing higher than opening) touches or dips below the 5-minute Bollinger Band's lower line
Bright Green candles: When a bullish candle touches or dips below BOTH the 5-minute AND 1-hour Bollinger Band lower lines - a stronger signal
For Bearish/Short Opportunities (Upper Band Signals):
Yellow candles: When a bearish candle (closing lower than opening) touches or rises above the 5-minute Bollinger Band's upper line
Red candles: When a bearish candle touches or rises above BOTH the 5-minute AND 1-hour Bollinger Band upper lines - a stronger signal
Why it's useful:
Clean Charts: Instead of displaying multiple Bollinger Band lines that can clutter your view, it simply colors the candles
Multi-Timeframe Analysis: Combines signals from both 5-minute and 1-hour timeframes on a single 5-minute chart
Quick Visual Signals: The color coding lets you instantly see potential entry points without analyzing multiple indicators
Strength Indication: Differentiates between single timeframe signals (lighter colors) and confluence signals from both timeframes (brighter colors)
Trading Context:
Bollinger Bands typically indicate overbought/oversold conditions. When price touches the lower band, it might bounce up (bullish). When it touches the upper band, it might reverse down (bearish). This indicator highlights these moments, with stronger signals when both timeframes agree.RetryClaude can make mistakes. Please double-check responses.

BTC Fair Value via Global Liquidity📈 BTC Fair Value via Global Liquidity
This indicator estimates Bitcoin's fair value based on a regression model using Global Liquidity (GLI) data from major central banks.
🔍 How it works:
Fair Value Line (orange): Calculated using a power-law model: Fair Value = e^b * (GLI)^a, where a and b are user-defined parameters based on historical regression.
Global Liquidity (GLI): Combines liquidity metrics from central banks (Fed, ECB, PBoC, BoJ, etc.), including adjustments for the RRP and TGA.
Deviation Bands (green/red dashed): Optional upper and lower bands showing % deviation from fair value (default ±25%). These help identify overbought/oversold conditions.
Delta Plot (gray dots): Displays the % deviation of BTC’s price from its modeled fair value.
⚙️ How to use:
Tune a and b for better model fitting (e.g., via log-log regression).
Use the deviation bands to identify potential entry/exit zones or periods of market inefficiency.
Ideal for macro-level BTC valuation and long-term strategic analysis.

ATR+StdTR Band and Trailing StopThis Pine Script code plots the "ATR+StdTR Band and Trailing Stop," serving as a tool for volatility-based risk management and trend detection. While bands are typically set using a multiple of ATR, this script uses StdTR (the True Range standard deviation) and sets the band width based on ±(ATR + n times StdTR). StdTR is a great tool for detecting price volatility and anomalies, allowing traders to adapt to rapid changes in extreme market conditions. This helps traders proactively manage risk during sudden market fluctuations.
The following features are provided:
Table Display
A table is shown on the chart, allowing traders to visually track the current ATR value, StdTR (σ), and the long/short stop-loss levels (±ATR ± nσ). This enables real-time monitoring of risk management data.
Band Plots
The script plots bands that combine ATR with StdTR (nσ).
The upper and lower bands are calculated using the previous candle’s closing price (the source is customizable) and are plotted as ±(ATR + nσ), providing a clear visual of the price range.
ATR ± nσ Trailing Stop
The trailing stop dynamically adjusts the stop-loss levels based on price movements. In an uptrend, the stop-loss rises, while in a downtrend, it lowers, helping traders lock in profits while minimizing losses during significant reversals.
Breakout Detection
Breakouts are detected when the price exceeds the upper band or drops below the lower band. A visual marker (X) is displayed on the chart, allowing traders to quickly recognize when the price has moved beyond normal volatility ranges, making it easier to respond to trend formations or reversals.
Customization Points:
The ATR period and StdTR (n) are fully customizable.
The source for ATR band calculation can be adjusted, allowing traders to choose from close, open, high, low, etc.
The table’s display position and design (text color, size, etc.) can be customized to present the information clearly and effectively.

DS Gurukul round up Bank 75Roundup (Support & Resistance Indicator) For Bank Nifty
By DS Gurukul
Version : 2.0
To be used only for Bank Nifty.
Indicator Overview
The Round Figure Indicator identifies key psychological support and resistance levels based on round numbers. These levels often act as strong turning points in price action due to trader psychology and institutional order placement.
How It Works
Key Levels:
Mid Band (Black Solid Line): Major round number
Upper Band (Green Solid Line): Mid Band (resistance)
Lower Band (Red Solid Line): Mid Band (support)
Sub-Bands (Dotted Lines): ±0.10 levels for tighter zones
Alerts: Triggers when price touches any band, signaling potential reversals or breakouts.
Trading Strategy
✅ Bounce Trades:
Buy near Lower Band or Mid Sub-Lower with bullish confirmation (e.g., hammer candle).
Sell near Upper Band or Mid Sub-Upper with bearish rejection (e.g., shooting star).
✅ Breakout Trades:
Enter long on a close above Upper Band with volume.
Enter short on a close below Lower Band with momentum.
⚠️ Risk Management:
Place stops just beyond the opposite sub-band.
Avoid trading if price is stuck between mid/sub-bands (choppy market).
Why It Works
Round numbers attract limit orders (support/resistance).
Institutions use these levels for stop placements and profit targets.
Works across all timeframes (scalping to swing trading).
🔔 Tip: Combine with RSI/MACD for higher-probability trades!

TRK19121. Add the Script to TradingView
• Copy the Pine Script code I gave you.
• In TradingView, open the Pine Editor (bottom of the screen).
• Paste the code and click Add to Chart.
2. What You’ll See
• On your chart, Fibonacci retracement levels will be drawn automatically between the highest and lowest points in the last lookback bars (default = 100).
• Bollinger Bands (20-period SMA with ±2 standard deviations) will also appear.
• On the top-right corner, a table will show all Fibonacci levels (0%, 23.6%, 38.2%, 50%, 61.8%, 78.6%, 100%) with their exact price values.
• All text in the table is black for clarity.
3. How It Updates
• Every new candle, the script recalculates the highest and lowest points in the lookback window.
• The Fibonacci levels and the table update automatically.
• You don’t need to manually redraw fibo lines — the script does it for you.
4. How to Interpret
• Fibonacci levels act as potential support/resistance zones.
• Bollinger Bands show volatility and overbought/oversold conditions.
• If price is near a Fibonacci level and touches the Bollinger upper/lower band, that’s a strong signal area.
• Example:
• Price near 61.8% fibo + lower band → possible bounce (long).
• Price near 38.2% fibo + upper band → possible rejection (short).
5. Customization
• You can change the value (default 100 bars) to adjust how far back the script finds the high/low.
• You can change Bollinger settings (, ) to fit your trading style.
• The table always shows the current fibo levels clearly, so you don’t need to measure them manually.

Fibo + Bollinger + Fibo Tablosu1. Add the Script to TradingView
• Copy the Pine Script code I gave you.
• In TradingView, open the Pine Editor (bottom of the screen).
• Paste the code and click Add to Chart.
2. What You’ll See
• On your chart, Fibonacci retracement levels will be drawn automatically between the highest and lowest points in the last lookback bars (default = 100).
• Bollinger Bands (20-period SMA with ±2 standard deviations) will also appear.
• On the top-right corner, a table will show all Fibonacci levels (0%, 23.6%, 38.2%, 50%, 61.8%, 78.6%, 100%) with their exact price values.
• All text in the table is black for clarity.
3. How It Updates
• Every new candle, the script recalculates the highest and lowest points in the lookback window.
• The Fibonacci levels and the table update automatically.
• You don’t need to manually redraw fibo lines — the script does it for you.
4. How to Interpret
• Fibonacci levels act as potential support/resistance zones.
• Bollinger Bands show volatility and overbought/oversold conditions.
• If price is near a Fibonacci level and touches the Bollinger upper/lower band, that’s a strong signal area.
• Example:
• Price near 61.8% fibo + lower band → possible bounce (long).
• Price near 38.2% fibo + upper band → possible rejection (short).
5. Customization
• You can change the value (default 100 bars) to adjust how far back the script finds the high/low.
• You can change Bollinger settings (, ) to fit your trading style.
• The table always shows the current fibo levels clearly, so you don’t need to measure them manually.

Price Band LevelsThis indicator allows you to specify a base price. Once set, it automatically draws three price bands above the base and three bands below it, giving you a structured visual range around the selected level.

Multi-TF Flexible Triple MA + Envelope🔷 Main Features
1. Three Moving Averages (MA1, MA2, MA3)
Fully customizable types: SMA, EMA, WMA, VWMA, TEMA
Individual period and price source for each MA
Optional multi-timeframe (MTF) calculation
This allows you to build a flexible trend structure with local, medium-term, and higher-timeframe layers.
2. Envelope Based on MA3
The indicator includes an Envelope channel (upper and lower bands) derived from MA3.
Features:
Adjustable deviation in percentage
Enable/disable the channel
Optional fill between bands
Dotted line style mode
The Envelope helps visualize:
Overbought/oversold zones relative to trend
Volatility expansion and contraction
Dynamic support/resistance bounces
3. MA1–MA2 Crossover Signals
The indicator plots visual markers for crossover events:
🔺 MA1 crossing above MA2 — potential bullish impulse
🔻 MA1 crossing below MA2 — early warning of trend weakness or reversal
These signals can be used for entries, trend filtering, or confirmation of directional movement.
🎯 Why Use This Indicator
This tool combines several analytical approaches:
Dynamic trend levels (MAs)
Volatility structure through the Envelope
Multi-timeframe analysis
Clear visual crossover signals
It works well for:
Trend-following entry zones
Trading from Envelope boundaries
Identifying market expansion/compression
Filtering trend direction across multiple timeframes
Both intraday and swing trading

ATR Bands + Bollinger Bandsa combination used to show consolidation and break outs. break outs when bb is within atr and crosses above or below.

Mars Mission ModelIdentifies Fair Value Gaps (FVGs) during the New York AM session (8-11 AM EST) that form outside Bollinger Bands, then tracks Previous Day High/Low liquidity sweeps to generate inverse FVG signals when conditions align.
What makes this unique:
This is NOT a standard FVG indicator. Uniquely combines session-specific FVG detection with Bollinger Band volatility filtering AND PDH/PDL liquidity sweep confirmation to generate inverse signals. This triple-filter confluence approach is an original methodology not found in existing indicators.
Core Logic:
Detects 3-candle Fair Value Gaps (where candle 1's high/low doesn't overlap with candle 3's low/high). When the middle candle closes beyond the Bollinger Bands during NY AM session, a green box marks the qualified FVG.
The indicator simultaneously tracks Previous Day High/Low levels and monitors for liquidity sweeps (price trading through these levels) during the NY AM session, marked with rocket emojis 🚀.
Inverse FVG Signals:
When a qualified FVG gets mitigated (price closes back through it) AND the corresponding PDH/PDL was already swept in that session, an inverse signal appears (alien emoji 👽):
Bullish FVG mitigated + PDH swept = Bearish inverse signal
Bearish FVG mitigated + PDL swept = Bullish inverse signal
This proprietary combination of session timing, volatility expansion, liquidity sweeps, and FVG mitigation creates a focused reversal detection system that doesn't exist in any open-source indicator.
Let's go to Mars 🚀
For educational use only. Not financial advice.

Asymmetric Market Momentum Channel█ OVERVIEW
"Asymmetric Market Momentum Channel" is a dynamic channel indicator that adjusts its width based on the actual strength and asymmetry of market momentum. Thanks to the asymmetric band expansion triggered by strong candles, it significantly reduces false breakouts while remaining highly sensitive to genuine moves.
█ CONCEPTS
Traditional volatility channels react too slowly or too uniformly. This indicator introduces asymmetry:
- After a strong bullish candle with a large body and long upper wick, the upper band is pushed much farther than the lower one.
- After a strong bearish candle, the lower band expands more.
As a result, the channel "remembers" the direction of the last real momentum.
- With wide bands (default base_scale 200+), it excels in contrarian (reversal) strategies – price tends to return to the midline, producing clean reversal signals.
- With narrow bands (base_scale set to 100–150), it behaves like a sensitive breakout channel – breakouts from a tight channel deliver very high-quality trend-continuation signals.
█ FEATURES
Fully adjustable asymmetric momentum channel:
- length – SMA period for midline and average range (default 30)
- base_scale – base channel width in % of average candle range (default 200%)
- strength – asymmetry intensity (higher = stronger expansion after powerful candles)
- smooth_len – EMA smoothing of the expansion (default 10)
Visualization:
- Upper band – red, lower band – green
- Midline SMA – gray
- Gradient background fill (enabled by default) – red above midline, green below; intensity controlled by Background Intensity (85 = strong, 95 = very subtle)
Signal modes:
- Contrarian (Reversal) – reversal signals on price returning inside the channel after exceeding it + confirming candle color
- Trend Continuation (Breakout) – classic breakout signals (recommended to lower base_scale to 100–150 for faster triggers)
- Both – displays both types simultaneously
Visual signals:
- Small green triangles below the bar → bullish signal
- Small red triangles above the bar → bearish signal
Alerts: Bullish Signal, Bearish Signal, Any Signal, Breakout Up, Breakout Down
█ HOW TO USE
Add the indicator to your TradingView chart and adjust the settings:
Key parameter:
- base_scale – defines the indicator’s character:
→ 200–300% → wide channel → Contrarian (reversal) mode
→ 100–150% → narrow channel → Trend Continuation (breakout) mode
- strength (default 1.0)
- length (30) – higher values = smoother, more trend-following behavior
smooth_len (10) – lower values = faster reaction to new momentum
Interpretation:
- Wide channel (base_scale ≥ 200) + Contrarian mode → mean-reversion trading
- Narrow channel (base_scale 100–150) + Breakout mode → aggressive trend-following on breakouts
- Both mode works universally – simply change base_scale to completely switch the indicator’s behavior
█ APPLICATIONS
- Scalping & daytrading – narrow channel + Breakout mode on 5–15 min
- Swing trading – narrow or wide channel + Both mode on H1–D1
- Mean-reversion – wide channel + Contrarian mode
- Trend filter – longs only above midline, shorts only below
█ NOTES
- In very strong one-sided trends, contrarian signals generate many false entries – switch exclusively to Trend Continuation (Breakout) mode with a narrow channel.
- Best performance on instruments with clear volatility and volume.
- Always match base_scale to your strategy (wide = reversal, narrow = breakout).
- Combining with volume, support/resistance levels, or indicators like MACD/RSI dramatically improves signal quality.

McGinley River Pro (Luis Casal)McGinley River Pro is a volatility-adaptive trend indicator designed to help traders identify market transitions between contraction and expansion phases.
The indicator is built around the McGinley Dynamic line, surrounded by adaptive upper and lower bands forming a “river” that represents market noise.
When price remains inside the river, conditions are typically range-bound or consolidating.
When price breaks outside, it often signals the beginning of a strong directional trend.
A special Squeeze Detection System highlights periods of decreasing volatility — when the river narrows — marking potential setups before expansion moves.
Features:
• Adaptive McGinley Dynamic smoothing
• Volatility-based upper & lower river bands
• Visual trend coloring and bar painting
• Squeeze marker for early range compression detection
• Alerts for trend shifts and river breakouts
Use McGinley River Pro to spot quiet periods before volatility returns and to confirm the strength of developing trends. Works on all assets and timeframes.

Plot_4_Key_LevelsBollinger Bands (upper & lower)
- computes 12-bar Bollinger Bands on the chart’s current timeframe, with a 3σ (standard-deviation) multiplier.
- computes vwap
- computes VWMA(HL2, 36)—a smoothed, volume-weighted average price—plotted as a line.

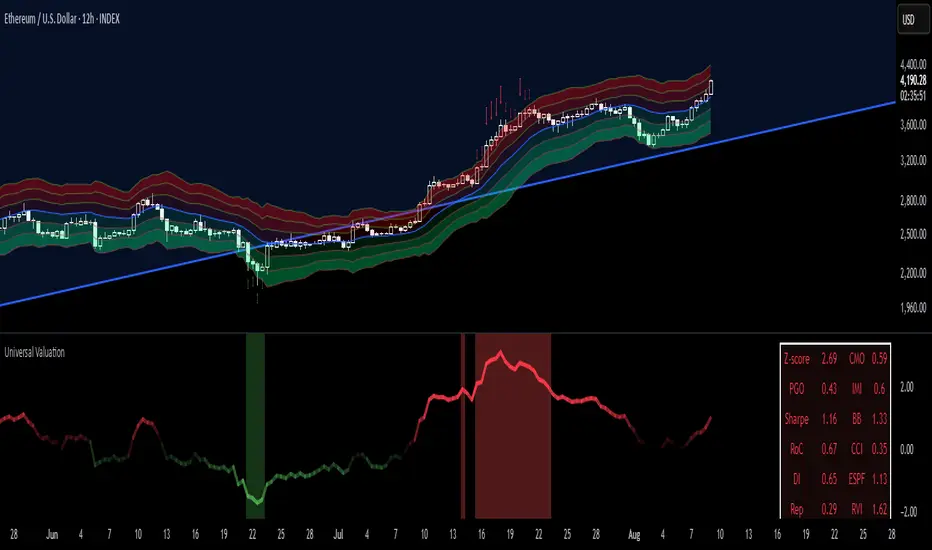
Universal Valuation[public code]Universal valuation indicator for all assets. Consists of 12 different indicators which are z-scored and averaged out.
> Volatility bands via Keltner Channels with a NWMA
> Confluence when price > vol.bands and valuation is high/low. The confluence is marked with red arrows when above the upper third band(green when below the lower on the downside), and 50% transparency when between 2/3 band(green when below the lower 2/3 bands on the downside.)
> Can be used separately of course.
> Can be used as valuation of indicators, when possible. (eg. Global Liquidity index valuation)
Code is a mess a bit, but parts can be extracted and a new strategy/indicator can be made.
*Big probs to the creator of this indicator . Inspired by him. I want to make it possible for people to extrapolate and create their own indicators/strategies. And of course, so I can do the same.
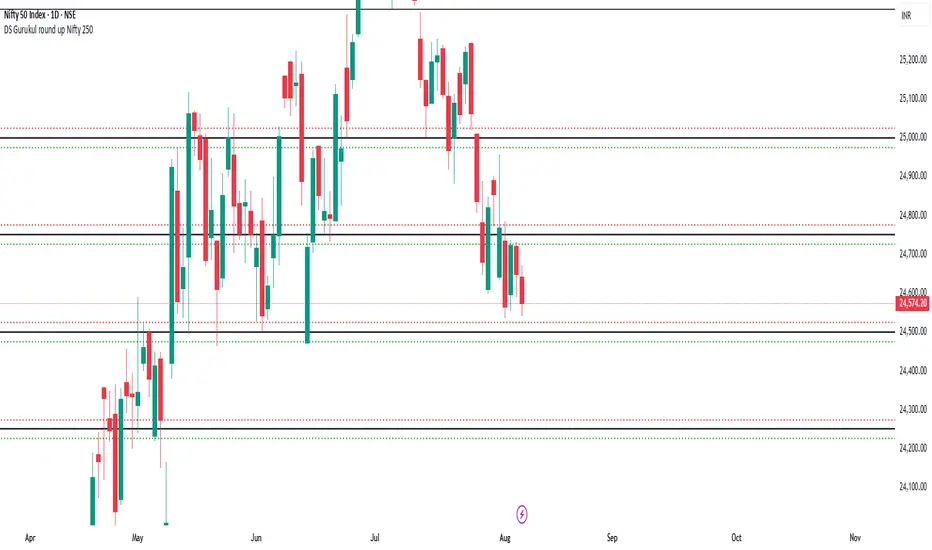
DS Gurukul round up Nifty 250Roundup (Support & Resistance Indicator) For Nifty 50
By DS Gurukul
Version : 1.0
To be used only for Nifty 50.
Indicator Overview
The Round Figure Indicator identifies key psychological support and resistance levels based on round numbers. These levels often act as strong turning points in price action due to trader psychology and institutional order placement.
How It Works
Key Levels:
Mid Band (Black Solid Line): Major round number
Upper Band (Green Solid Line): Mid Band (resistance)
Lower Band (Red Solid Line): Mid Band (support)
Sub-Bands (Dotted Lines): ±0.10 levels for tighter zones
Alerts: Triggers when price touches any band, signaling potential reversals or breakouts.
Trading Strategy
✅ Bounce Trades:
Buy near Lower Band or Mid Sub-Lower with bullish confirmation (e.g., hammer candle).
Sell near Upper Band or Mid Sub-Upper with bearish rejection (e.g., shooting star).
✅ Breakout Trades:
Enter long on a close above Upper Band with volume.
Enter short on a close below Lower Band with momentum.
⚠️ Risk Management:
Place stops just beyond the opposite sub-band.
Avoid trading if price is stuck between mid/sub-bands (choppy market).
Why It Works
Round numbers attract limit orders (support/resistance).
Institutions use these levels for stop placements and profit targets.
Works across all timeframes (scalping to swing trading).
🔔 Tip: Combine with RSI/MACD for higher-probability trades!
DS Gurukul round up Bank 500Roundup (Support & Resistance Indicator) For Bank Nifty
By DS Gurukul
Version : 1.0
To be used only for Bank Nifty.
Indicator Overview
The Round Figure Indicator identifies key psychological support and resistance levels based on round numbers. These levels often act as strong turning points in price action due to trader psychology and institutional order placement.
How It Works
Key Levels:
Mid Band (Black Solid Line): Major round number
Upper Band (Green Solid Line): Mid Band (resistance)
Lower Band (Red Solid Line): Mid Band (support)
Sub-Bands (Dotted Lines): ±0.10 levels for tighter zones
Alerts: Triggers when price touches any band, signaling potential reversals or breakouts.
Trading Strategy
✅ Bounce Trades:
Buy near Lower Band or Mid Sub-Lower with bullish confirmation (e.g., hammer candle).
Sell near Upper Band or Mid Sub-Upper with bearish rejection (e.g., shooting star).
✅ Breakout Trades:
Enter long on a close above Upper Band with volume.
Enter short on a close below Lower Band with momentum.
⚠️ Risk Management:
Place stops just beyond the opposite sub-band.
Avoid trading if price is stuck between mid/sub-bands (choppy market).
Why It Works
Round numbers attract limit orders (support/resistance).
Institutions use these levels for stop placements and profit targets.
Works across all timeframes (scalping to swing trading).
🔔 Tip: Combine with RSI/MACD for higher-probability trades!

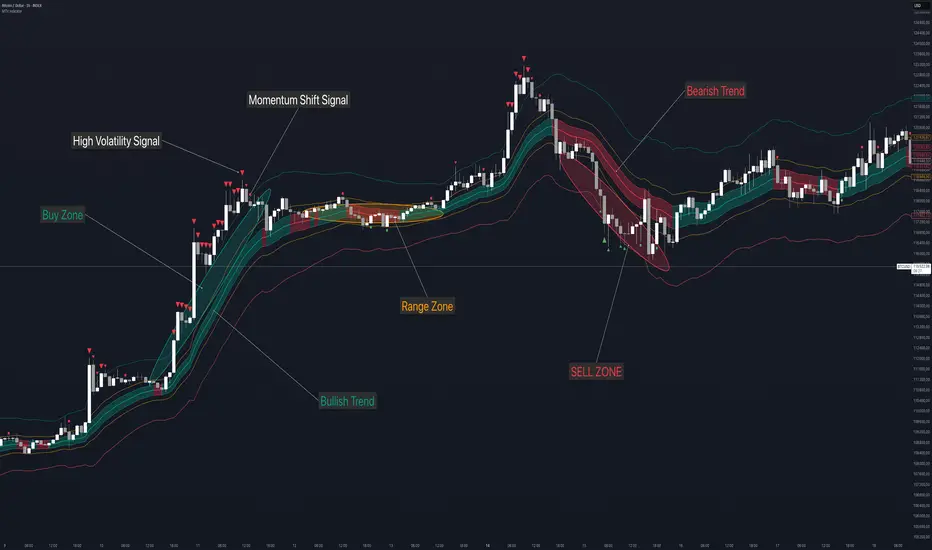
Momentum, Trend and Volatility indicator by [Th16rry]Momentum, Trend and Volatility indicator by
Description:
Momentum, Trend and Volatility indicator by is an advanced TradingView indicator designed to clearly identify market bias, volatility, and momentum directly on your charts. It integrates multiple analytical techniques, combining adaptive moving averages, volatility bands, and momentum signals into a unified visual framework.
Key Components:
Adaptive Moving Average (Nadaraya–Watson): A sophisticated, non-repainting adaptive moving average colored dynamically to instantly show bullish or bearish trends. This component highlights the prevailing market bias.
Trend Channel: Built around a central Keltner Channel with a customizable multiplier, this channel captures immediate price trends. When price remains within this channel, it indicates sustained market direction.
Volatility Channel: Represented by broader bands using a higher ATR multiplier. Price movements crossing outside these channels suggest significant volatility spikes, often signaling potential market reversals or strong breakout moves.
Range Channel: A medium ATR multiplier channel designed to pinpoint potential consolidation or ranging conditions. Useful for identifying short-term trading ranges or preparation phases before major moves.
CCI Momentum Signals: Includes optional Commodity Channel Index (CCI) signals to identify momentum shifts. Arrows appear when CCI crosses predefined thresholds, signaling potential overbought or oversold conditions.
How to Use:
Trend Following: Enter trades aligned with the adaptive moving average color. A teal line indicates bullish conditions, while a red line suggests bearish sentiment. Use Trend Channel
to spot Breakouts and pull-backs.
Volatility Breakouts: Pay attention to arrows marking price breaches beyond the Volatility Channel. Upward (red) and downward (green) arrows highlight significant breakout or reversal opportunities.
Range Trading: Utilize the Range Channel to trade sideways markets. Price reactions near these boundaries can offer quick reversal trade setups or scalping opportunities. Or simply avoid any trading during these low volatility phases.
Momentum Entries: Enable CCI signals to catch momentum-based trades. Green circles indicate bullish momentum turning points; red circles indicate bearish momentum shifts.
Customization:
Momentum, Trend and Volatility indicator by provides full customization to fit individual trading styles:
Adjust ATR multipliers to control channel widths.
Configure Nadaraya–Watson parameters for sensitivity.
Enable or disable visual elements such as channel backgrounds or CCI signals to maintain chart clarity.
This indicator serves as a comprehensive trading tool for traders looking to enhance their strategy through a clear understanding of market dynamics, including trend strength, volatility bursts, and momentum shifts.
Disclaimer:
Trading involves significant risk of loss and is not suitable for every investor. Always use proper risk management strategies. This Indicator is provided for educational purposes only and does not constitute financial advice or recommendations to trade specific assets. Users should conduct their own research and consult a licensed financial advisor before making trading decisions.
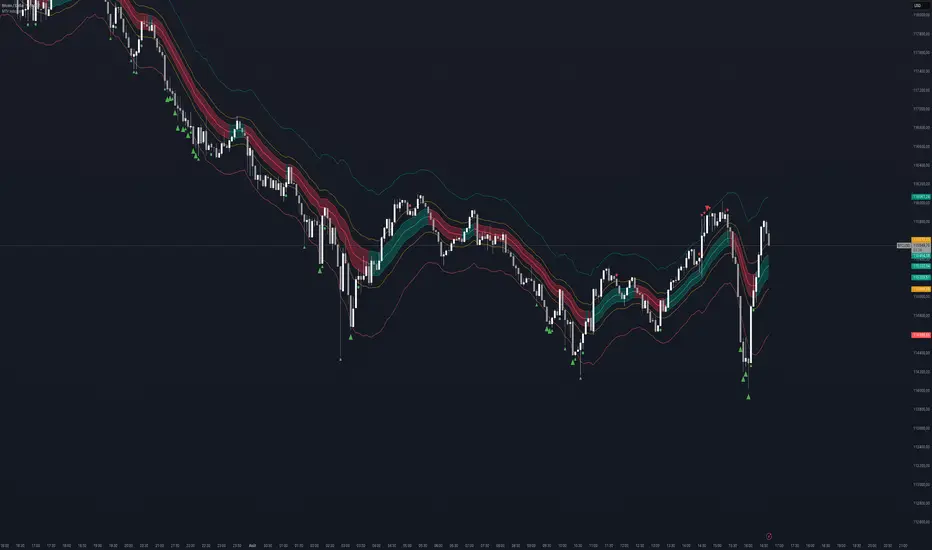
Momentum, Trend and Volatility indicator by [Th16rry]Momentum, Trend and Volatility indicator by
Description:
Momentum, Trend and Volatility indicator by is an advanced TradingView indicator designed to clearly identify market bias, volatility, and momentum directly on your charts. It integrates multiple analytical techniques, combining adaptive moving averages, volatility bands, and momentum signals into a unified visual framework.
www.tradingview.com [/url
Key Components:
Adaptive Moving Average (Nadaraya–Watson):
A sophisticated, non-repainting adaptive moving average colored dynamically to instantly show bullish or bearish trends. This component highlights the prevailing market bias.
Trend Channel:
Built around a central Keltner Channel with a customizable multiplier, this channel captures immediate price trends. When price remains within this channel, it indicates sustained market direction.
Volatility Channel:
Represented by broader bands using a higher ATR multiplier. Price movements crossing outside these channels suggest significant volatility spikes, often signaling potential market reversals or strong breakout moves.
Range Channel:
A medium ATR multiplier channel designed to pinpoint potential consolidation or ranging conditions. Useful for identifying short-term trading ranges or preparation phases before major moves.
Momentum Signals:
Includes optional Commodity Channel Index (CCI) signals to identify momentum shifts. Arrows appear when CCI crosses predefined thresholds, signaling potential overbought or oversold conditions.
How to Use:
Trend Following:
Enter trades aligned with the adaptive moving average color. A teal channel indicates bullish conditions, while a red channel suggests bearish sentiment. Channel helping to spot break outs and pullbacks.
Volatility Breakouts:
Pay attention to arrows marking price breaches beyond the Volatility Channel. Upward (red) and downward (green) arrows highlight significant breakout or reversal opportunities.
Range Trading:
Utilize the Range Channel to trade sideways markets. Price reactions near these boundaries can offer quick reversal trade setups or scalping opportunities, or simply avoid trading during these low volatility phases.
Momentum Entries:
Enable CCI signals to catch momentum-based trades. Green circles indicate bullish momentum turning points; red circles indicate bearish momentum shifts.
Customization:
Momentum, Trend and Volatility indicator by provides full customization to fit individual trading styles:
* Adjust ATR multipliers to control channel widths.
* Configure Nadaraya–Watson parameters for sensitivity.
* Enable or disable visual elements such as channel backgrounds or CCI signals to maintain chart clarity.
This indicator serves as a comprehensive trading tool for traders looking to enhance their strategy through a clear understanding of market dynamics, including trend strength, volatility bursts, and momentum shifts.
**Disclaimer:**
Trading involves significant risk of loss and is not suitable for every investor. Always use proper risk management strategies. Indicator is provided for educational purposes only and does not constitute financial advice or recommendations to trade specific assets. Users should conduct their own research and consult a licensed financial advisor before making trading decisions.
Senn System A"Senn System A" is a robust, all-in-one indicator engineered to enhance your market analysis by intelligently combining the power of Volume Weighted Average Price (VWAP) for range-bound conditions and Exponential Moving Average (EMA) Ribbons for trending environments. This script aims to provide traders with a clear, dynamic visual representation of market structure and momentum across multiple timeframes. A core feature allows you to select and display two distinct VWAP instances simultaneously, each anchoring to your choice of Daily, Weekly, Monthly, Quarterly, or Yearly periods. These VWAPs include clean, filled bands highlighting the area between Standard Deviation 1 and Standard Deviation 2, providing immediate visual cues for key price zones. Furthermore, a unique "Previous VWAP" feature, complete with its own selectable bands and fills, offers valuable historical context for understanding past price action relative to significant volume profiles.
Complementing the VWAP functionality, the indicator integrates an advanced EMA ribbon system, building upon the principles of effective trend visualization. You can customize the lengths of the primary EMA ribbon (defaulting to 25, 36, 50 periods) to suit your analysis of short to medium-term trends. Additionally, dedicated toggles enable the display of higher-timeframe trend ribbons, using EMAs of 100/200 for daily trend and 600/1200 for weekly trend. These ribbons are color-coded based on EMA crossovers, providing intuitive visual signals of trend direction and strength. The "Senn System A" is designed to be highly configurable, allowing traders to tailor the indicator's appearance and active components to their specific trading strategies and market conditions.
