Foxy's Logarithmic Bollinger BandsThis versatile indicator plots logarithmic Bollinger Bands on any financial asset or timeframe in the TradingView platform. Unlike traditional Bollinger Bands, which use simple arithmetic calculations, Foxy's LBB employs logarithmic scales to better capture and visualize percentage-based price movements.
The core functionality includes:
Basis Line: A central moving average line calculated on the log10 of the selected price source (default is close price). Multiple moving average types are available, including SMA, EMA, RMA, and volume-weighted variants.
Upper/Lower Bands 1: The first set of upper and lower bands, plotted at a user-defined number of standard deviations (default 2.0) above and below the Basis Line.
Upper/Lower Bands 2: A second set of bands plotted at a different standard deviation level (default 3.0) to cater to different volatility preferences.
Offset: An option to vertically offset the plotted lines for better visualization alongside other indicators or studies.
By using a logarithmic scale, Foxy's LBB provides a more accurate representation of percentage-based price changes, making it particularly useful for analyzing and trading volatile assets or markets with significant price swings.
Traders can leverage this indicator for various purposes, such as identifying potential overbought/oversold conditions, gauging volatility levels, and spotting trend continuations or reversals based on the interaction between price and the band levels.
Whether you're a seasoned trader or just starting, Foxy's LBB offers a powerful and flexible tool to enhance your technical analysis and decision-making process in the TradingView environment.
"bands" için komut dosyalarını ara

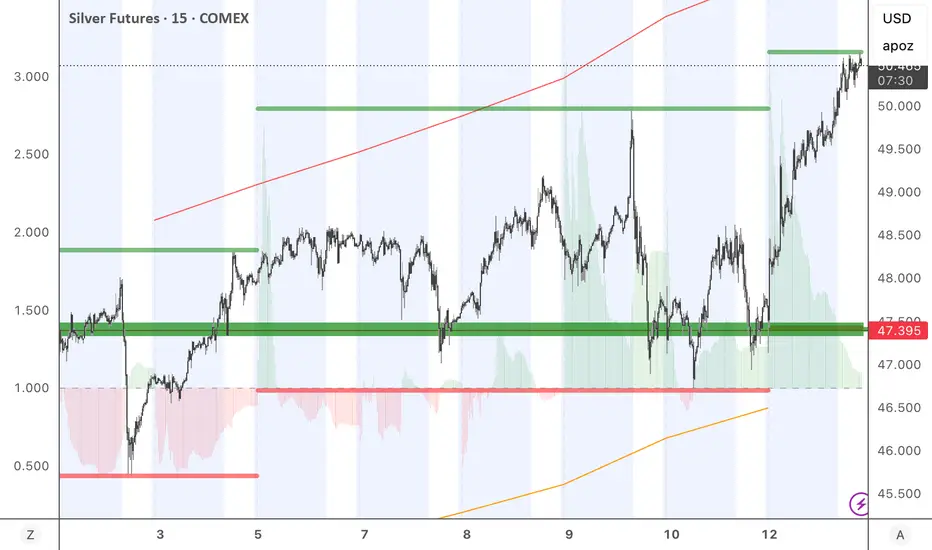
RoseTree Golden BandsRoseTree Golden Bands
Overview
RoseTree Golden Bands is a volatility-based support indicator that uses Fibonacci ratios combined with Average True Range (ATR) to identify potential buy zones below price action.
How It Works
The indicator calculates a simple moving average (SMA) of the closing price, then subtracts ATR-based offsets using two key Fibonacci extensions (2.618 and 4.236) to create dynamic support bands that expand and contract with market volatility.
Components
Orange Line (Level 2) — SMA minus ATR × 2.618. Acts as the first support level and early warning zone.
Green Line (Buy Zone) — SMA minus ATR × 4.236. Represents deeper support where price has historically found strong buying interest.
BUY Signal — Triggers when the candle's low comes within 2% of the green line, alerting you to potential accumulation opportunities.
Settings
Length: Period for both SMA and ATR calculations (default: 20)
Fibonacci Ratio 2: Multiplier for the orange band (default: 2.618)
Fibonacci Ratio 3: Multiplier for the green buy zone (default: 4.236)
Usage
Look for BUY signals during pullbacks in an uptrend. The bands adapt to volatility, widening during turbulent markets and narrowing during consolidation. Best used alongside trend confirmation and volume analysis rather than as a standalone signal.

MTF Bollinger Bands (1-2-3 SD)MTF Bollinger Bands (1-2-3 SD)
Plots Bollinger Bands from any higher timeframe (e.g., Daily or Weekly) directly on your current chart (1m, 15m, 1h, etc.).
Features:
Shows 1σ (blue), 2σ (orange), and 3σ (red) bands with transparent fills
Fully customizable timeframe, length, and deviation multipliers
Option to show/hide each band pair independently
Smooth (no gaps) or stepped display
Perfectly matches the native Bollinger Bands when you switch to the selected higher timeframe
Great for keeping higher-timeframe structure and extreme levels in view while trading lower timeframes.

Polynomial BandsPolynomial Bands apply a second-degree least-squares regression model to estimate the underlying non-linear trend of the price series. Over the selected lookback window, the indicator computes the quadratic polynomial
y(x) = A + Bx + Cx^2
and evaluates this function at the most recent bar. This value serves as the Base Line. It represents the fitted trend at the current location within the window.
After fitting the polynomial, the indicator calculates residuals by measuring the difference between observed prices and the regression curve. The sample variance of these residuals provides an estimate of dispersion around the fitted polynomial. The square root of this variance is used as the volatility measure for generating symmetric envelopes around the Base Line at multiples of the standard deviation.
The resulting bands represent regions of statistically expected deviation from the underlying quadratic trend. Narrow bands correspond to stable adherence to the modeled curve, while wide bands reflect increased irregularity or volatility.

Bollinger Bands JDVRX...Bollinger Bands JDVRXBollinger Bands JDVRXBollinger Bands JDVRXBollinger Bands JDVRX

Session Pivots + EMA20/50 + Bollinger BandsMulti-tool indicator combining session pivots, EMA trend filters, Bollinger Bands, and alerts for intraday trading.
📌 Description
One of the biggest advantages of this indicator is that it supports TradingView’s ALERT system, so traders can be notified the moment price crosses the daily/session pivot level. This allows faster decision-making without constant chart watching.
This script combines three powerful tools into a single indicator:
Session Pivot Levels (with Support/Resistance): Automatically calculates pivot, R1–R3 and S1–S3 levels based on the previous trading session (London, New York, Asia, or custom). Levels are plotted with clean labels and connector lines so you always see the exact price values ahead of time.
EMA Trend Filters (20 & 50): Tracks short- and medium-term market direction with two popular exponential moving averages, helping confirm entries and exits.
Bollinger Bands (fully customizable): Adds volatility bands with choice of SMA, EMA, SMMA, WMA, or VWMA for the middle line, plus adjustable standard deviation and offset.
✅ Key Features
Auto-detects London, New York, and Asian sessions or set your own custom session.
Displays up to 3 levels of support and resistance from the previous session.
Clean label display with customizable theme options (Dark, Light, Custom).
Alerts included: Get notified instantly when price crosses above or below the Pivot.
EMA20/50 trend confirmation built-in.
Bollinger Bands with multiple moving average types and volatility settings.
Works for Forex, Crypto, Indices, Commodities — optimized for intraday & scalping.
This makes it a complete intraday toolkit, reducing the need to load multiple separate indicators.
📄 Full documentation available here: [ link ]

EMA with Adjustable ±% BandsThis indicator plots an Exponential Moving Average (EMA) with two dynamic bands above and below it, set at a user-defined percentage offset.
EMA Length – Controls the smoothing period for the EMA.
Band Offset (%) – Determines the percentage distance of the upper and lower bands from the EMA.
EMA Line Color & Band Fill Color – Fully customizable for visual clarity.
The upper and lower bands act as a volatility envelope, helping to identify potential overbought and oversold zones relative to the EMA. The shaded area between the bands provides a quick visual reference for price movement boundaries, making it useful for trend-following strategies, breakout detection, or mean reversion setups.

Bollinger Bands (Log Scale)📈 Bollinger Bands on log scale are broken.
Many traders use log charts for better price symmetry—but still apply Bollinger Bands calculated on linear price. That mismatch creates distorted signals.
Here’s what I found:
- Standard deviation becomes misleading on log scale
- Band width no longer reflects true volatility
- Breakout signals lose behavioral clarity
🛠 So I rewrote the logic.
My version calculates Bollinger Bands using log(price) for both mean and deviation, then maps the result back to price. It behaves correctly on log charts and aligns better with behavioral scoring.

TMA Bands with AlertsTMA Bands with Alerts uses bands to indicate the up and downtrend with alerts to show potential reversals. POAYEE

16H Bollinger BandsThis indicator plots Bollinger Bands based on the 16-hour timeframe, regardless of the chart’s current timeframe.
📌 Features:
Uses a higher-timeframe (16H / 960 minutes) SMA as the basis
Upper and lower bands calculated with standard deviation
Adjustable parameters: length, standard deviation multiplier, and source
Works even when applied on lower timeframes (e.g. 1H, 15m), allowing you to overlay higher-timeframe volatility zones on intraday charts
📌 Use cases:
Identify major support and resistance zones from a higher timeframe
Filter out market noise by relying on broader 16H volatility structure
Combine with lower-timeframe signals for more accurate entries and exits

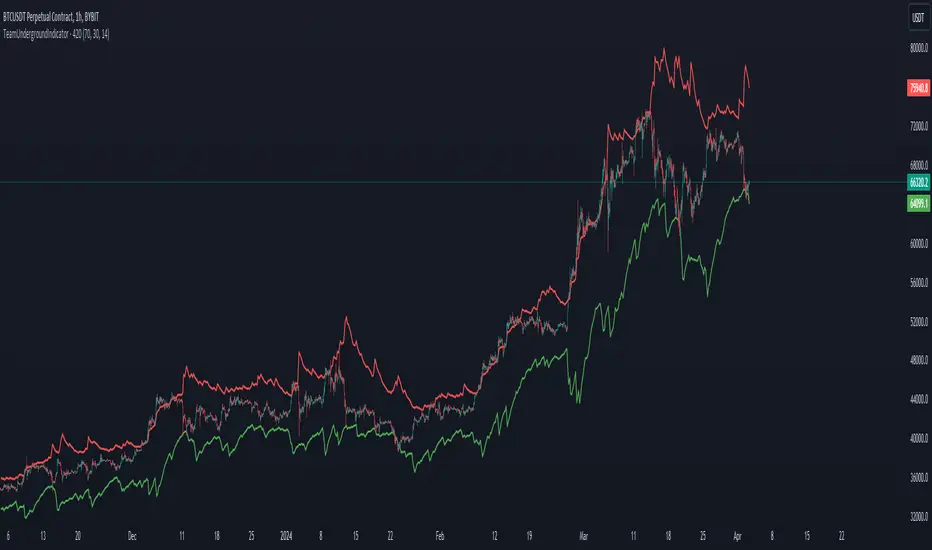
Team Undergrounds Magic RSI BandsWhat is this indicator?
This indicator shows RSI but visualize as bands with custom timeframe settings. Normal RSI doesn't really visualse well when the price gets overbought/oversold and generally because of candle closes it can be hard to determine if the price has already touched the prefered RSI level. The custom timeframe allows you to go to shorter or longer timeframes on the chart while maintaining the same timeframe on the RSI indicator.
How does it work?
Add this indicator to the chart, and you'll see 2 bands (green and red). By standard settings, the green band shows when price goes below 30 RSI and the red line when price goes above 70 on the RSI. By standard settings the RSI band is set to 7 hour because this tends to work well with Bitcoin and crypto in general, but the timeframe can be changed in the settings. 12hr, 3hr, 3D, 1W are all good timeframes based off personal preference. The overbought/oversold level and RSI length can also be adjusted.
Indicator is not a financial advice tool, and offcourse, data can always change. Past price does not predict future price by defintion.
Binomial MA BandsThe Binomial MA Bands is a simple and straightforward trading tool that uses a binomial distribution to calculate the moving average and standard deviation of a given price series. It allows users to adjust the length of the moving average and the multiplier for the standard deviation, providing some flexibility in its usage. However, it should be noted that the binomial distribution may not always provide the most accurate representation of market movements and trends, and may not always be the best choice for all traders. Additionally, the tool only has a limited range of adjustable parameters, so it may not be suitable for traders with more advanced or complex strategies. Overall, the Binomial MA Bands may be a useful tool for some traders, but its limitations should be kept in mind when considering its use in trading.

Bollinger Bands % 3 BandsBollinger Bands based on percent change from previous close instead of price movement

Fibonacci Bands 33 — Pro (auto+fix EMA/ATR + HTF panel)Fibonacci Bands 33 — Pro (auto+fix EMA/ATR + HTF panel)

Yearly Anchored VWSTD (Volume-Weighted StdDev Bands)This indicator calculates a Volume-Weighted Mean Band (VWMB) — similar in concept to an anchored VWAP — and measures standard deviation from the mean to visualize how far price has deviated from its volume-weighted equilibrium.
Each calendar year acts as an anchor period: the cumulative calculations reset automatically on January 1st, providing a fresh annual reference.
At any time, the middle yellow line represents the volume-weighted mean price (VWMP) since the start of the current year, while the surrounding ±1σ, ±2σ, and ±3σ bands show progressively stronger deviations from that mean, taking both price and volume into account.
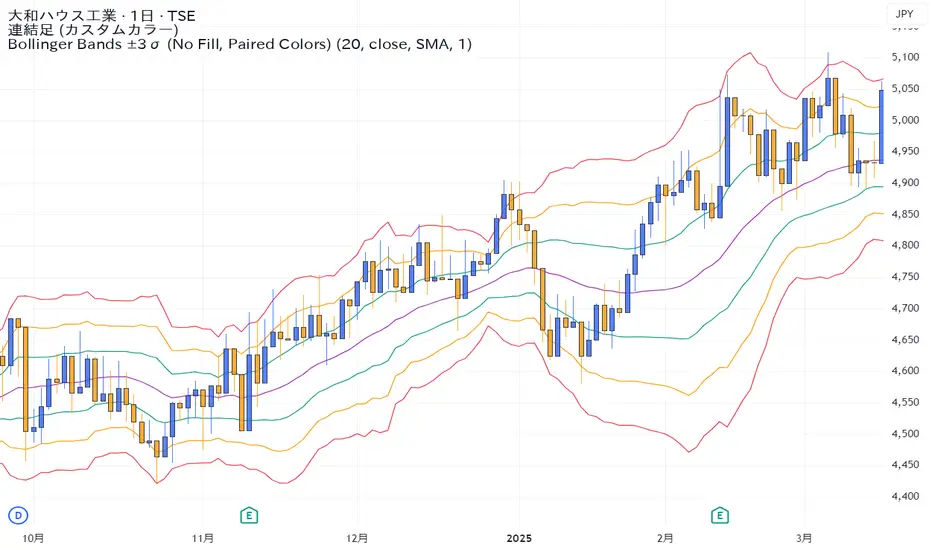
Bollinger Bands ±3σ (No Fill, Paired Colors)±3σまで1つのインジケーターで表示できるシンプルなボリンジャーバンドです。
A simple Bollinger Bands indicator that can display up to ±3σ within a single script.
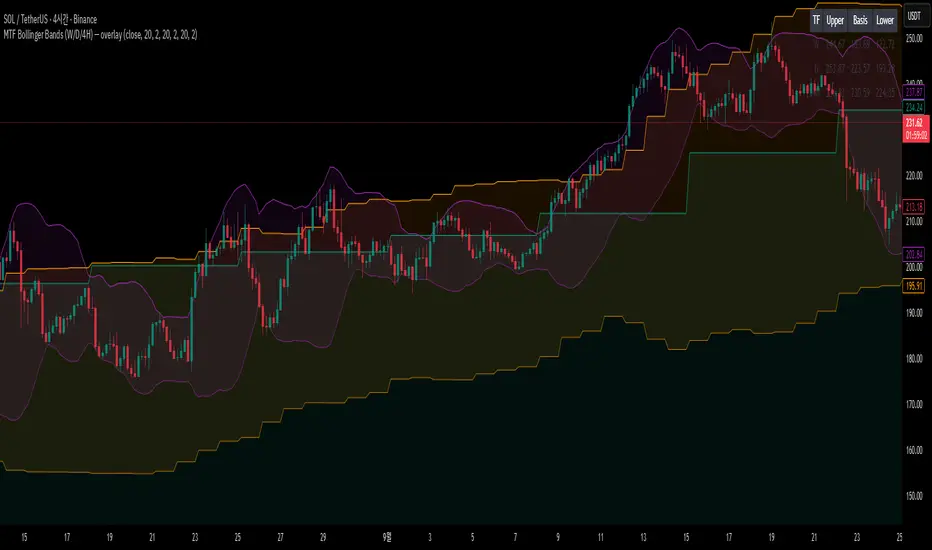
MTF Bollinger Bands (W/D/4H)MTF Bollinger Bands (W/D/4H)
Always mark the 1W 1D 4H bolinger band regardless of the time frame.
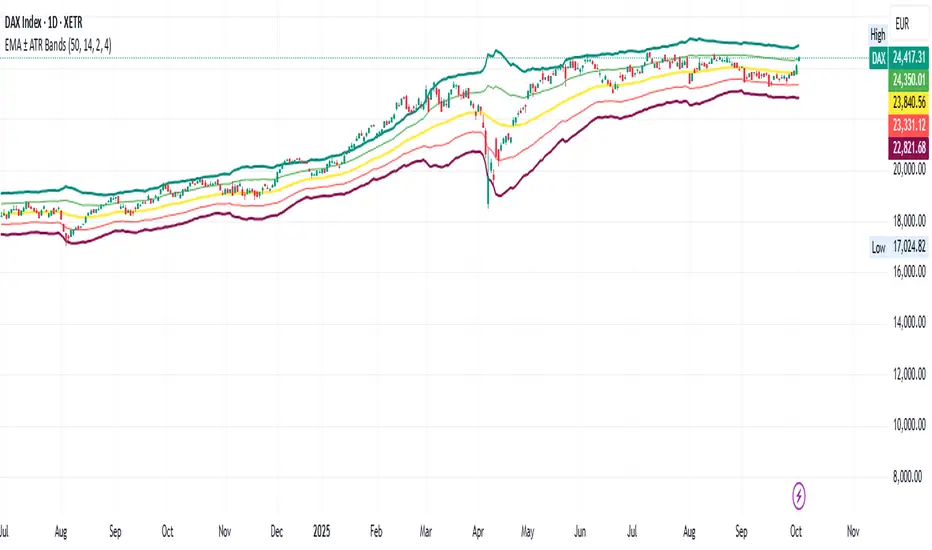
EMA ± ATR BandsPlot the bands from EMA as potential points where may want to enter/exit on principle that price returns to mean over time.
This script was created using Chat GPT.
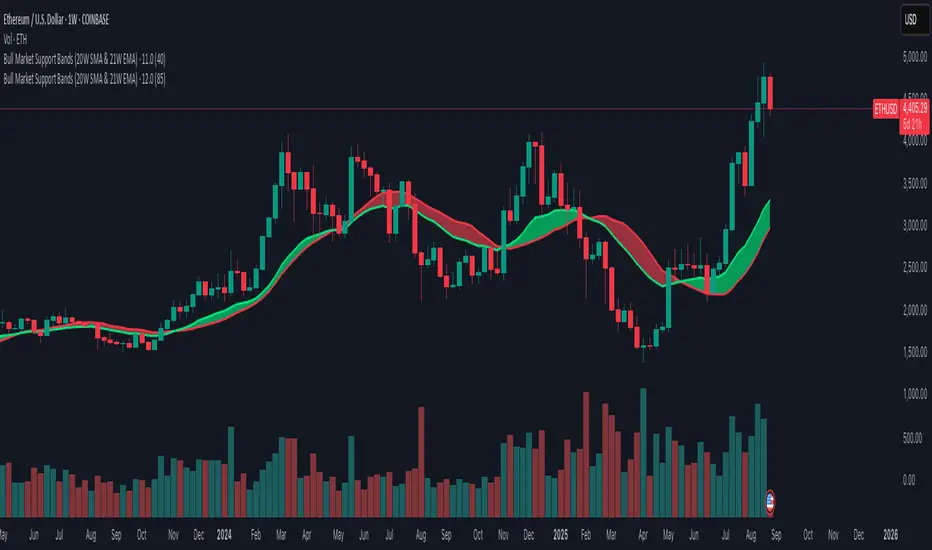
Bull Market Support Bands (20W SMA & 21W EMA)This indicator plots the 20-week Simple Moving Average (SMA) and the 21-week Exponential Moving Average (EMA), together forming the Bull Market Support Bands (BMSB).
Fully compatible with any chart; values are calculated using the weekly timeframe, even if applied on daily charts.
Adjustable band transparency in settings.
Includes optional alerts when EMA crosses above/below SMA.

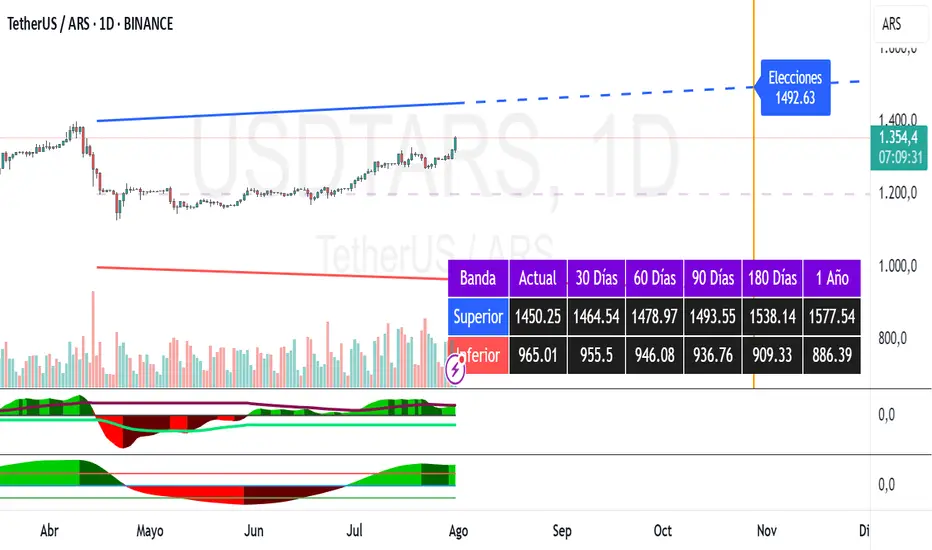
Dollar Bands [TNI]This script shows divergences bands implemented by Argentine Goverment this year for the Argentine Currency USDARS.
You can change the fix monthly and date/price init, and create upper or lower band cross alerts.
SYMPL Reversal BandsThis is an expansion of the Hybrid moving average. It uses the same hybrid moving code from the hybrid moving average script with an additional layer using the ta.hma function for some slight additional smoothing. Colors of the bands change dynamically based of the long and short hybrid moving averages running in the background. This can be really helpful in identifying periods to short bounces or long dips.
Below is the explanation of the hybrid moving average
Hybrid Moving Average Market Trend System - , designed to visualize market trends using a combination of three moving averages: FRAMA (Fractal Adaptive Moving Average), VIDYA (Variable Index Dynamic Average), and a Hamming windowed Volume-Weighted Moving Average (VWMA).
Key Features:
FRAMA Calculation:
FRAMA adapts to market volatility by dynamically adjusting its smoothing factor based on the fractal dimension of price movement. This allows it to be more responsive during trending periods while filtering out noise in sideways markets. The FRAMA is calculated for both short and long periods
VIDYA with CMO:
The VIDYA (Variable Index Dynamic Average) is based on a Chande Momentum Oscillator (CMO), which adjusts the smoothing factor dynamically depending on the momentum of the market. Higher momentum periods result in more responsive averages, while low momentum periods lead to smoother averages. Like FRAMA, VIDYA is calculated for both short and long periods.
Hamming Windowed VWMA:
This VWMA variation applies a Hamming window to smooth the weighting of volume across the calculation period. This method emphasizes central data points and reduces noise, making the VWMA more adaptive to volume fluctuations. The Hamming VWMA is calculated for short and long periods, offering another layer of adaptability to the hybrid moving average.
Hybrid Moving Averages:
Dynamic Coloring and Filling:
The script uses dynamic color transitions to visually distinguish between bullish and bearish conditions:

Bollinger Bands Width TresholdsBasic Bollinger Bands Bandwidth. I added dashed lines to indicate the 6%/9% treshold where it's likely to squeeze.
