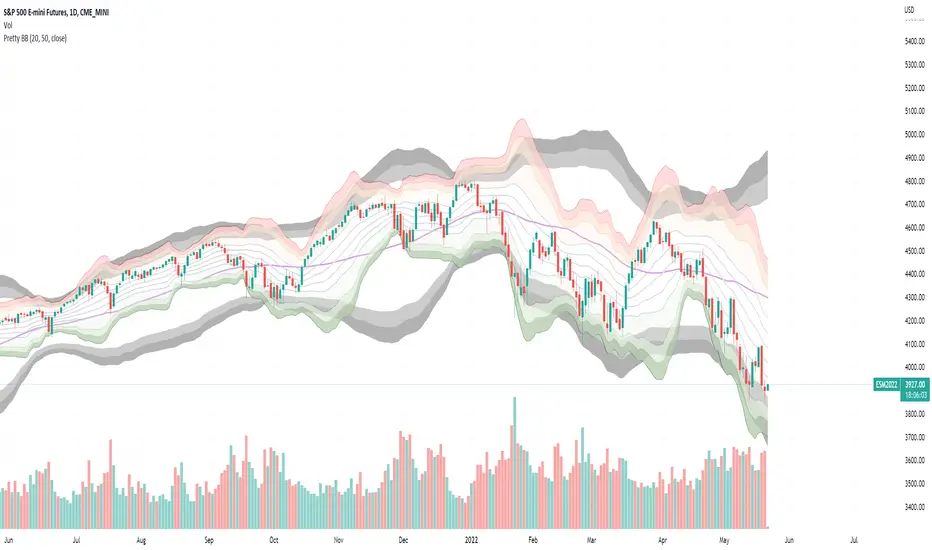
Pretty BollingersScheme shamelessly stolen from BORC. A pretty depiction of bollinger bands. Short basis plots from 5., 1, 2 (lines) deviations and then 2, 2.5, 3 (colored bands). Long basis plots only the basis, and 2, 2.5 and 3 bands (gray).
"band" için komut dosyalarını ara
ATR Overlay with Trailing Flip [ask2maniish]📘 ATR Overlay with Trailing Flip
🔍 Overview
The ATR Overlay with Trailing Flip is a dynamic, visually-enhanced overlay indicator designed to assist traders in trend detection, trailing stop management, and volatility-based decision making. It leverages the Average True Range (ATR) with optional dynamic multipliers, filters, and alerts to enhance trade execution precision.
⚙️ Features Summary
✅ Static & dynamic ATR multiplier
✅ Customizable trailing stop logic
✅ Volume & Bollinger Band filters
✅ Buy/Sell label signals with alerts
✅ ATR bands with color fill
✅ Optional candle coloring based on trend
✅ Table showing current ATR multiplier
✅ Fully customizable visual controls
🔧 User Inputs
📘 Info Panel
ATR Usage Guide
Tooltip with trading-style recommendations:
Scalping: ATR 5–10, Intraday: ATR 10–14 , Swing: ATR 14–21 , Position: ATR 21–50
📊 Visual Elements
📈 Plots
Upper/Lower ATR Bands
ATR Fill Zone
Dynamic Trailing Stop Line
🕯 Candle Coloring
Candles colored green (uptrend) or red (downtrend)
Wick coloring matches body
🏷 Signal Labels
"BUY" below candle when trend flips up
"SELL" above candle when trend flips down
📊 Table (Top Right)
Displays current multiplier value:
If static: Static: x.x
If dynamic: percentage format based on ATR ratio
🔔 Alerts
Two alert conditions:
Flip to Long → "📈 ATR flip to LONG"
Flip to Short → "📉 ATR flip to SHORT"
Sound can be enabled for real-time feedback.
🧠 Best Practices
Combine this tool with support/resistance or order flow indicators
Use dynamic ATR during volatile periods for better adaptability
Filter signals in ranging markets with BBand Width Filter
For scalping, reduce ATR period and multiplier for tighter risk
🛠️ Customization Tips
Adjust trailingPeriod for tighter/looser stops
Use color inputs to match your charting theme
Disable features (labels/fill) to declutter chart

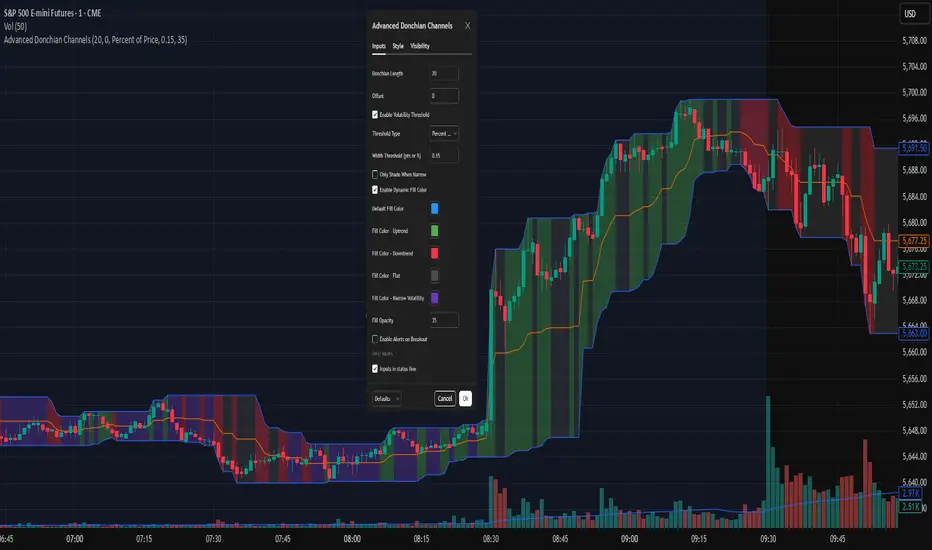
Advanced Donchian ChannelsJust an indicator I got ChatGPT to cook up for my own use, sharing it in case anyone else finds it useful. I have included a screenshot of my own settings as well for reference.
This indicator enhances the classic Donchian Channel with powerful contextual features to support modern breakout and volatility-based trading strategies.
🔹 Core Features:
Donchian Bands: Plots the highest high and lowest low over a configurable lookback period.
Dynamic Fill Shading:
- Color-coded based on the slope of the midline (Basis): Default settings are Green for uptrend, Red for downtrend, Silver for flat, Gray for narrow volatility.
- All fill colors are fully customizable.
Volatility Filter:
- Detects when the channel width is narrow using either a fixed value or a percentage of price.
- Optionally shades only during low-volatility (compression) periods.
Customizable Style:
- Adjustable opacity, offsets, and color settings to suit your charting style.
🛠 Use Cases:
- Spot potential breakout setups after periods of low volatility.
- Identify trend direction via basis slope shading.
- Combine with momentum or volume tools for high-probability entries.
Multi VWAP for Wick HunterCredit: honeybadgermakesfunnymoney for this Open Source Script
Published:
This is a tool that will allow you to visualize Wick Hunter's calcation of VWAP. Wick Hunter uses this calcuation for its Liqudations Bots.
There are four settings that you need to be configured to visualize your VWAP Band:
Long VWAP - The distance from current VWAP price, in %, that price must be UNDER when a liquidation event occurs to meet your you VWAP condition. The higher the value, the more price must move below the current VWAP price for it to enter a LONG position.
Short VWAP - The distance from current VWAP price, in %, that price must be ABOVE when a liquidation event occurs to meet your you VWAP condition. The higher the value, the more price must move above the current VWAP price for it to enter a SHORT position.
VWAP Timeframe - Select the timeframe you want the VWAP to be measured on.
VWAP Periods: Input the time period over which you want the VWAP to be measured over. For example, if you use "5" for this and "15" for VWAP Timeframe. The VWAP will be calculated based on the last five 15 minute candles.
You can play around with these settings using the indicator provide above. The indicator will print a triangle when the conditon for VWAP is met for a long for short trade. Play around with these settings. A few good timeframes that are popular are 5 minute, 15 minute, and one hour (60 minute). As far as periods, the most common settings are between 5 periods and 15 periods. In general the lower the timeframe and periods and closer VWAP will follow price.

PUBG//Pluto star appears on a chart when price goes in the in the extreme price range territory, i.e. beyond 2 standard deviation from the mean (or mid Bollinger Band).
//What makes a Pluto Star appear on a chart:
//1. Check if the candle 's' high and low, both are completely outside of the Bollinger Bands (close, 20, 2) - Lets call it Pluto Star Candle
//2. Pluto Star Candle must not be a result of sudden price movement. Hence the previous candle must give a BB Blast.
// In other words, the candle must have it's either open or close outside of Bollinger Bands, to confirm a BB Blast before the Pluto Star
//3. Candle, following the Pluto Star must not break the high (in case of upper BB i.e. short call) or low (in case of lower BB, i.e. long call), to confirm the reversal to the mean
// This implies that Pluto Star appears on chart, above/below the next candle of actual Pluto Star Candle

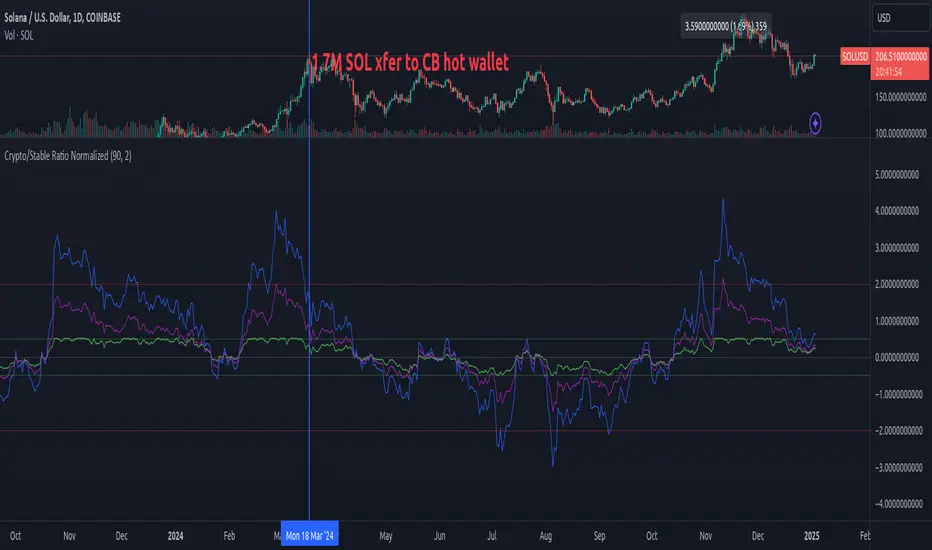
Crypto/Stable Mcap Ratio NormalizedCreate a normalized ratio of total crypto market cap to stablecoin supply (USDT + USDC + DAI). Idea is to create a reference point for the total market cap's position, relative to total "dollars" in the crypto ecosystem. It's an imperfect metric, but potentially helpful. V0.1.
This script provides four different normalization methods:
Z-Score Normalization:
Shows how many standard deviations the ratio is from its mean
Good for identifying extreme values
Mean-reverting properties
Min-Max Normalization:
Scales values between 0 and 1
Good for relative position within recent range
More sensitive to recent changes
Percent of All-Time Range:
Shows where current ratio is relative to all-time highs/lows
Good for historical context
Less sensitive to recent changes
Bollinger Band Position:
Similar to z-score but with adjustable sensitivity
Good for trading signals
Can be tuned via standard deviation multiplier
Features:
Adjustable lookback period
Reference bands for overbought/oversold levels
Built-in alerts for extreme values
Color-coded plots for easy visualization
BanditExperimental %R and Moving Average Bands. This is just for fun :)
Comment below if you spot a good pattern to trade.

Plot_4_Key_LevelsBollinger Bands (upper & lower)
- computes 12-bar Bollinger Bands on the chart’s current timeframe, with a 3σ (standard-deviation) multiplier.
- computes vwap
- computes VWMA(HL2, 36)—a smoothed, volume-weighted average price—plotted as a line.

BTC Fair Value via Global Liquidity📈 BTC Fair Value via Global Liquidity
This indicator estimates Bitcoin's fair value based on a regression model using Global Liquidity (GLI) data from major central banks.
🔍 How it works:
Fair Value Line (orange): Calculated using a power-law model: Fair Value = e^b * (GLI)^a, where a and b are user-defined parameters based on historical regression.
Global Liquidity (GLI): Combines liquidity metrics from central banks (Fed, ECB, PBoC, BoJ, etc.), including adjustments for the RRP and TGA.
Deviation Bands (green/red dashed): Optional upper and lower bands showing % deviation from fair value (default ±25%). These help identify overbought/oversold conditions.
Delta Plot (gray dots): Displays the % deviation of BTC’s price from its modeled fair value.
⚙️ How to use:
Tune a and b for better model fitting (e.g., via log-log regression).
Use the deviation bands to identify potential entry/exit zones or periods of market inefficiency.
Ideal for macro-level BTC valuation and long-term strategic analysis.

Bollinger + EMA Strategy with StatsThis strategy is a mean-reversion trading model that combines Bollinger Band deviation entries with EMA-based exits. It enters a long position when the price drops significantly below the lower Bollinger Band by a user-defined multiple of standard deviation (x), and a short position when the price exceeds the upper band by the same logic. To manage risk, it uses a wider Bollinger Band threshold (y standard deviations) as a stop loss, while take profit occurs when the price reverts to the n-period EMA, indicating mean reversion. The strategy maintains only one active position at a time—either long or short—and allocates a fixed percentage of capital per trade. Performance metrics such as equity curve, drawdown, win rate, and total trades are tracked and displayed for backtesting evaluation.

RVWAP ENHANCED**Rolling VWAP with Alerts and Markers**
This Pine Script indicator enhances the traditional Rolling VWAP (Relative Volume Weighted Average Price) by adding dynamic features for improved visualization and alerting.
### Features:
1. **Dynamic VWAP Line Coloring**:
- The VWAP line changes color based on the relationship with the closing price:
- **Green** when the price is above the VWAP.
- **Red** when the price is below the VWAP.
2. **Candle and Background Coloring**:
- **Candles**: Colored green if the close is above the VWAP and red if below.
- **Background**: Subtle green or red shading indicates the price’s position relative to the VWAP.
3. **Alerts**:
- Alerts notify users when the VWAP changes direction:
- "VWAP Turned Green" for price crossing above the VWAP.
- "VWAP Turned Red" for price crossing below the VWAP.
4. **Small Dot Markers**:
- Tiny dots are plotted below the candles to mark VWAP state changes:
- **Green dot** for VWAP turning green.
- **Red dot** for VWAP turning red.
5. **Custom Time Period**:
- Users can select either a dynamic time period based on the chart's timeframe or a fixed time period (customizable in days, hours, and minutes).
6. **Standard Deviation Bands (Optional)**:
- Standard deviation bands around the VWAP can be enabled for further analysis.
This script is designed to provide clear and actionable insights into market trends using the RVWAP, making it an excellent tool for traders who rely on volume-based price action analysis.

Post-Open Long Strategy with ATR-based Stop Loss and Take ProfitThe "Post-Open Long Strategy with ATR-Based Stop Loss and Take Profit" is designed to identify buying opportunities after the German and US markets open. It combines various technical indicators to filter entry signals, focusing on breakout moments following price lateralization periods.
Key Components and Their Interaction:
Bollinger Bands (BB):
Description: Uses BB with a 14-period length and standard deviation multiplier of 1.5, creating narrower bands for lower timeframes.
Role in the Strategy: Identifies low volatility phases (lateralization). The lateralization condition is met when the price is near the simple moving average of the BB, suggesting an imminent increase in volatility.
Exponential Moving Averages (EMA):
10-period EMA: Quickly detects short-term trend direction.
200-period EMA: Filters long-term trends, ensuring entries occur in a bullish market.
Interaction: Positions are entered only if the price is above both EMAs, indicating a consolidated positive trend.
Relative Strength Index (RSI):
Description: 7-period RSI with a threshold above 30.
Role in the Strategy: Confirms the market is not oversold, supporting the validity of the buy signal.
Average Directional Index (ADX):
Description: 7-period ADX with 7-period smoothing and a threshold above 10.
Role in the Strategy: Assesses trend strength. An ADX above 10 indicates sufficient momentum to justify entry.
Average True Range (ATR) for Dynamic Stop Loss and Take Profit:
Description: 14-period ATR with multipliers of 2.0 for Stop Loss and 4.0 for Take Profit.
Role in the Strategy: Adjusts exit levels based on current volatility, enhancing risk management.
Resistance Identification and Breakout:
Description: Analyzes the highs of the last 20 candles to identify resistance levels with at least two touches.
Role in the Strategy: A breakout above this level signals a potential continuation of the bullish trend.
Time Filters and Market Conditions:
Trading Hours: Operates only during the opening of the German market (8:00 - 12:00) and US market (15:30 - 19:00).
Panic Candle: The current candle must close negative, leveraging potential emotional reactions in the market.
Avoiding Entry During Pullbacks:
Description: Checks that the two previous candles are not both bearish.
Role in the Strategy: Avoids entering during a potential pullback, improving trade success probability.
Post-Open Long Strategy with ATR-Based Stop Loss and Take Profit
The "Post-Open Long Strategy with ATR-Based Stop Loss and Take Profit" is designed to identify buying opportunities after the German and US markets open. It combines various technical indicators to filter entry signals, focusing on breakout moments following price lateralization periods.
Key Components and Their Interaction:
Bollinger Bands (BB):
Description: Uses BB with a 14-period length and standard deviation multiplier of 1.5, creating narrower bands for lower timeframes.
Role in the Strategy: Identifies low volatility phases (lateralization). The lateralization condition is met when the price is near the simple moving average of the BB, suggesting an imminent increase in volatility.
Exponential Moving Averages (EMA):
10-period EMA: Quickly detects short-term trend direction.
200-period EMA: Filters long-term trends, ensuring entries occur in a bullish market.
Interaction: Positions are entered only if the price is above both EMAs, indicating a consolidated positive trend.
Relative Strength Index (RSI):
Description: 7-period RSI with a threshold above 30.
Role in the Strategy: Confirms the market is not oversold, supporting the validity of the buy signal.
Average Directional Index (ADX):
Description: 7-period ADX with 7-period smoothing and a threshold above 10.
Role in the Strategy: Assesses trend strength. An ADX above 10 indicates sufficient momentum to justify entry.
Average True Range (ATR) for Dynamic Stop Loss and Take Profit:
Description: 14-period ATR with multipliers of 2.0 for Stop Loss and 4.0 for Take Profit.
Role in the Strategy: Adjusts exit levels based on current volatility, enhancing risk management.
Resistance Identification and Breakout:
Description: Analyzes the highs of the last 20 candles to identify resistance levels with at least two touches.
Role in the Strategy: A breakout above this level signals a potential continuation of the bullish trend.
Time Filters and Market Conditions:
Trading Hours: Operates only during the opening of the German market (8:00 - 12:00) and US market (15:30 - 19:00).
Panic Candle: The current candle must close negative, leveraging potential emotional reactions in the market.
Avoiding Entry During Pullbacks:
Description: Checks that the two previous candles are not both bearish.
Role in the Strategy: Avoids entering during a potential pullback, improving trade success probability.
Entry and Exit Conditions:
Long Entry:
The price breaks above the identified resistance.
The market is in a lateralization phase with low volatility.
The price is above the 10 and 200-period EMAs.
RSI is above 30, and ADX is above 10.
No short-term downtrend is detected.
The last two candles are not both bearish.
The current candle is a "panic candle" (negative close).
Order Execution: The order is executed at the close of the candle that meets all conditions.
Exit from Position:
Dynamic Stop Loss: Set at 2 times the ATR below the entry price.
Dynamic Take Profit: Set at 4 times the ATR above the entry price.
The position is automatically closed upon reaching the Stop Loss or Take Profit.
How to Use the Strategy:
Application on Volatile Instruments:
Ideal for financial instruments that show significant volatility during the target market opening hours, such as indices or major forex pairs.
Recommended Timeframes:
Intraday timeframes, such as 5 or 15 minutes, to capture significant post-open moves.
Parameter Customization:
The default parameters are optimized but can be adjusted based on individual preferences and the instrument analyzed.
Backtesting and Optimization:
Backtesting is recommended to evaluate performance and make adjustments if necessary.
Risk Management:
Ensure position sizing respects risk management rules, avoiding risking more than 1-2% of capital per trade.
Originality and Benefits of the Strategy:
Unique Combination of Indicators: Integrates various technical metrics to filter signals, reducing false positives.
Volatility Adaptability: The use of ATR for Stop Loss and Take Profit allows the strategy to adapt to real-time market conditions.
Focus on Post-Lateralization Breakout: Aims to capitalize on significant moves following consolidation periods, often associated with strong directional trends.
Important Notes:
Commissions and Slippage: Include commissions and slippage in settings for more realistic simulations.
Capital Size: Use a realistic trading capital for the average user.
Number of Trades: Ensure backtesting covers a sufficient number of trades to validate the strategy (ideally more than 100 trades).
Warning: Past results do not guarantee future performance. The strategy should be used as part of a comprehensive trading approach.
With this strategy, traders can identify and exploit specific market opportunities supported by a robust set of technical indicators and filters, potentially enhancing their trading decisions during key times of the day.


Bollinger Stop StrategyClassic trading strategy using the Bollinger Bands indicator.
Strategy
Only stop orders are used to enter and exit the market.
If the price crossed the upper boundary of the Bollinger Bands, then enter into a long position (and close a short position).
If the price crosses the bottom of the Bollinger Bands, then enter short (and close a long position).
Short positions can be disabled (optional).
For
Crypto-currency market
Preferably coin/fiat (BTC/USD, ETH/USDT, etc)
Timeframe 1 day only
Settings
The original settings for the Bollinger Bands indicator are set by default.
Perhaps a better result will be if you use non-original price source.
Works well with OHLC4 and HLCC4.

ajish Dual Awesome Oscillators with Bollinger Bandsthis is one of best oscillator for identify the trend .this oscillator is well working in index. it has upper limit and lower limit and it will helps you for trend continuation ,and trend reversal

Master Simple Indicator 2.0Master Simple Indicator 2.0 combines dynamic moving average signals with ATR-based price bands. It plots a volatility range around the current price using customizable ATR length, smoothing, and multiplier settings, while also highlighting long/short opportunities when price crosses a 120-period moving average. Visual cues and alerts help identify momentum shifts, trend direction, and potential trade entries across all timeframes.

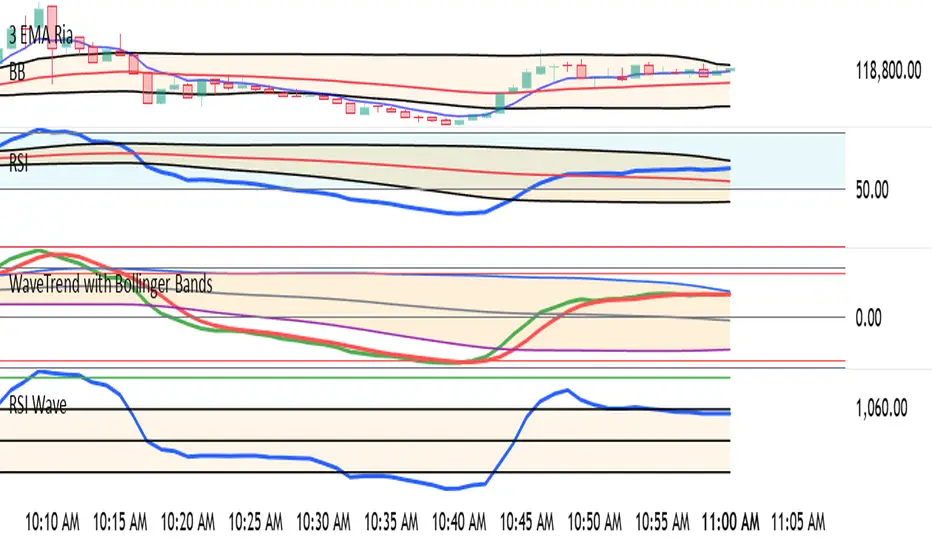
WaveTrend with Bollinger BandsPlots TTM Squeeze momentum histogram (green/red).
Plots RSI (blue) in the same pane.
Shows squeeze dots and RSI overbought/oversold lines.
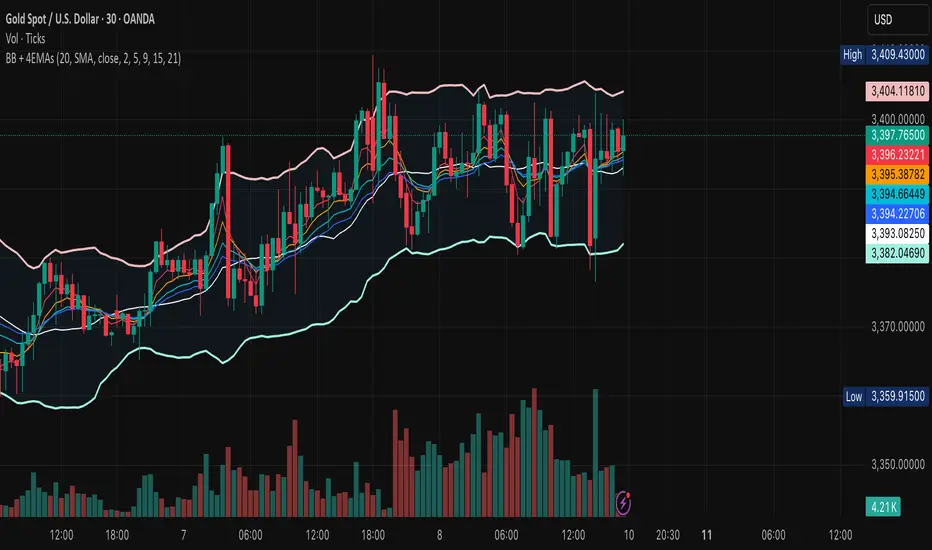
BB + 4 EMAsCustom Bollinger Bands with 4EMAs of your choice. All added in one indicator.
Look Before You Leap!

AUD/USD 1-Min Scalping Strategy with LabelsHere’s a complete TradingView Pine Script v5 for the 1-minute AUD/USD scalping strategy we just discussed. This strategy uses:
EMA 13 and EMA 26 for trend filtering
Bollinger Bands for volatility extremes
RSI (4) for momentum confirmation

Double Bollinger Bands - SF2000twin BB's. One bb can be set for , eg 20 period. The other set for - eg - 50 period. compare the channels.
Intraday Combo Strategy HHStochastic RSI Momentum/Reversal quickly identifies overbought/oversold zones
MACD Momentum/Trend confirms a trend reversal, a late but powerful signal
Supertrend Trend Tracking provides clear and concise buy/sell signals
Bollinger Bands Volatility shows price deviation during breakouts/squeezes
ADX Trend Strength measures trend strength to filter out false signals
