Trend-Adaptive 3-Band Reversal CloudThis indicator plots a trend-adaptive, volatility-based 3-band cloud on your chart to visually contextualize potential high-probability reversal, balance, and exhaustion price zones — all in strict alignment with TradingView’s house rules and best compliance practices.
How It Works
Trend Detection:
The script determines short-term trend direction using two adjustable EMAs (fast and slow). When the fast EMA is above the slow, the environment is classified as an uptrend; when below, as a downtrend.
Adaptive Bands and Clouds:
Around the dynamic trend baseline, three cloud “bands” are drawn using multiples of an ATR (Average True Range) volatility filter, automatically adjusting for evolving market conditions:
Middle Band (Fair Value Zone): Area around the baseline, where price is statistically balanced.
Upper Outer Band: In an uptrend, this shows a potential 'exhaustion/overextension' area; in a downtrend, it can act as a deep pullback or reversal area.
Lower Outer Band: In an uptrend, this highlights a possible 'deep pullback/reversal' area; in a downtrend, it becomes the potential exhaustion zone.
Contextual RSI Markers:
When price is in one of the outer bands and RSI is overbought (upper) or oversold (lower), a tiny diamond marker appears on that band as extra context — offering a visual cue for a possible high-momentum exhaustion or deep reversal zone, but never a trade signal or advice.
Visuals and Compliance:
All cloud regions use three different, semi-transparent colors for easy reading, and never block price action.
Labels indicate only “Possible Exhaustion,” “Deep Pullback Zone,” and “Balanced/Fair Value”—the language is strictly neutral and descriptive.
All calculations run only on confirmed, historical bars with zero repainting, no future bar lookahead, and no predictive overlays.
How to Use
Add to Chart:
Simply add the indicator to any chart and timeframe.
Configure:
Adjust the EMA, ATR, and RSI settings via the input panel to best fit your instrument and preferred sensitivity.
Choose band multipliers to widen or contract the cloud according to volatility or your system.
Toggle RSI marker/context highlighting as desired.
Interpretation:
Middle Cloud (“Balanced/Fair Value”): Price in this zone suggests mean reversion, equilibrium, or fair pricing for the session’s volatility/trend conditions.
Outer Clouds: If price reaches an outer cloud, pay attention for potential mean-reversion (if trend persists) or exhaustion zones (especially if a diamond appears).
Uptrend: Lower cloud is where larger pullbacks/reversals are often initiated; upper cloud indicates potential trend exhaustion.
Downtrend: Upper and lower clouds are reversed in interpretation.
Diamond Markers: A red diamond atop the upper band signifies RSI overbought; a lime diamond below the lower band shows RSI oversold. These do not recommend trading—only highlight increased likelihood that buyers/sellers may be overextended.
Best Practices:
Do not use the indicator in isolation or as a signal generator. Combine its context with price action confirmation, volume, or other non-repainting tools.
Use labels only for navigation/context, never as actionable advice.
Technical Details
Inputs/Customization: Fully adjustable (EMAs, ATR period, band multipliers, RSI thresholds, label/marker toggles).
Logic: All code processes only historical closed bars and overlays information in real time.
No repaint, strategy, or alerts: No signals, no script-driven trading, and no claims of prediction or guaranteed probability.
House-rule Clean: The script and its visuals are compliant with TradingView’s publishing requirements, both visually and textually.
Summary:
This tool is designed for traders who want to visually frame high-probability reversal, equilibrium, and exhaustion zones adaptively—while keeping price action primary and avoiding visual or conceptual clutter. Use it to better understand where price may statistically find resistance/support or revert, not to automate signals or guarantee outcomes
"band" için komut dosyalarını ara

Bollinger Band + Mid BandBollinger Band + Mid Band
This indicator combines the classic Bollinger Bands with enhanced customization options, allowing traders to fine-tune the settings according to their specific strategies.
Key Features:
Moving Average Flexibility: Choose between Simple Moving Average (SMA), Exponential Moving Average (EMA), or Weighted Moving Average (WMA) as the central basis for the Bollinger Bands. This flexibility allows you to align the indicator with your preferred method of trend analysis.
Dual Band Deviation: The indicator includes two sets of upper and lower bands based on different standard deviation multipliers. This helps you analyze both the tightness of price action and potential breakout zones.
Customizable Colors: The mid-band, upper bands, and lower bands can be fully customized in terms of color, allowing you to personalize the visual representation of the indicator on your charts.
Dynamic Transparency: The space between the outer Bollinger Bands can be filled with a customizable transparent color, making it easy to visualize price movements within the bands.
Alerts for Crossovers: Alerts are triggered whenever the price crosses above the upper band or below the lower band, giving you timely notifications of potential breakout or breakdown scenarios.
Overbought/Oversold Visualization: The background of the chart changes color when the price crosses above the upper band (indicating overbought conditions) or below the lower band (indicating oversold conditions), providing a visual cue to help you identify market extremes.
Labeling for Significant Events: Labels appear on the chart whenever the price crosses the upper or lower bands, helping you quickly identify key moments for further analysis.
This script is designed for traders who want to leverage Bollinger Bands in their technical analysis but require additional flexibility and customization options. Whether you're using it for trend analysis, volatility assessment, or identifying overbought and oversold conditions, this tool can be tailored to fit a wide variety of trading styles.
Usage:
Ideal for traders looking to enhance the standard Bollinger Bands with more dynamic and customizable features.
Suitable for any market, including stocks, forex, and cryptocurrencies.
Useful in identifying volatility squeezes, breakouts, and potential reversal points.

Multi Timeframe Bollinger Bands Spectrum [Ata]Multi-Timeframe Bollinger Bands Spectrum
Technical Overview
This script integrates multi-timeframe volatility analysis with volume-derived order flow estimation. By combining Bollinger Bands (statistical deviation) with internal candle volume logic, the indicator qualifies price movements to differentiate between sustained trends, reversals, and exhaustion events.
The system is designed to provide a structural context for price action, visualizing market regimes through a dual-zone spectrum and filtering signals based on the interaction between price location and specific volume thresholds.
Core Logic & Calculation
1. Volume Decomposition Algorithm
Instead of using total volume, the script estimates Buying Pressure vs. Selling Pressure based on the close position relative to the candle's High/Low range:
- Buying Volume (vb): Increases as the close approaches the High.
- Selling Volume (vs): Increases as the close approaches the Low.
This logic allows the detection of directional flow even within standard volume bars.
2. Statistical Spectrum
The indicator renders deviations from the Basis (SMA) as two distinct zones:
- Bullish Zone (Blue): Price positioning between the Basis and Upper Band.
- Bearish Zone (Red): Price positioning between the Basis and Lower Band.
This structure is applied across multiple timeframes (overlay) to visualize the macro trend context without noise.
3. Non-Repainting Execution
To ensure historical accuracy and reliability for backtesting, all higher-timeframe data is requested using "lookahead_off". Signals are confirmed only upon the closure of the respective timeframe's candle.
Signal Definitions
Signals are generated only when specific Volatility and Volume conditions intersect:
Reversal Setups (Reaction to Liquidity)
- WALL: Triggered when price rejects the Upper Band accompanied by Extreme Selling Volume (vs > Limit). This suggests active limit sell orders absorbing the rally.
- FLOOR: Triggered when price rejects the Lower Band accompanied by Extreme Buying Volume (vb > Limit). This suggests active limit buy orders absorbing the drop.
- ABSORP: Identifies absorption near the lower bands where selling pressure is met with passive buying (indicated by lower wicks and relative buy volume).
Momentum Setups (Trend Continuation)
- POWER: Validates a breakout above the Upper Band only if supported by Dominant Buying Volume and a strong candle body.
- PANIC: Validates a breakdown below the Lower Band only if supported by Dominant Selling Volume.
- TRAP: Marks failed breakouts where price exits the bands but volume analysis contradicts the move (e.g., low directional volume).
Exhaustion Setups (Statistical Extremes)
- CLIMAX/CRASH: Identifies anomalies where price deviates significantly from the mean (Extreme Deviation) or when volume reaches unsustainable levels relative to the average, often preceding a mean reversion.
Input Parameters
- Bollinger Logic: Configuration for Length and Standard Deviation Multiplier.
- Volume Thresholds: Adjustable factors for Minimum Volume (Trend) and Extreme Volume (Reversal/Climax).
- Timeframe Layers: Toggle visibility for up to 5 higher timeframes.
- Theme: Adjusts label contrast for Dark/Light backgrounds.
Disclaimer
This indicator is strictly for analytical purposes. It provides a visualization of past market data based on statistical and volumetric formulas. Users should apply their own risk management protocols.

Bollinger Bands Entry/Exit ThresholdsBollinger Bands Entry/Exit Thresholds
Author of enhancements: chuckaschultz
Inspired and adapted from the original 'Bollinger Bands Breakout Oscillator' by LuxAlgo
Overview
Pairs nicely with Contrarian 100 MA
The Bollinger Bands Entry/Exit Thresholds is a powerful momentum-based indicator designed to help traders identify potential entry and exit points in trending or breakout markets. By leveraging Bollinger Bands, this indicator quantifies price deviations from the bands to generate bullish and bearish momentum signals, displayed as an oscillator. It includes customizable entry and exit signals based on user-defined thresholds, with visual cues plotted either on the oscillator panel or directly on the price chart.
This indicator is ideal for traders looking to capture breakout opportunities or confirm trend strength, with flexible settings to adapt to various markets and trading styles.
How It Works
The Bollinger Bands Entry/Exit Thresholds calculates two key metrics:
Bullish Momentum (Bull): Measures the extent to which the price exceeds the upper Bollinger Band, expressed as a percentage (0–100).
Bearish Momentum (Bear): Measures the extent to which the price falls below the lower Bollinger Band, also expressed as a percentage (0–100).
The indicator generates:
Long Entry Signals: Triggered when the bearish momentum (bear) crosses below a user-defined Long Threshold (default: 40). This suggests weakening bearish pressure, potentially indicating a reversal or breakout to the upside.
Exit Signals: Triggered when the bullish momentum (bull) crosses below a user-defined Sell Threshold (default: 80), indicating a potential reduction in bullish momentum and a signal to exit long positions.
Signals are visualized as tiny colored dots:
Long Entry: Blue dots, plotted either at the bottom of the oscillator or below the price bar (depending on user settings).
Exit Signal: White dots, plotted either at the top of the oscillator or above the price bar.
Calculation Methodology
Bollinger Bands:
A user-defined Length (default: 14) is used to calculate an Exponential Moving Average (EMA) of the source price (default: close).
Standard deviation is computed over the same length, multiplied by a user-defined Multiplier (default: 1.0).
Upper Band = EMA + (Standard Deviation × Multiplier)
Lower Band = EMA - (Standard Deviation × Multiplier)
Bull and Bear Momentum:
For each bar in the lookback period (length), the indicator calculates:
Bullish Momentum: The sum of positive deviations of the price above the upper band, normalized by the total absolute deviation from the upper band, scaled to a 0–100 range.
Bearish Momentum: The sum of positive deviations of the price below the lower band, normalized by the total absolute deviation from the lower band, scaled to a 0–100 range.
Formula:
bull = (sum of max(price - upper, 0) / sum of abs(price - upper)) * 100
bear = (sum of max(lower - price, 0) / sum of abs(lower - price)) * 100
Signal Generation:
Long Entry: Triggered when bear crosses below the Long Threshold.
Exit: Triggered when bull crosses below the Sell Threshold.
Settings
Length: Lookback period for EMA and standard deviation (default: 14).
Multiplier: Multiplier for standard deviation to adjust Bollinger Band width (default: 1.0).
Source: Input price data (default: close).
Long Threshold: Bearish momentum level below which a long entry signal is generated (default: 40).
Sell Threshold: Bullish momentum level below which an exit signal is generated (default: 80).
Plot Signals on Main Chart: Option to display entry/exit signals on the price chart instead of the oscillator panel (default: false).
Style:
Bullish Color: Color for bullish momentum plot (default: #f23645).
Bearish Color: Color for bearish momentum plot (default: #089981).
Visual Features
Bull and Bear Plots: Displayed as colored lines with gradient fills for visual clarity.
Midline: Horizontal line at 50 for reference.
Threshold Lines: Dashed green line for Long Threshold and dashed red line for Sell Threshold.
Signal Dots:
Long Entry: Tiny blue dots (below price bar or at oscillator bottom).
Exit: Tiny white dots (above price bar or at oscillator top).
How to Use
Add to Chart: Apply the indicator to your TradingView chart.
Adjust Settings: Customize the Length, Multiplier, Long Threshold, and Sell Threshold to suit your trading strategy.
Interpret Signals:
Enter a long position when a blue dot appears, indicating bearish momentum dropping below the Long Threshold.
Exit the long position when a white dot appears, indicating bullish momentum dropping below the Sell Threshold.
Toggle Plot Location: Enable Plot Signals on Main Chart to display signals on the price chart for easier integration with price action analysis.
Combine with Other Tools: Use alongside other indicators (e.g., trendlines, support/resistance) to confirm signals.
Notes
This indicator is inspired by LuxAlgo’s Bollinger Bands Breakout Oscillator but has been enhanced with customizable entry/exit thresholds and signal plotting options.
Best used in conjunction with other technical analysis tools to filter false signals, especially in choppy or range-bound markets.
Adjust the Multiplier to make the Bollinger Bands wider or narrower, affecting the sensitivity of the momentum calculations.
Disclaimer
This indicator is provided for educational and informational purposes only.

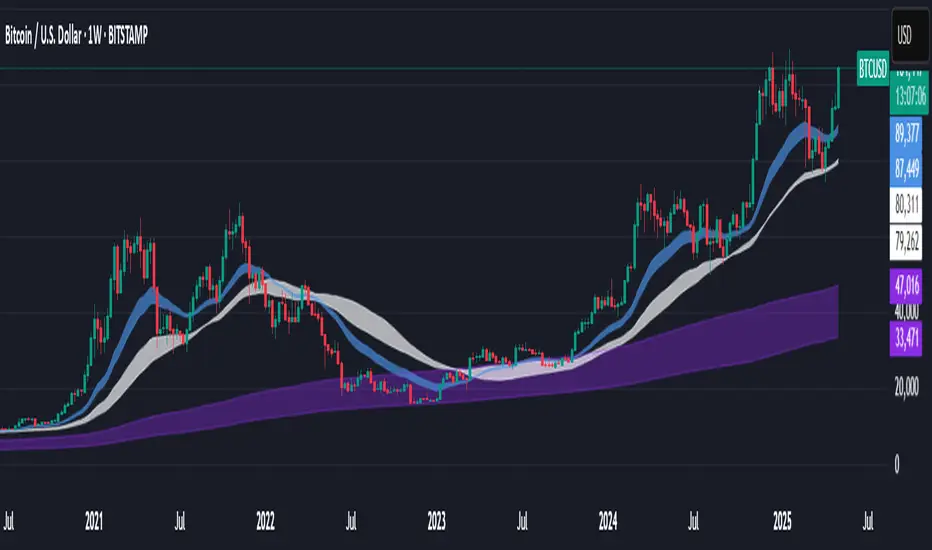
Support BandsSupport Bands – Discount Zones for Bitcoin
⚡Overview:
-The Support Bands indicator identifies one of the most tested and respected support zones for Bitcoin using moving averages from higher timeframes.
-These zones are visualized through colored bands (blue, white, and violet), simplifying the decision making process especially for less experienced traders who seek high-probability areas to accumulate Bitcoin during retracements.
-Band levels are based on manual backtesting and real-world price behavior throughout Bitcoin’s history.
-Each zone reflects a different degree of support strength, from temporary pullback zones to historical bottoms.
⚡️ Key Characteristics:
-Highlights discount zones where Bitcoin has historically shown strong reactions.
-Uses 3 different levels of supports based on EMA/SMA combinations.
-Offers a clean, non-intrusive overlay that reduces chart clutter.
⚡ How to Use:
-Open your chart on the 1W timeframe and select the BTC Bitstamp or BLX symbol, as they provide the most complete historical data, ensuring optimal performance of the indicator.
-Use the bands as reference zones for support and potential pullbacks.
- Level 3 (violet band) historically marks the bottom of Bitcoin bear markets and is ideal for long-term entries during deep corrections.
- Level 2 (white band) often signals macro reaccumulation zones but usually requires 1–3 months of consolidation before a breakout. If the price closes below and then retests this level as resistance for 1–2 weekly candles, it often marks the start of a macro downtrend.
-Level 1 (blue band) acts as short-term support during strong bullish moves, typically after a successful rebound from Level 2.
⚡ What Makes It Unique:
- This script merges moving averages per level into three simplified bands for clearer analysis.
-Reduces chart noise by avoiding multiple overlapping lines, helping you make faster and cleaner decisions.
- Built from manual market study based on recurring Bitcoin behavior, not just random code.
-Historically backtested:
-Level 3 (violet band) until today has always marked the bitcoin bearmarket bottom.
- Level 2 (white band) is the strongest support during bull markets; losing it often signals a macro trend reversal.
- Level 1 is frequently retested during impulsive rallies and can act as short-term support or resistance.
⚡ Disclaimer:
-This script is a visual tool to assist with market analysis.
-It does not generate buy or sell signals, nor does it predict future movements.
-Historical performance is not indicative of future results.
-Always use independent judgment and proper risk management.
⚡ Why Use Support Bands:
-Ideal for traders who want clarity without dozens of lines on their charts.
- Helps identify logical zones for entry or reaccumulation.
- Based on actual market behavior rather than hypothetical setups.
-If the blue band (Level 1) doesn't hold as support, the price often moves to the white band (Level 2), and if that fails too, the violet band (Level 3) is typically the last strong support. By dividing your capital into three planned entries, one at each level,you can manage risk more effectively compared to entering blindly without this structure.
VWAP Bands with ML [CryptoSea]VWAP Machine Learning Bands is an advanced indicator designed to enhance trading analysis by integrating VWAP with a machine learning-inspired adaptive smoothing approach. This tool helps traders identify trend-based support and resistance zones, predict potential price movements, and generate dynamic trade signals.
Key Features
Adaptive ML VWAP Calculation: Uses a dynamically adjusted SMA-based VWAP model with volatility sensitivity for improved trend analysis.
Forecasting Mechanism: The 'Forecast' parameter shifts the ML output forward, providing predictive insights into potential price movements.
Volatility-Based Band Adjustments: The 'Sigma' parameter fine-tunes the impact of volatility on ML smoothing, adapting to market conditions.
Multi-Tier Standard Deviation Bands: Includes two levels of bands to define potential breakout or mean-reversion zones.
Dynamic Trend-Based Colouring: The VWAP and ML lines change colour based on their relative positions, visually indicating bullish and bearish conditions.
Custom Signal Detection Modes: Allows traders to choose between signals from Band 1, Band 2, or both, for more tailored trade setups.
In the image below, you can see an example of the bands on higher timeframe showing good mean reversion signal opportunities, these tend to work better in ranging markets rather than strong trending ones.
How It Works
VWAP & ML Integration: The script computes VWAP and applies a machine learning-inspired adjustment using SMA smoothing and volatility-based adaptation.
Forecasting Impact: The 'Forecast' setting shifts the ML output forward in time, allowing for anticipatory trend analysis.
Volatility Scaling (Sigma): Adjusts the ML smoothing sensitivity based on market volatility, providing more responsive or stable trend lines.
Trend Confirmation via Colouring: The VWAP line dynamically switches colour depending on whether it is above or below the ML output.
Multi-Level Band Analysis: Two standard deviation-based bands provide a framework for identifying breakouts, trend reversals, or continuation patterns.
In the example below, we can see some of the most reliable signals where we have mean reversion signals from the band whilst the price is also pulling back into the VWAP, these signals have the additional confluence which can give you a higher probabilty move.
Alerts
Bullish Signal Band 1: Alerts when the price crosses above the lower ML Band 1.
Bearish Signal Band 1: Alerts when the price crosses below the upper ML Band 1.
Bullish Signal Band 2: Alerts when the price crosses above the lower ML Band 2.
Bearish Signal Band 2: Alerts when the price crosses below the upper ML Band 2.
Filtered Bullish Signal: Alerts when a bullish signal is triggered based on the selected signal detection mode.
Filtered Bearish Signal: Alerts when a bearish signal is triggered based on the selected signal detection mode.
Application
Trend & Momentum Analysis: Helps traders identify key market trends and potential momentum shifts.
Dynamic Support & Resistance: Standard deviation bands serve as adaptive price zones for potential breakouts or reversals.
Enhanced Trade Signal Confirmation: The integration of ML smoothing with VWAP provides clearer entry and exit signals.
Customizable Risk Management: Allows users to adjust parameters for fine-tuned signal detection, aligning with their trading strategy.
The VWAP Machine Learning Bands indicator offers traders an innovative tool to improve market entries, recognize potential reversals, and enhance trend analysis with intelligent data-driven signals.

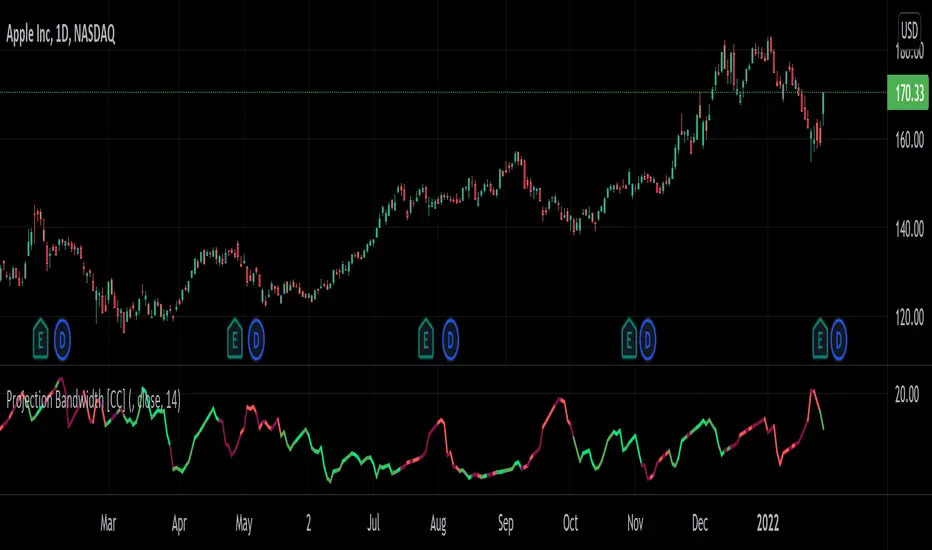
Projection Bandwidth [CC]The Projection Bandwidth was created by Mel Widner (Stocks and Commodities Jul 1995) and this is another of my series of indicators that I consider undiscovered gems. For those of you who are unaware, the Bandwidth indicator measures the distance between the high and low bands and if you remember from my Projection Bands script, the Projection Bands give pretty accurate early signals of trend reversals and followed fairly closely by a large bulge in the bands. The large bulges in the bands essentially act as the confirmation that the trend reversal is happening and so that brings me to this indicator. This indicator gives signals based on if it has reached a peak or a valley. Both extremes mean that the current trend is ending and I have color coded it based on the buy and sell signals from my Projection Bands indicator. I have included strong buy and sell signals in addition to normal ones so strong signals are darker in color and normal signals are lighter in color. Buy when the line turns green and sell when it turns red.
Let me know if there are any other scripts or indicators you would like to see me publish!
Kernel Regression Bands SuiteMulti-Kernel Regression Bands
A versatile indicator that applies kernel regression smoothing to price data, then dynamically calculates upper and lower bands using a wide variety of deviation methods. This tool is designed to help traders identify trend direction, volatility, and potential reversal zones with customizable visual styles.
Key Features
Multiple Kernel Types: Choose from 17+ kernel regression styles (Gaussian, Laplace, Epanechnikov, etc.) for smoothing.
Flexible Band Calculation: Select from 12+ deviation types including Standard Deviation, Mean/Median Absolute Deviation, Exponential, True Range, Hull, Parabolic SAR, Quantile, and more.
Adaptive Bands: Bands are calculated around the kernel regression line, with a user-defined multiplier.
Signal Logic: Trend state is determined by crossovers/crossunders of price and bands, coloring the regression line and band fills accordingly.
Custom Color Modes: Six unique color palettes for visual clarity and personal preference.
Highly Customizable Inputs: Adjust kernel type, lookback, deviation method, band source, and more.
How to Use
Trend Identification: The regression line changes color based on the detected trend (up/down)
Volatility Zones: Bands expand/contract with volatility, helping spot breakouts or mean-reversion opportunities.
Visual Styling: Use color modes to match your chart theme or highlight specific market states.
Credits:
Kernel regression logic adapted from:
ChartPrime | Multi-Kernel-Regression-ChartPrime (Link in the script)
Disclaimer
This script is for educational and informational purposes only. Not financial advice. Use at your own risk.

+ Magic Carpet BandsFun name for an indicator, eh? Well, it is true, I think; they look like magic carpets. They're actually pretty simple actually. They're Keltner Channels smoothed with a moving average. If you go down to the lookback period for the bands and set it to 1, you'll recognize them immediately.
Digging a bit deeper you see there are four magic carpets on the chart. The inner ones are set to a multiplier of 2, and the outer to a multiplier of 4. Each "carpet" is composed of two smoothed upper or lower Keltner Channels bounds, both with an optional offset, one of which is set to 13, and the other to 0 by default; and an optional color fill between these. There is also a color fill between the outer and inner carpets which gives them an interesting 3-dimensional aspect at times. They can look a bit like tunnels by default.
My thinking around the idea of using an offset with the bands is that if we assume these things to provide a dynamic support and resistance, and previous support and resistance maintains status as support and resistance until proven otherwise, then by putting an offset to past data we are creating a more obvious visual indication of that support or resistance in the present. The default offset is set to 13 bars back, so if price found resistance at some point around 13 bars ago, and price is currently revisiting it we assume it is still resistance, and that offset band is there to give us a strong visual aid. Obviously it's not foolproof, but nothing is.
Beyond that most interesting part of the indicator you have a nice selection of moving averages which the bands are calculated off of. By default it's set to my UMA. The bands themselves also have a selection of moving averages for how the keltner channels are smoothed. And a note: because the UMA and RDMA are averages of different length MAs, they can not be adjusted other than via the multiplier that sets the distance from the moving average.
The indicator is multi-timeframe, and the moving average can be colored based on a higher timeframe as well.
I popped in the divergence indicator here too. You can choose from RSI and OBV, and the divergences will be plotted on the chart. Working on finding a way to be able to have the bands/MA set to a higher timeframe while plotting the divergences on the chart timeframe, but don't have an answer to that yet.
Alerts for moving average crosses, band touches, and divergences.
I like this one a lot. Enjoy!
Pictures below.
s3.tradingview.com
One interesting thing about this indicator is that band twists often occur at areas of support or resistance. Simply drawing horizontal lines from previous twisted points can provide places from which you may look for strength or weakness to enter into a trade, or which you might use as targets for taking profits. The vertical lines are just showing the point on the chart when the cross occurred.
s3.tradingview.com
Above is a Jurik MA with a bunch of adjustments made to the bands, and the moving average itself. Everything is super adjustable, so you can play around and have fun with them quite a bit.
s3.tradingview.com
Just a different MA and bands.
s3.tradingview.com

RSI Bands, RSI %B and RSI BandwidthRSI bands provide an intuitive way of visualizing how the price movement causes RSI to move with in its range (0-100). Upper/Lower bands signify overbought and oversold levels respectively (Default: 70/30, you can customize them via options page). These bands closely match what Constance Brown explains in her book "Technical Analysis for the Trading Professional".
I have also coded up 2 scripts to visualize %B and Bandwidth, just as in BollingerBands. As you can see %B is equivalent to the actual RSI. Along with RSI_Bandwidth and %B, the bands convey a lot of information.
Another tip is to render Bollinger Bands along with RSIBands...endless possibilities :)
I have included all 3 scripts in the same chart, as they are all related. Since TradingView doesn't allow sharing more than one script in the same chart, you can only "Add script" RSI Bands.
If you want to use RSI %B and Bandwidth, follow this guide to "Make mine" this chart and get access to the source:
drive.google.com
For the complete list of my indicators, check this post:

McMillan Volatility Bands (MVB) – with Entry Logic// McMillan Volatility Bands (MVB) with signal + entry logic
// Author: ChatGPT for OneRyanAlexander
// Notes:
// - Bands are computed using percentage volatility (log returns), per the Black‑Scholes framing.
// - Inner band (default 3σ) and outer band (default 4σ) are configurable.
// - A setup occurs when price closes outside the outer band, then closes back within the inner band.
// The bar that re‑enters is the "signal bar." We then require price to trade beyond the signal bar's
// extreme by a user‑defined cushion (default 0.34 * signal bar range) to confirm entry.
// - Includes alertconditions for both setups and confirmed entries.

Inverse BandsThis was the result of quite some time spent examining how much information could be gleamed by studying the interactions between Keltner Channels, STARC Bands and Bollinger Bands. I was surprised by the results.
First of all, there are four fills that are black. Set the transparency of those to 0 and you'll see this indicator the way that it's meant to be seen. Those fills belong to unused sections of the Bollinger Bands.
There are two clouds which represent STARC Bands and the Keltner Channel. There is some delay when they flip from bullish (green) to bearish (red), but they are indicative of the trend. The space between them is black and the narrower that space is, the greater volatility is. Because of this, we don't need the exterior Bollinger Bands.
The Bollinger Bands remain visible as the yellow interior clouds on the top cloud and the blue interior clouds on the bottom cloud. Often, the thicker the yellow or blue cloud is, the less severe a throwback from a given trend reversal will be. Often the thinner that yellow or blue cloud is, the more severe the trend reversal will be. If price is rising into a thin interior yellow cloud, the following dip will be substantial. If price action dips towards a thicker interior blue cloud, often the pump following that dump will be less enthusiastic.
We preserve the Keltner Channel and STARC bands as our cloud because the way that they interact with the three basis lines yields a lot of information.
The yellow Bollinger basis line tells us about trend strength. The closer the BB basis line is to the top of the top cloud or the bottom of the bottom cloud, the stronger the trend is. When it enters the cloud very close to the bottom of the bottom cloud, you know you're looking at a strong pump, and vice versa when it's close to the top of the top cloud.
The purple Keltner Channel basis line and orange STARC Band basis line can forecast short term trend changes one candlestick in advance by contacting any line in either cloud. The moment either basis line touches or crosses any boundary of the clouds, you know that the next candle will change directions. In an uptrend, a touch or cross means the next candle will have a lower high point. In a downtrend, a cross or touch means the next candle will have a higher high point. This is most useful in scalping.
It'd be pretty easy to slap some crossover alerts on to this and useful considering that they come a candle in advance. Feel free to further explore and develop this.

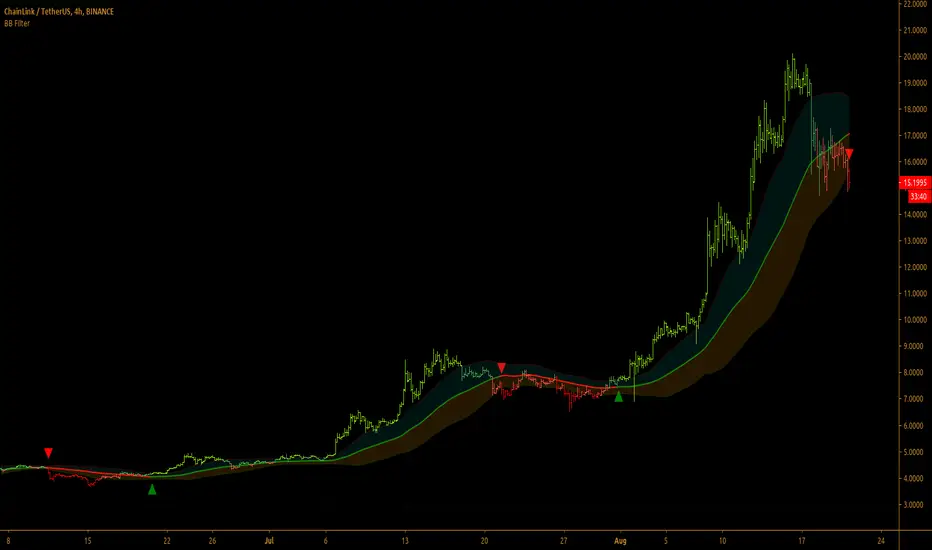
Bollinger Bands Filter
Bollinger Bands is a classic indicator that uses a simple moving average of 20 periods, along with plots of upper and lower bands that are 2 standard deviations away from the basis line. These bands help visualize price volatility and trend based on where the price is, in relation to the bands.
Bollinger Bands filter plots a long signal when price closes above the upper band and plots a short signal when price closes below the lower band. It doesn't take into account any other parameters such as Volume/RSI/ Fundamentals etc, so user must use discretion based on confirmations from another indicator or based on fundamentals.
The filter works great when the price closes above/below upper/lower bands with continuation on next bar. It is definitely useful to have this filter along with other indicators to get early glimpse of breach/fail of bands on candle close during BB squeeze or based on volatility.
This can be used on Heikin Ashi candles for spotting trends, but HA candles are not recommended for trade entries as they don't reflect true price of the asset.
This filter's default is 55 SMA and 1 standard deviation, but these can be changed from settings.
It is definitely worth reading the 22 rules of Bollinger Bands written by John Bollinger.
==================================================================
Note:
1. Alerts can be created for long and short signals using "Once per bar close".
2. The indicator doesn't repaint.
==================================================================
DEnvelope [Better Bollinger Bands]*** ***
Bollinger Bands (BB) usually expand quickly after a volatility increase but contract more slowly as volatility declines. This extended time it takes for BB to contract after a volatility drop can make trading some instruments using BB alone difficult or less profitable.
In the October 1998 issue of "Futures" there is an article written by Dennis McNicholl called "Better Bollinger Bands", in which the author recommends improving BB by modifying:
- the center line formula &
- different equations for calculating the bands.
These bands, called "DEnvelope", follow price more closely and respond faster to changes in volatility with these modifications.
Fore more indicators, check out my "Master Index of indicators" (Also check my published charts page for new ones I haven't added to that list):
More scripts related to DEnvelope:
------------------------------------------------
- DEnvelope Bandwidth: pastebin.com
- DEnvelope %B : pastebin.com
Sample chart with above indicators: www.tradingview.com

Pi Cycle BTC Top + Pre-Alert BandsPi Cycle BTC Top + Pre-Alert Bands is an advanced implementation of the classic Pi Cycle Top model, designed for Bitcoin cycle analysis on higher timeframes (especially 1D BTCUSD/BTCUSD·INDEX).
The original Pi Cycle Top uses two moving averages:
• 111-day SMA (short MA)
• 350-day SMA ×2 (long MA)
A Pi Top is signaled when the 111 SMA crosses above the 350×2 SMA. Historically, this has occurred near major BTC cycle highs.
This script extends that idea with a 3-step early-warning sequence:
• Pi Green – early compression: short/long MA ratio crosses upward into the green band (convergence from below is required).
• Pi Yellow – mid-cycle warning: only fires if a valid Green has already occurred in the same cycle.
• Pi Cycle Top – final top: the classic Pi Cycle cross, limited to one top signal per cycle. After a top, no new Yellow or Top signals can appear until a new Green event starts the next cycle.
Background shading shows the active phase (Green / Yellow / late-cycle zone), so you can see at a glance where BTC is within its Pi-based macro structure.
All logic is non-repainting: request.security() uses lookahead_off and no future data is accessed.
Typical use
This indicator is intended as a macro-cycle timing and risk-awareness tool, not a stand-alone entry system. Many traders use it to:
• Watch for Pi Green as the start of a potential late-cycle advance.
• Treat Pi Yellow as a rising-risk environment and tighten risk management.
• Use the Pi Cycle Top as a historical high-risk zone where large profit-taking or hedging may be considered.
Always combine this with your own analysis (trend, volume, on-chain, macro) before making decisions.
How to set alerts
Add the indicator to your chart (1D BTCUSD or BTCUSD·INDEX recommended).
Click Alerts → Condition → Pi Cycle BTC Top + Pre-Alert Bands.
Choose one of:
• Pi Cycle – Green Pre-Alert (early convergence)
• Pi Cycle – Yellow Pre-Alert (after Green only)
• Pi Cycle – TOP (Single per Cycle, after Green)
Use “Once per bar close” for higher-timeframe reliability.
Disclaimer
This tool is for educational and analytical purposes only. The Pi Cycle concept is based on historical behavior and does not guarantee future results. This is not financial advice; always do your own research and manage risk appropriately.

Bitcoin Logarithmic Regression BandsOverview
This indicator displays logarithmic regression bands for Bitcoin. Logarithmic regression is a statistical method used to model data where growth slows down over time. I initially created these bands in 2019 using a spreadsheet, and later coded them in TradingView in 2021. Over time, the bands proved effective at capturing Bitcoin's bull market peaks and bear market lows. In 2024, I decided to share this indicator because I believe these logarithmic regression bands offer the best fit for the Bitcoin chart.
How It Works
The logarithmic regression lines are fitted to the Bitcoin (BTCUSD) chart using two key factors: the 'a' factor (slope) and the 'b' factor (intercept). The two lines in the upper and lower bands share the same 'a' factor, but I adjust the 'b' factor by 0.2 to more accurately capture the bull market peaks and bear market lows. The formula for logaritmic regression is 10^((a * ln) - b).
How to Use the Logarithmic Regression Bands
1. Lower Band (Support Band):
The two lines in the lower band create a potential support area for Bitcoin’s price. Historically, Bitcoin’s price has always found its lows within this band during past market cycles. When the price is within the lower band, it suggests that Bitcoin is undervalued and could be set for a rebound.
2. Upper Band (Resistance Band):
The two lines in the upper band create a potential resistance area for Bitcoin’s price. Bitcoin has consistently reached its highs in this band during previous market cycles. If the price is within the upper band, it indicates that Bitcoin is overvalued, and a potential price correction may be imminent.
Use Cases
- Price Bottoming:
Bitcoin tends to bottom out at the lower band before entering a prolonged bull market or a period of sideways movement.
- Price Topping:
In reverse, Bitcoin tends to top out at the upper band before entering a bear market phase.
- Profitable Strategy:
Buying at the lower band and selling at the upper band can be a profitable trading strategy, as these bands often indicate key price levels for Bitcoin’s market cycles.

Moving Average Band Width [CC]The Moving Average Band Width was created by Vitali Apirine (Stocks and Commodities Aug 2021 pg 25) and this is of course an extension based on my previous Moving Average Bands script. For those of you that aren't aware, the Band Width indicator is an indicator that tells you how close the upper and lower bands are to each other which is a great determination of how volatility is increasing or decreasing. This acts as both a trend indicator and a volatility indicator. I have included strong buy and sell signals in addition to normal ones so stronger signals are darker in color and normal ones are lighter. A great buy signal is when you are in an uptrend (so the line is green already) and the indicator line is moving up which means strong underlying volatility.
Let me know if there are any other indicators or scripts you would like to see me publish!

Resampling Reverse Engineering Bands [DW]This is an experimental study designed to reverse engineer price levels from centered oscillators at user defined sample rates.
This study aims to educate users on the process of oscillator reverse engineering, and to give users an alternative perspective on some of the most commonly used oscillators in the trading game.
Reverse engineering price levels from an oscillator is actually a rather simple, straightforward process.
Rather than plugging price values into a function to solve for oscillator values, we rearrange the function using some basic algebraic operations and plug in a specified oscillator value to solve for price values instead.
This process tells us what price value is needed in order for the oscillator to equal a certain value.
For example, if you wanted to know what price value would be considered “overbought” or “oversold” according to your oscillator, you can do that using this process.
In this study, the reverse engineering functions are used to calculate the price values of user defined high and low oscillator thresholds, and the price values for the oscillator center.
This allows you to visualize what prices will trigger thresholds as a sort of confidence interval, which is information that isn't inherently available when simply analyzing the oscillator directly.
This script is equipped with three reverse engineering functions to choose from for calculating the band values:
-> Reverse Relative Strength Index (RRSI)
-> Reverse Stochastic Oscillator (RStoch)
-> Reverse Commodity Channel Index (RCCI)
You can easily select the function you want to utilize from the "Band Calculation Type" dropdown tab.
These functions are specially designed to calculate at any sample rate (up to 1 bar per sample) utilizing the process of downsampling that I introduced in my Resampling Filter Pack.
The sample rate can be determined with any of these three methods:
-> BPS - Resamples based on the number of bars.
-> Interval - Resamples based on time in multiples of current charting timeframe.
-> PA - Resamples based on changes in price action by a specified size. The PA algorithm in this script is derived from my Range Filter algorithm.
The range for PA method can be sized in points, pips, ticks, % of price, ATR, average change, and absolute quantity.
Utilizing downsampled rates allows you to visualize the reverse engineered values of an oscillator calculated at larger sample scales.
This can be rather beneficial for trend analysis since lower sample rates completely remove certain levels of noise.
By default, the sample rate is set to 1 BPS, which is the same as bar-to-bar calculation. Feel free to experiment with the sample rate parameters and configure them how you like.
Custom bar colors are included as well. The color scheme is based on disparity between sources and the reverse engineered center level.
In addition, background highlights are included to indicate when price is outside the bands, thus indicating "overbought" and "oversold" conditions according to the thresholds you set.
I also included four external output variables for easy integration of signals with other scripts:
-> Trend Signals (Current Resolution Prices) - Outputs 1 for bullish and -1 for bearish based on disparity between current resolution source and the central level output.
-> Trend Signals (Resampled Prices) - Outputs 1 for bullish and -1 for bearish based on disparity between resampled source and the central level output.
-> Outside Band Signal (Current Resolution Prices) - Outputs 1 for overbought and -1 for oversold based on current resolution source being outside the bands. Returns 0 otherwise.
-> Outside Band Signal (Resampled Prices) - Outputs 1 for overbought and -1 for oversold based on resampled source being outside the bands. Returns 0 otherwise.
To use these signals with another script, simply select the corresponding external output you want to use from your script's source input dropdown tab.
Reverse engineering oscillators is a simple, yet powerful approach to incorporate into your momentum or trend analysis setup.
By incorporating projected price levels from oscillators into our analysis setups, we are able to gain valuable insights, make (potentially) smarter trading decisions, and visualize the oscillators we know and love in a totally different way.
I hope you all find this script useful and enjoyable!
Mean Reversion w/ Bollinger BandsThis is a more advanced version of my original mean reversion script.
It employs the famous Bollinger Bands.
This robot will buy when price falls below the lower Bollinger Band, and sell when price moves above the upper Bollinger Band.
I've only tested it on the S&P 500, though you could try it out on other assets to see the backtest performance.
During the recent COVID-19 bear market drop, it produced several buy signals on the S&P which I followed, and made some nice gains so far.
I still think this would make a better investing strategy (buy undervalued / sell over-valued), rather than a trading strategy.
I use this robot for my long term portfolio.

Extended Recursive Bands - Maximum Efficiency With Extra OptionsIntroducing A New Calculation For Efficient Bands Calculation !
Here it is ! The Recursive Bands Indicator, an indicator specially created to be extremely efficient, i think you already know that calculation time is extra important in algorithmic trading, and this is the principal motivation for the creation of the proposed indicator. Originally described in my paper "Pierrefeu, Alex (2019): Recursive Bands - A New Indicator For Technical Analysis" , the indicator framework has been widely used in my previous uploaded indicators, however it would have been a shame to not upload it, however user experience being a major concern for me, i decided to add extra options, which explain the term "extended".
On The Indicator Calculation
You can skip this part if it doesn't interest you. The calculation of the indicator is based on recursion, but i want to explain the mathematical formula described in the paper.
I've seen some users trying to remake it from the calculations, however there was always something weird, and i understand, mathematical notations are always a bit weird, even myself don't always write them correctly/understand them, however this one is relatively simple to understand.
First lets explain each elements of the calculation :
α = smoothing constant, or 2/(length+1)
max/min = maximum and minimum function, max return the greatest input value while min return the lowest one, for example :
max(4,2) = 4 while min(4,2) = 2
the "||" notation mean taking the absolute value, for example : |-1| = abs(-1) = 1
The calculation after the max/min function is called the correction factor, and is the core of the indicator. The last two variables are just here to provide an initial value for upper and lower, basically when we start our calculations we will assign the value of the closing price for upper and lower.
The motivation behind using a smoothing constant in range of (0,1) was to tell the reader that the indicator is easily made adaptive, this is what i did on my adaptive trailing stop indicator by using the efficiency ratio as smoothing variable, the user can use 1/length instead of the provided calculation for alpha.
If you interested on the indicator main logic, it is actually really simple, by using upper = max(price,upper) and lower = min(price,lower) we would get the maximum/minimum price value at time t , therefore upper can only be greater or equal than its precedent value, while lower can only be lower or equal than its precedent value, in order to fix that we subtract/sum upper/lower with a value, this allow the upper band to be lower than its precedent value and lower to be greater than its precedent value, this is the role of the correction factor.
The Indicator
The indicator display one upper and one lower band, every common usages applied to bands indicators such as support/resistance, breakout, trailing stop...etc, can also be applied to this one. length control how reactive the bands are, higher values of length will make the bands cross the price less often.
In order to provide more flexibility for the user i added the option to use various methods for the calculation of the indicator, therefore the indicator can use the average true range, standard deviation, average high-low range, and one totally exclusive method specially designed for this indicator.
Classic Method
This option make the indicator use its classical calculation, this is the most efficient method of all.
Atr Method (atr)
This method use the average true range as correction factor, notice that lower values of length can still produce wide band.
Standard Deviation Method (stdev)
This method use a biased estimate of the standard deviation as correction factor.
The method produce smoother bands that converge more slowly toward the price in comparison with the classic correction factor.
Average High-Low Range Method (ahlr)
This method use the average of the high-low range as correction factor, extremely similar to the average true range.
Rising Falling Volatility (rfv) Method
A new method created for this indicator, this correction factor use the absolute prices changes when price value is greater/lower than any length past values of the price, this allow to have more boxy shaped bands, work best with greater values of length.
The bands can be in contact with this method, a possible fix in the future.
Conclusion
The recursive band indicator is one of my greatest indicators in my opinion (i would love to have yours), as you can see the idea behind it is extremely simple and allow for a super efficient band indicator, which was the original motivation behind it, in order to provide more fun for the users i also added more option for the correction factor, this allow the user to be creative and not get stuck with the original calculation.
Like the trend step indicator family we have almost ended our series on the recursive band framework, 1 more trailing stop will be added in the future, and then we'll have more "boring" stuff until i find something cool again, it shouldn't be long ;)
Thanks for reading !

UCS_Value BandsThis Indicator is yet another variation of KC. Inspired from Value Charts webinar. I have seen their videos on youtube. What appears to be a variation of KC.
They use 12 bands Showing the zone, and different MA for different timeframes.
You can get this indicator close to accuracy by changing the inputs (ATR) and (Deviations)
This also can be used with the triple ATR setup - Change the values to EMA to desired value. To obtain the First band to plot @ 1, Change the Band deviation to 0.25.
Also can be used as as the Acceleration Band. With Current Settings, the Third Band will plot the Acceleration band.
List of All my Indicators - www.tradingview.com
Lycka Till

Moving Average Band StrategyOverview
The Moving Average Band Strategy is a fully customizable breakout and trend-continuation system designed for traders who need both simplicity and control.
The strategy creates adaptive bands around a user-selected moving average and executes trades when price breaks out of these bands, with advanced risk-management settings including optional Risk:Reward targets.
This script is suitable for intraday, swing, and positional traders across all markets — equities, futures, crypto, and forex.
Key Features
✔ Six Moving Average Types
Choose the MA that best matches your trading style:
SMA
EMA
WMA
HMA
VWMA
RMA
✔ Dynamic Bands
Upper Band built from MA of highs
Lower Band built from MA of lows
Adjustable band offset (%)
Color-coded band fill indicating price position
✔ Configurable Strategy Preferences
Toggle Long and/or Short trades
Toggle Risk:Reward Take-Profit
Adjustable Risk:Reward Ratio
Default position sizing: % of equity (configurable via strategy settings)
Entry Conditions
Long Entry
A long trade triggers when:
Price crosses above the Upper Band
Long trades are enabled
No existing long position is active
Short Entry
A short trade triggers when:
Price crosses below the Lower Band
Short trades are enabled
No existing short position is active
Clear entry markers and price labels appear on the chart.
Risk Management
This strategy includes a complete set of risk-controls:
Stop-Loss (Fixed at Entry)
Long SL: Lower Band
Short SL: Upper Band
These levels remain constant for the entire trade.
Optional Risk:Reward Take-Profit
Enabled/disabled using a toggle switch.
When enabled:
Long TP = Entry + (Risk × Risk:Reward Ratio)
Short TP = Entry – (Risk × Risk:Reward Ratio)
When disabled:
Exits are handled by reverse crossover signals.
Exit Conditions
Long Exit
Stop-Loss Hit (touch-based)
Take-Profit Hit (if enabled)
Reverse Band Crossover (if TP disabled)
Short Exit
Stop-Loss Hit (touch-based)
Take-Profit Hit (if enabled)
Reverse Band Crossover (if TP disabled)
Exit markers and price labels are plotted automatically.
Visual Tools
To improve clarity:
Upper & Lower Band (blue, adjustable width)
Middle Line
Dynamic band fill (green/red/yellow)
SL & TP line plotting when in position
Entry/Exit markers
Price labels for all executed trades
These are built to help users visually follow the strategy logic.
Alerts Included
Every trading event is covered:
Long Entry
Short Entry
Long SL / TP / Cross Exit
Short SL / TP / Cross Exit
Combined Alert for webhook/automation (JSON-formatted)
Perfect for algo trading, Discord bots, or automation platforms.
Best For
This strategy performs best in:
Trending markets
Breakout environments
High-momentum instruments
Clean intraday swings
Works seamlessly on:
Stocks
Index futures
Commodities
Crypto
Forex
⚠️ Important Disclaimer
This script is for educational purposes only.
Trading involves risk. Backtest results are not indicative of future performance.
Always validate settings and use proper position sizing.

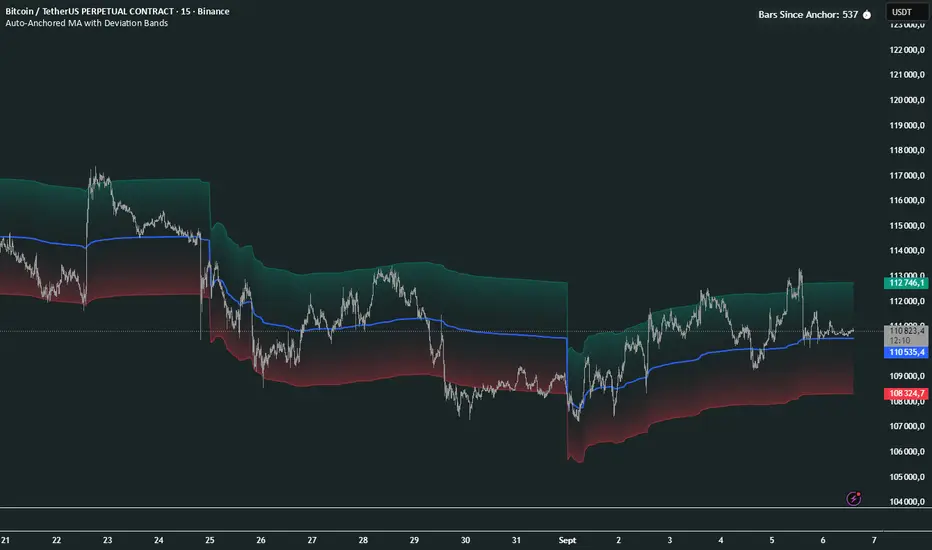
Auto-Anchored MA with Deviation BandsAuto-Anchored MA with Deviation Bands
✨ Features
📈 Auto-Anchored MA: Calculates moving averages (EMA, SMA, EWMA, WMA, VWAP, TEMA) anchored to user-defined periods (Hour, Day, Week, etc.).📏 Deviation Bands: Plots upper/lower bands using Percentage or Standard Deviation modes for volatility analysis.⚙️ Customizable Timeframes: Choose anchor periods from Hour to Year for flexible trend analysis.🎨 Visuals: Displays MA and bands with gradient fills, customizable colors, and adjustable display bars.⏱️ Countdown Table: Shows bars since the last anchor for easy tracking.🛠️ Smoothing: Applies smoothing to bands for cleaner visuals.
🛠️ How to Use
Add to Chart: Apply the indicator on TradingView.
Configure Inputs:
Anchor Settings: Select anchor period (e.g., Day, Week).
MA Settings: Choose MA type (e.g., VWAP, TEMA).
Deviation Settings: Set deviation mode (Percentage/Std Dev) and multipliers.
Display Settings: Adjust bars to display, colors, and gradient fill.
Analyze: View MA, deviation bands, and countdown table on the chart.
Track Trends: Use bands as dynamic support/resistance and monitor anchor resets.
🎯 Why Use It?
Dynamic Analysis: Auto-anchors MA to key timeframes for adaptive trend tracking.
Volatility Insight: Deviation bands highlight potential breakouts or reversals.
Customizable: Tailor MA type, timeframe, and visuals to your trading style.
User-Friendly: Clear visuals and countdown table simplify analysis.
📝 Notes
Ensure sufficient bars for accurate MA and deviation calculations.
Gradient fill enhances readability but can be disabled for simplicity.
Best used with complementary indicators like RSI or Bollinger Bands for robust strategies.
Happy trading! 🚀📈