Volatility BandsThe Volatility Bands script is a custom indicator designed to help traders visualize volatility levels in the market. It calculates dynamic bands around a central moving average, providing insights into potential support and resistance levels based on recent price action.
The script calculates multiple volatility bands (u0, u1, u2, d0, d1, d2) that adjust based on recent price movements. The outer bands (u2 and d2) represent extreme volatility levels, while the inner bands (u0, u1, d0, d1) indicate more immediate support and resistance.
Look for price reactions at the band levels. A touch of the upper bands may indicate overbought conditions, while a touch of the lower bands may indicate oversold conditions.
Central Moving Average: A smoothed moving average that adapts to price changes, providing a clear trend direction.
The script has no input parameters.
Script Functions:
erf(x): Calculates the error function for a given input x. Used in the calculation of the smoothing factor for the UMA.
uma(input): Provides a smoothed average that adapts to recent price changes, reducing lag compared to traditional moving averages.
dev(input, mu): Used to calculate the volatility bands around the central moving average.
"band" için komut dosyalarını ara

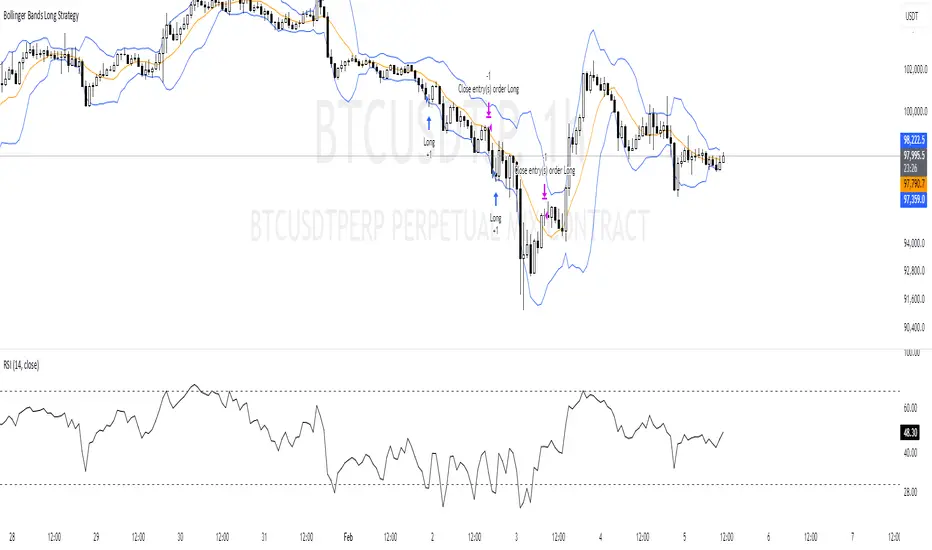
Bollinger Bands Long Strategy
This strategy is designed for identifying and executing long trades based on Bollinger Bands and RSI. It aims to capitalize on potential oversold conditions and subsequent price recovery.
Key Features:
- Bollinger Bands (10,2): The strategy uses Bollinger Bands with a 10-period moving average and a multiplier of 2 to define price volatility.
- RSI Filter: A trade is only triggered when the RSI (14-period) is below 30, ensuring entry during oversold conditions.
- Entry Condition: A long trade is entered immediately when the price crosses below the lower Bollinger Band and the RSI is under 30.
- Exit Condition: The position is exited when the price reaches or crosses above the Bollinger Band basis (20-period moving average).
Best Used For:
- Identifying oversold conditions with a strong potential for a rebound.
- Markets or assets with clear oscillations and volatility e.g., BTC.
**Disclaimer:** This strategy is for educational purposes and should be used with caution. Backtesting and risk management are essential before live trading.
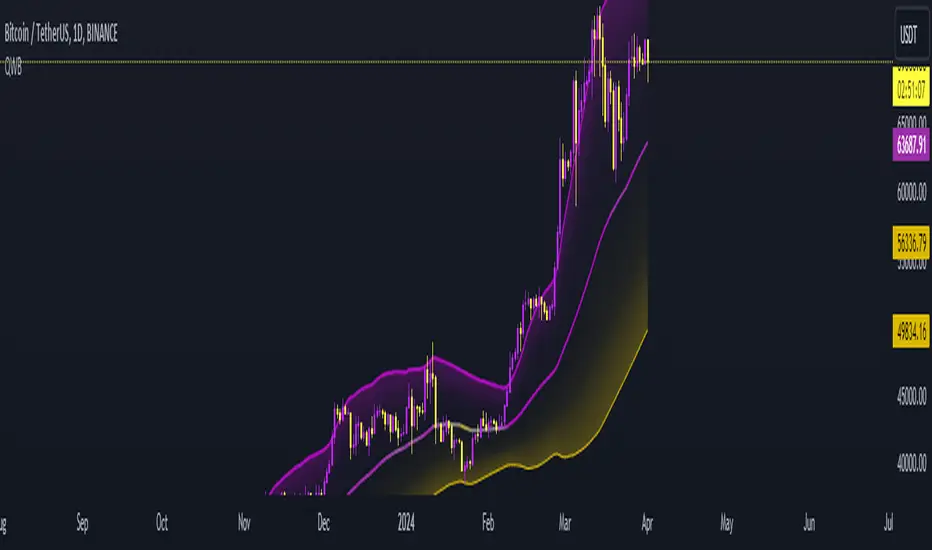
Quadratic Weighted Bands"Quadratic Weighted Bands" (QWB) is designed to identify and visualize market trends and volatility using quadratic weighted filtering techniques. It works by applying quadratic weighting to a selected data source over a specified length, enhancing the sensitivity and responsiveness of the indicator to recent market movements. A major advantage of this indicator is the ability to have a longer lookback period without having too much lag. This results in a smoother output that is still very responsive. Its about twice as fast as a normal average so adjust accordingly.
The indicator is customizable, allowing users to select between the normal Quadratic Weighting (QWF) and Volume Quadratic Weighting (VQWF), choose their data source, adjust the lookback period, and modify the deviation multiplier to fit their analysis needs. Additionally, users can customize the colors of the bands and center line.
The color of the central line changes based on the direction of the trend, as well as having a neutral (ranging) color. This visual aspect makes it easier for traders to quickly see the strength and direction of the market.
Style Select: Choose between "Normal Quadratic Weighting" or "Volume Quadratic Weighting" to adapt the indicator based on volume data or standard price data.
Source: This allows for the selection of the input source for the indicator, such as HL2, ensuring the analysis is aligned with specific trading preferences.
Length: Define the lookback period for the average, with the system automatically utilizing the maximum available length if the specified range exceeds available data, ensuring it always works.
Deviation Length: Optionally adjust the lookback period for calculating deviation, enhancing the indicator's sensitivity and accuracy in identifying market volatility.
Multiplier: Fine tune the deviation multiplier to control the width of the bands, allowing traders to adjust for market volatility and personal risk tolerance.
Top Color: Customize the color of the top band, which also affects the center line's appearance. Adjusting the brightness provides visual clarity and personalization.
Bottom Color: Similarly, select the color for the bottom band, which also influences the center line. The option to adjust brightness ensures the indicator's readability and aesthetic preference.
Neutral Color: Designate a color for indicating a ranging market.
Enjoy
Dual SMA/EMA BandsThe Dual SMA/EMA Bands indicator provides a clear view of market trends, combining Simple Moving Averages (SMA) and Exponential Moving Averages (EMA) in one customizable tool. Designed for any timeframe, it features Aqua and Purple Bands for 50-period and 200-period averages , respectively, aiding in trend analysis and volatility insights.
Features:
Adaptive Timeframes : Automatically aligns with the chart’s timeframe or can be manually set for cross-timeframe analysis.
Customization : Offers easy adjustments for colors, line thickness, and opacity to suit personal preferences and enhance readability.
Insights : Facilitates trend confirmation and volatility assessment, essential for informed trading decisions.
Usage Tips:
Use the bands to gauge market direction; above the bands suggests bullish conditions, below them indicates bearish trends.
The gap between EMA and SMA within each band can signal market volatility.
Apply customizable timeframes for a comprehensive market overview.
Conclusion:
With its straightforward setup and versatile application, the Dual SMA/EMA Bands indicator is a valuable tool for traders looking to deepen their market analysis and uncover trading opportunities.

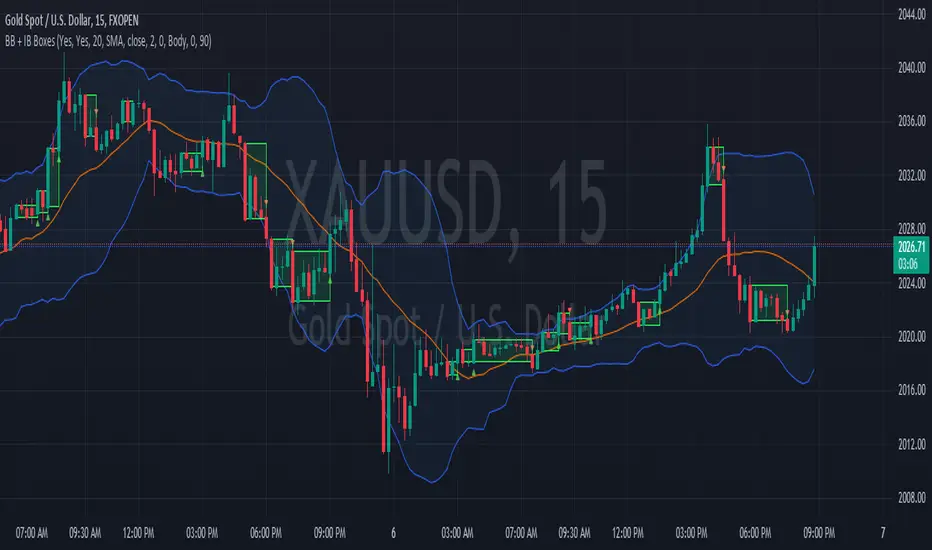
Bolingger Bands + Inside Bar BoxesBollinger Bands are a technical analysis tool consist of three bands—an upper, middle, and lower band—that are used to spotlight extreme short-term prices in a security. The upper band represents overbought territory, while the lower band can show you when a security is oversold. Most technicians will use Bollinger Bands® in conjunction with other analysis tools to get a better picture of the current state of a market or security.
An Inside Bar is a two-bar price action trading strategy in which the inside bar is smaller and within the high to low range of the prior bar. Inside bars show a period of consolidation in a market. They often form following a strong move in a market, as it ‘pauses’ to consolidate before making its next move. However, they can also form at market turning points and act as reversal signals from key support or resistance levels.
Smoothing ATR bandThere are two bands calculated with the ATR and I added "Smoothing" into the script.
Smoothing ATR with multiplier can display two bands above and below the price.
We can ONLY find some ATR bands in Community Scripts with "Basic" setting which is used to set Stop Loss.
And yet , Smoothing ATR with multiplier is capable of making traders manifestly recognize OverBought & OverSold.
FurtherMore, I added a condition with "plotshape", which is "Stop Hunt"
Stop Hunt is an absolutely usual strategy to clean the leverage and it always makes high volatility moves.
When high> above band and close< above band , long signal, it means it had been abundantly bought but the larger traders weren't satisfied; therefore, they quickly sold out to lower the price. The sell condition is on the contrary.
The signals mainly make traders manifestly recognize OverBought & OverSold.

custom Bollinger bands with filters - indicator (AS)-----------Description-------------
This indicator is basically Bollinger bands with many ways to customize. It uses highest and lowest values of upper and lower band for exits. I think something is wrong with the script but cant find any mistakes – most probably smoothing. The ATR filter is implemented but is working incorrectly. In code you can also turn it into strategy but I do not recommend it for now as it is not ready yet.
So this is my first script and I am looking for any advice, ideas to improve this script, sets of parameters, markets to apply, logical mistakes in code or any ideas that you may have. Indicator was initially designed for EURUSD 5MIN but I would be interested in other ideas.
-----------SETTINGS--------------
---START - In starting settings we can choose
Line 1: what parts to use BB/DC/ATR
Line 2: what parts to plot on chart
Line 3 Whether or not apply smoothing to BB or ATR filter
Line 4 Calculate deviation for BB from price or Moving average
Line 5 Fill colors and plot other parts for debug (overlay=false)
Line 6:( for strategy) – enable Long/Short Trades
---BB and DC – here we modify Bollinger bands and Donchian
Line 1: Length and type of BB middle line and also length of DC from BB
Line 2: Length and type of BB standard deviation and multiplier
Line 3: Length and type of BB smoothing and %width for BB filter
---ATR filter – (not ready fully yet)
Line 1: type and length of ATR
Line 2: threshold and smoothing value of ATR
---DATE and SESSION
Line 1: apply custom date or session?
Line 2: session hours settings
Line 3:Custom starting date
Line 4: Custom Ending date
-----------HOW TO USE--------------
We open Long if BB width is bigger than threshold and close when upper band is no longer highest in the period set. Exact opposite with Short

Shorting when Bollinger Band Above Price with RSI (by Coinrule)The Bollinger Bands are among the most famous and widely used indicators. A Bollinger Band is a technical analysis tool defined by a set of trendlines plotted two standard deviations (positively and negatively) away from a simple moving average ( SMA ) of a security's price, but which can be adjusted to user preferences. They can suggest when an asset is oversold or overbought in the short term, thus providing the best time for buying and selling it.
The relative strength index ( RSI ) is a momentum indicator used in technical analysis. RSI measures the speed and magnitude of a security's recent price changes to evaluate overvalued or undervalued conditions in the price of that security. The RSI can do more than point to overbought and oversold securities. It can also indicate securities primed for a trend reversal or corrective pullback in price. It can signal when to buy and sell. Traditionally, an RSI reading of 70 or above indicates an overbought situation. A reading of 30 or below indicates an oversold condition.
The short order is placed on assets that present strong momentum when it's more likely that it is about to reverse. The rule strategy places and closes the order when the following conditions are met:
ENTRY
The closing price is greater than the upper standard deviation of the Bollinger Bands
The RSI is less than 70.
EXIT
The trade is closed when the RSI is less than 70
The lower standard deviation of the Bollinger Band is less than the closing price.
This strategy was backtested from the beginning of 2022 to capture how this strategy would perform in a bear market.
The strategy assumes each order to trade 70% of the available capital to make the results more realistic. A trading fee of 0.1% is taken into account. The fee is aligned to the base fee applied on Binance, which is the largest cryptocurrency exchange by volume.

Bollinger Band Alert with RSI Filter IndicatorThis code is for a technical analysis indicator called Bollinger Band Alert with RSI Filter. It uses two tools: Bollinger Bands and Relative Strength Index (RSI) to identify potential trading signals in the market.
Bollinger Bands are lines plotted two standard deviations away from a simple moving average of the price of a stock or asset. They help traders determine whether prices are high or low on a relative basis.
The RSI is a momentum indicator that measures the strength of recent price changes to evaluate whether an asset is overbought or oversold.
The code has some input parameters that a user can change, such as length and multiplier, which are used to calculate the Bollinger Bands, and upper and lower RSI levels to define the overbought and oversold zones.
The code then uses if statements to generate alerts if certain conditions are met. The alert condition is triggered if the close price of an asset crosses above or below the upper or lower Bollinger Bands, and if the RSI is either above or below the overbought or oversold threshold levels.
Finally, the code generates plots to visualize the Bollinger Bands and displays triangles above or below the bars indicating when to enter a long or short position based on the strategy's criteria.

Faytterro Bandswhat is Faytterro Bands?
it is a channel indicator like "Bollinger Bands".
what it does?
creates a channel using standard deviations and means. thus giving users an idea about the expensive and cheap zones. It uses a special weighted moving average different from standard bollinger bands, it also averages not only price but also deviations.
how it does it?
it uses this formulas:
how to use it?
its usage is the same as "bollinger band".
length represents the number of candles to be taken into account, source represents the source of those candles and stdev represents the coefficient of the standard deviation.
you can use it with other indicators:

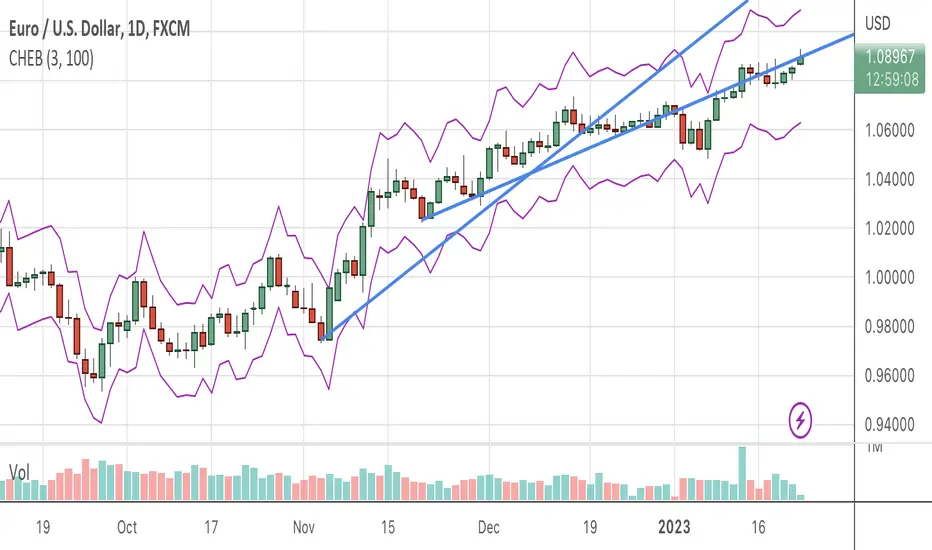
Chebyshevs BandsThis script calculates upper and lower bands using Chebyshev's inequality formula.
The main pros.: the band doesn't depend on particular distribution. It fits to any type of random variables. Also it allows to calculate bands for instruments with extremely high volatility.
Cons.: formula provides a rough estimation in some special cases like lognormal distribution.
Correlated ATR Bands | AdulariHow do I use it?
Never use this indicator as standalone trading signal, it should be used as confluence.
It is highly recommended to use this indicator on the 15m timeframe and above, try experimenting with the inverse feature and multipliers as well.
When the price is above the moving average this shows the bullish trend is strong.
When the price is below the moving average this shows the bearish trend is strong.
When the moving average is purple, the trend is bullish , when it is gray, the trend is bearish.
When price is above the upper band this may indicate a bearish reversal.
When price is below the lower band this may indicate a bullish reversal.
Features:
Purple line for bullish trend and gray line for bearish trend.
Custom formula combining an ATR and Hull MA to clearly indicate trend strength and direction.
Unique approach to moving averages and bands by taking the average of 2 types of MA's combined with custom ATR's, then multiplying these by correlation factors.
Bands to indicate possible trend reversals when price crosses them.
How does it work?
1 — ATR value is calculated, then the correlation between the source and ATR is calculated.
2 — Final value is calculated using the following formula:
correlation * atr + (1 - correlation) * nz(atr , atr)
3 — Moving average is calculated with the following formula:
ta.hma((1-(correlation/100*(1+weight/10)))*(ta.sma(source+value, smoothing)+ta.sma(source-value,smoothing))/2,flength)
4 — Bands calculation using multipliers.

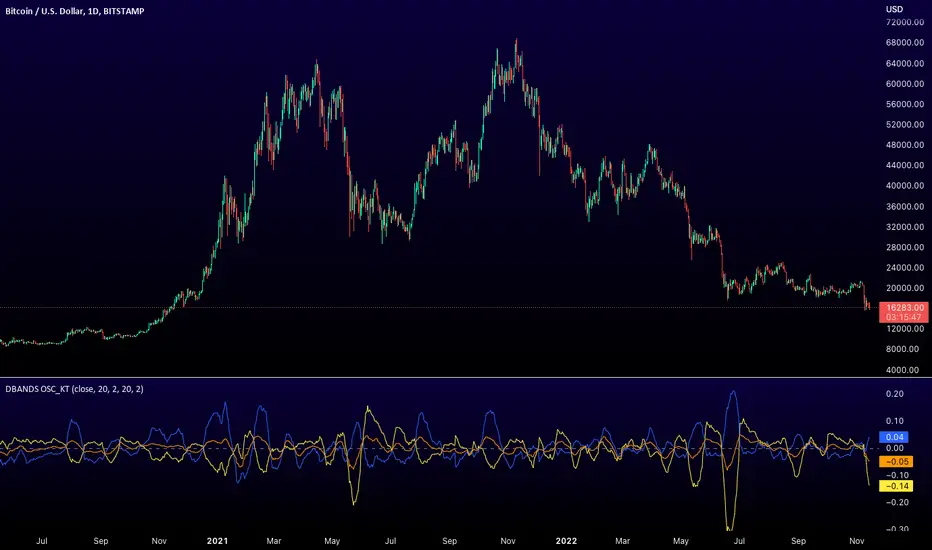
Distance Bands Oscillator_KT █ OVERVIEW
This tool is based on both Bollinger Bands and Keltner Channels, and measures 3 distances between the two, respectively.
Upper Kelt to Upper Bollinger Band
Lower Kelt to Lower Bollinger Band
Kelt Basis to Bollinger Basis Basis
Similar to the Band Width indicator, this can be used as a measure of volatility, and can be used to measure uptrend, downtrend and chop regions on a given chart.
Happy Trading,
ET
BOLLY BandsThis is a strategy using Bollinger Bands. The strategy is predicated around having low volatility in price action and then looking to capture a move when price starts to trend outside of the Bollinger bands. This strategy has only been backtested for 1 month but it has promising results so I will be sharing it looking for feedback. I run this strategy on the ERUSD 1 min chart.

MTF MA Ribbon and Bands + BB, Gaussian F. and R. VWAP with StDev█ Multi Timeframe Moving Average Ribbon and Bands + Bollinger Bands, Gaussian Filter and Rolling Volume Weighted Average Price with Standard Deviation Bands
Up to 9 moving averages can be independently applied.
The length , type and timeframe of each moving average are configurable .
The lines, colors and background fill are customizable too.
This script can also display:
Moving Average Bands
Bollinger Bands
Gaussian Filter
Rolling VWAP and Standard Deviation Bands
Types of Moving Averages:
Simple Moving Average (SMA)
Exponential Moving Average (EMA)
Smoothed Moving Average (SMMA)
Weighted Moving Average (WMA)
Volume Weighted Moving Average (VWMA)
Least Squares Moving Average (LSMA)
Hull Moving Average (HMA)
Arnaud Legoux Moving Average (ALMA)
█ Moving Average
Moving Averages are price based, lagging (or reactive) indicators that display the average price of a security over a set period of time.
A Moving Average is a good way to gauge momentum as well as to confirm trends, and define areas of support and resistance.
█ Bollinger Bands
Bollinger Bands consist of a band of three lines which are plotted in relation to security prices.
The line in the middle is usually a Simple Moving Average (SMA) set to a period of 20 days (the type of trend line and period can be changed by the trader, a 20 day moving average is by far the most popular).
The SMA then serves as a base for the Upper and Lower Bands which are used as a way to measure volatility by observing the relationship between the Bands and price.
█ Gaussian Filter
Gaussian filter can be used for smoothing.
It rejects high frequencies (fast movements) better than an EMA and has lower lag.
A Gaussian filter is one whose transfer response is described by the familiar Gaussian bell-shaped curve.
In the case of low-pass filters, only the upper half of the curve describes the filter.
The use of gaussian filters is a move toward achieving the dual goal of reducing lag and reducing the lag of high-frequency components relative to the lag of lower-frequency components.
█ Rolling VWAP
The typical VWAP is designed to be used on intraday charts, as it resets at the beginning of the day.
Such VWAPs cannot be used on daily, weekly or monthly charts. Instead, this rolling VWAP uses a time period that automatically adjusts to the chart's timeframe.
You can thus use the rolling VWAP on any chart that includes volume information in its data feed.
Because the rolling VWAP uses a moving window, it does not exhibit the jumpiness of VWAP plots that reset.
Made with the help from scripts of: adam24x, VishvaP, loxx and pmk07.

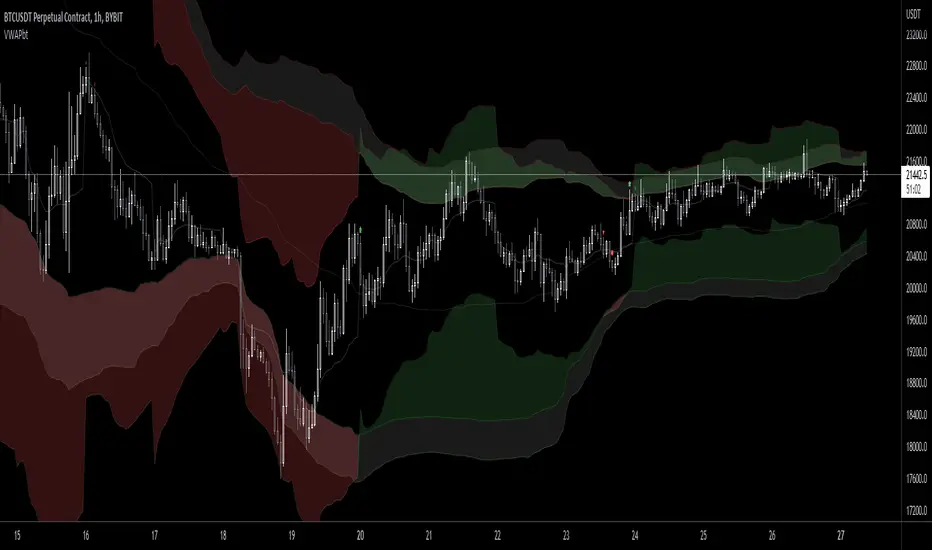
Ichimoku Cloud and Bollinger Bands (by Coinrule)The Ichimoku Cloud is a collection of technical indicators that show support and resistance levels, as well as momentum and trend direction. It does this by taking multiple averages and plotting them on a chart. It also uses these figures to compute a “cloud” that attempts to forecast where the price may find support or resistance in the future.
The Ichimoku Cloud was developed by Goichi Hosoda, a Japanese journalist, and published in the late 1960s. It provides more data points than the standard candlestick chart. While it seems complicated at first glance, those familiar with how to read the charts often find it easy to understand with well-defined trading signals.
The Ichimoku Cloud is composed of five lines or calculations, two of which comprise a cloud where the difference between the two lines is shaded in.
The lines include a nine-period average, a 26-period average, an average of those two averages, a 52-period average, and a lagging closing price line.
The cloud is a key part of the indicator. When the price is below the cloud, the trend is down. When the price is above the cloud, the trend is up.
The above trend signals are strengthened if the cloud is moving in the same direction as the price. For example, during an uptrend, the top of the cloud is moving up, or during a downtrend, the bottom of the cloud is moving down.
The Bollinger Bands are among the most famous and widely used indicators. A Bollinger Band is a technical analysis tool defined by a set of trendlines plotted two standard deviations (positively and negatively) away from a simple moving average ( SMA ) of a security's price, but which can be adjusted to user preferences. They can suggest when an asset is oversold or overbought in the short term, thus providing the best time for buying and selling it.
This strategy combines the Ichimoku Cloud with Bollinger Bands to better enter trades.
Long orders are placed when these basic signals are triggered.
Long Position:
Tenkan-Sen is above the Kijun-Sen
Chikou-Span is above the close of 26 bars ago
Close is above the Kumo Cloud
The closing price is greater than the upper standard deviation of the Bollinger Bands
Short Position:
Tenkan-Sen is below the Kijun-Sen
Chikou-Span is below the close of 26 bars ago
Close is below the Kumo Cloud
The upper standard deviation of the Bollinger Band is greater than the closing price
The script is backtested from 1 January 2022 and provides good returns.
The strategy assumes each order is using 30% of the available coins to make the results more realistic and to simulate you only ran this strategy on 30% of your holdings. A trading fee of 0.1% is also taken into account and is aligned to the base fee applied on Binance.
This script also works well on BTC 30m/1h, ETH 2h, MATIC 2h/30m, AVAX 1h/2h, SOL 45m timeframes

Impatient TS VWAP BandsImpatient VWAP bands are based of Traderskew's VWAP bands but are for more impatient traders.
Wicking or crossing down through the upper band indicates a good short trade entry for range-bound trading periods while wicking or crossing up through the lower band indicates a good long entry in range-bound conditions.
By default, impatience is disabled. If it is turned on, adjusting impatience determines how quickly the bands approach price: higher impatience approaches price faster. Rebound indicates how far from price the bands bounce after hitting price.

MTF VWAP & StDev BandsMulti Timeframe Volume Weighted Average Price with Standard Deviation Bands
I used the script "Koalafied VWAP D/W/M/Q/Y" by Koalafied_3 and made some changes, such as adding more standard deviation bands.
The script can display the daily, weekly, monthly, quarterly and yearly VWAP.
Standard deviation bands values can be changed (default values are 0.618, 1, 1.618, 2, 2.618, 3).
Also the previous standard deviation bands can be displayed.

SMA VWAP BANDS [qrsq]Description
This indicator is used to find support and resistance utilizing both SMA and VWAP. It can be used on lower and higher time frames to understand where price is likely to reject or bounce.
How it works
Rather than using the usual calculation for the VWAP, instead this script smooths the volume first with the SMA and then respectively calculates the smoothed multiplication of high, low and close price with the volume individually. These values are then divided by the smoothed volume to find individual VWAP's for each of the sources. The standard deviations of these are calculated, resulting in an upper, lower and middle band. It is essentially VWAP bands with some smoothed calculations in the middle.
How to use it
I like to use the bands for LTF scalping as well as HTF swings.
For scalping:
I tend to use either the 5m or 15m TF
I then set the indicator's TF to 1m
I will take a scalp based on the bands confluence with other PA methods, if price is being either supported or rejected.
For swings:
I tend to use a variety of TFs, including: 30m, 1H, 4H, D
I then set the indicator's TF to "Chart"
I will take a swing based on the bands confluence with other PA methods, if price is being either supported or rejected.
I also tend to use them on perpetual contracts as the volume seems to be more consistent and hence results in more accurate support and resistance.

[blackcat] L2 SVE Volatility BandsLevel 2
Background
Sylvain Vervoort’s articles in the July issues on 2018,“The V-Trade, Part 5: Technical Analysis—Moving Average Support & Resistance And Volatility Bands”
Function
In “The V-Trade, Part 5: Technical Analysis—Moving Average Support & Resistance And Volatility Bands” in the July 2018 STOCKS & COMMODITIES, author Sylvain Vervoort introduced a new type of price band that he calls the SVEVolatilityBand. He created this new type of band to better highlight volatility changes when using non-time-related charts. According to the author, when using charts such as renko, traditional bands may fail to effectively highlight these changes.
Remarks
Feedbacks are appreciated.

VWAP Band TrendThis indicator combines two features: VWAP bands for range trading and trends for trend-following.
The white bands offer support/resistance levels ideal for range trading: short when rejecting off the upper band, long when rejecting off the lower. Take profit either when hitting the (faint gray) midline and/or when hitting the band on the far side.
The trend analysis shows green or red ranges above or below the bands to indicate trend strength - larger swaths of green or red indicates strong trend while shorter swathes indicate weak. If the upper trend color doesn't match the lower trend color, the trend is undecided or transitioning.
Optionally, trend initiation indicators can be turned on to show above/below candles where a trend switch is taking place.
Higher Timeframe MA High Low BandsHigher Timeframe Customer MA High Low Bands. There are 3 different Moving Average Parameters Available. Indicator will plot 3 lines of MA Length With Source of High, Close and Low. User can change relevant MA parameters / Show or Hide MA.
Happy Trading

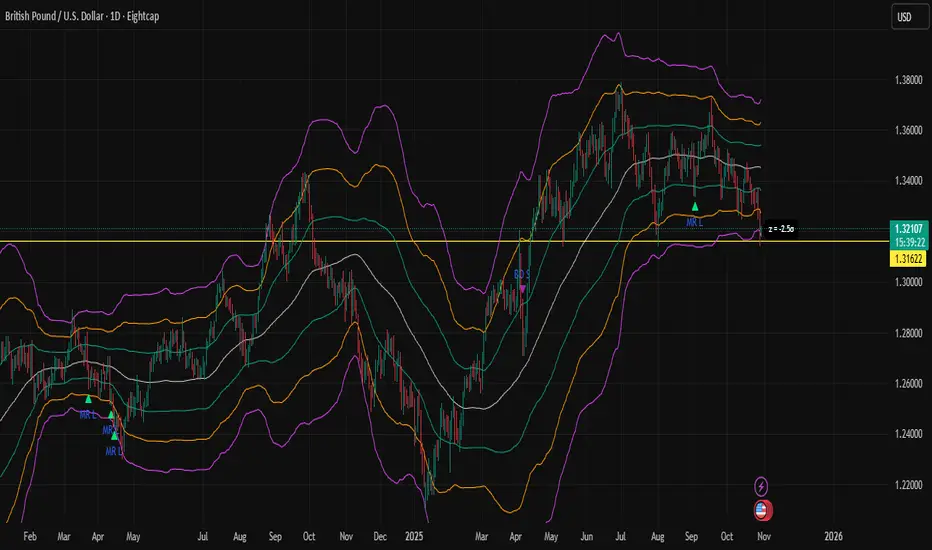
Z-Score Bands + SignalsZ-Score Statistical Market Analyzer
A multi-dimensional market structure indicator based on standardized deviation & regime logic
English Description
Concept
This indicator builds a statistical model of price behaviour by converting every candle’s movement into a Z-score — how many standard deviations each close is away from its moving average.
It visualizes the normal distribution structure of returns and provides adaptive entry signals for both Mean Reversion and Breakout regimes.
Rather than predicting price direction, it measures statistical displacement from equilibrium and dynamically adjusts the decision logic according to the market’s volatility regime.
⚙️ Main Components
Z-Score Bands (±1σ, ±2σ, ±3σ)
– The core structure visualizes volatility boundaries based on rolling mean and standard deviation.
– Price outside ±2σ often indicates statistical extremes.
Dual Signal Systems
Mean Reversion (MRL / MRS): when price (or return z-score) crosses back inside ±2σ bands.
Breakout (BOL / BOS): when price continues to expand beyond ±2σ.
Volatility Regime Classification
The indicator detects whether the market is currently in a low-vol or high-vol regime using percentile statistics of σ.
Low vol → Mean Reversion preferred
High vol → Breakout preferred
🧠 Adaptive Switches
A. Freeze MA/σ - Use previous-bar stats to avoid repainting and lag.
B. Confirm on Close - Only generate signals once the base-timeframe bar closes (eliminates look-ahead bias).
C. Return-based Signal - Use log-return Z-score instead of price deviation — normalizes volatility across assets.
D. Outlier Filter - Exclude bars with abnormal single-bar returns (e.g., >20%). Reduces false spikes.
E. Regime Gating - Automatically switch between Mean Reversion and Breakout logic depending on volatility percentile.
Each module can be toggled individually to test different statistical behaviours or tailor to a specific market condition.
📊 Interpretation
When the histogram of returns approximates a normal distribution, mean-reversion logic is often more effective.
When price persistently drifts beyond ±2σ or ±3σ, the distribution becomes leptokurtic (fat-tailed) — a breakout structure dominates.
Hence, this tool can help you:
Identify whether an asset behaves more “Gaussian” or “fat-tailed”;
Select the correct trading regime (MR or BO);
Quantitatively measure market tension and volatility clusters.
🧩 Recommended Use
Works on any timeframe and any asset.
Best used on liquid instruments (e.g., XAU/USD, indices, major FX pairs).
Combine with volume, sentiment or structural filters to confirm signals.
For strategy automation, pair with the companion script:
🧠 “Z-Score Strategy • Multi-Source Confirm (MRL/MRS/BOL/BOS)”.
⚠️ Disclaimer
This script is designed for educational and research purposes.
Statistical deviation ≠ directional prediction — use with sound risk management.
Past distribution patterns may shift under new volatility regimes.
==================================================================================
中文说明(简体)
概念简介
该指标基于价格的统计分布原理,将每根 K 线的波动转化为标准化的 Z-Score(标准差偏离值),用于刻画市场处于均衡或偏离状态。
它同时支持 均值回归(Mean Reversion) 与 突破延展(Breakout) 两种逻辑,并可根据市场波动结构自动切换策略模式。
⚙️ 主要功能模块
Z-Score 通道(±1σ / ±2σ / ±3σ)
用滚动均值与标准差动态绘制的统计波动带,价格超出 ±2σ 区域通常意味着极端偏离。
双信号系统
MRL / MRS(均值回归多空):价格重新回到 ±2σ 以内时触发。
BOL / BOS(突破延展多空):价格持续运行在 ±2σ 之外时触发。
波动率分层
自动识别市场处于高波动还是低波动区间:
低波动期 → 适合均值回归逻辑;
高波动期 → 适合突破趋势逻辑。
🧠 A–E 模块说明
A. 固定统计参数:使用上一根 K 线的均值和标准差,防止重绘。
B. 收盘确认信号:仅在当前时间框架收盘后生成信号,避免前视偏差。
C. 收益率信号模式:采用对数收益率的 Z-Score,更具普适性。
D. 异常波过滤:忽略单根极端波动(如 >20%)的噪声信号。
E. 波动率调节逻辑:根据市场处于高/低波动区间,自动切换 MRL/MRS 或 BOL/BOS。
📊 应用解读
如果收益率分布接近正态分布 → 市场倾向震荡,MRL/MRS 效果较佳;
若价格频繁偏离 ±2σ 或 ±3σ → 市场呈现“肥尾”分布,趋势延展占主导。
因此,该指标的核心目标是:
识别当前市场的统计结构类型;
根据波动特征自动切换交易逻辑;
提供结构化、可量化的市场状态刻画。
💡 使用建议
适用于所有时间框架与金融品种。
建议结合成交量或结构性指标过滤。
若用于策略回测,可搭配同名 “Z-Score Strategy • Multi-Source Confirm” 策略脚本。
⚠️ 免责声明
本指标仅用于研究与教学,不构成任何投资建议。
统计偏离 ≠ 趋势预测,实际市场行为可能在不同波动结构下改变。