Setup Keltner BandS MMS + RSI SIGNALS
📊 Keltner Bands with RSI Confirmation – TradingView Script
Introduction
This script combines Keltner Channel logic with Relative Strength Index (RSI) confirmation to provide traders with visual signals and alerts for potential reversals. It is designed for scalping and short-term trading strategies, where precision and quick decision-making are essential.
🔧 How It Works
• Keltner Bands (ATR-based):
• Two sets of bands are plotted around a moving average:
• Band 3 (ATR × 3) – more sensitive, suitable for aggressive entries.
• Band 5 (ATR × 5) – wider, used as a filter or confirmation zone.
• Signals are generated when the price crosses back inside the bands from outside.
• RSI Confirmation:
• RSI is calculated with a customizable period (default: 14).
• Overbought and oversold levels (default: 70/30) are used to filter signals.
• A bearish reversal is confirmed only if RSI is above the overbought level.
• A bullish reversal is confirmed only if RSI is below the oversold level.
📌 Functions and Features
• Visual Signals:
• Triangles plotted above/below candles for Keltner-only signals.
• Additional colored triangles for Keltner + RSI confirmed signals.
• Alerts:
• Configurable alerts for both Keltner-only and RSI-confirmed conditions.
• Messages include the type of reversal and the band level.
• Customizable Parameters:
• Moving average length.
• ATR multipliers (3 and 5).
• RSI length and thresholds.
• Colors for band fills and signals.
🎯 Usage
1. Apply the script to your chart in TradingView.
2. Adjust parameters to fit your trading style (scalping, intraday, swing).
3. Watch for signals:
• Red/green/orange/teal triangles → Keltner-only reversals.
• Maroon/lime/purple/blue triangles → RSI-confirmed reversals.
4. Set alerts to receive notifications when conditions are met.
5. Use RSI confirmation to filter out false signals and increase accuracy.
✅ Benefits
• Clear visualization of reversal zones.
• Dual-layer confirmation (Keltner + RSI).
• Flexible for different timeframes and trading styles.
• Ready-to-use alerts for automation or manual trading.
"band" için komut dosyalarını ara

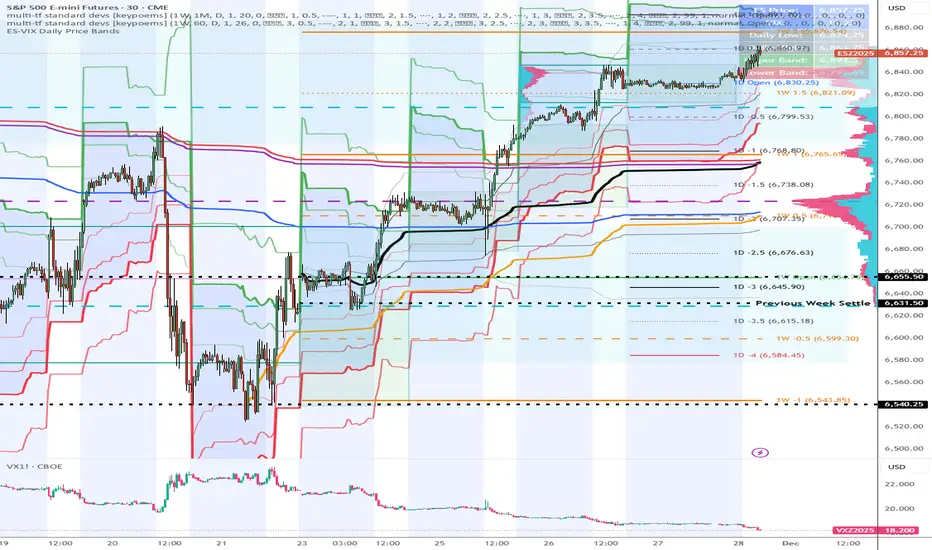
ES-VIX Daily Price Bands - Inner and OuterES-VIX Daily Price Bands
This indicator plots dynamic intraday price bands for ES futures based on real-time volatility levels measured by the VIX (CBOE Volatility Index). The bands evolve throughout the trading day, providing volatility-adjusted price targets.
Formulas:
Upper Band = Daily Low + (ES Price × VIX ÷ √252 ÷ 100)
Lower Band = Daily High - (ES Price × VIX ÷ √252 ÷ 100)
The calculation uses the square root of 252 (trading days per year) to convert annualized VIX volatility into an expected daily move, then scales it as a percentage adjustment from the current day's extremes.
Features:
Real-time band calculation that updates throughout the trading session
Upper band (green) extends from the current day's low
Lower band (red) contracts from the current day's high
Inner upper band (green) at 50% of expected move
Inner lower band (red) at 50% of expected move
Middle Inner upper band (green) at 80% of expected move
Middle Inner lower band (red) at 80% of expected move
Outer upper band (green) at 150% of expected move
Outer lower band (red) at 150% of expected move
Shaded zone between bands for visual clarity
Information table displaying:
Current ES price and VIX level
Running daily high and low
Current upper and lower band values
ES-VIX Daily Price Bands - Inner bands (80% and 50%)ES-VIX Daily Price Bands
This indicator plots dynamic intraday price bands for ES futures based on real-time volatility levels measured by the VIX (CBOE Volatility Index). The bands evolve throughout the trading day, providing volatility-adjusted price targets.
Formulas:
Upper Band = Daily Low + (ES Price × VIX ÷ √252 ÷ 100)
Lower Band = Daily High - (ES Price × VIX ÷ √252 ÷ 100)
The calculation uses the square root of 252 (trading days per year) to convert annualized VIX volatility into an expected daily move, then scales it as a percentage adjustment from the current day's extremes.
Features:
Real-time band calculation that updates throughout the trading session
Upper band (green) extends from the current day's low
Lower band (red) contracts from the current day's high
Inner upper band (green) at 50% of expected move
Inner lower band (red) at 50% of expected move
Middle Inner upper band (green) at 80% of expected move
Middle Inner lower band (red) at 80% of expected move
Shaded zone between bands for visual clarity
Information table displaying:
Current ES price and VIX level
Running daily high and low
Current upper and lower band values

ES-VIX Daily Price Bands - Inner bandsES-VIX Daily Price Bands
This indicator plots dynamic intraday price bands for ES futures based on real-time volatility levels measured by the VIX (CBOE Volatility Index). The bands evolve throughout the trading day, providing volatility-adjusted price targets.
Formulas:
Upper Band = Daily Low + (ES Price × VIX ÷ √252 ÷ 100)
Lower Band = Daily High - (ES Price × VIX ÷ √252 ÷ 100)
The calculation uses the square root of 252 (trading days per year) to convert annualized VIX volatility into an expected daily move, then scales it as a percentage adjustment from the current day's extremes.
Features:
Real-time band calculation that updates throughout the trading session
Upper band (green) extends from the current day's low
Lower band (red) contracts from the current day's high
Inner upper band (green) at 50% of expected move
Inner lower band (red) at 50% of expected move
Shaded zone between bands for visual clarity
Information table displaying:
Current ES price and VIX level
Running daily high and low
Current upper and lower band values

ES-VIX Daily Price BandsES-VIX Daily Price Bands
This indicator plots dynamic intraday price bands for ES futures based on real-time volatility levels measured by the VIX (CBOE Volatility Index). The bands evolve throughout the trading day, providing volatility-adjusted price targets.
Formulas:
Upper Band = Daily Low + (ES Price × VIX ÷ √252 ÷ 100)
Lower Band = Daily High - (ES Price × VIX ÷ √252 ÷ 100)
The calculation uses the square root of 252 (trading days per year) to convert annualized VIX volatility into an expected daily move, then scales it as a percentage adjustment from the current day's extremes.
Features:
Real-time band calculation that updates throughout the trading session
Upper band (green) extends from the current day's low
Lower band (red) contracts from the current day's high
Shaded zone between bands for visual clarity
Information table displaying:
Current ES price and VIX level
Running daily high and low
Current upper and lower band values

SuperTrend Cyan — Split ST & Triple Bands (A/B/C)SuperTrend Cyan — Split ST & Triple Bands (A/B/C)
✨ Concept:
The SuperTrend Cyan indicator expands the classical SuperTrend logic into a split-line + triple-band visualization for clearer structure and volatility mapping.
Instead of a single ATR-based line, this tool separates SuperTrend direction from volatility envelopes (A/B/C), providing a layered view of both regime and range compression.
✨ The design goal:
Preserve the simplicity of SuperTrend
Add volatility context via multi-band envelopes
Provide a compact MTF (Multi-Timeframe) summary for broader trend alignment
✨ How It Works
1. SuperTrend Core (Active & Opposite Lines)
Uses ATR-based bands (Factor × ATR-Length).
Active SuperTrend is plotted according to current regime.
Opposite SuperTrend (optional) shows potential reversal threshold.
2. Triple Band System (A/B/C)
Each band (A, B, C) scales from the median price (hl2) by different ATR multipliers.
A: Outer band (wider, long-range context)
B: Inner band (mid-range activity)
C: Core band (closest to price, short-term compression)
Smoothness can be controlled with EMA.
Uptrend fills are lime-toned, downtrend fills are red-toned, with adjustable opacity (gap intensity).
3. Automatic Directional Switch
When the regime flips from up → down (or vice versa), the overlay automatically switches between lower and upper bands for a clean transition.
4. Multi-Timeframe SuperTrend Table
Displays SuperTrend direction across 5m, 15m, 1h, 4h, and 1D frames.
Green ▲ = Uptrend, Red ▼ = Downtrend.
Useful for checking cross-timeframe trend alignment.
✨ How to Read It
Green SuperTrend + Lime Bands
- Uptrend regime; volatility expanding upward
Red SuperTrend + Red Bands
- Downtrend regime; volatility expanding downward
Narrow gaps (A–C)
- Low volatility / compression (potential squeeze)
Wide gaps
- High volatility / active trend phase
Opposite ST line close to price
- Early warning for regime transition
✨ Practical Use
Identify trend direction (SuperTrend color & line position).
Assess volatility conditions (band width and gap transparency).
Watch for MTF alignment: consistent up/down signals across 1h–4h–1D = strong structural trend.
Combine with momentum indicators (e.g., RSI, DFI, PCI) for confirmation of trend maturity or exhaustion.
✨ Customization Tips
ST Factor / ATR Length
- Adjust sensitivity of SuperTrend direction changes
Band ATR Length
- Controls overall smoothness of volatility envelopes
Band Multipliers (A/B/C)
- Define how wide each volatility band extends
Gap Opacity
- Affects visual contrast between layers
MTF Table
- Enable/disable multi-timeframe display
✨ Educational Value
This script visualizes the interaction between trend direction (SuperTrend) and volatility envelopes, helping traders understand how price reacts within layered ATR zones.
It also introduces a clean MTF (multi-timeframe) perspective — ideal for discretionary and system traders alike.
✨ Disclaimer
This indicator is provided for educational and research purposes only.
It does not constitute financial advice or a trading signal.
Use at your own discretion and always confirm with additional tools.
───────────────────────────────
📘 한국어 설명 (Korean translation below)
───────────────────────────────
✨개념
SuperTrend Cyan 지표는 기존의 SuperTrend를 확장하여,
추세선 분리(Split Line) + 3중 밴드 시스템(Triple Bands) 으로
시장의 구조적 흐름과 변동성 범위를 동시에 시각화합니다.
단순한 SuperTrend의 강점을 유지하면서도,
ATR 기반의 A/B/C 밴드를 통해 변동성 압축·확장 구간을 직관적으로 파악할 수 있습니다.
✨ 작동 방식
1. SuperTrend 코어 (활성/반대 라인)
ATR×Factor를 기반으로 추세선을 계산합니다.
현재 추세 방향에 따라 활성 라인이 표시되고, “Show Opposite” 옵션을 켜면 반대편 경계선도 함께 보입니다.
2. 트리플 밴드 시스템 (A/B/C)
hl2(중간값)를 기준으로 ATR 배수에 따라 세 개의 밴드를 계산합니다.
A: 외곽 밴드 (가장 넓고 장기 구조 반영)
B: 중간 밴드 (중기적 움직임)
C: 코어 밴드 (가격에 가장 근접, 단기 변동성 반영)
EMA 스무딩으로 부드럽게 조정 가능.
업트렌드 구간은 라임색, 다운트렌드는 빨간색 음영으로 표시됩니다.
3. 자동 전환 시스템
추세가 전환될 때(Up ↔ Down), 밴드 오버레이도 자동으로 교체되어 깔끔한 시각적 구조를 유지합니다.
4. MTF SuperTrend 테이블
5m / 15m / 1h / 4h / 1D 프레임별 SuperTrend 방향을 표시합니다.
초록 ▲ = 상승, 빨강 ▼ = 하락.
복수 타임프레임 정렬 확인용으로 유용합니다.
✨ 해석 방법
초록 SuperTrend + 라임 밴드
- 상승 추세 및 확장 구간
빨강 SuperTrend + 레드 밴드
- 하락 추세 및 확장 구간
밴드 폭이 좁음
- 변동성 축소 (스퀴즈)
밴드 폭이 넓음
- 변동성 확장, 추세 강화
반대선이 근접
- 추세 전환 가능성 높음
✨ 활용 방법
SuperTrend 색상으로 추세 방향을 확인
A/B/C 밴드 폭으로 변동성 수준을 판단
MTF 테이블을 통해 복수 타임프레임 정렬 여부 확인
RSI, DFI, PCI 등 다른 지표와 함께 활용 시, 추세 피로·모멘텀 변화를 조기에 파악 가능
✨ 교육적 가치
이 스크립트는 추세 구조(SuperTrend) 와 변동성 레이어(ATR Bands) 의 상호작용을
시각적으로 학습하기 위한 교육용 지표입니다.
또한, MTF 구조를 통해 시장의 “위계적 정렬(hierarchical alignment)”을 쉽게 인식할 수 있습니다.
✨ 면책
이 지표는 교육 및 연구 목적으로만 제공됩니다.
투자 판단의 책임은 사용자 본인에게 있으며, 본 지표는 매매 신호를 보장하지 않습니다.

Renko BandsThis is renko without the candles, just the endpoint plotted as a line with bands around it that represent the brick size. The idea came from thinking about what renko actually gives you once you strip away the visual brick format. At its core, renko is a filtered price series that only updates when price moves a fixed amount, which means it's inherently a trend-following mechanism with built-in noise reduction. By plotting just the renko price level and surrounding it with bands at the brick threshold distances, you get something that works like regular volatility bands while still behaving as a trend indicator.
The center line is the current renko price, which trails actual price based on whichever brick sizing method you've selected. When price moves enough to complete a brick in the renko calculation, the center line jumps to the new brick level. The bands sit at plus and minus one brick size from that center line, showing you exactly how far price needs to move before the next brick would form. This makes the bands function as dynamic breakout levels. When price touches or crosses a band, you know a new renko brick is forming and the trend calculation is updating.
What makes this cool is the dual-purpose nature. You can use it like traditional volatility bands where the outer edges represent boundaries of normal price movement, and breaks beyond those boundaries signal potential trend continuation or exhaustion. But because the underlying calculation is renko rather than standard deviation or ATR around a moving average, the bands also give you direct insight into trend state. When the center line is rising consistently and price stays near the upper band, you're in a clean uptrend. When it's falling and price hugs the lower band, downtrend. When the center line is flat and price is bouncing between both bands, you're ranging.
The three brick sizing methods work the same way as standard renko implementations. Traditional sizing uses a fixed price range, so your bands are always the same absolute distance from the center line. ATR-based sizing calculates brick range from historical volatility, which makes the bands expand and contract based on the ATR measurement you chose at startup. Percentage-based sizing scales the brick size with price level, so the bands naturally widen as price increases and narrow as it decreases. This automatic scaling is particularly useful for instruments that move proportionally rather than in fixed increments.
The visual simplicity compared to full renko bricks makes this more practical for overlay use on your main chart. Instead of trying to read brick patterns in a separate pane or cluttering your price chart with boxes and lines, you get a single smoothed line with two bands that convey the same information about trend state and momentum. The center line shows you the filtered trend direction, the bands show you the threshold levels, and the relationship between price and the bands tells you whether the current move has legs or is stalling out.
From a trend-following perspective, the renko line naturally stays flat during consolidation and only moves when directional momentum is strong enough to complete bricks. This built-in filter removes a lot of the whipsaw that affects moving averages during choppy periods. Traditional moving averages continue updating with every bar regardless of whether meaningful directional movement is happening, which leads to false signals when price is just oscillating. The renko line only responds to sustained moves that meet the brick size threshold, so it tends to stay quiet when price is going nowhere and only signals when something is actually happening.
The bands also serve as natural stop-loss or profit-target references since they represent the distance price needs to move before the trend calculation changes. If you're long and the renko line is rising, you might place stops below the lower band on the theory that if price falls far enough to reverse the renko trend, your thesis is probably invalidated. Conversely, the upper band can mark levels where you'd expect the current brick to complete and potentially see some consolidation or pullback before the next brick forms.
What this really highlights is that renko's value isn't just in the brick visualization, it's in the underlying filtering mechanism. By extracting that mechanism and presenting it in a more traditional band format, you get access to renko's trend-following properties without needing to commit to the brick chart aesthetic or deal with the complications of overlaying brick drawings on a time-based chart. It's renko after all, so you get the trend filtering and directional clarity that makes renko useful, but packaged in a way that integrates more naturally with standard technical analysis workflows.

Bollinger Band ToolkitBollinger Band Toolkit
An advanced, adaptive Bollinger Band system for traders who want more context, precision, and edge.
This indicator expands on the classic Bollinger Bands by combining statistical and volatility-based methods with modern divergence and squeeze detection tools. It helps identify volatility regimes, potential breakouts, and early momentum shifts — all within one clean overlay.
🔹 Core Features
1. Adaptive Bollinger Bands (σ + ATR)
Classic 20-period bands enhanced with an ATR-based volatility adjustment, making them more responsive to true market movement rather than just price variance.
Reduces “overreacting” during chop and avoids bands collapsing too tightly during trends.
2. %B & RSI Divergence Detection
🟢 Green dots: Positive %B divergence — price makes a lower low, but %B doesn’t confirm (bullish).
🔴 Red dots: Negative %B divergence — price makes a higher high, but %B doesn’t confirm (bearish).
✚ Red/green crosses: RSI divergence confirmation — momentum fails to confirm the price’s new extreme.
These signals highlight potential reversal or slowdown zones that are often invisible to the naked eye.
3. Bollinger Band Squeeze (with Volume Filter)
Yellow squares (■) show periods when Bollinger Bands are at their narrowest relative to recent history.
Volume confirmation ensures the squeeze only triggers when both volatility and participation contract.
Often marks the “calm before the storm” — breakout potential zones.
4. Multi-Timeframe Breakout Markers
Optionally displays breakouts from higher or lower timeframes using different colors/symbols.
Lets you see when a higher timeframe band break aligns with your current chart — a strong trend continuation signal.
5. Dual- and Triple-Band Visualization (±1σ, ±2σ, ±3σ)
Optional inner (±1σ) and outer (±3σ) bands provide a layered volatility map:
Price holding between ±1σ → stable range / mean-reverting behavior
Price riding near ±2σ → trending phase, sustained momentum
Price touching or exceeding ±3σ → volatility expansion or exhaustion zone
This triple-band layout visually distinguishes normal movement from statistical extremes, helping you read when the market is balanced, expanding, or approaching its limits.
⚙️ Inputs & Customization
Choose band type (SMA/EMA/SMMA/WMA/VWMA)
Adjust deviation multiplier (σ) and ATR multiplier
Toggle individual features (divergence dots, squeeze markers, inner bands, etc.)
Multi-timeframe and colour controls for advanced users
🧠 How to Use
Watch for squeeze markers followed by a breakout bar beyond ±2σ → volatility expansion signal.
Combine divergence dots with RSI or price structure to anticipate slowdowns or reversals.
Confirm direction using multi-timeframe breakouts and volume expansion.
💬 Why It Works
This toolkit transforms qualitative chart reading (tight bands, hidden divergence) into quantitative, testable conditions — giving you objective insights that can be backtested, coded, or simply trusted in live setups.

Outside the Bollinger Bands Alerting Indicator Overview
The Outside the Bollinger Bands Alerting Indicator is a comprehensive technical analysis tool that combines multiple proven
indicators into a single, powerful system designed to identify high-probability reversal patterns at Bollinger Band extremes. This
indicator goes beyond simple band touches to detect sophisticated pattern formations that often signal strong directional moves.
Key Features & Capabilities
🎯 Advanced Pattern Recognition
Bollinger Band Breakout Patterns
- Detects "pierce-and-reject" formations where price breaks through a Bollinger Band but immediately reverses back inside
- Identifies failed breakouts that often lead to strong moves in the opposite direction
- Combines multiple confirmation signals: engulfing candle patterns, MACD momentum, and ATR volatility filters
- Visual alerts with symbols positioned below (bullish) or above (bearish) candles
Tweezer Top & Bottom Patterns
- Identifies consecutive candles with nearly identical highs (tweezer tops) or lows (tweezer bottoms)
- Requires at least one candle to breach the respective Bollinger Band
- Confirms reversal with directional close requirements
- Customizable tolerance settings for pattern sensitivity
- Visual alerts with ❙❙ symbols for easy identification
📊 Multi-Indicator Integration
Bollinger Bands Indicator
- Dual-band configuration with outer (2.0 std dev) and inner (1.5 std dev) bands that can be adjusted to suit your own parameters
- Configurable MA types: SMA, EMA, SMMA (RMA), WMA, VWMA
- Customizable length, source, and offset parameters
- Color-coded band fills for visual clarity
Moving Average Suite
- EMA 9, 21, 50, and 200 (individually toggleable)
- Special "SMA 3 High" for help visualizing and detecting Bollinger Band break-outs
- Dynamic color coding based on price relationship
Optional Ichimoku Cloud overlay
- Complete Ichimoku implementation with customizable periods
- Dynamic cloud coloring based on trend direction
- Toggleable overlay that doesn't interfere with other indicators
🚨 Comprehensive Alert System
Real-Time JSON Alerts
- Sends structured data on every confirmed bar close
- Includes all indicator values: BB levels, EMAs, MACD, RSI
- Contains signal states and crossover conditions
- Perfect for automated trading systems and webhooks
{"timestamp":1753118700000,"symbol":"ETHUSD","timeframe":"5","price":3773.3,"bollinger_bands":{"upper":3826.95,"basis":3788.32,"lower":3749.68},"emas":{"ema_9":3780.45,"ema_21":3788.92,"ema_50":3800.79,"ema_200":3787.74,"sma_3_high":3789.45},"macd":{"macd":-10.1932,"signal":-11.3266,"histogram":1.1334},"rsi":{"rsi":40.5,"rsi_ma":39.32,"level":"neutral"}}
Specific Alert Conditions
- MACD histogram state changes (rising to falling, falling to rising)
- RSI overbought/oversold crossovers
- All pattern detections (BB Bounce, Tweezer patterns)
- Bollinger Band breakout alerts
🎨 Visual Elements
Pattern Identification
- ♻ symbols for Bollinger Band breakout patterns (green for bullish, red for bearish)
- ❙❙ symbols for tweezer patterns (green below for bottoms, red above for tops)
- Color-coded band fills for trend visualization
Chart Overlay Options
- All moving averages with distinct colors
- Bollinger Bands with inner and outer boundaries
- Optional Ichimoku cloud with trend-based coloring
Trading Applications
Reversal Trading
- Identify high-probability reversal points at extreme price levels
- Use failed breakout patterns for entry signals
- Combine multiple timeframes for enhanced accuracy
Trend Analysis
- Monitor moving average relationships for trend direction
- Use Ichimoku cloud for trend strength assessment
- Track momentum with MACD and RSI integration
Risk Management
- ATR-based volatility filtering reduces false signals
- Multiple confirmation requirements improve signal quality
- Real-time alerts enable prompt decision making
Suggested Use
- Use on multiple timeframes for confluence
- Combine with support/resistance levels for enhanced accuracy
- Set up alerts for hands-free monitoring
- Customize settings based on market volatility and trading style
- Consider volume confirmation for stronger signals

Official USD Staggered Bands - ArgentinaOfficial USD Staggered Bands - Argentina
The Central Bank, under the administration of Javier Milei (La Libertad Avanza), announced on Friday, April 11, 2025, a series of measures to eliminate the so-called "exchange rate restriction."
In this new phase, the dollar's exchange rate on the Free Exchange Market (MLC) will be able to fluctuate within a band between $1,000 and $1,400 , the limits of which will be expanded at a rate of 1% monthly.
The lines evolve daily, increasing as the public administration predicts. This way, you can know the likelihood of a Central Bank intervention to correct the variation and return the peso to a price within the band.
The script runs under the ticker USDARS

AI Breakout Bands (Zeiierman)█ Overview
AI Breakout Bands (Zeiierman) is an adaptive trend and breakout detection system that combines Kalman filtering with advanced K-Nearest Neighbor (KNN) smoothing. The result is a smart, self-adjusting band structure that adapts to dynamic market behavior, identifying breakout conditions with precision and visual clarity.
At its core, this indicator estimates price behavior using a two-dimensional Kalman filter (position + velocity), then enhances the smoothing process with a nonlinear, similarity-based KNN filter. This unique blend enables it to handle noisy markets and directional shifts with both speed and stability — providing breakout traders and trend followers a reliable framework to act on.
Whether you're identifying volatility expansions, capturing trend continuations, or spotting early breakout conditions, AI Breakout Bands gives you a mathematically grounded, visually adaptive roadmap of real-time market structure.
█ How It Works
⚪ Kalman Filter Engine
The Kalman filter models price movement as a state system with two components:
Position (price)
Velocity (trend direction)
It recursively updates predictions using real-time price as a noisy observation, balancing responsiveness with smoothness.
Process Noise (Position) controls sensitivity to sudden moves.
Process Noise (Velocity) controls smoothing of directional flow.
Measurement Noise (R) defines how much the filter "trusts" live price data.
This component alone creates a responsive yet stable estimate of the market’s center of gravity.
⚪ Advanced K-Neighbor Smoothing
After the Kalman estimate is computed, the script applies a custom K-Nearest Neighbor (KNN) smoother.
Rather than averaging raw values, this method:
Finds K most similar past Kalman values
Weighs them by similarity (inverse of absolute distance)
Produces a smoother that emphasizes structural similarity
This nonlinear approach gives the indicator an AI feature — reacting fast when needed, yet staying calm in consolidation.
█ How to Use
⚪ Trend Recognition
The line color shifts dynamically based on slope direction and breakout confirmation.
Bullish conditions: price above the mid band with positive slope
Bearish conditions: price below the mid band with negative slope
⚪ Breakout Signals
Price breaking above or below the bands may signal momentum acceleration.
Combine with your own volume or momentum confirmation for stronger entries.
Bands adapt to market noise, helping filter out low-quality whipsaws.
█ Settings
Process Noise (Position): Controls Kalman filter’s sensitivity to price changes.
Process Noise (Velocity): Controls smoothing of directional component.
Measurement Noise (R): Defines how much trust is placed in price data.
K-Neighbor Length: Number of historical Kalman values considered for smoothing.
Slope Calculation Window: Number of bars used to compute trend slope of the smoothed Kalman.
Band Lookback (MAE): Rolling period for average absolute error.
Band Multiplier: Multiplies MAE to determine band width.
-----------------
Disclaimer
The content provided in my scripts, indicators, ideas, algorithms, and systems is for educational and informational purposes only. It does not constitute financial advice, investment recommendations, or a solicitation to buy or sell any financial instruments. I will not accept liability for any loss or damage, including without limitation any loss of profit, which may arise directly or indirectly from the use of or reliance on such information.
All investments involve risk, and the past performance of a security, industry, sector, market, financial product, trading strategy, backtest, or individual's trading does not guarantee future results or returns. Investors are fully responsible for any investment decisions they make. Such decisions should be based solely on an evaluation of their financial circumstances, investment objectives, risk tolerance, and liquidity needs.

Dynamic RSI Regression Bands (Zeiierman)█ Overview
The Dynamic RSI Regression Bands (Zeiierman) is a regression channel tool that dynamically resets based on RSI overbought and oversold conditions. It adapts to trend shifts in real time, creating a highly responsive regression framework that visualizes market sentiment and directional momentum with every RSI-triggered event.
Unlike static regression models, this indicator recalibrates its slope and deviation bands only after the RSI crosses predefined thresholds, helping traders pinpoint new phases of momentum, exhaustion, or reversal.
You’re not just measuring the trend — you’re tracking when and where the trend deserves to be re-evaluated.
█ The Assumption:
"A major momentum shift (RSI crossing OB/OS) signals a potential regime change, and thus, the trend model should be recalibrated from that point."
Instead of using a fixed-length regression (which assumes trend relevance over a static window), this script resets the regression calculation every time RSI crosses into extreme territory. The underlying idea is that extreme RSI levels often represent emotional peaks in market behavior and are statistically likely to be followed by a new price structure.
█ How It Works
⚪ RSI-Based Channel Reset
RSI is monitored continuously
If RSI crosses above the Overbought level, the indicator resets and starts a new regression channel
If RSI crosses below the Oversold level, the same reset logic applies
These events act as “anchor points” for dynamic trend analysis
⚪ Regression Channel Logic
A custom linear regression is calculated from the RSI reset point forward
The lookback grows with each bar after the reset, up to a user-defined max
Regression lines are drawn from the reset point to the current bar
⚪ Standard Deviation Bands
Upper and lower bands are plotted around the regression line using the standard deviation
These serve as dynamic volatility envelopes, great for spotting breakouts or reversals
⚪ Rejection Markers
If price hits the upper/lower band and then closes back inside it, a rejection marker is plotted
Helps visualize failed breakouts and areas of absorption or reversal pressure
█ How to Use
⚪ Detect Trend Shifts
Use the RSI resets to identify when the trend might be starting fresh.
⚪ Watch the Bands for Volatility Extremes
Use the outer bands as soft areas of potential reversal or momentum breakout.
⚪ Spot Rejections for Potential Entry Signals
If price moves outside a band but then quickly returns inside, it often means the breakout failed, and price may reverse.
█ Settings Explained
RSI Length – How many bars RSI uses. Shorter = faster.
OB / OS Levels – Crossing these triggers a regression reset.
Base Regression Length – Max number of bars regression can use post-reset.
StdDev Multiplier – Controls band width from the regression line.
Min Bars After Reset – Ensures channel doesn’t form immediately; waits for structure.
Show Reset Markers – Triangles mark where RSI crossed OB/OS.
Show Rejection Markers – Circles mark where the price rejected the channel edge.
-----------------
Disclaimer
The content provided in my scripts, indicators, ideas, algorithms, and systems is for educational and informational purposes only. It does not constitute financial advice, investment recommendations, or a solicitation to buy or sell any financial instruments. I will not accept liability for any loss or damage, including without limitation any loss of profit, which may arise directly or indirectly from the use of or reliance on such information.
All investments involve risk, and the past performance of a security, industry, sector, market, financial product, trading strategy, backtest, or individual's trading does not guarantee future results or returns. Investors are fully responsible for any investment decisions they make. Such decisions should be based solely on an evaluation of their financial circumstances, investment objectives, risk tolerance, and liquidity needs.

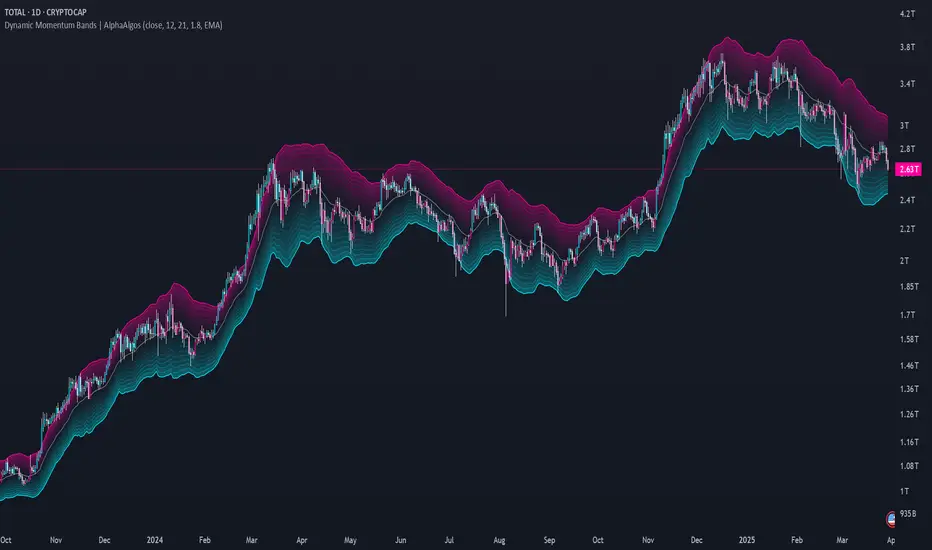
Dynamic Momentum Bands | AlphaAlgosDynamic Momentum Bands | AlphaAlgos
Overview
The Dynamic Momentum Bands indicator is an advanced technical analysis tool that combines multiple analytical techniques to provide a comprehensive view of market momentum and trend dynamics. By integrating RSI (Relative Strength Index), volatility analysis, and adaptive moving averages, this indicator offers traders a nuanced perspective on market conditions.
Key Features
Adaptive band calculation based on price momentum
Integrated RSI-driven volatility scaling
Multiple moving average type options (EMA, SMA, VWMA)
Smooth, gradient-based band visualization
Optional price bar coloring for trend identification
Technical Methodology
The indicator employs a sophisticated approach to market analysis:
1. Momentum Calculation
Calculates RSI using a customizable length
Uses RSI to dynamically adjust band volatility
Scales band width based on distance from the 50 RSI level
2. Band Construction
Applies a selected moving average type to the price source
Calculates deviation using ATR (Average True Range)
Smooths band edges for improved visual clarity
Configuration Options
Core Settings:
Price Source: Choose the price data used for calculations
RSI Length: Customize the RSI calculation period (1-50)
Band Length: Adjust the moving average period (5-100)
Volatility Multiplier: Fine-tune band width
Band Type: Select between EMA, SMA, and VWMA
Visual Settings:
Bar Coloring: Toggle color-coded price bars
Gradient-based band visualization
Smooth color transitions for trend representation
Trend Identification
The indicator provides trend insights through:
Color-coded bands (blue for bullish, pink for bearish)
Smooth gradient visualization
Optional price bar coloring
Trading Applications
Trend Following:
- Use band position relative to price as trend indicator
- Identify momentum shifts through color changes
- Utilize gradient zones for trend strength assessment
Volatility Analysis:
Observe band width changes
Detect potential breakout or consolidation periods
Use RSI-driven volatility scaling for market context
Best Practices
Adjust RSI length to match trading timeframe
Experiment with different moving average types
Use in conjunction with other technical indicators
Consider volatility multiplier for different market conditions
This indicator is provided for informational purposes only. Always use proper risk management when trading. Past performance is not indicative of future results. Not financial Advise
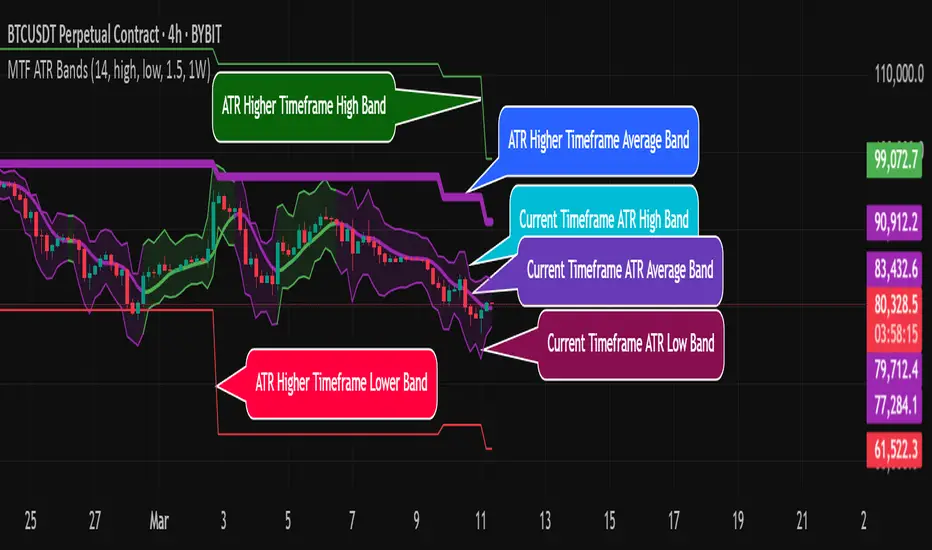
MTF ATR BandsA simple but effective MTF ATR bands indicator.
The script calculate and display ATR bands low and high of the current timeframe using high, low inputs and an RMA moving average, adding to it ATR of the period multiplied with the user multiplier, default is set to 1.5.
Than is calculated a smoothed average of the range and the color of it based on its slope, same color is used to fill the atr bands.
Than the higher timeframe bands are calculated and displayed on the chart.
How can be used ?
The higher timeframe average and bands can give you long term direction of the trend and the current timeframes moving average and filling short term trend, for example using the 15 min chart with a 4h HTF bands, or an 1h with a daily, or a daily with an weekly or weekly with bi-monthly atr bands.
Also can be used as a stop loss indicator.
Hope you will like it, any question send me a PM.
Accurate Bollinger Bands mcbw_ [True Volatility Distribution]The Bollinger Bands have become a very important technical tool for discretionary and algorithmic traders alike over the last decades. It was designed to give traders an edge on the markets by setting probabilistic values to different levels of volatility. However, some of the assumptions that go into its calculations make it unusable for traders who want to get a correct understanding of the volatility that the bands are trying to be used for. Let's go through what the Bollinger Bands are said to show, how their calculations work, the problems in the calculations, and how the current indicator I am presenting today fixes these.
--> If you just want to know how the settings work then skip straight to the end or click on the little (i) symbol next to the values in the indicator settings window when its on your chart <--
--------------------------- What Are Bollinger Bands ---------------------------
The Bollinger Bands were formed in the 1980's, a time when many retail traders interacted with their symbols via physically printed charts and computer memory for personal computer memory was measured in Kb (about a factor of 1 million smaller than today). Bollinger Bands are designed to help a trader or algorithm see the likelihood of price expanding outside of its typical range, the further the lines are from the current price implies the less often they will get hit. With a hands on understanding many strategies use these levels for designated levels of breakout trades or to assist in defining price ranges.
--------------------------- How Bollinger Bands Work ---------------------------
The calculations that go into Bollinger Bands are rather simple. There is a moving average that centers the indicator and an equidistant top band and bottom band are drawn at a fixed width away. The moving average is just a typical moving average (or common variant) that tracks the price action, while the distance to the top and bottom bands is a direct function of recent price volatility. The way that the distance to the bands is calculated is inspired by formulas from statistics. The standard deviation is taken from the candles that go into the moving average and then this is multiplied by a user defined value to set the bands position, I will call this value 'the multiple'. When discussing Bollinger Bands, that trading community at large normally discusses 'the multiple' as a multiplier of the standard deviation as it applies to a normal distribution (gaußian probability). On a normal distribution the number of standard deviations away (which trades directly use as 'the multiple') you are directly corresponds to how likely/unlikely something is to happen:
1 standard deviation equals 68.3%, meaning that the price should stay inside the 1 standard deviation 68.3% of the time and be outside of it 31.7% of the time;
2 standard deviation equals 95.5%, meaning that the price should stay inside the 2 standard deviation 95.5% of the time and be outside of it 4.5% of the time;
3 standard deviation equals 99.7%, meaning that the price should stay inside the 3 standard deviation 99.7% of the time and be outside of it 0.3% of the time.
Therefore when traders set 'the multiple' to 2, they interpret this as meaning that price will not reach there 95.5% of the time.
---------------- The Problem With The Math of Bollinger Bands ----------------
In and of themselves the Bollinger Bands are a great tool, but they have become misconstrued with some incorrect sense of statistical meaning, when they should really just be taken at face value without any further interpretation or implication.
In order to explain this it is going to get a bit technical so I will give a little math background and try to simplify things. First let's review some statistics topics (distributions, percentiles, standard deviations) and then with that understanding explore the incorrect logic of how Bollinger Bands have been interpreted/employed.
---------------- Quick Stats Review ----------------
.
(If you are comfortable with statistics feel free to skip ahead to the next section)
.
-------- I: Probability distributions --------
When you have a lot of data it is helpful to see how many times different results appear in your dataset. To visualize this people use "histograms", which just shows how many times each element appears in the dataset by stacking each of the same elements on top of each other to form a graph. You may be familiar with the bell curve (also called the "normal distribution", which we will be calling it by). The normal distribution histogram looks like a big hump around zero and then drops off super quickly the further you get from it. This shape (the bell curve) is very nice because it has a lot of very nifty mathematical properties and seems to show up in nature all the time. Since it pops up in so many places, society has developed many different shortcuts related to it that speed up all kinds of calculations, including the shortcut that 1 standard deviation = 68.3%, 2 standard deviations = 95.5%, and 3 standard deviations = 99.7% (these only apply to the normal distribution). Despite how handy the normal distribution is and all the shortcuts we have for it are, and how much it shows up in the natural world, there is nothing that forces your specific dataset to look like it. In fact, your data can actually have any possible shape. As we will explore later, economic and financial datasets *rarely* follow the normal distribution.
-------- II: Percentiles --------
After you have made the histogram of your dataset you have built the "probability distribution" of your own dataset that is specific to all the data you have collected. There is a whole complicated framework for how to accurately calculate percentiles but we will dramatically simplify it for our use. The 'percentile' in our case is just the number of data points we are away from the "middle" of the data set (normally just 0). Lets say I took the difference of the daily close of a symbol for the last two weeks, green candles would be positive and red would be negative. In this example my dataset of day by day closing price difference is:
week 1:
week 2:
sorting all of these value into a single dataset I have:
I can separate the positive and negative returns and explore their distributions separately:
negative return distribution =
positive return distribution =
Taking the 25th% percentile of these would just be taking the value that is 25% towards the end of the end of these returns. Or akin the 100%th percentile would just be taking the vale that is 100% at the end of those:
negative return distribution (50%) = -5
positive return distribution (50%) = +4
negative return distribution (100%) = -10
positive return distribution (100%) = +20
Or instead of separating the positive and negative returns we can also look at all of the differences in the daily close as just pure price movement and not account for the direction, in this case we would pool all of the data together by ignoring the negative signs of the negative reruns
combined return distribution =
In this case the 50%th and 100%th percentile of the combined return distribution would be:
combined return distribution (50%) = 4
combined return distribution (100%) = 10
Sometimes taking the positive and negative distributions separately is better than pooling them into a combined distribution for some purposes. Other times the combined distribution is better.
Most financial data has very different distributions for negative returns and positive returns. This is encapsulated in sayings like "Price takes the stairs up and the elevator down".
-------- III: Standard Deviation --------
The formula for the standard deviation (refereed to here by its shorthand 'STDEV') can be intimidating, but going through each of its elements will illuminate what it does. The formula for STDEV is equal to:
square root ( (sum ) / N )
Going back the the dataset that you might have, the variables in the formula above are:
'mean' is the average of your entire dataset
'x' is just representative of a single point in your dataset (one point at a time)
'N' is the total number of things in your dataset.
Going back to the STDEV formula above we can see how each part of it works. Starting with the '(x - mean)' part. What this does is it takes every single point of the dataset and measure how far away it is from the mean of the entire dataset. Taking this value to the power of two: '(x - mean) ^ 2', means that points that are very far away from the dataset mean get 'penalized' twice as much. Points that are very close to the dataset mean are not impacted as much. In practice, this would mean that if your dataset had a bunch of values that were in a wide range but always stayed in that range, this value ('(x - mean) ^ 2') would end up being small. On the other hand, if your dataset was full of the exact same number, but had a couple outliers very far away, this would have a much larger value since the square par of '(x - mean) ^ 2' make them grow massive. Now including the sum part of 'sum ', this just adds up all the of the squared distanced from the dataset mean. Then this is divided by the number of values in the dataset ('N'), and then the square root of that value is taken.
There is nothing inherently special or definitive about the STDEV formula, it is just a tool with extremely widespread use and adoption. As we saw here, all the STDEV formula is really doing is measuring the intensity of the outliers.
--------------------------- Flaws of Bollinger Bands ---------------------------
The largest problem with Bollinger Bands is the assumption that price has a normal distribution. This is assumption is massively incorrect for many reasons that I will try to encapsulate into two points:
Price return do not follow a normal distribution, every single symbol on every single timeframe has is own unique distribution that is specific to only itself. Therefore all the tools, shortcuts, and ideas that we use for normal distributions do not apply to price returns, and since they do not apply here they should not be used. A more general approach is needed that allows each specific symbol on every specific timeframe to be treated uniquely.
The distributions of price returns on the positive and negative side are almost never the same. A more general approach is needed that allows positive and negative returns to be calculated separately.
In addition to the issues of the normal distribution assumption, the standard deviation formula (as shown above in the quick stats review) is essentially just a tame measurement of outliers (a more aggressive form of outlier measurement might be taking the differences to the power of 3 rather than 2). Despite this being a bit of a philosophical question, does the measurement of outlier intensity as defined by the STDEV formula really measure what we want to know as traders when we're experiencing volatility? Or would adjustments to that formula better reflect what we *experience* as volatility when we are actively trading? This is an open ended question that I will leave here, but I wanted to pose this question because it is a key part of what how the Bollinger Bands work that we all assume as a given.
Circling back on the normal distribution assumption, the standard deviation formula used in the calculation of the bands only encompasses the deviation of the candles that go into the moving average and have no knowledge of the historical price action. Therefore the level of the bands may not really reflect how the price action behaves over a longer period of time.
------------ Delivering Factually Accurate Data That Traders Need------------
In light of the problems identified above, this indicator fixes all of these issue and delivers statistically correct information that discretionary and algorithmic traders can use, with truly accurate probabilities. It takes the price action of the last 2,000 candles and builds a huge dataset of distributions that you can directly select your percentiles from. It also allows you to have the positive and negative distributions calculated separately, or if you would like, you can pool all of them together in a combined distribution. In addition to this, there is a wide selection of moving averages directly available in the indicator to choose from.
Hedge funds, quant shops, algo prop firms, and advanced mechanical groups all employ the true return distributions in their work. Now you have access to the same type of data with this indicator, wherein it's doing all the lifting for you.
------------------------------ Indicator Settings ------------------------------
.
---- Moving average ----
Select the type of moving average you would like and its length
---- Bands ----
The percentiles that you enter here will be pulled directly from the return distribution of the last 2,000 candles. With the typical Bollinger Bands, traders would select 2 standard deviations and incorrectly think that the levels it highlights are the 95.5% levels. Now, if you want the true 95.5% level, you can just enter 95.5 into the percentile value here. Each of the three available bands takes the true percentile you enter here.
---- Separate Positive & Negative Distributions----
If this box is checked the positive and negative distributions are treated indecently, completely separate from each other. You will see that the width of the top and bottom bands will be different for each of the percentiles you enter.
If this box is unchecked then all the negative and positive distributions are pooled together. You will notice that the width of the top and bottom bands will be the exact same.
---- Distribution Size ----
This is the number of candles that the price return is calculated over. EG: to collect the price return over the last 33 candles, the difference of price from now to 33 candles ago is calculated for the last 2,000 candles, to build a return distribution of 2000 points of price differences over 33 candles.
NEGATIVE NUMBERS(<0) == exact number of candles to include;
EG: setting this value to -20 will always collect volatility distributions of 20 candles
POSITIVE NUMBERS(>0) == number of candles to include as a multiple of the Moving Average Length value set above;
EG: if the Moving Average Length value is set to 22, setting this value to 2 will use the last 22*2 = 44 candles for the collection of volatility distributions
MORE candles being include will generally make the bands WIDER and their size will change SLOWER over time.
I wish you focus, dedication, and earnest success on your journey.
Happy trading :)

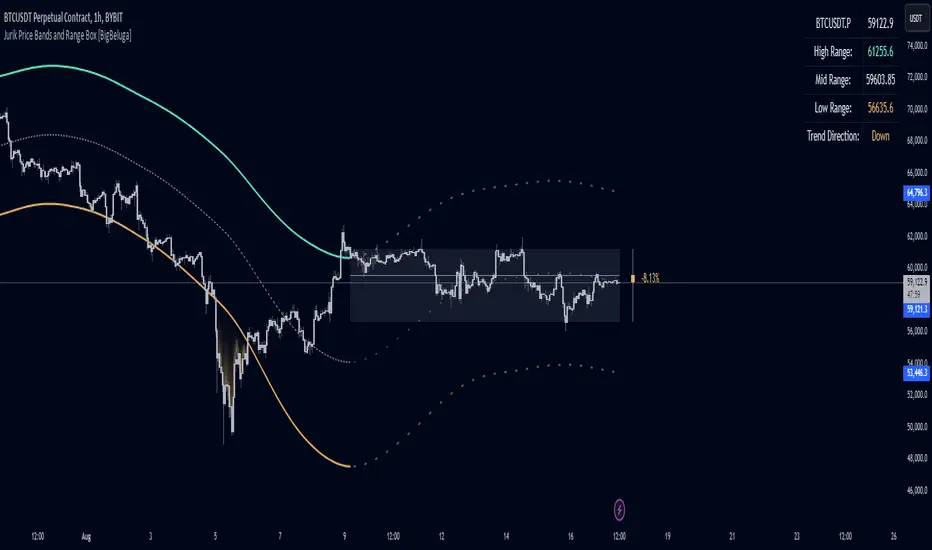
Jurik Price Bands and Range Box [BigBeluga]Jurik Price Bands and Range Box
The Jurik Price Bands and Range Box - BigBeluga indicator is an advanced technical analysis tool that combines Jurik Moving Average (JMA) based price bands with a dynamic range box. This versatile indicator is designed to help traders identify trends, potential reversal points, and price ranges over a specified period.
🔵 KEY FEATURES
● Jurik Price Bands
Utilizes Jurik Moving Average for smoother, more responsive bands
//@function Calculates Jurik Moving Average
//@param src (float) Source series
//@param len (int) Length parameter
//@param ph (int) Phase parameter
//@returns (float) Jurik Moving Average value
jma(src, len, ph) =>
var float jma = na
var float e0 = 0.0
var float e1 = 0.0
var float e2 = 0.0
phaseRatio = ph < -100 ? 0.5 : ph > 100 ? 2.5 : ph / 100 + 1.5
beta = 0.45 * (len - 1) / (0.45 * (len - 1) + 2)
alpha = math.pow(beta, phaseRatio)
e0 := (1 - alpha) * src + alpha * nz(e0 )
e1 := (src - e0) * (1 - beta) + beta * nz(e1 )
e2 := (e0 + phaseRatio * e1 - nz(jma )) * math.pow(1 - alpha, 2) + math.pow(alpha, 2) * nz(e2 )
jma := e2 + nz(jma )
jma
Consists of an upper band, lower band, and a smooth price line
Bands adapt to market volatility using Jurik MA on ATR
Helps identify potential trend reversal points and overextended market conditions
● Dynamic Range Box
Displays a box representing the price range over a specified period
Calculates high, low, and mid-range prices
Option for adaptive mid-range calculation based on average price
Provides visual representation of recent price action and volatility
● Price Position Indicator
Shows current price position relative to the mid-range
Displays percentage difference from mid-range
Color-coded for quick trend identification
● Dashboard
Displays key information including current price, range high, mid, and low
Shows trend direction based on price position relative to mid-range
Provides at-a-glance market context
🔵 HOW TO USE
● Trend Identification
Use the middle of the Range Box as the primary trend reference point
Price above the middle of the Range Box indicates an uptrend
Price below the middle of the Range Box indicates a downtrend
The bar on the right shows the percentage distance of the close from the middle of the box
This percentage indicates both trend direction and strength
Refer to the dashboard for quick trend direction confirmation
● Potential Reversal Points
Upper and lower Jurik Bands can indicate potential trend reversal points
Price reaching or exceeding these bands may suggest overextended conditions
Watch for price reaction at these levels for possible trend shifts or pullbacks
Range Box high and low can serve as additional reference points for price action
● Range Analysis
Use Range Box to gauge recent price volatility and trading range
Mid-range line can act as a pivot point for short-term price movements
Percentage difference from mid-range helps quantify price position strength
🔵 CUSTOMIZATION
The Jurik Price Bands and Range Box indicator offers several customization options:
Adjust Range Box length for different timeframe analysis
Toggle between standard and adaptive mid-range calculation
Standard:
Adaptive:
Modify Jurik MA length and deviation for band calculation
Toggle visibility of Jurik Bands
By fine-tuning these settings, traders can adapt the indicator to various market conditions and personal trading strategies.
The Jurik Price Bands and Range Box indicator provides a multi-faceted approach to market analysis, combining trend identification, potential reversal point detection, and range analysis in one comprehensive tool. The use of Jurik Moving Average offers a smoother, more responsive alternative to traditional moving averages, potentially providing more accurate signals.
This indicator can be particularly useful for traders looking to understand market context quickly, identify potential reversal points, and assess current market volatility. The combination of dynamic bands, range analysis, and the informative dashboard provides traders with a rich set of data points to inform their trading decisions.
As with all technical indicators, it's recommended to use the Jurik Price Bands and Range Box in conjunction with other forms of analysis and within the context of a well-defined trading strategy. While this indicator provides valuable insights, it should be considered alongside other factors such as overall market conditions, volume, and fundamental analysis when making trading decisions.
TrueLevel BandsTrueLevel Bands is a powerful trading indicator that employs linear regression and standard deviation to create dynamic, envelope-style bands around the price action of a financial instrument. These bands are designed to help traders identify potential support and resistance levels, trend direction, and volatility.
The TrueLevel Bands indicator consists of multiple envelope bands, each constructed using different timeframes or lengths, and a multiple (mult) factor. The multiple factor determines the width of the bands by adjusting the number of standard deviations from the linear regression line.
Key Features of TrueLevel Bands
1. Multi-Timeframe Analysis: Unlike traditional moving average-based indicators, TrueLevel Bands allow traders to incorporate multiple timeframes into their analysis. This helps traders capture both short-term and long-term market dynamics, offering a more comprehensive understanding of price behavior.
2. Customization: The TrueLevel Bands indicator offers a high level of customization, allowing traders to adjust the lengths and multiple factors to suit their trading style and preferences. This flexibility enables traders to fine-tune the indicator to work optimally with various instruments and market conditions.
3. Adaptive Volatility: By incorporating standard deviation, TrueLevel Bands can automatically adjust to changing market volatility. This feature enables the bands to expand during periods of high volatility and contract during periods of low volatility, providing traders with a more accurate representation of market dynamics.
4. Dynamic Support and Resistance Levels: TrueLevel Bands can help traders identify dynamic support and resistance levels, as the bands adjust in real-time according to price action. This can be particularly useful for traders looking to enter or exit positions based on support and resistance levels.
5. The "Global Trend Line" refers to the average of the bands used to indicate the overall trend.
Why TrueLevel Bands are Different from Classic Moving Averages
TrueLevel Bands differ from conventional moving averages in several ways:
1. Linear Regression: While moving averages are based on simple arithmetic means, TrueLevel Bands use linear regression to determine the centerline. This offers a more accurate representation of the trend and helps traders better assess potential entry and exit points.
2. Envelope Style Bands: Unlike moving averages, which are single lines, TrueLevel Bands form envelope-style bands around the price action. This provides traders with a visual representation of potential support and resistance levels, trend direction, and volatility.
3. Multi-Timeframe Analysis: Classic moving averages typically focus on a single timeframe. In contrast, TrueLevel Bands incorporate multiple timeframes, enabling traders to capture a broader understanding of market dynamics.
4. Adaptive Volatility: Traditional moving averages do not account for changing market volatility, whereas TrueLevel Bands automatically adjust to volatility shifts through the use of standard deviation.
The TrueLevel Bands indicator is a powerful, versatile tool that offers traders a unique approach to technical analysis. With its ability to adapt to changing market conditions, provide multi-timeframe analysis, and dynamic support and resistance levels, TrueLevel Bands can serve as an invaluable asset to both novice and experienced traders looking to gain an edge in the markets.

Trop BandsTrop Bands is a tool that uses an exponential moving average (EMA) as its central trendline and upper and lower bands to identify potential buying and selling opportunities in the market. The bands are calculated based on recent moves away from the EMA, and they are plotted around the central trendline to provide a visual representation of market trends and conditions. When the price moves outside of these bands, it can be seen as a signal that the security is overbought or oversold and may be ready for a reversal, just like Bollinger Bands.
In addition to providing signals when the price moves outside of the bands, the indicator can also show triangles outside/inside the bands. These triangles are based on the Demand Index developed by James Sibbet and are intended to provide additional confirmation of potential trading opportunities. They can be used in conjunction with other technical analysis tools to help identifying potential trading opportunities in the market.

Swing BandsThis indicator is a result of experimentation with price action of candle high and lows for quantifying reversals and trend continuation.
The band area shows trend reversal incoming and possible chop.
Middle line is the trend reversal price level. Candle colors change if the close price is above or below the middle line.
Long and short positions can be taken when above or below the bands.
Trend continuations are in effect when price retraces into the bands and breaks above or below in the same direction of the trend.

Regression Fit Bollinger Bands [Spiritualhealer117]This indicator is best suited for mean reversion trading, shorting at the upper band and buying at the lower band, but it can be used in all the same ways as a standard bollinger band.
It differs from a normal bollinger band because it is centered around the linear regression line, as opposed to the moving average line, and uses the linear regression of the standard deviation as opposed to the standard deviation.
This script was an experiment with the new vertical gradient fill feature.

Bollinger Bands Width and Bollinger Bands %BThis script shows both the Bollinger Band Width(BBW) and %B on the same indicator window.
Both the BBW and %B are introduced by John Bollinger(creator of Bollinger Bands) in 2010.
Default Parameter values: Length = 20, Source = Close, Mult = 2
Bollinger Bands Width (BBW): Color = (Default: Green )
- I consider stocks with "BBW >= 4" are at a volatile state and ready for price contraction, but this depends on the parameter values of your choice.
Bollinger Bands %B (%B): Color = (Default: Blue )
1. %B Above 10 = Price is Above the Upper Band
2. %B Equal to 10 = Price is at the Upper Band
3. %B Above 5 = Price is Above the Middle Line
4. %B Below 5 = Price is Below the Middle Line
5. %B Equal to 0 = Price is at the Lower Band
6. %B Below 0 = Price is Below the Lower Band

Rollin' pseudo-Bollinger Bands 5 linear regression curves and new highs/lows mixed together from the basis for this indicator. Using slightly different logic an upper boundary and lower boundary are formed. Then the boundary's are built upon to show price channels within the band using variations of fib levels and the distance between the initial boundary's. Dots plotted show the inverse of the close price relative to either the upper or lower boundary depending on where the close is relative to the center of the band. This shows the market's tendency for symmetry which is useful when looking for reversals etc. If it's too cluttered feel free to turn off some things in the options and keep what you feel is helpful.

CFB Adaptive MOGALEF Bands [Loxx]A Pine Script adaptation from MOGALEF Bands .
What are MOGALEF Bands?
Actual MOGALEF bands code is the final result of a lot of contributors. Syllables MO-GA-LEF are the initials of three of them.
The basic idea of bands: the markets are still in range, and trends that are moving ranges. The Mogalef bands try to estimate the current range and to project its on the future if prices move. This future estimation is often of great relevance and very useful, especialy for market profile users or pivot points users.
What is Composite Fractal Behavior ( CFB )?
All around you mechanisms adjust themselves to their environment. From simple thermostats that react to air temperature to computer chips in modern cars that respond to changes in engine temperature, r.p.m.'s, torque, and throttle position. It was only a matter of time before fast desktop computers applied the mathematics of self-adjustment to systems that trade the financial markets.
Unlike basic systems with fixed formulas, an adaptive system adjusts its own equations. For example, start with a basic channel breakout system that uses the highest closing price of the last N bars as a threshold for detecting breakouts on the up side. An adaptive and improved version of this system would adjust N according to market conditions, such as momentum, price volatility or acceleration.
Since many systems are based directly or indirectly on cycles, another useful measure of market condition is the periodic length of a price chart's dominant cycle, (DC), that cycle with the greatest influence on price action.
The utility of this new DC measure was noted by author Murray Ruggiero in the January '96 issue of Futures Magazine. In it. Mr. Ruggiero used it to adaptive adjust the value of N in a channel breakout system. He then simulated trading 15 years of D-Mark futures in order to compare its performance to a similar system that had a fixed optimal value of N. The adaptive version produced 20% more profit!
This DC index utilized the popular MESA algorithm (a formulation by John Ehlers adapted from Burg's maximum entropy algorithm, MEM). Unfortunately, the DC approach is problematic when the market has no real dominant cycle momentum, because the mathematics will produce a value whether or not one actually exists! Therefore, we developed a proprietary indicator that does not presuppose the presence of market cycles. It's called CFB (Composite Fractal Behavior) and it works well whether or not the market is cyclic.
CFB examines price action for a particular fractal pattern, categorizes them by size, and then outputs a composite fractal size index. This index is smooth, timely and accurate
Essentially, CFB reveals the length of the market's trending action time frame. Long trending activity produces a large CFB index and short choppy action produces a small index value. Investors have found many applications for CFB which involve scaling other existing technical indicators adaptively, on a bar-to-bar basis.
What is Jurik Volty used in the Juirk Filter?
One of the lesser known qualities of Juirk smoothing is that the Jurik smoothing process is adaptive. "Jurik Volty" (a sort of market volatility ) is what makes Jurik smoothing adaptive. The Jurik Volty calculation can be used as both a standalone indicator and to smooth other indicators that you wish to make adaptive.
What is the Jurik Moving Average?
Have you noticed how moving averages add some lag (delay) to your signals? ... especially when price gaps up or down in a big move, and you are waiting for your moving average to catch up? Wait no more! JMA eliminates this problem forever and gives you the best of both worlds: low lag and smooth lines.
Ideally, you would like a filtered signal to be both smooth and lag-free. Lag causes delays in your trades, and increasing lag in your indicators typically result in lower profits. In other words, late comers get what's left on the table after the feast has already begun.
Included:
-Color bars
-Fill levels
