Trade ManagerGreetings Traders! I have decided to release a few scripts as open-source as I'm sure others can benefit from them and perhaps make them better.(Be sure to check my Profile for the other scripts as well: www.tradingview.com).
This one is called Trade Manager.
How To Use Trade Manager
Trade Manager acquires potential targets by measuring the Average Change of Price from a user-defined resolution, from Open to Open. By default, the Resolution is set to 1 Day, however you can play around with Weekly, Monthly, etc. When a new resolution period begins, Trade Manager will automatically adjust its Targets based on the new Average Change of Price.
Due to the avoidance of Security() in this script, you may have to play around with the Timeframe that you use it in to ensure that you have enough bars on your chart to process the User-Defined Resolution.
The idea behind Trade Manager is quite simple yet can be quite powerful at the same time. Consider a Daily Candle for example. You can clearly see how a vast amount of price movement can be encapsulated within it, sometimes in both directions. By measuring the Average Change of Price per day(From Open to Open), we can use this Average to build targets off of. Defining a small Threshold above and below the Open Price of the Daily Candle allows you to set Limit Orders at these levels with predefined Targets. Then, the use of the custom Trailing Stop and Break Even helps to secure profits without giving too much back to the market, all while managing your risk.
Within the Settings of Trade Manager, you have the option to alter the logic of whether Break-Even is set after the first Target or second Target is hit.
In addition to using a User-Defined Resolution Period, you can also input a Custom Price into the settings of Trade Manager and allow the Targets, Trailing Stop, and Break Even to be calculated from the Custom Price.
I wanted to give a Special Thanks to @PineCoders for the Custom RoundToTick Function from The Backtesting/Trading Engine --> ()
As a note, there are times where price will break out very strongly from the Limit Price, sometimes crossing the Stop and Limit Price on the same bar. When this happens, it is difficult for Pine to determine which occurred first intra-bar, and as a result, it does not record a new position. In these instances, I'd recommend adjusting the Default Stop Multiple so it is below the bar.
If you like Trade Manager, be sure to Like, Follow, and if you have any questions, don't be afraid to drop a comment below.
"backtesting" için komut dosyalarını ara

Ichimoku systemThis script is to get backtesting results of ichimoku Cloud system .
>> tick buying only to watch backtesting results of buying trades ony other wise untick to see both buy and sell trade results (for intraday timeframe)
Tell me if you have any suggestions u i will try to include them in coming updates

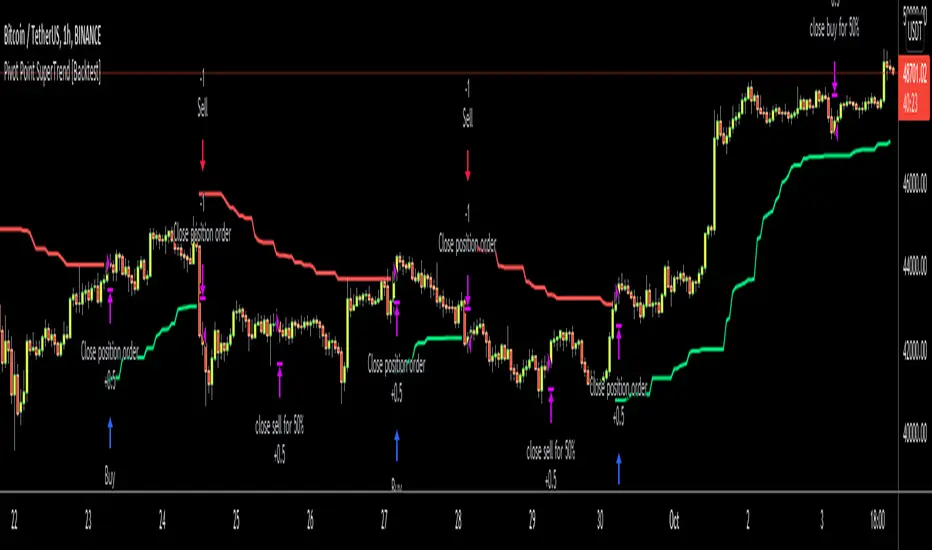
Pivot Point SuperTrend [Backtest]Hello All,
This is backtesting result of following indicator/strategy. I didn't work on adding other indicators. maybe in the future I can try to combine this with other indicators.
You can visit following link to see "Pivot Point SuperTrend" . by using this backtesting tool, you can test&find better options
There is option "Use Center Line to Close Entry for 50%" . by default it's not enabled. if you enable this option, pivot point center line may push you to close your entry for 50% (can be used as early stoploss/take profit line if you think it's risky)
Enjoy!
Stochastic Pop and Drop by Jake Bernstein v1 [Bitduke]I found a simple strategy by Jake Bernstein, modified it a little and created a strategy with Risk Management System (SL+TP); After that I test it on the different cryptocurrency pairs.
About the Indicator
Basically it's the strategy of 2 indicators: Stochastic Oscillator to define the bias and Average Directional Index to confirm it.
One again, It uses Stochastic Oscillator to define the trading bias. In particular, the trading bias was deemed bullish when the weekly 14-period Stochastic Oscillator was above some default value (in him paper - 50) and rising and vice versa.
Once the trading bias is established, Steckler used the Average Directional Index (ADX) to define a slowdown in the trend. ADX measures the strength of the trend and a move below 20 signals a weak trend.
Modifications
I didn't implement Average Directional Index (ADX) and test just different sources for data, oscillator periods and different levels in relation to the crypto market.
So, it shows good results with two tight thresholds at 55 and 45 level.
The bar chart below the defining the bullish and bearish periods (green and red) and gives a signal to enter the trade (purple bars).
Backtesting
Backtested on XBTUSD , BTCPERP (FTX) pairs. You may notice it shows good results on 3h timeframe.
Relatively low drawdown
~ 10% (from 2019 to date) FTX
~ 22% (4 years from 2016) Bitmex
I backtested on the different altcoin pairs as well, but the results were just not good.
Relatively good results were shown by some index pairs from the FTX exchange ( FTX:SHITPERP ), but I think there is a few data for backtesting to be asure in them.
Bitmex 3h (2017 - 2020) :
i.imgur.com
FTX 3h (2019 - 2020):
i.imgur.com
Possible Improvements
- Regarding trading algorithm it would be good to check with strategy with ADX somehow. Maybe for the better entries
- As for Risk Management system, it can be improved by adding trailing stop to the strategy.
Link: school.stockcharts.com

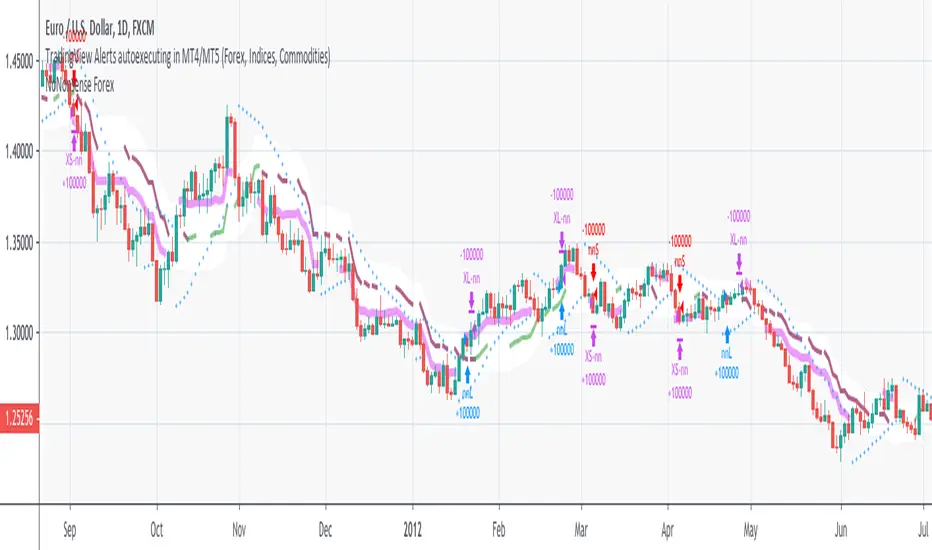
NoNonsense Forex - high timeframe trading absurd NON-REPAINTINGSome time ago I bumped into NoNonsense Forex - pretty good-looking course with well-designed videos, reasonable rules, etc. Nice explanatory videos, not selling anything, building indicators-only strategy. But there was one thing that really annoyed me - it was supposed to work only on Daily timeframe. What is the point in trading such high timeframe, if decisions changing market direction are playing out within 1 minute? What is the point in evaluating trades from 1994 if we are 25 years later?
Anyway, I have developed this strategy, which is:
- non-repainting
- not using trailing-stop
- not using any other known TradingView backtest bugs
And I'm showing it as an example of OVERFITTING. Backtesting results look absurd: 100% profitable. But if you change any of the many parameters in the Settings popup, they will turn into disaster. It means, the rules of this strategy are very fragile. Don't trade this! Remember about backtesting rule #1: past results do not guarantee success in the future.
I'm giving this strategy out with the source code. Feel free to do anything you want with it. But if you find parameters or modifications on, which allow profitable trading on lower timeframes, don't be shy, let me know :)
*********
Forex / Indices / Commodities traders who want to start AUTO-TRADING might want to take a look at "TradingConnector", which allows no-latency trades execution from TradingView to MT4/MT5.
Visual RSI [LucF]Visual RSI offers a different way of looking at RSI by providing a composite representation of 9 different RSI-generated components. Instead of focusing on one line only, this approach blends multiple sources to provide the viewer with a larger context RSI-based picture.
For those who don’t want to read
• Green in bullish (>50) zone is the most bullish.
• Red in bullish zone doesn’t necessarily mean bearish—it just means bullish strength is weakening. It may be just a pause before a reprise or exhaustion signalling a reversal—impossible to tell.
• The same in inverse applies to the bearish zone (<50).
For those who want to understand
The nine components making up Visual RSI are:
• a current timeframe RSI
• a higher timeframe RSI
• the delta between these two RSI lines
• for each of these three basic components, two independent Bollinger band: one calculated for the bullish section of the scale (>50) and a separate one calculated for the lower bearish region.
Dual BBs
In my view, RSI’s position with regards to the centerline is much more important than its position in extreme areas. Why? Because the building block of RSI is the ratio of the averages of up/down moves during the RSI period. When the average of ups is greater, RSI is > 50. So while a rising signal starting from 20 let’s say, indicates that the rate of change is increasing, only when it crosses 50 can we say that sentiment balance has truly become bullish, and this information is more reliable than the signal being at a level corresponding to whatever estimate we make of what constitutes an extreme value. In my landscape, the general balance of a ratio provides more valuable information than the ratio’s exact value.
The idea behind the dual BBs is to provide independent tracking information for both halves of the indicator’s space, which I find more useful than the normal method of simply adding a multiple of the standard deviation on both sides of the mean. With dual BBs, the upper BB will never go lower than the indicator’s centerline, and the lower BB will never go higher. The upper BB focuses on upper-bound volatility when the signal is bearish, and the lower BB focuses on downside volatility when the signal is bearish.
The functions used to calculate the independent BBs are reusable on other signals if a centerline can be defined for them. A clamping percentage is implemented, so that when a BB line is hugging the centerline it clamps to it. This helps in providing earlier signals when they use the BB line states.
Providing context to RSI
What RSI measures indirectly is the balance in the rate of change—or the speed of price movement, but not its instant value, otherwise RSI would be even noisier. More precisely, RSI represents the relative strength of the up/down movement in the last n bars of RSI’s length, with 14 often used because that’s what Wilder proposed (Visual RSI’s defaults are 20 for the current timeframe and 40 for the higher timeframe). At every bar, a new value is added to the equation and an old value carrying equal weight is dropped, so a large dropped off value will have more impact on RSI’s value if the new bar’s move is small. This accounts for some of RSI’s speed in identifying exhaustion after important moves, but almost for some of its noise.
Visual RSI is the result of trying to drown RSI’s noise in the context of other informational streams, while simultaneously providing even faster information than RSI alone, by giving more visual weight to the delta between the current and higher timeframe RSI’s.
How to read Visual RSI
The default settings show all 9 basic components as green/red areas of intensities varying with their importance. The most intense colors are reserved for the delta RSI and the BBs have the lightest intensities. The individual lines of components are intentionally difficult to distinguish so that focus is first on the general picture, including the all-important six-state background, and then on the delta RSI.
One entry setup could be reversals in a larger trend context, so low pivots of the delta in a fully bullish context (a green background in the upper section of the indicator), and inversely, high pivots in a fully bearish context (a red background in the lower section of the indicator).
Please resist the common misconception, when interpreting RSI, that a reversal in the signal will necessarily lead to a reversal in price. Each trend has its rhythm. Only machine-generated price action can progress regularly. It’s normal for trends to take a breather for some time before they continue or reverse, as traders driving the trend experience emotional fatigue and gradual fear. RSI reversals merely signify that such a breather has occurred—nothing more. Only the larger context can provide information that can situate that pause and put more meaningful odds on it having more probability of continuing in one direction or the other. This is the reasoning behind the setup just described.
Features
• All components can be hidden, displayed as a simple line, a uniformly colored fill, or a green/red fill (the default).
• The background can be colored using 9 different methods, including 3 six-state methods using the rising/falling BB lines of the 3 basic components. These six states allow for bullish/bearish/neutral sentiment in both the upper and lower regions of the indicator. A bearish (dark red) background in the bullish (>50) section of the indicator represents decreasing bullishness. A bearish (slightly brighter red) in the bearish (<50) section of the indicator means incresingly bearish sentiment. The six-state backgrounds allow for neutral (no color) sentiment when no compelling signs can be found to conclude anything with meaningful odds. The default background uses the six-state method on the higher timeframe RSI’s BBs because I find it the most useful, as it represents the largest—and slowest—context sentiment among all the indicator’s components.
• A thin status bar in the top part of the indicator also allows selection of the same 9 methods to color it. The default is a triple-state system using the rising/falling characteristics of the current timeframe RSI’s BBs to provide a short-term counterbalance to the long-term background.
• Three different markers can be configured using approximately 70 permutations each, each filtered by 20 different filter permutations. When modification of the relevant parameters in the script’s Settings/Settings/Parameters section is added, possibilities are almost endless. If the generated signals are then fed into the PineCoders Engine and combined with the Engine’s own options, the permutations go up another order of magnitude, and changes to any setting can be instantly evaluated using the Engine’s backtesting results.
• Five simple filters can be combined. They are additive. They include volume-related conditions and a chandelier, which I find useful because both volume and volatility (the chandelier using highs/lows and ATR) are sensible complementary sources to RSI’s momentum information. The filter’s state can be shown as a thin line at the bottom of the indicator.
• Alerts can be configured using any of the marker/filter combinations mentioned. As usual, once your markers/filters are set up the way you want, create your alert from the chart/timeframe you want the alert to run on and be sure to use the “Once Per Bar Close” triggering condition. Use an alert message that will remind you of which combination of markers were used when creating the alert.
• A plot providing entry signals for the PineCoders Backtesting & Trading Engine is supplied. It will use whichever marker/filter configuration is active to generate signals.
• All higher timeframe information is non-repainting. Higher timeframe lines can be smoothed (the default). The selection of the higher timeframe can be made using 3 different methods:
1. By steps (if current timeframe <= 1 minute: 60 min, <= 60 min: 1D, <= 6H: 3D, <= 1D: 1W, <=1W: 1M, >1W: 12M)
2. By a user-defined multiple of the current timeframe
3. Using a fixed timeframe
Thanks to:
• Alex Orekhov aka @everget for the chandelier code.
• @RicardoSantos who through a small remark early on, unknowingly put me on the track of eliminating noise through visual crowding.
• The brilliant guys in the PineCoders Pro room for your knowledge, limitless creativity and constant companionship.

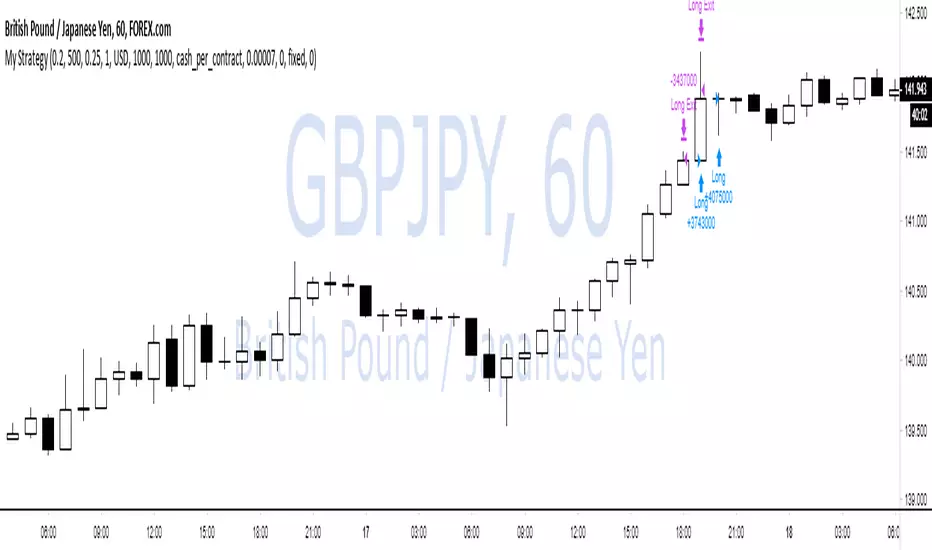
WOW no repainting and no security() call! 100% real results!If you couldn't tell by the title, this is a joke lmao.
TV has an awful backtesting engine and I just wanted to prove this with a super simple script.
We buy when close > open
and sell when close < open.
That's it.
There is also some risk management and trade closing when we reach a certain drawdown, but wait!
TradingView doesn't know what equity drawdown is because they don't use tick data or any lower timeframe data! Wowow!
Ps - all tickdata for Forex & CFD historical data is free from Dukascopy if you want to perform your own backtesting ;)
Dukascopy Data
Enjoy
-DasanC
Multiple Moving Averages Alerts ScriptAlerts script that has triggers on multiple moving average crossovers so that profit is maximised, it also has an optional control moving average, enabled by default, that when active will stop trading when the price (first ma) is below the control moving average.
Source code is open so that others can use and modify
Click Below for Backtesting version:
Disclaimers, not an expert, not intended to be financial advise.
Biffy
Two Bar Break Line Alerts R1.0 by JustUncleLThis indicator with default settings is designed for BINARY OPTIONS trading. The indicator can also be used for Forex trading with some setting changes. The script shows Two Bar Pullback Break lines and alerts when those Break lines are Touched (broken) creating a short term momentum entry condition.
For a Bullish Break (Green Up Arrow) to occur: first must have two (or three) consecutive bear (red) candles which is followed by a bull (green) candle creating a pivot point. The breakout occurs then the High of the current Bull (green) exceeds the highest point of the previous two (or three) pivotal bear candles. The green channel Line shows where the current Bullish BreakOut occurs.
For a Bearish Break (Red Down Arrow) to occur: first must have two (or three) consecutive bull (green) candles which is followed by a bear (red) candle creating a pivot point. The breakout occurs when the Low of the current Bear (red) drops below the lowest point of the previous two (or three) pivotal Bull candles. The red channel Line shows where the current Bearish BreakOut occurs.
The break Line Arrows can optionally be filtered by the Coloured MA (enabled by default), a longer term directional MA (disabled by default) and/or a MACD condition (enabled by default) as a momentum filter.
You can optionally select three Bar break lines instead of two. The three bar break lines are actually equivalent to Guppy's Three Bar Count Back Line method for trade entries (see Guppy's video reference below).
Included in this indicator is an ability to display some basic Binary Option statistics, when enabled (enabled by default) it shows Successful Bars in Yellow and failed Bars in Black and the last Nine numbers on the script title line represent the Binary option Statistics in order:
%ITM rate
Total orders
Successful Orders
Failed Orders
Total candles tested
Candles per Day
Trades per Day
Max Consecutive Wins
Max Consecutive Losses
You can start the Binary Option statistics from a specific Date, which is handy for checking more recent history.
HINTS:
BINARY OPTIONS trading: use 5min, 15m, 1hr or even Daily charts. Trade after the price touches one of the Breakout lines and the Arrow first appears. Wait for the price to come back from Break Line by 1 or 2 pips, the alert arrow must stay on and candle change to black, then take Binary trade expiry End of Candle. If price pull back and arrow turns off, don't trade this candle, move on you probably don't have momentum, there will be plenty of other trigger events. The backtesting results are good with ITM rates 65% to 72% on many currency pairs, commodities and indices. Realtime trading has confirmed the backtesting results and they could even be bettered, provided you are selective on which signals to trade (strong MACD support etc), that you are patient and disciplined to this trading method.
FOREX trading: the default settings should work with scalping. For longer term trades try with settings change to a more standard MACD filter or slower to catch the longer term momentum swings and the idea would be to trade the first Break Line alert that occurs after a decent Pullback in the direction of the trend. Setting the SL to just above/below the Pivot High/Low and set target to two or three times SL.
References:
"Fundamentals of Price Action Trading for Forex, Stocks, Options and Futures" video:
www.youtube.com
Other videos by "basecamptrading" on Naked Trading.
"Taking Profits in Today's Market by Daryl Guppy" video:
www.youtube.com

Updated TurtlesThis script has been updated to prevent double orders (short/long) from occurring and modifying backtests results.
This is an update to the script that was written a few years ago to prevent double longs/shorts from occurring and skewin backtesting results. Check out the updated indicator here and let me know what you think.
I also added:
- date range inputs if you want to do some backtesting on a particular set of dates.
- the ability to toggle shorting

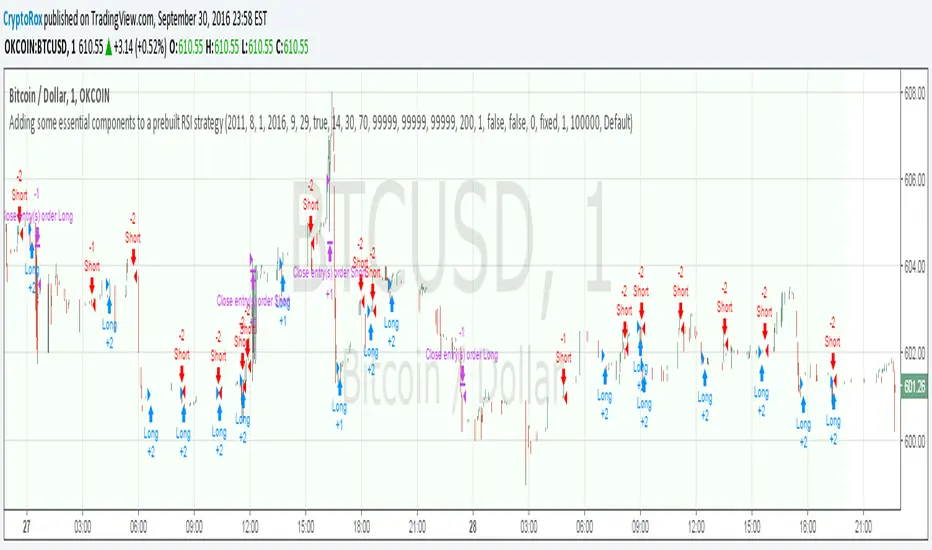
Adding some essential components to a prebuilt RSI strategyThis is more to be used as a blank_slate for any strategy build adding more effective backtesting with a period selector and inputs like TS, TP, SL that can all be used as plots for alerts.
It has the BackTest Component created by Pbergden
It also includes the standard long/short with trailing stop, take profit, stop loss and margin call.
Here is a video using the blank_slate to add in the built-in RSI Strategy.
youtu.be
We hope this brings good results and helps speed things up for everyone.
CM Stochastic POP Method 2-Jake Bernstein_V1Yesterday Jake Bernstein authorized me to post his updated results with the Stochastic Pop Trading System he developed many years ago.
You can take a look at the Original System with Updated Settings at
This indicator is a different set of rules Jake mentioned in the PDF he allowed me to post.
To view the PDF use this link:
dl.dropboxusercontent.com
Today we’re releasing the version described in the PDF that uses the StochK values of 55, 50, and 45. The rules are discussed in the PDF but here is a simple breakdown:
Enter Long when StochK is below 50 and Crosses Above 55
Exit Long on Cross Below 55
Enter Short when StochK is Above 50 and crosses Below 45
Exit Short on Cross Above 45
Two Important Items to understand about this method:
To code the rules Precisely we need a function that will be available when Strategy Capabilities are released on TradingView.
There is one of Jakes Profit Maximizing Strategies that needs to be integrated with this code…which again we need the Strategy based Function that will be coming soon.
To Compare this system to the Stochastic Pop Method 1 System shown yesterday at I used the same Symbol and dates for you to compare…but remember to give this Method 2 System a Fair Look/Evaluation…we need the Soon To Be Released…TradingView Strategy Capabilities.
BackTesting Results Example: EUR-USD Daily Chart Since 01/01/2005
Strategy 1 – Stochastic Pop Method 2 System:
Go Long When Stochasticis below 50 and Crosses Above 55. Go Short When Stochastic is above 50 and Crosses Below 45. Exit Long/Short When Stochastic has a Reverse Cross of Entry Value.
Results:
Total Trades = 151
Profit = 40,758 Pips
Win% = 37.1%
Profit Factor = 1.26
Avg Trade = 270 Pips Profit
***Most Consecutive Wins = 4 ... Most Consecutive Losses = 7
Strategy 2:
Rules - Proprietary Optimization Jake Will Teach. Only Added 1 Additional Exit Rule.
Results:
Total Trades = 151
Profit = 60.305 Pips
Win% = 37.1%
Profit Factor = 1.38
Avg Trade = 399 Pips Profit
***Most Consecutive Wins = 4 ... Most Consecutive Losses = 7
Indicator Includes:
-Ability to Color Candles (CheckBox In Inputs Tab)
Green = Long Trade
Blue = No Trade
Red = Short Trade
Jake Bernstein will be a contributor on TradingView when Backtesting/Strategies are released. Jake is one of the Top Trading System Developers in the world with 45+ years experience and he is going to teach TradingView.com’s community how to create Trading Systems and how to Optimize the correct way.
Link To PDF:
dl.dropboxusercontent.com
Link to Original Version of Indicator with Updated Settings.

CM Stochastic POP Method 1 - Jake Bernstein_V1A good friend ucsgears recently published a Stochastic Pop Indicator designed by Jake Bernstein with a modified version he found.
I spoke to Jake this morning and asked if he had any updates to his Stochastic POP Trading Method. Attached is a PDF Jake published a while back (Please read for basic rules, which also Includes a New Method). I will release the Additional Method Tomorrow.
Jake asked me to share that he has Updated this Method Recently. Now across all symbols he has found the Stochastic Values of 60 and 30 to be the most profitable. NOTE - This can be Significantly Optimized for certain Symbols/Markets.
Jake Bernstein will be a contributor on TradingView when Backtesting/Strategies are released. Jake is one of the Top Trading System Developers in the world with 45+ years experience and he is going to teach how to create Trading Systems and how to Optimize the correct way.
Below are a few Strategy Results....Soon You Will Be Able To Find Results Like This Yourself on TradingView.com
BackTesting Results Example: EUR-USD Daily Chart Since 01/01/2005
Strategy 1:
Go Long When Stochastic Crosses Above 60. Go Short When Stochastic Crosses Below 30. Exit Long/Short When Stochastic has a Reverse Cross of Entry Value.
Results:
Total Trades = 164
Profit = 50, 126 Pips
Win% = 38.4%
Profit Factor = 1.35
Avg Trade = 306 Pips Profit
***Most Consecutive Wins = 3 ... Most Consecutive Losses = 6
Strategy 2:
Rules - Proprietary Optimization Jake Will Teach. Only Added 1 Additional Exit Rule.
Results:
Total Trades = 164
Profit = 62, 876 Pips!!!
Win% = 38.4%
Profit Factor = 1.44
Avg Trade = 383 Pips Profit
***Most Consecutive Wins = 3 ... Most Consecutive Losses = 6
Strategy 3:
Rules - Proprietary Optimization Jake Will Teach. Only added 1 Additional Exit Rule.
Results:
Winning Percent Increases to 72.6%!!! , Same Amount of Trades.
***Most Consecutive Wins = 21 ...Most Consecutive Losses = 4
Indicator Includes:
-Ability to Color Candles (CheckBox In Inputs Tab)
Green = Long Trade
Blue = No Trade
Red = Short Trade
-Color Coded Stochastic Line based on being Above/Below or In Between Entry Lines.
Link To Jakes PDF with Rules
dl.dropboxusercontent.com

Inside Bar Zones by AAK (V6)📦 Smart Inside Bar Zones
Smart Inside Bar Zones is a price-action–based indicator designed to automatically detect, track, and visualize inside bar consolidation zones with full historical context.
Instead of marking single inside candles, this indicator groups consecutive inside bars into structured zones, locking the original mother candle range and extending it until price breaks out. This allows traders to clearly identify areas of compression, balance, and potential expansion.
🔍 Key Features
Automatic Inside Bar Detection
Identifies inside bars using candle bodies within the mother candle range, with an optional tick buffer.
Smart Zone Creation
Consecutive inside bars are grouped into a single zone, anchored to the original mother candle.
Unlimited Historical Storage (Data)
All previous inside bar zones are stored internally, enabling long-term analysis and backtesting.
Safe & Optimized Drawing
Zones are drawn using recyclable boxes to respect TradingView object limits while maintaining performance.
Highlight Inside Bars
Optional candle coloring for quick and clear visual confirmation.
Flexible Display Options
Show only the latest zone
Or display multiple zones with automatic recycling
📈 How Traders Use It
Identify consolidation before expansion
Spot compression zones for breakout or fakeout scenarios
Combine with SMC, order flow, support & resistance, or liquidity concepts
Use higher-timeframe zones for directional bias
Use lower-timeframe zones for entries and scalps
⚠️ Important Notes
This indicator does not predict direction — it highlights structure
Zones represent price balance, not buy or sell signals
Best used in confluence with your trading strategy and risk management
🧠 Designed For
Price action traders
SMC / market structure traders
Forex, crypto, indices, and futures
Any timeframe
⚠️ Risk Disclaimer
This indicator is for educational purposes only and is not financial advice. Trading involves significant risk, and losses may exceed expectations. Past performance does not guarantee future results. Always use proper risk management and trade at your own discretion.

StealthFX Signals NavigatorThe StealthFX Signals Navigator is a high-performance trend-following suite designed for traders who demand institutional-grade clarity without the clutter. Inspired by the sleek aesthetics of premium toolkits like LuxAlgo, this indicator strips away the noise to provide a singular, high-probability "path of least resistance" for your trades.
🛡️ The Core Philosophy: "Trade with the Giant"
Most retail traders fail because they fight the primary trend. The Navigator solves this by using a 200-period EMA Filter.
Blue Signals (BUY): Only occur when price action is confirmed above the 200 EMA.
Purple Signals (SELL): Only occur when price action is confirmed below the 200 EMA.
🎯 Precision Entry & Risk Management
Stop guessing where to exit. The Navigator uses a volatility-adjusted ATR engine to calculate your targets the moment a signal prints.
Pip-Clamped Logic: To ensure trades remain realistic, the script automatically clamps your Stop Loss between 30 and 100 pips (with a hard safety cap at 200), making it ideal for Forex and Indices.
1:2 Risk-Reward: Every signal aims for a mathematical edge, setting a Take Profit (Blue Line) that is double the distance of your Stop Loss (Purple Line).
🧹 The "Clean Chart" Evolution
We believe a cluttered chart leads to a cluttered mind.
Smart-Hiding: Unlike standard indicators that leave old lines everywhere, the Navigator tracks price in real-time. The moment your TP or SL is touched, the lines vanish.
Signal Priority: The script resets with every new momentum shift, ensuring you are always looking at the most relevant trade setup.
🚀 Key Features
Modern Aesthetic: A sleek Neon Blue & Deep Purple theme designed for dark-mode enthusiasts.
Universal Scaling: Works across Forex, Crypto, and Stocks thanks to its "Mintick" sensitive calculation engine.
Zero Repaint: Signals confirm on the close of the bar, providing stable historical data for backtesting.
Integrated Alerts: Set-and-forget notifications for both Buy and Sell entries.
📈 How to Use
Identify the Bias: Watch the gray 200 EMA.
Execute: When a label appears, immediately set your limit orders at the displayed Blue (TP) and Purple (SL) levels.
Patience: Let the trade run. The lines will disappear automatically once the outcome is decided.
Best Timeframes: 15m, 1h, 4h. Best Assets: Major FX Pairs (EURUSD, GBPUSD), Gold (XAUUSD), and US Tech Indices.

[CodaPro] Multi-Timeframe RSI Dashboard v1.1
v1.1 Update - Fixed Panel Positioning
After initial release, I realized the indicator was displaying overlayed on the price chart instead of in its own panel. This has been corrected!
Changes:
- Fixed: Indicator now displays in separate subpanel below price chart (much cleaner!)
- Improved: 5min and 1H RSI lines are now bold and prominent for easier reading
- Improved: 15min, 4H, and Daily lines are subtle/transparent for context
- Updated: Default levels changed to 40/60 (tighter, high-conviction signals)
- Updated: All 5 timeframes now active by default (toggle any off in settings)
Thanks for the patience on this quick fix! The indicator should now display properly in its own panel below your price chart.
If you were using v1.0, please remove it from your chart and re-add the updated version.
Happy trading!
Multi-Timeframe RSI Dashboard
This indicator displays RSI (Relative Strength Index) values from five different timeframes simultaneously in a clean dashboard format, helping traders identify momentum alignment across multiple time periods.
═══════════════════════════════════════
FEATURES
✓ Displays RSI for 5 customizable timeframes
✓ Color-coded status indicators (Oversold/Neutral/Overbought)
✓ Clean table display positioned in chart corner
✓ Fully customizable RSI length and threshold levels
✓ Works on any instrument and timeframe
✓ Real-time updates as price moves
✓ Smart BUY/SELL signals with cooldown system
✓ Non-repainting - signals never disappear after appearing
═══════════════════════════════════════
HOW IT WORKS
The indicator calculates the standard RSI formula for each selected timeframe and displays the results in both a graph and organized table. Default timeframes are:
- 5-minute
- 15-minute
- 1-hour
- 4-hour (optional - hidden by default)
- Daily (optional - hidden by default)
Visual Display:
- Graph shows all RSI lines in subtle, transparent colors
- Lines don't overpower your price chart
- Dashboard table shows exact values and status
Color Coding:
- GREEN = RSI below 32 (traditionally considered oversold)
- YELLOW = RSI between 32-64 (neutral zone)
- RED = RSI above 64 (traditionally considered overbought)
All timeframes and thresholds are fully adjustable in the indicator settings.
═══════════════════════════════════════
SIGNAL LOGIC
BUY Signal:
- Triggers when ALL 3 primary timeframes drop below the buy level (default: 32)
- Arrow appears near the RSI lines for easy identification
- 120-minute cooldown prevents signal spam
SELL Signal:
- Triggers when ALL 3 primary timeframes rise above the sell level (default: 64)
- Arrow appears near the RSI lines for easy identification
- 120-minute cooldown prevents signal spam
The cooldown system ensures you only see HIGH-CONVICTION signals, not every minor fluctuation.
═══════════════════════════════════════
SCREENSHOT FEATURES VISIBLE
- Multi-timeframe RSI lines (5min, 15min, 1H) in subtle colors
- Smart BUY/SELL signals with cooldown system
- Real-time dashboard showing current RSI values
- Clean, professional design that doesn't clutter your chart
═══════════════════════════════════════
DEFAULT SETTINGS
- Buy Signal Level: 32 (all 3 timeframes must cross below)
- Sell Signal Level: 64 (all 3 timeframes must cross above)
- Signal Cooldown: 24 bars (120 minutes on 5-min chart)
- Active Timeframes: 5min, 15min, 1H (4H and Daily can be enabled)
- RSI Length: 14 periods (standard)
═══════════════════════════════════════
CUSTOMIZABLE SETTINGS
- RSI Length (default: 14)
- Oversold Level (default: 32)
- Overbought Level (default: 64)
- Buy Signal Level (default: 32)
- Sell Signal Level (default: 64)
- Signal Cooldown in bars (default: 24)
- Five timeframe selections (fully customizable)
- Toggle visibility for each timeframe
- Toggle dashboard table on/off
- Toggle arrows on/off
═══════════════════════════════════════
HOW TO USE
1. Add the indicator to your chart
2. Customize timeframes in settings (optional)
3. Adjust RSI length and threshold levels (optional)
4. Monitor the dashboard for multi-timeframe alignment
INTERPRETATION:
When multiple timeframes show the same condition (all oversold or all overbought), it can indicate stronger momentum in that direction. For example:
- Multiple timeframes showing oversold may suggest a potential bounce
- Multiple timeframes showing overbought may suggest potential weakness
However, RSI alone should not be used as a standalone signal. Always combine with:
- Price action analysis
- Support/resistance levels
- Trend analysis
- Volume confirmation
- Other technical indicators
═══════════════════════════════════════
EDUCATIONAL BACKGROUND
RSI (Relative Strength Index) was developed by J. Welles Wilder Jr. and introduced in his 1978 book "New Concepts in Technical Trading Systems." It measures the magnitude of recent price changes to evaluate overbought or oversold conditions.
The RSI oscillates between 0 and 100, with readings:
- Below 30 traditionally considered oversold
- Above 70 traditionally considered overbought
- Around 50 indicating neutral momentum
Multi-timeframe analysis helps traders understand whether momentum conditions are aligned across different time horizons, potentially providing more robust signals than single-timeframe analysis alone.
═══════════════════════════════════════
NON-REPAINTING GUARANTEE
This indicator uses confirmed bar data to prevent repainting:
- All RSI values are calculated from previous bar's close
- Signals only fire when the bar closes (not mid-bar)
- What you see in backtest = what you get in live trading
- No signals will disappear after they appear
This is critical for reliable trading signals and accurate backtesting.
═══════════════════════════════════════
VISUAL DESIGN PHILOSOPHY
The indicator is designed with a "less is more" approach:
- Transparent RSI lines (60% opacity) keep price candles as the focal point
- Thin lines reduce visual clutter
- Arrows positioned near RSI levels (not floating randomly)
- Background flashes provide extra visual confirmation
- Dashboard table is compact and non-intrusive
The goal is to provide powerful multi-timeframe analysis without overwhelming your chart.
═══════════════════════════════════════
TECHNICAL NOTES
- Uses standard request.security() calls for multi-timeframe data
- Non-repainting implementation with proper lookahead handling
- Minimal performance impact
- Compatible with all instruments and timeframes
- Written in Pine Script v6
═══════════════════════════════════════
IMPORTANT DISCLAIMERS
- This is an educational tool for technical analysis
- Past RSI patterns do not guarantee future results
- No indicator is 100% accurate
- Always use proper risk management
- Consider multiple factors before making trading decisions
- This indicator does not provide buy/sell recommendations
- Consult with a qualified financial advisor before trading
═══════════════════════════════════════
LEARNING RESOURCES
For traders new to RSI, consider studying:
- J. Welles Wilder's original RSI methodology
- RSI divergence patterns
- RSI in trending vs ranging markets
- Multi-timeframe analysis techniques
═══════════════════════════════════════
Disclaimer
This tool was created using the CodaPro Pine Script architecture engine — designed to produce robust trading overlays, educational visuals, and automation-ready alerts. It is provided strictly for educational purposes and does not constitute financial advice. Always backtest and demo before applying to real capital.

[CodaPro] Multi-Timeframe RSI Dashboard
Multi-Timeframe RSI Dashboard
This indicator displays RSI (Relative Strength Index) values from five different timeframes simultaneously in a clean dashboard format, helping traders identify momentum alignment across multiple time periods.
═══════════════════════════════════════
FEATURES
✓ Displays RSI for 5 customizable timeframes
✓ Color-coded status indicators (Oversold/Neutral/Overbought)
✓ Clean table display positioned in chart corner
✓ Fully customizable RSI length and threshold levels
✓ Works on any instrument and timeframe
✓ Real-time updates as price moves
✓ Smart BUY/SELL signals with cooldown system
✓ Non-repainting - signals never disappear after appearing
═══════════════════════════════════════
HOW IT WORKS
The indicator calculates the standard RSI formula for each selected timeframe and displays the results in both a graph and organized table. Default timeframes are:
- 5-minute
- 15-minute
- 1-hour
- 4-hour (optional - hidden by default)
- Daily (optional - hidden by default)
Visual Display:
- Graph shows all RSI lines in subtle, transparent colors
- Lines don't overpower your price chart
- Dashboard table shows exact values and status
Color Coding:
- GREEN = RSI below 32 (traditionally considered oversold)
- YELLOW = RSI between 32-64 (neutral zone)
- RED = RSI above 64 (traditionally considered overbought)
All timeframes and thresholds are fully adjustable in the indicator settings.
═══════════════════════════════════════
SIGNAL LOGIC
BUY Signal:
- Triggers when ALL 3 primary timeframes drop below the buy level (default: 32)
- Arrow appears near the RSI lines for easy identification
- 120-minute cooldown prevents signal spam
SELL Signal:
- Triggers when ALL 3 primary timeframes rise above the sell level (default: 64)
- Arrow appears near the RSI lines for easy identification
- 120-minute cooldown prevents signal spam
The cooldown system ensures you only see HIGH-CONVICTION signals, not every minor fluctuation.
═══════════════════════════════════════
SCREENSHOT FEATURES VISIBLE
- Multi-timeframe RSI lines (5min, 15min, 1H) in subtle colors
- Smart BUY/SELL signals with cooldown system
- Real-time dashboard showing current RSI values
- Clean, professional design that doesn't clutter your chart
═══════════════════════════════════════
DEFAULT SETTINGS
- Buy Signal Level: 32 (all 3 timeframes must cross below)
- Sell Signal Level: 64 (all 3 timeframes must cross above)
- Signal Cooldown: 24 bars (120 minutes on 5-min chart)
- Active Timeframes: 5min, 15min, 1H (4H and Daily can be enabled)
- RSI Length: 14 periods (standard)
═══════════════════════════════════════
CUSTOMIZABLE SETTINGS
- RSI Length (default: 14)
- Oversold Level (default: 32)
- Overbought Level (default: 64)
- Buy Signal Level (default: 32)
- Sell Signal Level (default: 64)
- Signal Cooldown in bars (default: 24)
- Five timeframe selections (fully customizable)
- Toggle visibility for each timeframe
- Toggle dashboard table on/off
- Toggle arrows on/off
═══════════════════════════════════════
HOW TO USE
1. Add the indicator to your chart
2. Customize timeframes in settings (optional)
3. Adjust RSI length and threshold levels (optional)
4. Monitor the dashboard for multi-timeframe alignment
INTERPRETATION:
When multiple timeframes show the same condition (all oversold or all overbought), it can indicate stronger momentum in that direction. For example:
- Multiple timeframes showing oversold may suggest a potential bounce
- Multiple timeframes showing overbought may suggest potential weakness
However, RSI alone should not be used as a standalone signal. Always combine with:
- Price action analysis
- Support/resistance levels
- Trend analysis
- Volume confirmation
- Other technical indicators
═══════════════════════════════════════
EDUCATIONAL BACKGROUND
RSI (Relative Strength Index) was developed by J. Welles Wilder Jr. and introduced in his 1978 book "New Concepts in Technical Trading Systems." It measures the magnitude of recent price changes to evaluate overbought or oversold conditions.
The RSI oscillates between 0 and 100, with readings:
- Below 30 traditionally considered oversold
- Above 70 traditionally considered overbought
- Around 50 indicating neutral momentum
Multi-timeframe analysis helps traders understand whether momentum conditions are aligned across different time horizons, potentially providing more robust signals than single-timeframe analysis alone.
═══════════════════════════════════════
NON-REPAINTING GUARANTEE
This indicator uses confirmed bar data to prevent repainting:
- All RSI values are calculated from previous bar's close
- Signals only fire when the bar closes (not mid-bar)
- What you see in backtest = what you get in live trading
- No signals will disappear after they appear
This is critical for reliable trading signals and accurate backtesting.
═══════════════════════════════════════
VISUAL DESIGN PHILOSOPHY
The indicator is designed with a "less is more" approach:
- Transparent RSI lines (60% opacity) keep price candles as the focal point
- Thin lines reduce visual clutter
- Arrows positioned near RSI levels (not floating randomly)
- Background flashes provide extra visual confirmation
- Dashboard table is compact and non-intrusive
The goal is to provide powerful multi-timeframe analysis without overwhelming your chart.
═══════════════════════════════════════
TECHNICAL NOTES
- Uses standard request.security() calls for multi-timeframe data
- Non-repainting implementation with proper lookahead handling
- Minimal performance impact
- Compatible with all instruments and timeframes
- Written in Pine Script v6
═══════════════════════════════════════
IMPORTANT DISCLAIMERS
- This is an educational tool for technical analysis
- Past RSI patterns do not guarantee future results
- No indicator is 100% accurate
- Always use proper risk management
- Consider multiple factors before making trading decisions
- This indicator does not provide buy/sell recommendations
- Consult with a qualified financial advisor before trading
═══════════════════════════════════════
LEARNING RESOURCES
For traders new to RSI, consider studying:
- J. Welles Wilder's original RSI methodology
- RSI divergence patterns
- RSI in trending vs ranging markets
- Multi-timeframe analysis techniques
═══════════════════════════════════════
Questions or suggestions? Feel free to comment below.
Happy trading and proper risk management to all!

historicalEngine by N&M🇬🇧 English Introduction
historicalEngine is a Pine Script library designed for advanced state-based backtesting.
It does not test a single strategy, but evaluates full market configurations (trend, structure, momentum, multi-TF context).
Each trade is linked to a unique state hash, revealing which conditions truly perform over time.
The engine computes professional metrics: PnL, win rate, expectancy, Sharpe, drawdown, reliability.
It includes dynamic TP/SL, liquidation logic, early exits, realistic fees and slippage.
Built to be modular, extensible, and efficient, it plugs into any indicator.
Goal: turn historical data into a statistical trading edge.
V1 – a solid foundation for adaptive and data-driven trading systems.

TEMA vs WMA Retest & Crossover Alerts TEMA vs WMA — Retest & Crossover Alerts (with visible label)
TEMA vs WMA is a clean, momentum + trend-bias overlay built for traders who like simple, repeatable structure: trend confirmation + pullback (retest) entries, with optional trend-flip alerts when momentum shifts.
It’s especially useful for:
Trend traders looking to buy pullbacks / sell rallies
Scalpers & intraday traders who want quick bias + retest triggers
Swing traders who want a “stay on the right side” filter with clear flips
Anyone who prefers minimal indicators and alert-driven execution
What it does
This script plots two moving averages on your chart:
WMA (default 26): acts like a dynamic support/resistance “mean”
TEMA (default 26): a faster, smoother momentum line that reacts quicker than standard EMAs
The relationship between the two defines your bias:
Bullish bias: TEMA is above WMA
Bearish bias: TEMA is below WMA
To make the bias obvious at a glance:
Both lines change color depending on bias
A soft fill appears between the lines (bullish/bearish/neutral)
Optional bar coloring input is included (for future expansion), while the current version focuses on coloring the averages and fill.
Signals & alerts included
This indicator is built around two core ideas: retests and crossovers.
✅ Retest Alerts (entry-style trigger)
A “retest” happens when price touches the WMA (with an optional tolerance buffer).
BUY Retest: bullish bias (TEMA > WMA) and price retests WMA
SELL Retest: bearish bias (TEMA < WMA) and price retests WMA
These are great for “trend continuation” setups: wait for trend bias → enter on pullback to WMA.
⚡ Trend Flip Alerts (bias shift)
Bullish Flip: TEMA crosses above WMA
Bearish Flip: TEMA crosses below WMA
These are useful for spotting momentum reversals or confirming a new trend phase.
Visual label (on-chart confirmation)
When a retest occurs (and labels are enabled), the script prints a small “Retest” label at the WMA level to make it easy to spot retest events while backtesting.
Customization
WMA Length / TEMA Length: adjust for faster (shorter) or smoother (longer) behavior
Touch Buffer: adds price tolerance so “near touches” count as retests (helpful on high-volatility assets)
Show last-bar status label: toggle retest labels on/off
How traders typically use it
Trade with bias (bull = look long, bear = look short)
Wait for a WMA retest to avoid chasing
Use the trend flip alerts to avoid fighting reversals
Combine with your favorite confirmation (volume, structure, HTF trend, support/resistance)
Note: This is an alert + structure tool, not a full trading system. Always manage risk and consider market context (range vs trend, news volatility, session timing).

OrangePulse v3.0 Lite - Educational DCA StrategyThis open-source script is a simplified version of the OrangePulse algorithm, designed for educational purposes to demonstrate the power of Dollar Cost Averaging (DCA) and Mean Reversion.
📈 Strategy Logic:
The script uses a combination of Bollinger Bands and RSI (Relative Strength Index) to identify potential mean reversion opportunities.
- Entry: Triggered when price pushes below the lower Bollinger Band while RSI is in oversold territory.
- Management: Utilizes up to 3 Safety Orders (DCA) to improve the average entry price during pullbacks.
🎯 Features:
• Customizable Volume Scale and Step Scale for Safety Orders.
• Visual AVG price line and TP/SL levels.
• Time-window filter for backtesting.
• Real-time Status Table for position monitoring.
This script is shared in the spirit of open-source development on TradingView. It is intended to help traders understand how automated position building and risk management work in volatile markets.
Check my profile status/bio for more information on our project.
⚠️ Disclaimer: For educational purposes only. Past performance does not guarantee future results.

DAX 9-10 Breakout Strategy IndicatorOpening Hour Breakout (ORB) indicator for intraday trading.
WHAT IT DOES:
• Identifies the price range of a specific hour (default: 9:00-10:00)
• Detects breakout direction (Long/Short) when price breaks above HIGH or below LOW
• Automatically calculates Take Profit and Stop Loss zones based on range size
• Tracks trade outcome (Win/Lose) when TP or SL is hit
HOW TO USE:
1. Set the session hour according to your chart's timezone
2. Wait for the session range to form (yellow box)
3. Enter on breakout above HIGH (Long) or below LOW (Short)
4. TP and SL levels are automatically calculated
DEFAULT SETTINGS:
• TP Multiplier: 1.41x range (Risk:Reward ≈ 1:2.7)
• SL Multiplier: 0.52x range
FEATURES:
• Works on any timeframe (H1, M15, M30, etc.)
• Visual zones for session range, TP, and SL
• Price labels for all key levels
• Entry arrows and direction letters (L/S)
• Win/Lose markers (W/X) when trade closes
• Fully customizable - show/hide any element
• Info panel with live status and R:R ratio
• Alert conditions for Entry, TP hit, SL hit
BEST USED ON:
• DAX (Germany 40)
• Other indices: US30, US500, NAS100
• Forex majors during London/NY open
NOTE: This is an indicator for visual analysis. Use the Strategy version for backtesting.

My Swift-like Algo ALIMOJANIDSwift Algo Chart is a trend-following trading indicator designed to provide clear bias, precise entries, and visual risk management.
It combines EMA trend direction, pullback-based signals, market structure (HH/HL/LH/LL), and ATR-based Stop Loss & Take Profit levels to help traders make disciplined decisions.
🔑 Key Features
Trend Regime Detection
Identifies LONG, SHORT, or NO TRADE conditions using Fast & Slow EMAs.
Pullback Entry Signals
Signals appear only in the direction of the active trend, with optional RSI confirmation.
ATR-Based Risk Levels
Automatically plots SL, TP1, and TP2, including exact price values on the chart.
Preview Levels
Shows projected SL/TP levels when a trend is active, even before an entry.
Market Structure Visualization
Marks HH / HL / LH / LL, draws structure lines, and highlights BOS and CHOCH.
Clean & Non-Repainting Logic
Uses confirmed pivots and closed candles for stability.
Strategy-Compatible
Can be used for discretionary trading or full strategy backtesting.
🧠 Best Used For
Crypto, Forex, Indices
15m to 4H timeframes
Traders who want structure + trend + risk clarity in one tool

My Swift-like Algo J.ALIMOJANIDSwift Algo Chart — Trend, Structure & ATR Risk
Swift Algo Chart is a trend-following trading indicator designed to provide clear bias, precise entries, and visual risk management.
It combines EMA trend direction, pullback-based signals, market structure (HH/HL/LH/LL), and ATR-based Stop Loss & Take Profit levels to help traders make disciplined decisions.
🔑 Key Features
Trend Regime Detection
Identifies LONG, SHORT, or NO TRADE conditions using Fast & Slow EMAs.
Pullback Entry Signals
Signals appear only in the direction of the active trend, with optional RSI confirmation.
ATR-Based Risk Levels
Automatically plots SL, TP1, and TP2, including exact price values on the chart.
Preview Levels
Shows projected SL/TP levels when a trend is active, even before an entry.
Market Structure Visualization
Marks HH / HL / LH / LL, draws structure lines, and highlights BOS and CHOCH.
Clean & Non-Repainting Logic
Uses confirmed pivots and closed candles for stability.
Strategy-Compatible
Can be used for discretionary trading or full strategy backtesting.
🧠 Best Used For
Crypto, Forex, Indices
15m to 4H timeframes
Traders who want structure + trend + risk clarity in one tool
