Uptrick: SMA Pivot Marker### Uptrick: SMA Pivot Marker (SPM) — Extensive Guide
#### Introduction
The **Uptrick: SMA Pivot Marker (SPM)** is a sophisticated technical analysis tool crafted by Uptrick to help traders interpret market trends and identify key price levels where significant reversals might occur. By integrating the principles of the Simple Moving Average (SMA) with pivot point analysis, the SPM offers a comprehensive approach to understanding market dynamics. This extensive guide explores the purpose, functionality, and practical applications of the SPM, providing an in-depth analysis of its features, settings, and usage across various trading strategies.
#### Purpose of the SPM
The **SMA Pivot Marker (SPM)** aims to enhance trading strategies by offering a dual approach to market analysis:
1. **Trend Identification**:
- **Objective**: To discern the prevailing market direction and guide trading decisions based on the overall trend.
- **Method**: Utilizes the SMA to smooth out price fluctuations, providing a clearer picture of the trend. This helps traders align their trades with the market's direction, increasing the probability of successful trades.
2. **Pivot Point Detection**:
- **Objective**: To identify key levels where the price is likely to reverse, providing potential support and resistance zones.
- **Method**: Calculates and marks pivot highs and lows, which are significant price points where previous trends have reversed. These levels are used to predict future price movements and establish trading strategies.
3. **Trend Change Alerts**:
- **Objective**: To notify traders of potential shifts in market direction, enabling timely adjustments to trading positions.
- **Method**: Detects and highlights crossover and crossunder points of the smoothed line, indicating possible trend changes. This helps traders react promptly to changing market conditions.
#### Detailed Functionality
1. **Smoothing Line Calculation**:
- **Simple Moving Average (SMA)**:
- **Definition**: The SMA is a type of moving average that calculates the average of a security’s price over a specified number of periods. It smooths out price data to filter out short-term fluctuations and highlight the longer-term trend.
- **Calculation**: The SMA is computed by summing the closing prices of the chosen number of periods and then dividing by the number of periods. For example, a 20-period SMA adds the closing prices for the past 20 periods and divides by 20.
- **Purpose**: The SMA helps in identifying the direction of the trend. A rising SMA indicates an uptrend, while a falling SMA indicates a downtrend. This smoothing helps traders to avoid being misled by short-term price noise.
2. **Pivot Points Calculation**:
- **Pivot Highs and Lows**:
- **Definition**: Pivot points are significant price levels where a market trend is likely to reverse. A pivot high is the highest price over a certain period, surrounded by lower prices on both sides, while a pivot low is the lowest price surrounded by higher prices.
- **Calculation**: The SPM calculates pivot points based on a user-defined lookback period. For instance, if the lookback period is set to 3, the indicator will find the highest and lowest prices within the past 3 periods and mark these points.
- **Purpose**: Pivot points are used to identify potential support and resistance levels. Traders often use these levels to set entry and exit points, stop-loss orders, and to gauge market sentiment.
3. **Visualization**:
- **Smoothed Line Plot**:
- **Description**: The smoothed line, calculated using the SMA, is plotted on the chart to provide a visual representation of the trend. This line adjusts its color based on the trend direction, helping traders quickly assess the market condition.
- **Color Coding**: The smoothed line is colored green (upColor) when it is rising, indicating a bullish trend, and red (downColor) when it is falling, indicating a bearish trend. This color-coding helps traders visually differentiate between uptrends and downtrends.
- **Line Width**: The width of the line can be adjusted to improve visibility. A thicker line may be more noticeable, while a thinner line might provide a cleaner look on the chart.
- **Pivot Markers**:
- **Description**: Pivot highs and lows are marked on the chart with lines and labels. These markers help in visually identifying significant price levels.
- **Color and Labels**: Pivot highs are represented with green lines and labels ("H"), while pivot lows are marked with red lines and labels ("L"). This color scheme and labeling make it easy to distinguish between resistance (highs) and support (lows).
4. **Trend Change Detection**:
- **Trend Up**:
- **Detection**: The indicator identifies an upward trend change when the smoothed line crosses above its previous value. This crossover suggests a potential shift from a downtrend to an uptrend.
- **Usage**: Traders can interpret this signal as a potential buying opportunity or an indication to review and possibly adjust their trading positions to align with the new uptrend.
- **Trend Down**:
- **Detection**: A downward trend change is detected when the smoothed line crosses below its previous value. This crossunder indicates a potential shift from an uptrend to a downtrend.
- **Usage**: This signal can be used to consider selling opportunities or to reassess long positions in light of the emerging downtrend.
#### User Inputs
1. **Smoothing Period**:
- **Description**: This input determines the number of periods over which the SMA is calculated. It directly affects the smoothness of the line and the sensitivity of trend detection.
- **Range**: The smoothing period can be set to any integer value greater than or equal to 1. There is no specified upper limit, offering flexibility for various trading styles.
- **Default Value**: The default smoothing period is 20, which is a common choice for medium-term trend analysis.
- **Impact**: A longer smoothing period results in a smoother line, filtering out more noise and highlighting long-term trends. A shorter period makes the line more responsive to recent price changes, which can be useful for short-term trading strategies.
2. **Pivot Lookback**:
- **Description**: This input specifies the number of periods used to calculate the pivot highs and lows. It influences the sensitivity of pivot point detection and the relevance of the identified levels.
- **Range**: The pivot lookback period can be set to any integer value greater than or equal to 1, with no upper limit. Traders can adjust this parameter based on their trading timeframe and preferences.
- **Default Value**: The default lookback period is 3, which provides a balance between detecting significant pivots and avoiding excessive noise.
- **Impact**: A longer lookback period generates more stable pivot points, suitable for identifying long-term support and resistance levels. A shorter lookback period results in more frequent and recent pivot points, useful for intraday trading and quick responses to price changes.
#### Applications for Different Traders
1. **Trend Followers**:
- **Using the SMA**: Trend followers utilize the smoothed line to gauge the direction of the market. By aligning trades with the direction of the SMA, traders can capitalize on sustained trends and improve their chances of success.
- **Trend Change Alerts**: The trend change markers alert trend followers to potential shifts in market direction. These alerts help traders make timely decisions to enter or exit positions, ensuring they stay aligned with the prevailing trend.
2. **Reversal Traders**:
- **Pivot Points**: Reversal traders focus on pivot highs and lows to identify potential reversal points in the market. These points indicate where the market has previously reversed direction, providing potential entry and exit levels for trades.
- **Pivot Markers**: The visual markers for pivot highs and lows serve as clear signals for reversal traders. By monitoring these levels, traders can anticipate price reversals and plan their trades to exploit these opportunities.
3. **Swing Traders**:
- **Combining SMA and Pivot Points**: Swing traders can use the combination of the smoothed line and pivot points to identify medium-term trading opportunities. The smoothed line helps in understanding the broader trend, while pivot points provide specific levels for potential swings.
- **Trend Change Alerts**: Trend change markers help swing traders spot new swing opportunities as the market shifts direction. These markers provide potential entry points for swing trades and help traders adjust their strategies to capitalize on market movements.
4. **Scalpers**:
- **Short-Term Analysis**: Scalpers benefit from the short-term signals provided by the SPM. The smoothed line and pivot points offer insights into rapid price movements, while the trend change markers highlight quick trading opportunities.
- **Pivot Points**: For scalpers, pivot points are particularly useful in identifying key levels where price may reverse within a short time frame. By focusing on these levels, scalpers can plan trades with tight stop-loss orders and capitalize on quick price changes.
#### Implementation and Best Practices
1. **Setting Parameters**:
- **Smoothing Period**: Adjust the smoothing period according to your trading strategy and market conditions. For long-term analysis, use a longer period to filter out noise and highlight broader trends. For short-term trading, a shorter period provides more immediate insights into price movements.
- **Pivot Lookback**: Choose a lookback period that matches your trading timeframe. For intraday trading, a shorter lookback period offers quick identification of recent price levels. For swing trading or long-term strategies, a longer lookback period provides more stable pivot points.
2. **Combining with Other Indicators**:
- **Integration with Technical Tools**: The SPM can be used in conjunction with other technical indicators to enhance trading decisions. For instance, combining the
SPM with indicators like RSI (Relative Strength Index) or MACD (Moving Average Convergence Divergence) can provide additional confirmation for trend signals and pivot points.
- **Support and Resistance**: Integrate the SPM’s pivot points with other support and resistance levels to gain a comprehensive view of market conditions. This combined approach helps in identifying stronger levels of support and resistance, improving trade accuracy.
3. **Backtesting**:
- **Historical Performance**: Conduct backtesting with historical data to evaluate the effectiveness of the SPM. Analyze past performance to fine-tune the smoothing period and pivot lookback settings, ensuring they align with your trading style and market conditions.
- **Scenario Analysis**: Test the SPM under various market scenarios to understand its performance in different conditions. This analysis helps in assessing the reliability of the indicator and making necessary adjustments for diverse market environments.
4. **Customization**:
- **Visual Adjustments**: Customize the appearance of the smoothed line and pivot markers to enhance chart readability and match personal preferences. Clear visual representation of these elements improves the effectiveness of the indicator.
- **Alert Configuration**: Set up alerts for trend changes to receive timely notifications. Alerts help traders act quickly on potential market shifts without constant monitoring, allowing for more efficient trading decisions.
#### Conclusion
The **Uptrick: SMA Pivot Marker (SPM)** is a versatile and powerful technical analysis tool that combines the benefits of the Simple Moving Average with pivot point analysis. By providing insights into market trends, identifying key reversal points, and detecting trend changes, the SPM caters to a wide range of trading strategies, including trend following, reversal trading, swing trading, and scalping.
With its customizable inputs, visual markers, and trend change alerts, the SPM offers traders the flexibility to adapt the indicator to different market conditions and trading styles. Whether used independently or in conjunction with other technical tools, the SPM is designed to enhance trading decision-making and improve overall trading performance. By mastering the use of the SPM, traders can gain a valuable edge in navigating the complexities of financial markets and making more informed trading decisions.
"backtesting" için komut dosyalarını ara

Gann + Laplace Smoothed Hybrid Volume Spread Analysis Indicator
This Indicator stands apart by integrating the principles of the upgraded Discrete Fourier Transform (DFT), the Laplace Stieltjes Transform and volume spread analysis, enhanced with a layer of Fourier smoothing to distill market noise and highlight trend directions with unprecedented clarity.
The length of EMA and Strategy Entries are modified with the Gann swings.
This smoothing process allows traders to discern the true underlying patterns in volume and price action, stripped of the distractions of short-term fluctuations and noise.
The core functionality of the GannLSHVSA revolves around the innovative combination of volume change analysis, spread determination (calculated from the open and close price difference), and the strategic use of the EMA (default 10) to fine-tune the analysis of spread by incorporating volume changes.
Trend direction is validated through a moving average (MA) of the histogram, which acts analogously to the Volume MA found in traditional volume indicators. This MA serves as a pivotal reference point, enabling traders to confidently engage with the market when the histogram's movement concurs with the trend direction, particularly when it crosses the Trend MA line, signalling optimal entry points.
It returns 0 when MA of the histogram and EMA of the Price Spread are not align.
WHAT IS GannLSHVSA INDICATOR:
The GannLSHVSA plots a positive trend when a positive Volume smoothed Spread and EMA of Volume smoothed price is above 0, and a negative when negative Volume smoothed Spread and EMA of Volume smoothed price is below 0. When this conditions are not met it plots 0.
ORIGINALITY & USEFULNESS:
The GannLSHVSA Strategy is unique because it applies upgraded DFT, the Laplace Stieltjes Transform for data smoothing, effectively filtering out the minor fluctuations and leaving traders with a clear picture of the market's true movements. The DFT's ability to break down market signals into constituent frequencies offers a granular view of market dynamics, highlighting the amplitude and phase of each frequency component. This, combined with the strategic application of Ehler's Universal Oscillator principles via a histogram, furnishes traders with a nuanced understanding of market volatility and noise levels, thereby facilitating more informed trading decisions. The Gann swing strategy is developed by meomeo105, this Gann high and low algorithm forms the basis of the EMA modification.
DETAILED DESCRIPTION:
My detailed description of the indicator and use cases which I find very valuable.
What is the meaning of price spread?
In finance, a spread refers to the difference between two prices, rates, or yields. One of the most common types is the bid-ask spread, which refers to the gap between the bid (from buyers) and the ask (from sellers) prices of a security or asset.
We are going to use Open-Close spread.
What is Volume spread analysis?
Volume spread analysis (VSA) is a method of technical analysis that compares the volume per candle, range spread, and closing price to determine price direction.
What does this mean?
We need to have a positive Volume Price Spread and a positive Moving average of Volume price spread for a positive trend. OR via versa a negative Volume Price Spread and a negative Moving average of Volume price spread for a negative trend.
What if we have a positive Volume Price Spread and a negative Moving average of Volume Price Spread?
It results in a neutral, not trending price action.
Thus the Indicator/Strategy returns 0 and Closes all long and short positions.
I suggest using "Close all" input False when fine-tuning Inputs for 1 TimeFrame. When you export data to Excel/Numbers/GSheets I suggest using "Close all" input as True, except for the lowest TimeFrame. I suggest using 100% equity as your default quantity for fine-tune purposes. I have to mention that 100% equity may lead to unrealistic backtesting results. Be avare. When backtesting for trading purposes use Contracts or USDT.
6 days ago
Release Notes

Gann + Laplace Smoothed Hybrid Volume Spread AnalysisThe Gann + Laplace Smoothed Hybrid Volume Spread Analysis ( GannLSHVSA ) Strategy/Indicator is an trading tool designed to fuse volume analysis with trend detection, offering traders a view of market dynamics.
This Strategy/Indicator stands apart by integrating the principles of the upgraded Discrete Fourier Transform (DFT), the Laplace Stieltjes Transform and volume spread analysis, enhanced with a layer of Fourier smoothing to distill market noise and highlight trend directions with unprecedented clarity.
The length of EMA and Strategy Entries are modified with the Gann swings .
This smoothing process allows traders to discern the true underlying patterns in volume and price action, stripped of the distractions of short-term fluctuations and noise.
The core functionality of the GannLSHVSA revolves around the innovative combination of volume change analysis, spread determination (calculated from the open and close price difference), and the strategic use of the EMA (default 10) to fine-tune the analysis of spread by incorporating volume changes.
Trend direction is validated through a moving average (MA) of the histogram, which acts analogously to the Volume MA found in traditional volume indicators. This MA serves as a pivotal reference point, enabling traders to confidently engage with the market when the histogram's movement concurs with the trend direction, particularly when it crosses the Trend MA line, signalling optimal entry points.
It returns 0 when MA of the histogram and EMA of the Price Spread are not align.
WHAT IS GannLSHVSA INDICATOR:
The GannLSHVSA plots a positive trend when a positive Volume smoothed Spread and EMA of Volume smoothed price is above 0, and a negative when negative Volume smoothed Spread and EMA of Volume smoothed price is below 0. When this conditions are not met it plots 0.
HOW TO USE THE STRATEGY:
Here you fine-tune the inputs until you find a combination that works well on all Timeframes you will use when creating your Automated Trade Algorithmic Strategy. I suggest 4h, 12h, 1D, 2D, 3D, 4D, 5D, 6D, W and M.
ORIGINALITY & USEFULNESS:
The GannLSHVSA Strategy is unique because it applies upgraded DFT, the Laplace Stieltjes Transform for data smoothing, effectively filtering out the minor fluctuations and leaving traders with a clear picture of the market's true movements. The DFT's ability to break down market signals into constituent frequencies offers a granular view of market dynamics, highlighting the amplitude and phase of each frequency component. This, combined with the strategic application of Ehler's Universal Oscillator principles via a histogram, furnishes traders with a nuanced understanding of market volatility and noise levels, thereby facilitating more informed trading decisions. The Gann swing strategy is developed by meomeo105, this Gann high and low algorithm forms the basis of the EMA modification.
DETAILED DESCRIPTION:
My detailed description of the indicator and use cases which I find very valuable.
What is the meaning of price spread?
In finance, a spread refers to the difference between two prices, rates, or yields. One of the most common types is the bid-ask spread, which refers to the gap between the bid (from buyers) and the ask (from sellers) prices of a security or asset.
We are going to use Open-Close spread.
What is Volume spread analysis?
Volume spread analysis (VSA) is a method of technical analysis that compares the volume per candle, range spread, and closing price to determine price direction.
What does this mean?
We need to have a positive Volume Price Spread and a positive Moving average of Volume price spread for a positive trend. OR via versa a negative Volume Price Spread and a negative Moving average of Volume price spread for a negative trend.
What if we have a positive Volume Price Spread and a negative Moving average of Volume Price Spread?
It results in a neutral, not trending price action.
Thus the Indicator/Strategy returns 0 and Closes all long and short positions.
I suggest using "Close all" input False when fine-tuning Inputs for 1 TimeFrame. When you export data to Excel/Numbers/GSheets I suggest using "Close all" input as True, except for the lowest TimeFrame. I suggest using 100% equity as your default quantity for fine-tune purposes. I have to mention that 100% equity may lead to unrealistic backtesting results. Be avare. When backtesting for trading purposes use Contracts or USDT.

Strategy SEMA SDI WebhookPurpose of the Code:
The strategy utilizes Exponential Moving Averages (EMA) and Smoothed Directional Indicators (SDI) to generate buy and sell signals. It includes features like leverage, take profit, stop loss, and trailing stops. The strategy is intended for backtesting and automating trades based on the specified indicators and conditions.
Key Components and Functionalities:
1.Strategy Settings:
Overlay: The strategy will overlay on the price chart.
Slippage: Set to 1.
Commission Value: Set to 0.035.
Default Quantity Type: Percent of equity.
Default Quantity Value: 50% of equity.
Initial Capital: Set to 1000 units.
Calculation on Order Fills: Enabled.
Process Orders on Close: Enabled.
2.Date and Time Filters:
Inputs for enabling/disabling start and end dates.
Filters to execute strategy only within specified date range.
3.Leverage and Quantity:
Leverage: Adjustable leverage input (default 3).
USD Percentage: Adjustable percentage of equity to use for trades (default 50%).
Initial Capital: Calculated based on leverage and percentage of equity.
4.Take Profit, Stop Loss, and Trailing Stop:
Inputs for enabling/disabling take profit, stop loss, and trailing stop.
Adjustable parameters for take profit percentage (default 25%), stop loss percentage (default 4.8%), and trailing stop percentage (default 1.9%).
Calculations for take profit, stop loss, trailing price, and maximum profit tracking.
5.EMA Calculations:
Fast and slow EMAs.
Smoothed versions of the fast and slow EMAs.
6.SDI Calculations:
Directional movement calculation for positive and negative directional indicators.
Difference between the positive and negative directional indicators, smoothed.
7.Buy/Sell Conditions:
Long (Buy) Condition: Positive DI is greater than negative DI, and fast EMA is greater than slow EMA.
Short (Sell) Condition: Negative DI is greater than positive DI, and fast EMA is less than slow EMA.
8.Strategy Execution:
If buy conditions are met, close any short positions and enter a long position.
If sell conditions are met, close any long positions and enter a short position.
Exit conditions for long and short positions based on take profit, stop loss, and trailing stop levels.
Close all positions if outside the specified date range.
Usage:
This strategy is used to automate trading based on the specified conditions involving EMAs and SDI. It allows backtesting to evaluate performance based on historical data. The strategy includes risk management through take profit, stop loss, and trailing stops to protect gains and limit losses. Traders can customize the parameters to fit their specific trading preferences and risk tolerance. Differently, it can perform leverage analysis and use it as a template.
By using this strategy, traders can systematically execute trades based on technical indicators, helping to remove emotional bias and improve consistency in trading decisions.
Important Note:
This script is provided for educational and template purposes and does not constitute financial advice. Traders and investors should conduct their research and analysis before making any trading decisions.

Fine-Tune Inputs: Fourier Smoothed Hybrid Volume Spread AnalysisUse this Strategy to Fine-tune inputs for the HSHVSA Indicator.
Strategy allows you to fine-tune the indicator for 1 TimeFrame at a time; cross Timeframe Input fine-tuning is done manually after exporting the chart data.
I suggest using " Close all " input False when fine-tuning Inputs for 1 TimeFrame. When you export data to Excel/Numbers/GSheets I suggest using " Close all " input as True , except for the lowest TimeFrame.
MEANINGFUL DESCRIPTION:
The Fourier Smoothed Hybrid Volume Spread Analysis (FSHVSA) Strategy/Indicator is an innovative trading tool designed to fuse volume analysis with trend detection capabilities, offering traders a comprehensive view of market dynamics.
This Strategy/Indicator stands apart by integrating the principles of the Discrete Fourier Transform (DFT) and volume spread analysis, enhanced with a layer of Fourier smoothing to distill market noise and highlight trend directions with unprecedented clarity.
This smoothing process allows traders to discern the true underlying patterns in volume and price action, stripped of the distractions of short-term fluctuations and noise.
The core functionality of the FSHVSA revolves around the innovative combination of volume change analysis, spread determination (calculated from the open and close price difference), and the strategic use of the EMA (default 10) to fine-tune the analysis of spread by incorporating volume changes.
Trend direction is validated through a moving average (MA) of the histogram, which acts analogously to the Volume MA found in traditional volume indicators. This MA serves as a pivotal reference point, enabling traders to confidently engage with the market when the histogram's movement concurs with the trend direction, particularly when it crosses the Trend MA line, signalling optimal entry points.
It returns 0 when MA of the histogram and EMA of the Price Spread are not align.
WHAT IS FSHVSA INDICATOR:
The FSHVSA plots a positive trend when a positive Volume smoothed Spread and EMA of Volume smoothed price is above 0, and a negative when negative Volume smoothed Spread and EMA of Volume smoothed price is below 0. When this conditions are not met it plots 0.
HOW TO USE THE STRATEGY:
Here you fine-tune the inputs until you find a combination that works well on all Timeframes you will use when creating your Automated Trade Algorithmic Strategy. I suggest 4h, 12h, 1D, 2D, 3D, 4D, 5D, 6D, W and M.
ORIGINALITY & USEFULNESS:
The FSHVSA Strategy is unique because it applies DFT for data smoothing, effectively filtering out the minor fluctuations and leaving traders with a clear picture of the market's true movements. The DFT's ability to break down market signals into constituent frequencies offers a granular view of market dynamics, highlighting the amplitude and phase of each frequency component. This, combined with the strategic application of Ehler's Universal Oscillator principles via a histogram, furnishes traders with a nuanced understanding of market volatility and noise levels, thereby facilitating more informed trading decisions.
DETAILED DESCRIPTION:
My detailed description of the indicator and use cases which I find very valuable.
What is the meaning of price spread?
In finance, a spread refers to the difference between two prices, rates, or yields. One of the most common types is the bid-ask spread, which refers to the gap between the bid (from buyers) and the ask (from sellers) prices of a security or asset.
We are going to use Open-Close spread.
What is Volume spread analysis?
Volume spread analysis (VSA) is a method of technical analysis that compares the volume per candle, range spread, and closing price to determine price direction.
What does this mean?
We need to have a positive Volume Price Spread and a positive Moving average of Volume price spread for a positive trend. OR via versa a negative Volume Price Spread and a negative Moving average of Volume price spread for a negative trend.
What if we have a positive Volume Price Spread and a negative Moving average of Volume Price Spread?
It results in a neutral, not trending price action.
Thus the Indicator/Strategy returns 0 and Closes all long and short positions.
In the next Image you can see that trend is negative on 4h, we just move Negative on 12h and Positive on 1D. That means trend/Strategy flipped negative .
I am sorry, the chart is a bit messy. The idea is to use the indicator/strategy over more than 1 Timeframe.
Use this Strategy to fine-tune inputs for the HSHVSA Indicator.
(Strategy allows you to fine-tune the indicator for 1 TimeFrame at a time; cross Timeframe Input fine-tuning is done manually after exporting the chart data)
I suggest using " Close all " input False when fine-tuning Inputs for 1 TimeFrame. When you export data to Excel/Numbers/GSheets I suggest using " Close all " input as True , except for the lowest TimeFrame. I suggest using 100% equity as your default quantity for fine-tune purposes. I have to mention that 100% equity may lead to unrealistic backtesting results. Be avare. When backtesting for trading purposes use Contracts or USDT.

NASDAQ 100 Peak Hours StrategyNASDAQ 100 Peak Hours Trading Strategy
Description
Our NASDAQ 100 Peak Hours Trading Strategy leverages a carefully designed algorithm to trade within specific hours of high market activity, particularly focusing on the first two hours of the trading session from 09:30 AM to 11:30 AM GMT-5. This period is identified for its increased volatility and liquidity, offering numerous trading opportunities.
The strategy incorporates a blend of technical indicators to identify entry and exit points for both long and short positions. These indicators include:
Exponential Moving Averages (EMAs) : A short-term 9-period EMA and a longer-term 21-period EMA to determine the market trend and momentum.
Relative Strength Index (RSI) : A 14-period RSI to gauge the market's momentum.
Average True Range (ATR) : A 14-period ATR to assess market volatility and to set dynamic stop losses and trailing stops.
Volume Weighted Average Price (VWAP) : To identify the market's average price weighted by volume, serving as a benchmark for the trading day.
Our strategy uniquely applies a volatility filter using the ATR, ensuring trades are only executed in conditions that favor our setup. Additionally, we consider the direction of the EMAs to confirm the market's trend before entering trades.
Originality and Usefulness
This strategy stands out by combining these indicators within the NASDAQ 100's peak hours, exploiting the specific market conditions that prevail during these times. The inclusion of a volatility filter and dynamic stop-loss mechanisms based on the ATR provides a robust method for managing risk.
By focusing on the early trading hours, the strategy aims to capture the initial market movements driven by overnight news and the opening rush, often characterized by higher volatility. This approach is particularly useful for traders looking to maximize gains from short-term fluctuations while limiting exposure to longer-term market uncertainty.
Strategy Results
To ensure the strategy's effectiveness and reliability, it has undergone rigorous backtesting over a significant dataset to produce a sample size of more than 100 trades. This testing phase helps in identifying the strategy's potential in various market conditions, its consistency, and its risk-to-reward ratio.
Our backtesting adheres to realistic trading conditions, accounting for slippage and commission to reflect actual trading scenarios accurately. The strategy is designed with a conservative approach to risk management, advising not to risk more than 5-10% of equity on a single trade. The default settings in the script align with these principles, ensuring that users can replicate our tested conditions.
Using the Strategy
The strategy is designed for simplicity and ease of use:
Trade Hours : Focuses on 09:30 AM to 11:30 AM GMT-5, during the NASDAQ 100's peak activity hours.
Entry Conditions : Trades are initiated based on the alignment of EMAs, RSI, VWAP, and the ATR's volatility filter within the designated time frame.
Exit Conditions : Includes dynamic trailing stops based on ATR, a predefined time exit strategy, and a trend reversal exit condition for risk management.
This script is a powerful tool for traders looking to leverage the NASDAQ 100's peak hours, providing a structured approach to navigating the early market hours with a robust set of criteria for making informed trading decisions.

Inside Candle StrategyIntroduction
The Inside Candle Breakout Strategy leverages the concept of inside candles as a primary signal for potential breakouts. Unlike common trend-following or scalping strategies, this method focuses on the volatility squeeze indicated by inside candles and aims to capture the momentum that follows these periods of consolidation. The strategy's originality lies in its specific integration of timeframes for signal detection and its application across diverse market conditions without relying on conventional trend indicators.
Strategy Description and Mechanics
Inside Candle Identification: At the heart of this strategy is the detection of inside candles, defined as candles fully contained within the range of the preceding candle. This pattern signifies a temporary balance between buyers and sellers, often preceding significant price movements. The strategy scans for these candles within a user-specified timeframe in the input section of the settings of the strategy, allowing for tailored signal generation based on individual trading preferences.
Entry Points and Market Entries: Upon identifying an inside candle and only once this candle closes, the strategy prepares to enter a trade in the direction of the breakout. Trades are executed in the timeframe selected on the chart, ensuring that entry points are aligned with real-time market movements. This process highlights the strategy's adaptability, making it suitable for various trading styles, from day trading to swing trading.
Overlay Indicator for Enhanced Market Analysis: Accompanying the breakout signals is an overlay indicator comprising two moving averages and a volatility cloud. This feature serves as a secondary tool for market analysis, offering insights into the prevailing market trend and volatility levels. While it doesn't influence the entry or exit signals directly, it provides traders with additional context for refining their decisions, enhancing the strategy's utility. This assistance tool is composed by one moving average and a second line which is calculated adding or subtracting the historical volatility of the asset on the moving average, depending on his momentum.
Strategy Results and Commitment to Realism
Backtesting Protocol: In our commitment to transparency and realism, backtesting results are derived from a dataset that ensures a sufficient number of trades (over 100) to validate the strategy's effectiveness. This approach underscores our dedication to providing traders with reliable and actionable insights.
Risk Management and Trade Sizing: Recognizing the importance of sustainable trading practices, the strategy incorporates strict risk management guidelines. Trades are sized to ensure that only a small percentage of equity is risked on a single trade, adhering to widely accepted risk tolerance levels. The initial account size for this script is set to 10000$.
Strategy Defaults and Justification: The default properties of the strategy, including the risk-reward ratio, average length for moving averages, and other parameters, are carefully chosen based on extensive testing and analysis. These settings represent a balanced approach, aiming to optimize the strategy's performance across a variety of market conditions.
Strategy Components:
- Inside Candles: An inside candle occurs when a candle's high and low are completely contained within the high and low of the previous candle. This pattern indicates a period of consolidation or indecision in the market, often preceding a significant price movement. The strategy detects inside candles based on the user-selected timeframe, allowing traders to capture potential breakouts.
Indicator Overlays:
- Moving Average: A simple moving average (SMA) is calculated over a user-defined length (`Average Length`), providing a dynamic baseline to gauge the market's direction. The strategy offers an option (`Show Moving Average`) to display or hide this moving average on the chart, giving traders control over the visual complexity.
- Volatility Measurement: Alongside the moving average, the strategy assesses market volatility using the standard deviation of the closing prices over the same period defined by the `Average Length`. The moving average is adjusted upwards or downwards by this volatility measure, creating a dynamic channel that reflects the current market conditions.
- Color Gradients for Volatility: The strategy uses a color gradient to fill the area between the moving average and its volatility-adjusted counterpart. This gradient visually represents the volatility level, transitioning from gray (low volatility) to a lighter shade (higher volatility), aiding in the assessment of market sentiment and volatility.
Trading Entries:
- Long Entry: A long position is triggered when the closing price exceeds the high of an inside candle, indicating potential bullish momentum. The strategy places a stop-loss at the low of the inside candle and sets a take-profit level based on the predefined risk-reward ratio (`RR Ratio`).
- Short Entry: Conversely, a short position is initiated when the closing price falls below the low of an inside candle, suggesting bearish pressure. A stop-loss is set at the high of the inside candle, with the take-profit level adjusted according to the risk-reward ratio.
Customization Settings:
- Timeframe: Traders can select the desired timeframe for inside candle detection, tailoring the strategy to fit various trading styles and time horizons.
- RR Ratio: The risk-reward ratio is adjustable, allowing traders to manage the potential risk and return of each trade according to their risk tolerance.
- Average Length: This setting determines the period over which the moving average and volatility are calculated, affecting the sensitivity of the strategy to price movements.
- Visual Settings: Users can customize the appearance of the strategy on their charts, including the colors of the moving average and volatility lines, as well as the line width, enhancing chart readability and personal preference adherence.
Disclaimer
Trading involves significant risk, and it is crucial for traders to conduct their own due diligence before engaging with any strategy. The Inside Candle Breakout Strategy is presented for informational purposes only and does not constitute financial advice.

Machine Learning: Multiple Logistic Regression
Multiple Logistic Regression Indicator
The Logistic Regression Indicator for TradingView is a versatile tool that employs multiple logistic regression based on various technical indicators to generate potential buy and sell signals. By utilizing key indicators such as RSI, CCI, DMI, Aroon, EMA, and SuperTrend, the indicator aims to provide a systematic approach to decision-making in financial markets.
How It Works:
Technical Indicators:
The script uses multiple technical indicators such as RSI, CCI, DMI, Aroon, EMA, and SuperTrend as input variables for the logistic regression model.
These indicators are normalized to create categorical variables, providing a consistent scale for the model.
Logistic Regression:
The logistic regression function is applied to the normalized input variables (x1 to x6) with user-defined coefficients (b0 to b6).
The logistic regression model predicts the probability of a binary outcome, with values closer to 1 indicating a bullish signal and values closer to 0 indicating a bearish signal.
Loss Function (Cross-Entropy Loss):
The cross-entropy loss function is calculated to quantify the difference between the predicted probability and the actual outcome.
The goal is to minimize this loss, which essentially measures the model's accuracy.
// Error Function (cross-entropy loss)
loss(y, p) =>
-y * math.log(p) - (1 - y) * math.log(1 - p)
// y - depended variable
// p - multiple logistic regression
Gradient Descent:
Gradient descent is an optimization algorithm used to minimize the loss function by adjusting the weights of the logistic regression model.
The script iteratively updates the weights (b1 to b6) based on the negative gradient of the loss function with respect to each weight.
// Adjusting model weights using gradient descent
b1 -= lr * (p + loss) * x1
b2 -= lr * (p + loss) * x2
b3 -= lr * (p + loss) * x3
b4 -= lr * (p + loss) * x4
b5 -= lr * (p + loss) * x5
b6 -= lr * (p + loss) * x6
// lr - learning rate or step of learning
// p - multiple logistic regression
// x_n - variables
Learning Rate:
The learning rate (lr) determines the step size in the weight adjustment process. It prevents the algorithm from overshooting the minimum of the loss function.
Users can set the learning rate to control the speed and stability of the optimization process.
Visualization:
The script visualizes the output of the logistic regression model by coloring the SMA.
Arrows are plotted at crossover and crossunder points, indicating potential buy and sell signals.
Lables are showing logistic regression values from 1 to 0 above and below bars
Table Display:
A table is displayed on the chart, providing real-time information about the input variables, their values, and the learned coefficients.
This allows traders to monitor the model's interpretation of the technical indicators and observe how the coefficients change over time.
How to Use:
Parameter Adjustment:
Users can adjust the length of technical indicators (rsi_length, cci_length, etc.) and the Z score length based on their preference and market characteristics.
Set the initial values for the regression coefficients (b0 to b6) and the learning rate (lr) according to your trading strategy.
Signal Interpretation:
Buy signals are indicated by an upward arrow (▲), and sell signals are indicated by a downward arrow (▼).
The color-coded SMA provides a visual representation of the logistic regression output by color.
Table Information:
Monitor the table for real-time information on the input variables, their values, and the learned coefficients.
Keep an eye on the learning rate to ensure a balance between model adjustment speed and stability.
Backtesting and Validation:
Before using the script in live trading, conduct thorough backtesting to evaluate its performance under different market conditions.
Validate the model against historical data to ensure its reliability.

Trend Deviation strategy - BTC [IkkeOmar]Intro:
This is an example if anyone needs a push to get started with making strategies in pine script. This is an example on BTC, obviously it isn't a good strategy, and I wouldn't share my own good strategies because of alpha decay.
This strategy integrates several technical indicators to determine market trends and potential trade setups. These indicators include:
Directional Movement Index (DMI)
Bollinger Bands (BB)
Schaff Trend Cycle (STC)
Moving Average Convergence Divergence (MACD)
Momentum Indicator
Aroon Indicator
Supertrend Indicator
Relative Strength Index (RSI)
Exponential Moving Average (EMA)
Volume Weighted Average Price (VWAP)
It's crucial for you guys to understand the strengths and weaknesses of each indicator and identify synergies between them to improve the strategy's effectiveness.
Indicator Settings:
DMI (Directional Movement Index):
Length: This parameter determines the number of bars used in calculating the DMI. A higher length may provide smoother results but might lag behind the actual price action.
Bollinger Bands:
Length: This parameter specifies the number of bars used to calculate the moving average for the Bollinger Bands. A longer length results in a smoother average but might lag behind the price action.
Multiplier: The multiplier determines the width of the Bollinger Bands. It scales the standard deviation of the price data. A higher multiplier leads to wider bands, indicating increased volatility, while a lower multiplier results in narrower bands, suggesting decreased volatility.
Schaff Trend Cycle (STC):
Length: This parameter defines the length of the STC calculation. A longer length may result in smoother but slower-moving signals.
Fast Length: Specifies the length of the fast moving average component in the STC calculation.
Slow Length: Specifies the length of the slow moving average component in the STC calculation.
MACD (Moving Average Convergence Divergence):
Fast Length: Determines the number of bars used to calculate the fast EMA (Exponential Moving Average) in the MACD.
Slow Length: Specifies the number of bars used to calculate the slow EMA in the MACD.
Signal Length: Defines the number of bars used to calculate the signal line, which is typically an EMA of the MACD line.
Momentum Indicator:
Length: This parameter sets the number of bars over which momentum is calculated. A longer length may provide smoother momentum readings but might lag behind significant price changes.
Aroon Indicator:
Length: Specifies the number of bars over which the Aroon indicator calculates its values. A longer length may result in smoother Aroon readings but might lag behind significant market movements.
Supertrend Indicator:
Trendline Length: Determines the length of the period used in the Supertrend calculation. A longer length results in a smoother trendline but might lag behind recent price changes.
Trendline Factor: Specifies the multiplier used in calculating the trendline. It affects the sensitivity of the indicator to price changes.
RSI (Relative Strength Index):
Length: This parameter sets the number of bars over which RSI calculates its values. A longer length may result in smoother RSI readings but might lag behind significant price changes.
EMA (Exponential Moving Average):
Fast EMA: Specifies the number of bars used to calculate the fast EMA. A shorter period results in a more responsive EMA to recent price changes.
Slow EMA: Determines the number of bars used to calculate the slow EMA. A longer period results in a smoother EMA but might lag behind recent price changes.
VWAP (Volume Weighted Average Price):
Default settings are typically used for VWAP calculations, which consider the volume traded at each price level over a specific period. This indicator provides insights into the average price weighted by trading volume.
backtest range and rules:
You can specify the start date for backtesting purposes.
You can can select the desired trade direction: Long, Short, or Both.
Entry and Exit Conditions:
LONG:
DMI Cross Up: The Directional Movement Index (DMI) indicates a bullish trend when the positive directional movement (+DI) crosses above the negative directional movement (-DI).
Bollinger Bands (BB): The price is below the upper Bollinger Band, indicating a potential reversal from the upper band.
Momentum Indicator: Momentum is positive, suggesting increasing buying pressure.
MACD (Moving Average Convergence Divergence): The MACD line is above the signal line, indicating bullish momentum.
Supertrend Indicator: The Supertrend indicator signals an uptrend.
Schaff Trend Cycle (STC): The STC indicates a bullish trend.
Aroon Indicator: The Aroon indicator signals a bullish trend or crossover.
When all these conditions are met simultaneously, the strategy considers it a favorable opportunity to enter a long trade.
SHORT:
DMI Cross Down: The Directional Movement Index (DMI) indicates a bearish trend when the negative directional movement (-DI) crosses above the positive directional movement (+DI).
Bollinger Bands (BB): The price is above the lower Bollinger Band, suggesting a potential reversal from the lower band.
Momentum Indicator: Momentum is negative, indicating increasing selling pressure.
MACD (Moving Average Convergence Divergence): The MACD line is below the signal line, signaling bearish momentum.
Supertrend Indicator: The Supertrend indicator signals a downtrend.
Schaff Trend Cycle (STC): The STC indicates a bearish trend.
Aroon Indicator: The Aroon indicator signals a bearish trend or crossover.
When all these conditions align, the strategy considers it an opportune moment to enter a short trade.
Disclaimer:
THIS ISN'T AN OPTIMAL STRATEGY AT ALL! It was just an old project from when I started learning pine script!
The backtest doesn't promise the same results in the future, always do both in-sample and out-of-sample testing when backtesting a strategy. And make sure you forward test it as well before implementing it!
Furthermore this strategy uses both trend and mean-reversion systems, that is usually a no-go if you want to build robust trend systems .
Don't hesitate to comment if you have any questions or if you have some good notes for a beginner.

Trend Signals with TP & SL [UAlgo]The "Trend Signals with TP & SL " indicator is a versatile tool designed to assist traders in identifying potential trend continuation opportunities within financial markets Utilizing a combination of technical indicators and user-defined parameters, this indicator aims to provide clear and actionable signals to aid traders in making informed trading decisions.
🔶 Features:
Trend Continuation Signals : The indicator generates signals to identify potential trend continuation points based on the input parameters such as sensitivity, ATR length, and cloud moving average length.
Take-Profit and Stop-Loss Levels: It calculates and plots three levels of take-profit (1R, 2R, 3R) and stop-loss levels based on the entry price of the trade.
Short Position Example:
Long Position Example:
Visualization: The script visualizes the trend signals, entry points, take-profit levels, and stop-loss levels on the price chart, making it easier for traders to interpret the signals.
Alert System: The indicator includes an alert system that notifies the user when there is a change in trend direction or when a buy/sell signal is generated. The alerts provide essential information such as entry price, take-profit levels, and stop-loss levels.
🔶 Calculations :
Trend Calculation: Trend signals are determined based on the comparison between the current closing price and the upper and lower bounds calculated using the Average True Range (ATR) multiplied by a sensitivity factor. A trend is considered bullish if the closing price is above the upper bound and bearish if it's below the lower bound.
Entry, Stop Loss, and Take Profit Calculation: Entry points for long and short positions are identified when there's a change in trend direction.
Stop-loss levels are calculated as a percentage of the entry price, where users can define the percentage based on their risk tolerance.
Take-profit levels are calculated as multiples of the stop-loss level (1R, 2R, 3R).
Cloud Moving Averages: Simple moving averages (SMAs) are calculated for high and low prices over a specified period to create a "cloud" visualization on the chart.
MACD Clouds: Moving Average Convergence Divergence (MACD) indicator is used to determine the market's momentum and trend direction. Positive and negative clouds are plotted based on the MACD line and its signal line, indicating potential bullish or bearish trends.
Signal Generation: Buy and sell signals are generated based on specific conditions such as RSI, CMO (Chande Momentum Oscillator), and pivot points.
Signals are triggered when certain criteria are met, indicating potential opportunities for entering or exiting trades.
🔶 Disclaimer:
Use at Your Own Risk: Trading involves significant risk, and this script is provided for educational and informational purposes only. It does not guarantee profitable trades, and users should exercise caution and perform their own analysis before making trading decisions.
Parameter Sensitivity: The effectiveness of the indicator may vary depending on the chosen parameters, market conditions, and timeframe. Users are encouraged to backtest the script thoroughly and adjust the parameters according to their trading preferences.
Not Financial Advice: The information provided by this script should not be considered as financial advice. Users are solely responsible for their trading decisions and should consult with a qualified financial advisor if needed.
Backtesting and Validation: Before implementing this indicator in live trading, users are strongly encouraged to conduct rigorous backtesting and validation to assess its performance under various market conditions. Past performance is not indicative of future results, and users should carefully evaluate the effectiveness of the indicator based on their individual trading preferences and risk tolerance.

QQE MOD + SSL Hybrid + Waddah Attar Explosion IndicatorINDICATOR PURPOSE
This indicator is designed to complement my original QQE MOD + SSL Hybrid + Waddah Attar Explosion strategy.
Multiple users have requested that I convert the strategy to an indicator because alertconditions do not work on strategies and people want to specific set alerts for BUY, SELL, CLOSE BUY and CLOSE SELL. This can only be achieved using alertcondition().
This indicator functions in the exact same way as the strategy, but it doesn't have any backtesting functionality. I recomment that you use the original QQE MOD + SSL Hybrid + Waddah Attar Explosion strategy for parameter tuning and backtesting, then if you need more control on alerts you can use this indicator for that purpose.
Only other difference is that I have added grey exit labels on the chart since it's not obvious where the exits would happen like it was in the strategy version.
CREDITS
QQE MOD byMihkel00
SSL Hybrid by Mihkel00
Waddah Attar Explosion by shayankm

Monthly Performance Table by Dr. MauryaWhat is this ?
This Strategy script is not aim to produce strategy results but It aim to produce monthly PnL performance Calendar table which is useful for TradingView community to generate a monthly performance table for Own strategy.
So make sure to read the disclaimer below.
Why it is required to publish?:
I am not satisfied with the monthly performance available on TV community script. Sometimes it is very lengthy in code and sometimes it showing the wrong PNL for current month.
So I have decided to develop new Monthly performance or return in value as well as in percentage with highly flexible to adjust row automatically.
Features :
Accuracy increased for current month PnL.
There are 14 columns and automatically adjusted rows according to available trade years/month.
First Column reflect the YEAR, from second column to 13 column reflect the month and 14 column reflect the yearly PnL.
In tabulated data reflects the monthly PnL (value and (%)) in month column and Yearly PnL (value and (%)) in Yearly column.
Various color input also added to change the table look like background color, text color, heading text color, border color.
In tabulated data, background color turn green for profit and red for loss.
Copy from line 54 to last line as it is in your strategy script.
Credit: This code is modified and top up of the open-source code originally written by QuantNomad. Thanks for their contribution towards to give base and lead to other developers. I have changed the way of determining past PnL to array form and keep separated current month and year PnL from array. Which avoid the false pnl in current month.
Strategy description:
As in first line I said This strategy is aim to provide monthly performance table not focused on the strategy. But it is necessary to explain strategy which I have used here. Strategy is simply based on ADX available on TV community script. Long entry is based on when the difference between DIPlus and ADX is reached on certain value (Set value in Long difference in Input Tab) while Short entry is based on when the difference between DIMinus and ADX is reached on certain value (Set value in Short difference in Input Tab).
Default Strategy Properties used on chart(Important)
This script backtest is done on 1 hour timeframe of NSE:Reliance Inds Future cahrt, using the following backtesting properties:
Balance (default): 500 000 (default base currency)
Order Size: 1 contract
Comission: 20 INR per Order
Slippage: 5 tick
Default setting in Input tab
Len (ADX length) : 14
Th (ADX Threshhold): 20
Long Difference (DIPlus - ADX) = 5
Short Difference (DIMinus - ADX) = 5
We use these properties to ensure a realistic preview of the backtesting system, do note that default properties can be different for various reasons described below:
Order Size: 1 contract by default, this is to allow the strategy to run properly on most instruments such as futures.
Comission: Comission can vary depending on the market and instrument, there is no default value that might return realistic results.
We strongly recommend all users to ensure they adjust the Properties within the script settings to be in line with their accounts & trading platforms of choice to ensure results from the strategies built are realistic.
Disclaimer:
This script not provide indicative of any future results.
This script don’t provide any financial advice.
This strategy is only for the readymade snippet code for monthly PnL performance calender table for any own strategy.

MACD_RSI_trend_followingINFO:
This indicator can be used to build-up a strategy for trading of assets which are currently in trending phase.
My preference is to use it on slowly moving assets like GOLD and on higher timeframes, but practice may show that we find more usefull cases.
This script uses two indicators - MACD and RSI, as the timeframe that those are extracted for is configurable (defaults with the Chart TF, but can be any other selected by the user).
The strategy has the following simple idea - buy if any if the conditions below is true:
The selected TF MACD line crosses above the signal line and the TF RSI is above the user selected trigger value
The selected TF MACD line is above the signal line and the TF RSI crosses above the user selected trigger value
Once we're in position we wait for the selected TF MACD line to cross below the signal line, and then we set a SL at the low of that bar
DETAILS and USAGE:
In the current implementation I find two possible use cases for the indicator:
as a stand-alone indicator on the chart which can also fire alerts that can help to determine if we want to manually enter/exit trades based on them
can be used to connect to the Signal input of the TTS (TempalteTradingStrategy) by jason5480 in order to backtest it, thus effectively turning it into a strategy (instructions below in TTS CONNECTIVITY section)
In the example below we see a position opened at the bar after the buy indicator from the script has been triggered, and then later after the SL indicator from the script has been triggered a SL has been set on the lower wick of the closing candle, and the position eventually got closed once the price hit that level. Note that most of the drawing on the example snapshot below are from the TTS indicator following the buy/sell/SL conditions themseves:
Trading period can be selected from the indicator itself to limit to more interesting periods.
Arrow indications are drawn on the chart to indicate the trading conditions met in the script - green arrow for a buy signal indication and orange for LTF crossunder to indicate setting of SL.
SETTINGS:
Leaving all of the settings as in vanilla use case, as both the MACD and RSI indicator's settings follow the default ones for the stand-alone indicators themselves.
The start-end date is a time filter that can be extermely usefull when backtesting different time periods.
Pesonal preference is using the script on a D/W timeframe, while the indicator is configured to use Monthly chart.
The default value of the RSI filter is left to 50, which can be changed. I.e. if the RSI is above 50 we have a regime filter based on the MACD criteria.
EXTERNAL LIBRARIES:
The script uses a couple of external libraries:
HeWhoMustNotBeNamed/enhanced_ta/14 - collection of TA indicators
jason5480/tts_convention/3 - more details about the Template Trading Strategy below
I would like to highly appreciate and credit the work of both HeWhoMustNotBeNamed and jason5480 for providing them to the community.
TTS SETTINGS (NEEDED IF USED TO BACKTEST WITH TTS):
The TempalteTradingStrategy is a strategy script developed in Pine by jason5480, which I recommend for quick turn-around of testing different ideas on a proven and tested framework
I cannot give enough credit to the developer for the efforts put in building of the infrastructure, so I advice everyone that wants to use it first to get familiar with the concept and by checking
by checking jason5480's profile www.tradingview.com
The TTS itself is extremely functional and have a lot of properties, so its functionality is beyond the scope of the current script -
Again, I strongly recommend to be thoroughly epxlored by everyone that plans on using it.
In the nutshell it is a script that can be feed with buy/sell signals from an external indicator script and based on many configuration options it can determine how to execute the trades.
The TTS has many settings that can be applied, so below I will cover only the ones that differ from the default ones, at least according to my testing - do your own research, you may find something even better :)
The current/latest version that I've been using as of writing and testing this script is TTSv48
Settings which differ from the default ones:
from - False (time filter is from the indicator script itself)
Deal Conditions Mode - External (take enter/exit conditions from an external script)
🔌Signal 🛈➡ - MACD_RSI_trend_following: 🔌Signal to TTSv48 (this is the output from the indicator script, according to the TTS convention)
Sat/Sun - true (for crypto, in order to trade 24/7)
Order Type - STOP (perform stop order)
Distance Method - HHLL (HigherHighLowerLow - in order to set the SL according to the strategy definition from above)
The next are just personal preferenes, you can feel free to experiment according to your trading style
Take Profit Targets - 0 (either 100% in or out, no incremental stepping in or out of positions)
Dist Mul|Len Long/Short- 10 (make sure that we don't close on profitable trades by any reason)
Quantity Method - EQUITY (personal backtesting preference is to consider each backtest as a separate portfolio, so determine the position size by 100% of the allocated equity size)
Equity % - 100 (note above)

Dual_MACD_trendingINFO:
This indicator is useful for trending assets, as my preference is for low-frequency trading, thus using BTCUSD on 1D/1W chart
In the current implementation I find two possible use cases for the indicator:
- as a stand-alone indicator on the chart which can also fire alerts that can help to determine if we want to manually enter/exit trades based on the signals from it (1D/1W is good for non-automated trading)
- can be used to connect to the Signal input of the TTS (TempalteTradingStrategy) by jason5480 in order to backtest it, thus effectively turning it into a strategy (instructions below in TTS CONNECTIVITY section)
Trading period can be selected from the indicator itself to limit to more interesting periods.
Arrow indications are drawn on the chart to indicate the trading conditions met in the script - light green for HTF crossover, dark green for LTF crossover and orange for LTF crossunder.
Note that the indicator performs best in trending assets and markets, and it is advisable to use additional indicators to filter the trading conditions when market/asset is expected to move sideways.
DETAILS:
It uses a couple of MACD indicators - one from the current timeframe and one from a higher timeframe, as the crossover/crossunder cases of the MACD line and the signal line indicate the potential entry/exit points.
The strategy has the following flow:
- If the weekly MACD is positive (MACD line is over the signal line) we have a trading window.
- If we have a trading window, we buy when the daily macd line crosses AND closes above the signal line.
- If we are in a position, we await the daily MACD to cross AND close under the signal line, and only then place a stop loss under the wick of that closing candle.
The user can select both the higher (HTF) and lower (LTF) timeframes. Preferably the lower timeframe should be the one that the Chart is on for better visualization.
If one to decide to use the indicator as a strategy, it implements the following buy and sell criterias, which are feed to the TTS, but can be also manually managed via adding alerts from this indicator.
Since usually the LTF is preceeding the crossover compared to the HTF, then my interpretation of the strategy and flow that it follows is allowing two different ways to enter a trade:
- crossover (and bar close) of the macd over the signal line in the HIGH TIMEFRAME (no need to look at the LOWER TIMEFRMAE)
- crossover (and bar close) of the macd over the signal line in the LOW TIMEFRAME, as in this case we need to check also that the macd line is over the signal line for the HIGH TIMEFRAME as well (like a regime filter)
The exit of the trade is based on the lower timeframe MACD only, as we create a stop loss equal to the lower wick of the bar, once the macd line crosses below the signal line on that timeframe
SETTINGS:
All of the indicator's settings are for the vanilla/general case.
User can set all of the MACD parameters for both the higher and lower (current) timeframes, currently left to default of the MACD stand-alone indicator itself.
The start-end date is a time filter that can be extermely usefull when backtesting different time periods.
TTS SETTINGS (NEEDED IF USED TO BACKTEST WITH TTS)
The TempalteTradingStrategy is a strategy script developed in Pine by jason5480, which I recommend for quick turn-around of testing different ideas on a proven and tested framework
I cannot give enough credit to the developer for the efforts put in building of the infrastructure, so I advice everyone that wants to use it first to get familiar with the concept and by checking
by checking jason5480's profile www.tradingview.com
The TTS itself is extremely functional and have a lot of properties, so its functionality is beyond the scope of the current script -
Again, I strongly recommend to be thoroughly epxlored by everyone that plans on using it.
In the nutshell it is a script that can be feed with buy/sell signals from an external indicator script and based on many configuration options it can determine how to execute the trades.
The TTS has many settings that can be applied, so below I will cover only the ones that differ from the default ones, at least according to my testing - do your own research, you may find something even better :)
The current/latest version that I've been using as of writing and testing this script is TTSv48
Settings which differ from the default ones:
- from - False (time filter is from the indicator script itself)
- Deal Conditions Mode - External (take enter/exit conditions from an external script)
- 🔌Signal 🛈➡ - Dual_MACD: 🔌Signal to TTSv48 (this is the output from the indicator script, according to the TTS convention)
- Sat/Sun - true (for crypto, in order to trade 24/7)
- Order Type - STOP (perform stop order)
- Distance Method - HHLL (HigherHighLowerLow - in order to set the SL according to the strategy definition from above)
The next are just personal preferenes, you can feel free to experiment according to your trading style
- Take Profit Targets - 0 (either 100% in or out, no incremental stepping in or out of positions)
- Dist Mul|Len Long/Short- 10 (make sure that we don't close on profitable trades by any reason)
- Quantity Method - EQUITY (personal backtesting preference is to consider each backtest as a separate portfolio, so determine the position size by 100% of the allocated equity size)
- Equity % - 100 (note above)
EXAMPLES:
If used as a stand-alone indicator, the green arrows on the bottom will represent:
- light green - MACD line crossover signal line in the HTF
- darker green - MACD line crossover signal line in the LTF
- orange - MACD line crossunder signal line in the LTF
I recommend enabling the alerts from the script to cover those cases.
If used as an input to the TTS, we'll get more decorations on the chart from the TTS itself.
In the example below we open a trade on the next day of LTF crossover, then a few days later a crossunder in the LTF occurs, so we set a SL at the low of the wick of this day. Few days later the price doesn't recover and hits that SL, so the position is closed.

[blackcat] L2 Zero Lag Hull Moving AverageZero Lag Hull Moving Average (ZLHMA) is a technical indicator that is based on the principles of Zero Lag Hull Moving Average (HMA). It is designed to provide a smoother and more accurate representation of price trends by reducing lag and improving the responsiveness of the moving average line.
Compared to traditional moving average lines, the Zero Lag Hull Moving Average has the advantage of being able to capture price trend changes more precisely. It achieves this by utilizing a higher degree of smoothness through the use of weighted moving averages, and by incorporating the calculation method of Hull Moving Average (HMA) to further eliminate lag.
The calculation process of the Zero Lag Hull Moving Average involves two main steps. First, the Hull Moving Average (HMA) is calculated by taking the difference between two weighted moving averages applied to the price data. This helps to smooth out the price fluctuations and reduce lag. Then, the difference between two weighted moving averages is applied once again to the HMA, resulting in the Zero Lag Hull Moving Average. This final step further enhances the accuracy and timeliness of the indicator.
The Zero Lag Hull Moving Average offers several advantages for traders. Firstly, it provides a quicker response to changes in price trends, allowing traders to make more timely and informed trading decisions. This can be particularly useful in fast-moving markets where speed is crucial. Secondly, by reducing lag, the Zero Lag Hull Moving Average helps traders avoid missing important market signals and potential trading opportunities. It provides a more accurate representation of the current market conditions, enabling traders to act with greater confidence.
However, it is important to note that the Zero Lag Hull Moving Average should not be used as the sole basis for making trading decisions. It is recommended to consider other technical indicators, as well as fundamental and market analysis, to gain a comprehensive understanding of the market dynamics. Traders should also conduct thorough backtesting and validation of their trading strategies to ensure their effectiveness.
In conclusion, the Zero Lag Hull Moving Average is a powerful tool that can enhance the accuracy and responsiveness of technical analysis. By reducing lag and providing a more accurate representation of price trends, it can assist traders in making better-informed trading decisions. However, it should be used in conjunction with other indicators and analysis methods for a comprehensive approach to trading.
Please note that the information provided by blackcat1402 is for educational purposes only and should not be considered as financial advice. It is essential to conduct thorough research, backtesting, and validation before implementing any trading strategies.

[tradinghook] - Renko Trend Reversal Strategy V2Title: Renko Trend Reversal Strategy
Short Title: - Renko TRS
> Special thanks to for manually calculating `renkoClose` and `renkoOpen` values in order to remove the infamous repaint issue
Description:
The Renko Trend Reversal Strategy ( - Renko TRS) is a powerful and original trading approach designed to identify trend reversals in financial markets using Renko charts. Renko charts differ from traditional time-based charts, as they focus solely on price movements and ignore time, resulting in a clearer representation of market trends. This strategy leverages Renko charts in conjunction with the Average True Range (ATR) to capture trend reversals with high precision and effectiveness.
Key Concepts:
Renko Charts: Renko charts are unique chart types that only plot price movements beyond a predefined brick size, ignoring time and noise. By doing so, they provide a more straightforward depiction of market trends, eliminating insignificant price fluctuations and making it easier to spot trend reversals.
Average True Range (ATR): The strategy utilizes the ATR indicator, which measures market volatility and provides valuable insights into potential price movements. By setting the brick size of the Renko chart based on the ATR, the strategy adapts to changing market conditions, ensuring optimal performance across various instruments and timeframes.
How it Works:
The Renko Trend Reversal Strategy is designed to identify trend reversal points and generate buy or sell signals based on the following principles:
Renko Brick Generation: The strategy calculates the ATR over a user-defined period (ATR Length) and utilizes this value to determine the size of Renko bricks. Larger ATR values result in bigger bricks, capturing higher market volatility, while smaller ATR values create smaller bricks for calmer market conditions.
Buy and Sell Signals: The strategy generates buy signals when the Renko chart's open price crosses below the close price, indicating a potential bullish trend reversal. Conversely, sell signals are generated when the open price crosses above the close price, suggesting a bearish trend reversal. These signals help traders identify potential entry points to capitalize on market movements.
Stop Loss and Take Profit Management: To manage risk and protect profits, the strategy incorporates dynamic stop-loss and take-profit levels. The stop-loss level is calculated as a percentage of the Renko open price, ensuring a fixed risk amount for each trade. Similarly, the take-profit level is set as a percentage of the Renko open price to secure potential gains.
How to Use:
Inputs: Before using the strategy, traders can customize several parameters to suit their trading preferences. These inputs include the ATR Length, Stop Loss Percentage, Take Profit Percentage, Start Date, and End Date. Adjusting these settings allows users to optimize the strategy for different market conditions and risk tolerances.
Chart Setup: Apply the - Renko TRS script to your desired financial instrument and timeframe on TradingView. The Renko chart will dynamically adjust its brick size based on the ATR Length parameter.
Buy and Sell Signals: The strategy will generate green "Buy" labels below bullish reversal points and red "Sell" labels above bearish reversal points on the Renko chart. These labels indicate potential entry points for long and short trades, respectively.
Risk Management: The strategy automatically calculates stop-loss and take-profit levels based on the user-defined percentages. Traders can ensure proper risk management by using these levels to protect their capital and secure profits.
Backtesting and Optimization: Before implementing the strategy live, traders are encouraged to backtest it on historical data to assess its performance across various market conditions. Adjust the input parameters through optimization to find the most suitable settings for specific instruments and timeframes.
Conclusion:
The - Renko Trend Reversal Strategy is a unique and versatile tool for traders looking to identify trend reversals with greater accuracy. By combining Renko charts and the Average True Range (ATR) indicator, this strategy adapts to market dynamics and provides clear entry and exit signals. Traders can harness the power of Renko charts while effectively managing risk through stop-loss and take-profit levels. Before using the strategy in live trading, backtesting and optimization will help traders fine-tune the parameters for optimal performance. Start exploring trend reversals with the - Renko TRS and take your trading to the next level.
(Note: This description is for illustrative purposes only and does not constitute financial advice. Traders are advised to thoroughly test the strategy and exercise sound risk management practices when trading in real markets.)

[tradinghook] - Renko Trend Reversal Strategy - Renko Trend Reversal Strategy
Short Title: - Renko TRS
Description:
The Renko Trend Reversal Strategy ( - Renko TRS) is a powerful and original trading approach designed to identify trend reversals in financial markets using Renko charts. Renko charts differ from traditional time-based charts, as they focus solely on price movements and ignore time, resulting in a clearer representation of market trends. This strategy leverages Renko charts in conjunction with the Average True Range (ATR) to capture trend reversals with high precision and effectiveness.
Key Concepts:
Renko Charts: Renko charts are unique chart types that only plot price movements beyond a predefined brick size, ignoring time and noise. By doing so, they provide a more straightforward depiction of market trends, eliminating insignificant price fluctuations and making it easier to spot trend reversals.
Average True Range (ATR): The strategy utilizes the ATR indicator, which measures market volatility and provides valuable insights into potential price movements. By setting the brick size of the Renko chart based on the ATR, the strategy adapts to changing market conditions, ensuring optimal performance across various instruments and timeframes.
How it Works:
The Renko Trend Reversal Strategy is designed to identify trend reversal points and generate buy or sell signals based on the following principles:
Renko Brick Generation: The strategy calculates the ATR over a user-defined period (ATR Length) and utilizes this value to determine the size of Renko bricks. Larger ATR values result in bigger bricks, capturing higher market volatility, while smaller ATR values create smaller bricks for calmer market conditions.
Buy and Sell Signals: The strategy generates buy signals when the Renko chart's open price crosses below the close price, indicating a potential bullish trend reversal. Conversely, sell signals are generated when the open price crosses above the close price, suggesting a bearish trend reversal. These signals help traders identify potential entry points to capitalize on market movements.
Stop Loss and Take Profit Management: To manage risk and protect profits, the strategy incorporates dynamic stop-loss and take-profit levels. The stop-loss level is calculated as a percentage of the Renko open price, ensuring a fixed risk amount for each trade. Similarly, the take-profit level is set as a percentage of the Renko open price to secure potential gains.
How to Use:
Inputs: Before using the strategy, traders can customize several parameters to suit their trading preferences. These inputs include the ATR Length, Stop Loss Percentage, Take Profit Percentage, Start Date, and End Date. Adjusting these settings allows users to optimize the strategy for different market conditions and risk tolerances.
Chart Setup: Apply the - Renko TRS script to your desired financial instrument and timeframe on TradingView. The Renko chart will dynamically adjust its brick size based on the ATR Length parameter.
Buy and Sell Signals: The strategy will generate green "Buy" labels below bullish reversal points and red "Sell" labels above bearish reversal points on the Renko chart. These labels indicate potential entry points for long and short trades, respectively.
Risk Management: The strategy automatically calculates stop-loss and take-profit levels based on the user-defined percentages. Traders can ensure proper risk management by using these levels to protect their capital and secure profits.
Backtesting and Optimization: Before implementing the strategy live, traders are encouraged to backtest it on historical data to assess its performance across various market conditions. Adjust the input parameters through optimization to find the most suitable settings for specific instruments and timeframes.
Conclusion:
The - Renko Trend Reversal Strategy is a unique and versatile tool for traders looking to identify trend reversals with greater accuracy. By combining Renko charts and the Average True Range (ATR) indicator, this strategy adapts to market dynamics and provides clear entry and exit signals. Traders can harness the power of Renko charts while effectively managing risk through stop-loss and take-profit levels. Before using the strategy in live trading, backtesting and optimization will help traders fine-tune the parameters for optimal performance. Start exploring trend reversals with the - Renko TRS and take your trading to the next level.
(Note: This description is for illustrative purposes only and does not constitute financial advice. Traders are advised to thoroughly test the strategy and exercise sound risk management practices when trading in real markets.)

Ultimate Balance StrategyThe Ultimate Balance Oscillator Strategy harnesses the power of the Ultimate Balance Oscillator to deliver a comprehensive and disciplined approach to trading. By combining the insights of the Rate of Change (ROC), Relative Strength Index (RSI), Commodity Channel Index (CCI), Williams Percent Range, and Average Directional Index (ADX) from TradingView, this strategy offers traders a systematic way to navigate the markets with precision.
The core principle of this strategy lies in its ability to identify optimal entry and exit points based on the movement of the Ultimate Balance Oscillator. When the oscillator line crosses below the 0.75 level, a buy signal is generated, indicating a potential opportunity for a bullish trend reversal. Conversely, when the oscillator line crosses above the 0.25 level, it triggers an exit signal, suggesting a possible end to a bullish trend.
Key Features:
1. Objective Market Analysis: The Ultimate Balance Oscillator Strategy provides a disciplined and objective approach to market analysis. By relying on the quantified insights of multiple indicators, it helps traders cut through market noise and focus on key signals, improving decision-making and reducing emotional biases.
2. Enhanced Timing and Precision: This strategy's entry and exit signals are based on the specific thresholds of the Ultimate Balance Oscillator. By waiting for confirmation through the crossing of these levels, traders can potentially enter trades at opportune moments and exit with greater precision, maximizing profit potential and minimizing risk exposure.
3. Customizability and Adaptability: The strategy offers flexibility, allowing traders to customize the parameters to fit their preferred trading style and timeframes. Whether you're a short-term trader or a long-term investor, the Ultimate Balance Oscillator Strategy can be adjusted to suit your specific needs, making it adaptable to various market conditions.
4. Real-time Alerts: Stay informed and never miss a potential trade opportunity with the strategy's built-in alert system. Set personalized alerts for buy and exit signals to receive timely notifications, ensuring you're always aware of the latest developments in the market.
5. Backtesting and Optimization: Before applying the strategy to live trading, it's recommended to conduct thorough backtesting and optimization. By testing the strategy's performance over historical data and fine-tuning the parameters, you can gain insights into its strengths and weaknesses, enabling you to make informed adjustments and increase its effectiveness.
Trading involves risk. Use the Ultimate Balance Oscillator Strategy at your own discretion. Past performance is not indicative of future results.

Bollinger Bands - Breakout StrategyThe Bollinger Bands - Breakout Strategy is a trend-following optimized for short-term trading in the crypto market. This strategy employs the Bollinger Bands, a widely recognized technical indicator, as its primary instrument for pinpointing potential trades. It is capable of executing both long and short positions, depending on whether the market is in a spot or futures, and is particularly effective in trending markets.
The strategy boasts a high degree of configurability, allowing users to set the Bollinger Bands period and deviation, trend filter, volatility filter, trade direction filter, rate of change filter, and date filter. Furthermore, it offers options for Take Profit, Stop Loss, and Trailing Stop for both long and short positions, ensuring a comprehensive risk management approach. The inclusion of a maximum intraday loss feature adds another layer of protection, making this strategy a valuable tool for traders seeking a professional and adaptable trading system.
Name : Bollinger Bands - Breakout Strategy
Category : Trend Follower based on Bollinger Bands
Operating mode : Long and Short on Futures or Long on Spot
Trade duration : Intraday
Timeframe : 2H, 3H, 4H, 5H
Market : Crypto
Suggested usage : Trending Markets
Entry : When the price crosses above or below the Bollinger Bands
Exit : Opposite Cross or Profit target, Trailing stop or Stop loss
Configuration :
- Bollinger Bands period and deviation
- Trend Filter
- Volatility Filter
- Trade direction filter
- Rate of Change filter
- Date Filter (for backtesting purposes)
- Take Profit, Stop Loss and Trailing Stop for long and short positions
- Risk Management: Max Intraday Loss
Backtesting :
⁃ Exchange: BINANCE
⁃ Pair: BTCUSDT.P
⁃ Timeframe: 4H
⁃ Fee: 0.025%
⁃ Slippage: 1
- Initial Capital: 10000 USDT
- Position sizing: 10% of Equity
- Start : 2019-09-19 (Out Of Sample from 2022-12-23)
- Bar magnifier: on
Credits :
- LucF of Pine Coders for f_security function to avoid repainting using security.
- QuantNomad for Monthly Table.
Disclaimer : Risk Management is crucial, so adjust stop loss to your comfort level. A tight stop loss can help minimise potential losses. Use at your own risk.
How you or we can improve? Source code is open so share your ideas!
Leave a comment and smash the boost button!
Thanks for your attention, happy to support the TradingView community.

Divergences in 52 Week Moving Averages, Adjusted and SmoothedThis script description is intended to be holistic and comprehensive for the understanding of the interested parties who view the script.
Following the PineCoders suggestions, I have provided detailed breakdowns both within the code and in the description immediately below:
► Description
This description is intended to be detailed and meaningful, conveying the understanding of the script’s intention to the user:
The theory: Divergences and extreme readings in 52-Week highs on major indexes can provide a view into a potential pending move in the opposite direction of how the market has been trending. By comparing the 52-Week Hi/Lo indices and applying an Exponential Moving Average (EMA), we can assess how extreme a move is from the average. If the move provides an extreme reading, it would potentially be beneficial to “fade” the move (take a position in the opposing direction).
The intention: The intentionality of this script is to provide a visualization of when the highly-probable opportunity to fade over a multi-day or multi-week period arises. In addition to this, based on backtesting prior moves and reading the various levels of significant reversals, three tiers: “Standard”, “Sensitive”, and “Highly Sensitive” have been applied, the user can choose which sensitivity level they would like to see, there are far less false positives on the Standard and Sensitive settings, while Highly Sensitive often signals multiple times with the move coming a few days later.
The application: The settings allow the user to customize their sensitivity to the fade signals, with the ability to customize the visual that shows up as well. For higher-highs that are fade-worthy, the signal will appear on the top of the candle, for lower-lows that are fade-worthy, the signal will appear on the bottom of the candle. The users risk criteria should be the primary driver of the entry/exit, although when backtesting it appears that the significant move is typically completed within a 2-4 week period at max and 3-5 day period at minimum.
A personal note: I am a futures trader intraday but would very strongly caution users when using this strategy with futures (unless their risk tolerance is higher than most). The most beneficial strategy when fading moves would be to enter in tranches, starting at the first signal and adding on any pullback (as long as the pullback is not below the initial entry point). 1-6 Week Date-To-Expiry options would be the primary method for applying this strategy. I would also like to add that SPY/SPX options (SPDR S&P 500 ETF Trust / CBOE S&P 500 Index) are the most liquid options that could be applied in this strategy.
► Description (additional)
With the understanding that few users can read pinescript (Pine), the description above contains all of the necessary information that is necessary for a user to understand the intention for script utilization. For those who do understand Pine, the code is commented in each section in order to provide an understanding of the underlying functions, calculations, and thought process that went on during the writing of the script.
► Description (additional)
This script’s description contains no delegations, all aspects of the script as well as the initial idea behind it are contained in the description above, which is self-contained in it’s entirety with a clear and defined purpose that is written with the intent to holistically capture the intent of the potential use for this indicator.
► General House Rule #2
This script and the description (as well as my profile) contain no links or associations to promotion of any kind, I am not a business, I am not an individual that will in any way make money from this script or the promotion of another person, idea, company, entity, or legal persons (foreign or domestic).
► Originality and usefulness
This is an original and custom script (and idea) that is not a rehashing or a copy of any code from any other programmers in the tradingview community.
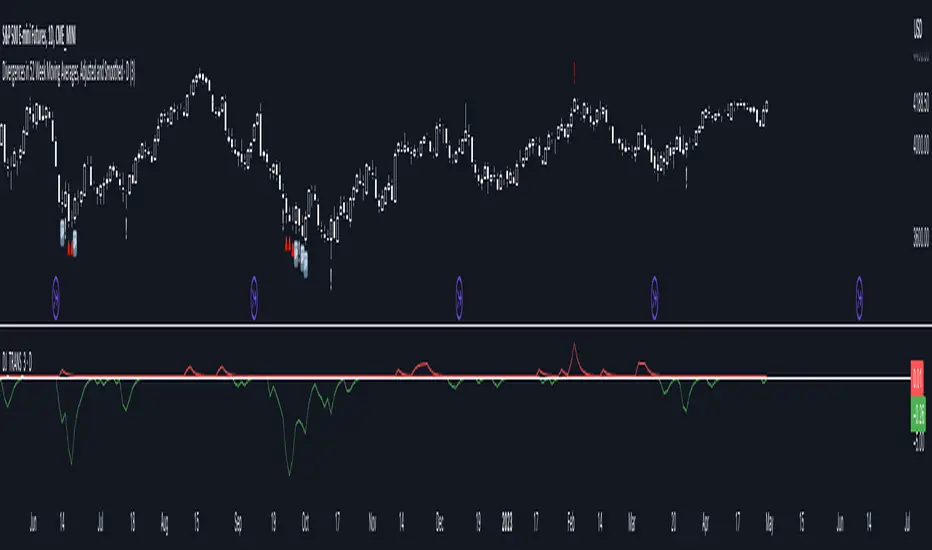
Simple_RSI+PA+DCA StrategyThis strategy is a result of a study to understand better the workings of functions, for loops and the use of lines to visualize price levels. The strategy is a complete rewrite of the older RSI+PA+DCA Strategy with the goal to make it dynamic and to simplify the strategy settings to the bare minimum.
In case you are not familiar with the older RSI+PA+DCA Strategy, here is a short explanation of the idea behind the strategy:
The idea behind the strategy based on an RSI strategy of buying low. A position is entered when the RSI and moving average conditions are met. The position is closed when it reaches a specified take profit percentage. As soon as the first the position is opened multiple PA (price average) layers are setup based on a specified percentage of price drop. When the price hits the layer another position with the same position size is is opened. This causes the average cost price (the white line) to decrease. If the price drops more, another position is opened with another price average decrease as result. When the price starts rising again the different positions are separately closed when each reaches the specified take profit. The positions can be re-opened when the price drops again. And so on. When the price rises more and crosses over the average price and reached the specified Stop level (the red line) on top of it, it closes all the positions at once and cancels all orders. From that moment on it waits for another price dip before it opens a new position.
This is the old RSI+PA+DCA Strategy:
The reason to completely rewrite the code for this strategy is to create a more automated, adaptable and dynamic system. The old version is static and because of the linear use of code the amount of DCA levels were fixed to max 6 layers. If you want to add more DCA layers you manually need to change the script and add extra code. The big difference in the new version is that you can specify the amount of DCA layers in the strategy settings. The use of 'for loops' in the code gives the possibility to make this very dynamic and adaptable.
The RSI code is adapted, just like the old version, from the RSI Strategy - Buy The Dips by Coinrule and is used for study purpose. Any other low/dip finding indicator can be used as well
The distance between the DCA layers are calculated exponentially in a function. In the settings you can define the exponential scale to create the distance between the layers. The bigger the scale the bigger the distance. This calculation is not working perfectly yet and needs way more experimentation. Feel free to leave a comment if you have a better idea about this.
The idea behind generating DCA layers with a 'for loop' is inspired by the Backtesting 3commas DCA Bot v2 by rouxam .
The ideas for creating a dynamic position count and for opening and closing different positions separately based on a specified take profit are taken from the Simple_Pyramiding strategy I wrote previously.
This code is a result of a study and not intended for use as a full functioning strategy. To make the code understandable for users that are not so much introduced into pine script (like myself), every step in the code is commented to explain what it does. Hopefully it helps.
Enjoy!

Drip's 11am rule breakout/breakdown (OG)This indicator is based on Drippy2hard's 11:30 am (EST) rule.
In simple terms the rule states that:
If a trending stock makes a new high after 11:15-11:30am EST, there is a 75% chance of closing within 1% of High of day (HOD). Same applies for downtrend.
Please note:
Not all stocks will abide by this, this is backtested on stocks with avg daily volume > 2M and mostly mega cap stocks which have liquid option chains. The backtesting results show very promising results on $SPY/ $SPX so it is advised to trade $SPY/ $SPX using this indicator over any other stocks.
Although the name suggests 11 AM rule, the backtesting shows higher win rate for 11:30 AM so please select that option in the settings.
As always, no indicator is perfect and please follow your risk management and understand that indicators are tools to aid your trading and by no means they are supposed to work as intended in all scenarios
How the script works
1. A HOD/LOD zone is identified based on regular session (9:30am-11:30am) EST. Users can select cut off time to 11AM in the settings. These will be indicated on chart after 11/11:30pm depending on what user selected
2. If the stock breaks above the HOD and the ADX is showing strong momentum to upside then the candlesticks will start showing neon color, if the trend based on moving averages and candle closing is also bullish then the indicator will show trend arrows under the candle indicating to stay in the trade. Same applies for break below LOD, only the colors will change to represent downtrend.
3. An optional cloud is also shown if the trend is developed. The cloud can be used as trail stop or re entry point as long as it is displayed on chart
How to use the indicator in trading
In general, there are three scenarios which are trade worthy
1. If the stocks breaks out above the HOD zone and up trend develops or the stocks breaks below the LOD zone and downtrend develops. See images below
2. You can also use the LOD/HOD zone as demand/ supply if the Price action is range bound like this example below
Thanks for reading, please give thumbs up if you like using it! Please post comments on how to use it.

Pure Mark Minervini 10%TP 5%CLBacktesting Mark Miniverni Template
By Donnie Lee
Overall, a good basic guideline from Mark Miniverni to choose which stock to buy. His selection are said to be stocks in stage 2 uptrend phase which could see price surge soon.
This script enable backtesting of Mark template (Investor's Business Ranking Excluded) on equity like stocks
Further fine tuning with additional filters are needed to find good entry with desired cut loss level and position sizing.
There is no holy grail strategy. Choose one with an edge that you are comfortable with and stick to it.
Losing is part and parcel of trading. Hesitation to cut loss can lead to big loss. And if you can avoid losing big, you might stand a chance to profit in the end.
Mark Miniverni Template
1. The current stock price is above both the 150-day (30-week) and the 200-day (40-week) moving average price lines.
2. The 150-day moving average is above the 200-day moving average.
3. The 200-day moving average line is trending up for at least 1 month (preferably 4–5 months minimum in most cases).
4. The 50-day (10-week) moving average is above both the 150-day and 200-day moving averages.
5. The current stock price is trading above the 50-day moving average.
6. The current stock price is at least 25% above its 52-week low (30% as per his book 'Trade Like a Stock Market Wizard').
7. The current stock price is within at least 25% of its 52-week high (the closer to a new high the better).
