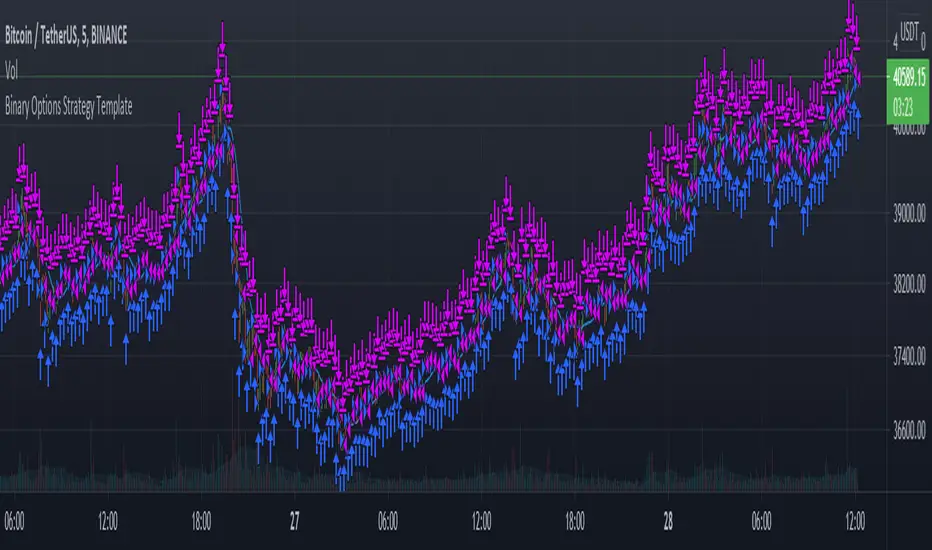
Binary Options Strategy TemplateWith the hype around Binary Options trading (more like gambling instead of trading) it is good to be able to backtest a strategy before using it in the live markets.
In a Binary Options trade the trade get's closed after a specific amount of time and the only thing that matters is if the market has increased in price or decreased after that amount of time.
Because of this a strategy backtest should close all positions after a specific amount of time. In this super small script the number of bars since the trade was opened is used as a way to close the position. So for example if you use this strategy on the 1 minute charts with number of bars set to 5 it will close the position 5 minutes after opening it. Purpose of this script is using it as a strategy on already existing scripts to check viability for options trading.
With the limited pine knowledge that I have I do not know if it is possible to create a more realistic binary options strategy which also calculated the profit. If someone knows a more advanced version of this please let me know.
"backtest" için komut dosyalarını ara
RSI-VWAP Indicator %█ OVERALL
Simple and effective script that, as you already know, uses vwap as source of the rsi, and with good results as long as the market has no long-term downtrend.
RsiVwap = rsi (vwap (close), Length)
The default settings are for BTC in a 30 minute time frame. For other pairs and time frames you just have to play with the settings.
█ FEATURES
• The option to start trading from a certain date has been added.
• To make the profit more progressive, a percentage of your equity is used for entries and a percentage of your position is used for closings.
• The option to trade in Spot mode has been added, since, for the TradingView backtest, the money is infinite and if you do not limit it somehow,
it would offer you much better profits than the live trading.
QuantityOnLong = Spot ? (EquityPercent / 100) * ((strategy.equity / close) - strategy.position_size) : (EquityPercent / 100) * (strategy.equity / close)
• The option to stop the system when the drawdown exceeds the fixed limit has been added.
Drawdown, as you already know, is a very important measure of risk in trading systems.
The maximum drawdown will tell us what the maximum loss of a trading system has been during a period. This maximum loss is determined by:
strategy.risk.max_drawdown(Risk, strategy.percent_of_equity)
• Leverage plotted on labels added.
█ ALERTS
To enjoy the benefits of automatic trading, TradingView alerts can be used as direct buy-sell orders on spot, or long-close orders with leverage.
Currently there are Chrome extensions that act as a bridge between TradingView and your Exchange or Broker.
This is an example of syntax for this type of extensions. Copy and paste a message like this into the alert window:
{{strategy.order.action}} @ {{strategy.order.price}} | e = {{exchange}} a = account s = {{ticker}} b = {{strategy.order.action}} {{strategy.order.alert_message}}
█ NOTE
Certain Risks of Live Algorithmic Trading You Should Know:
• Backtesting cannot assure actual results.
• The relevant market might fail or behave unexpectedly.
• Your broker may experience failures in its infrastructure, fail to execute your orders in a correct or timely fashion or reject your orders.
• The system you use for generating trading orders, communicating those orders to your broker, and receiving queries and trading results from your broker may fail.
• Time lag at various point in live trading might cause unexpected behavior.
• The systems of third parties in addition to those of the provider from which we obtain various services, your broker, and the applicable securities market may fail or malfunction.
█ THANKS
Thanks to TradingView, its Pine code, its community and especially those Pine wizards who post their ideas that helps us to learn.
If the world is heading toward a equitable new world economic order, let's get rich first ...
Happy trading!

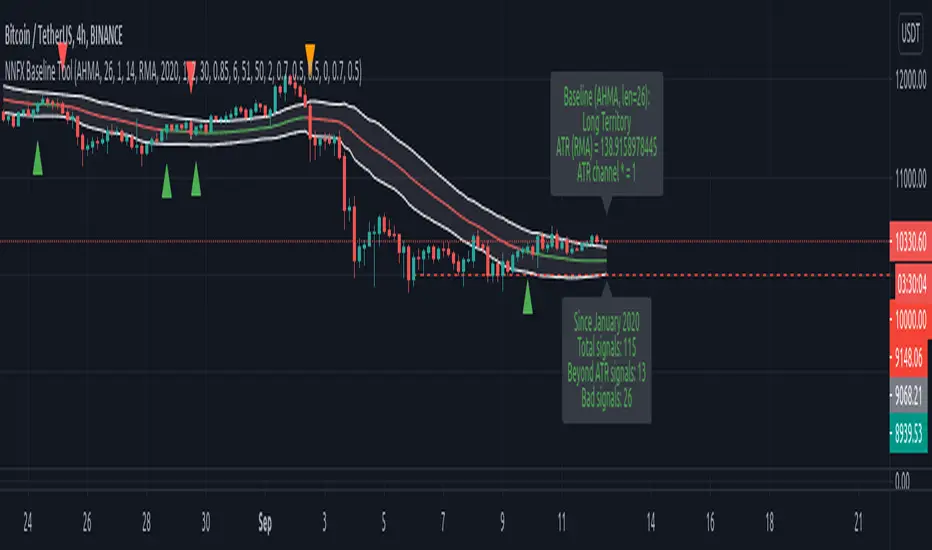
NNFX Baseline ToolNNFX All-in-One Baseline display / test tool.
This is usefull (hopefully) for the NNFX way of trading only. It's not intended to be used as a standalone tool.
Basically, this script displays and tests many types of Moving Averages as baselines.
It displays baseline signals, based on the NNFX ATR-related rule for baseline entries.
It can be used as a backtest tool, or plugged into the whole nnfx algo.
If signal display option is enabled, signals are displayed on chart : green for long, red for short, orange for crossovers beyond the ATR channel :
Many baselines available : SMA , EMA , WMA , VWMA , ALMA , AMA, SMMA , DEMA , FRAMA , HULL, KAMA , KIJUN, JURIK, LAGUERRE, MCGINLEY , TMA1, TMA2, VIDYA , MODULAR FILTER, VAMA , ZLEMA , T3, LSMA, etc.
Additional options :
- multiplying the ATR channel (and subsequent rule) by a factor (default = 1)
- plot the ATR channel (def = yes)
- fill it (def = yes)
- display signals (def = yes)
- option for add color to the baseline, for long/short territory (2 different options : baseline is colored, background is colored)
- darkmode / lightmode color option. (def = dark)
We also display panels, with general information and some test results. Tests are done within the test period.
I tried to test all the different MAs included in the script but some bugs might still be present, so use it at ur own risk.
If you'd like a new MA option added, please let me know in comments.
I included a "bad" signal detection, it can help for tweaking the settings. Signals are defined as "bad" when they are immediately followed by another signal.
When there is 2 or more bad signals next to another, you spotted a chopiness zone (a chopiness zone is defined as a zone where BL get eaten alive).
Example :
to do :
- plug it with the c1/c2 backtest tool (it's the whole point)
- add alerts,
- add more ma types
- stop to use the operator, it's not convenient at all
- add wr% calculation as a standalone feature (with TP / SL)
- add a way to measure chopiness in the test (dont know how yet)
- detect & display chopiness zones
I asked other users when I used their ideas (for some particular types of MAs). They all agreed.
How To Set Trade Dates
Example how to backtest specific date(s) which can be useful for testing seasonality strategy ideas such as "Sell in May", etc.
If using Daily period with wild card dates it will not trade on 1st day of month. If market is closed will trade on next open day.
Works only with Daily or lower timeframes. When using on Daily timeframe set dates 1 day earlier to execute on desired dates.
Entering 0 in any of the date fields acts a wild card. Example -> Entry Year: 0 is "Every Year", Exit Month: 0 is "Every Month", etc.
NOTICE: This is an example script and not meant to be used as an actual strategy. By using this script or any portion thereof, you acknowledge that you have read and understood that this is for research purposes only and I am not responsible for any financial losses you may incur by using this script!
Moving Average Convergence/Divergence MaCD BackestingMade this to backtest simple macd trading strategy, had to set it to open long and short positions because i'm not sure how you get it to calculate otherwise.
[STRATEGY]Kagi Emulator OCC & SLTP V3It is a Kagi candle emulator without resolution multiplier.
Also with take profit and stop loss.
Modify the value of "reversal" according to current symbol.
It's the backtest, coming soon, same script but with no-repainting alerts
Enjoy!

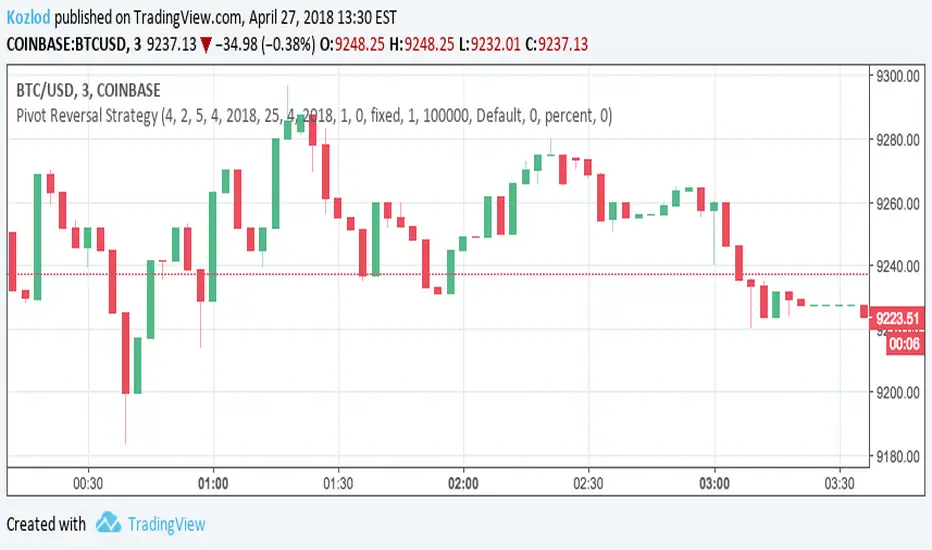
Pivot Reversal Strategy with backtest date rangeThis is standard Pivot Reversal Strategy with backtest date range added.
In parameters you can select from/to date for backtesting range.
MACD Crossover Backtest MACD – Moving Average Convergence Divergence. The MACD is calculated
by subtracting a 26-day moving average of a security's price from a
12-day moving average of its price. The result is an indicator that
oscillates above and below zero. When the MACD is above zero, it means
the 12-day moving average is higher than the 26-day moving average.
This is bullish as it shows that current expectations (i.e., the 12-day
moving average) are more bullish than previous expectations (i.e., the
26-day average). This implies a bullish, or upward, shift in the supply/demand
lines. When the MACD falls below zero, it means that the 12-day moving average
is less than the 26-day moving average, implying a bearish shift in the
supply/demand lines.
A 9-day moving average of the MACD (not of the security's price) is usually
plotted on top of the MACD indicator. This line is referred to as the "signal"
line. The signal line anticipates the convergence of the two moving averages
(i.e., the movement of the MACD toward the zero line).
Let's consider the rational behind this technique. The MACD is the difference
between two moving averages of price. When the shorter-term moving average rises
above the longer-term moving average (i.e., the MACD rises above zero), it means
that investor expectations are becoming more bullish (i.e., there has been an
upward shift in the supply/demand lines). By plotting a 9-day moving average of
the MACD, we can see the changing of expectations (i.e., the shifting of the
supply/demand lines) as they occur.
You can change long to short in the Input Settings
WARNING:
- For purpose educate only
- This script to change bars colors.

Kaufman Moving Average Adaptive (KAMA) Backtest Everyone wants a short-term, fast trading trend that works without large
losses. That combination does not exist. But it is possible to have fast
trading trends in which one must get in or out of the market quickly, but
these have the distinct disadvantage of being whipsawed by market noise
when the market is volatile in a sideways trending market. During these
periods, the trader is jumping in and out of positions with no profit-making
trend in sight. In an attempt to overcome the problem of noise and still be
able to get closer to the actual change of the trend, Kaufman developed an
indicator that adapts to market movement. This indicator, an adaptive moving
average (AMA), moves very slowly when markets are moving sideways but moves
swiftly when the markets also move swiftly, change directions or break out of
a trading range.
You can change long to short in the Input Settings
Please, use it only for learning or paper trading. Do not for real trading.

Empirical Mode Decomposition Strategy Backtest The related article is copyrighted material from Stocks & Commodities Mar 2010
You can use in the xPrice any series: Open, High, Low, Close, HL2, HLC3, OHLC4 and ect...
You can change long to short in the Input Settings
Please, use it only for learning or paper trading. Do not for real trading.
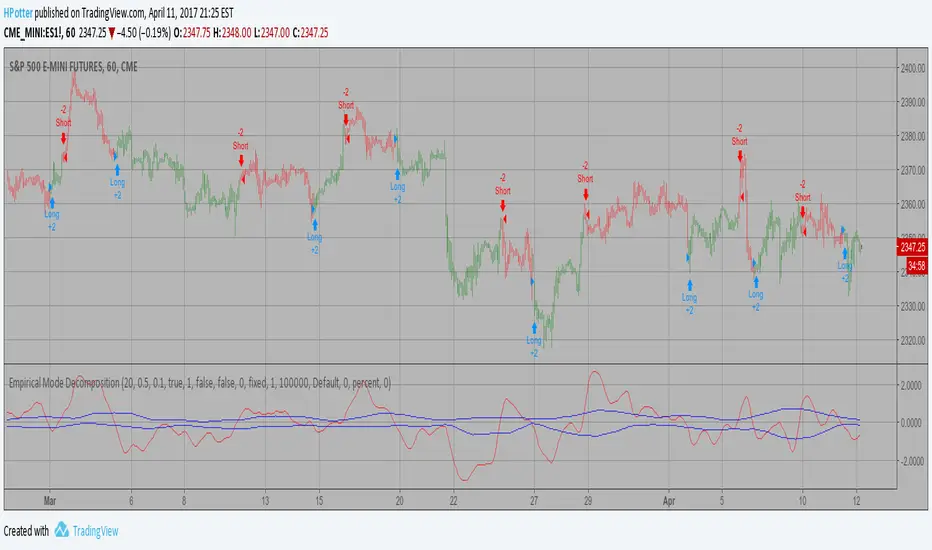
TradersAI_UTBotCREDITS to @HPotter for the orginal code.
CREDITS to @Yo_adriiiiaan for recently publishing the UT Bot study based on the original code -
I just added some simple code to turn it into a strategy. Now, anyone can simply add the strategy to their chart to see the backtesting results!
While @Yo_adriiiiaan mentions it works best on a 4-hour timeframe or above, I am happy to share that this seems to be working on a 15-minute chart on e-mini S&P 500 Index (using the KeyValue setting at 10)! You can play around with the different settings, and may be you might discover even better settings.
Hope this helps. Btw, if any of you play with different settings and discover great settings for a specific instrument, please share them with the community here - it will be rewarded back multiple times!

Any Strategy BacktestA simple script for backtesting your strategies with TP and SL settings. For this to work, your indicators must have sources for long and short conditions.

CDC BACKTEST (MACD) FIX AMOUNT $200k per trade This strategy implements an Exponential Moving Average (EMA) Crossover System designed for backtesting and performance evaluation. EMA 12,26 (MACD)
The trading logic is based on the crossover between two EMAs — a short-term EMA (12) and a long-term EMA (26) — which serves as a momentum-based signal for trend identification.
Buy Condition:
A long (buy) position is entered when the 12-period EMA crosses above the 26-period EMA, indicating a potential upward trend or bullish momentum.
Sell Condition:
A position is closed, or a short (sell) position is opened, when the 12-period EMA crosses below the 26-period EMA, signaling a potential downward trend or bearish momentum.
Position Sizing:
Each trade with a fixed position size of 200,000 USD (default), while the starting account balance is set at 400,000 (USD).
Both the fixed trade amount and the initial balance are user-adjustable parameters, allowing flexibility for different risk preferences and portfolio sizes.

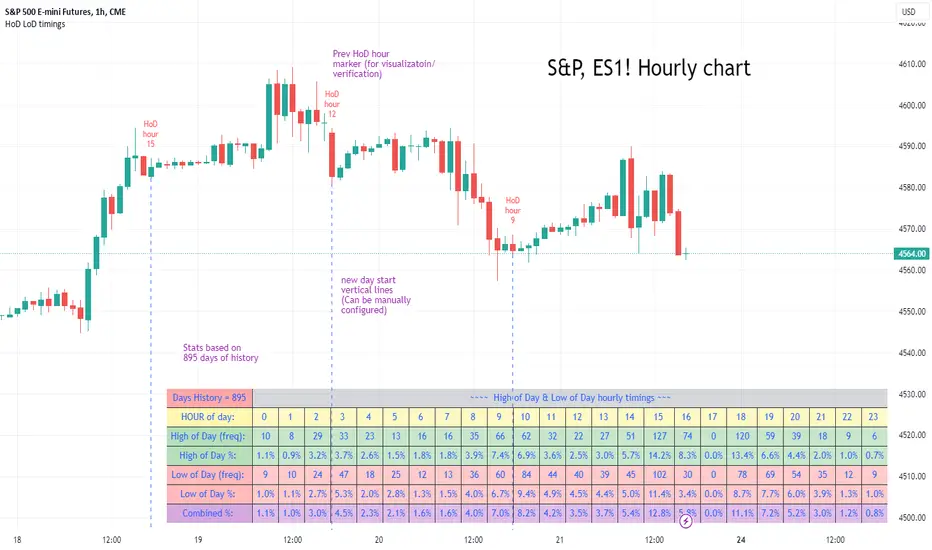
High of Day Low of Day hourly timings: Statistics. Time of day %High of Day (HoD) & Low of Day (LoD) hourly timings: Statistics. Time of day % likelihood for high and low.
//Purpose:
To collect stats on the hourly occurrences of HoD and LoD in an asset, to see which times of day price is more likely to form its highest and lowest prices.
//How it works:
Each day, HoD and LoD are calculated and placed in hourly 'buckets' from 0-23. Frequencies and Percentages are then calculated and printed/tabulated based on the full asset history available.
//User Inputs:
-Timezone (default is New York); important to make sure this matches your chart's timezone
-Day start time: (default is Tradingview's standard). Toggle Custom input box to input your own custom day start time.
-Show/hide day-start vertical lines; show/hide previous day's 'HoD hour' label (default toggled on). To be used as visual aid for setting up & verifying timezone settings are correct and table is populating correctly).
-Use historical start date (default toggled off): Use this along with bar-replay to backtest specific periods in price (i.e. consolidated vs trending, dull vs volatile).
-Standard formatting options (text color/size, table position, etc).
-Option to show ONLY on hourly chart (default toggled off): since this indicator is of most use by far on the hourly chart (most history, max precision).
// Notes & Tips:
-Make sure Timezone settings match (input setting & chart timezone).
-Play around with custom input day start time. Choose a 'dead' time (overnight) so as to ensure stats are their most meaningful (if you set a day start time when price is likely to be volatile or trending, you may get a biased / misleadingly high readout for the start-of-day/ end-of-day hour, due to price's tendency for continuation through that time.
-If you find a time of day with significantly higher % and it falls either side of your day start time. Try adjusting day start time to 'isolate' this reading and thereby filter out potential 'continuation bias' from the stats.
-Custom input start hour may not match to your chart at first, but this is not a concern: simply increment/decrement your input until you get the desired start time line on the chart; assuming your timezone settings for chart and indicator are matching, all will then work properly as designed.
-Use the the lines and labels along with bar-replay to verify HoD/LoD hours are printing correctly and table is populating correctly.
-Hour 'buckets' represent the start of said hour. i.e. hour 14 would be populated if HoD or LoD formed between 14:00 and 15:00.
-Combined % is simply the average of HoD % and LoD %. So it is the % likelihood of 'extreme of day' occurring in that hour.
-Best results from using this on Hourly charts (sub-hourly => less history; above hourly => less precision).
-Note that lower tier Tradingview subscriptions will get less data history. Premium acounts get 20k bars history => circa 900 days history on hourly chart for ES1!
-Works nicely on Btc/Usd too: any 24hr assets this will give meaningful data (whereas some commodities, such as Lean Hogs which only trade 5hrs in a day, will yield less meaningful data).
Example usage on S&P (ES1! 1hr chart): manual day start time of 11pm; New York timezone; Visual aid lines and labels toggled on. HoD LoD hour timings with 920 days history:
Chandelier Exit ZLSMA StrategyIntroducing a Powerful Trading Indicator: Chandelier Exit with ZLSMA
If you're a trader, you know the importance of having the right tools and indicators to make informed decisions. That's why we're excited to introduce a powerful new trading indicator that combines the Chandelier Exit and ZLSMA: two widely-used and effective indicators for technical analysis.
The Chandelier Exit (CE) is a popular trailing stop-loss indicator developed by Chuck LeBeau. It's designed to follow the price trend of a security and provide an exit signal when the price crosses below the CE line. The CE line is based on the Average True Range (ATR), which is a measure of volatility. This means that the CE line adjusts to the volatility of the security, making it a reliable indicator for trailing stop-losses.
The ZLEMA (Zero Lag Exponential Moving Average) is a type of exponential moving average that's designed to reduce lag and improve signal accuracy. The ZLSMA takes into account not only the current price but also past prices, using a weighted formula to calculate the moving average. This makes it a smoother indicator than traditional moving averages, and less prone to giving false signals.
When combined, the CE and ZLSMA create a powerful indicator that can help traders identify trend changes and make more informed trading decisions. The CE provides the trailing stop-loss signal, while the ZLSMA provides a smoother trend line to help identify potential entry and exit points.
In our indicator, the CE and ZLSMA are plotted together on the chart, making it easy to see both the trailing stop-loss and the trend line at the same time. The CE line is displayed as a dotted line, while the ZLSMA line is displayed as a solid line.
Using this indicator, traders can set their stop-loss levels based on the CE line, while also using the ZLSMA line to identify potential entry and exit points. The combination of these two indicators can help traders reduce their risk and improve their trading performance.
In conclusion, the Chandelier Exit with ZLSMA is a powerful trading indicator that combines two effective technical analysis tools. By using this indicator, traders can identify trend changes, set stop-loss levels, and make more informed trading decisions. Try it out for yourself and see how it can improve your trading performance.
Warning: The results in the backtest are from a repainting strategy. Don't take them seriously. You need to do a dry live test in order to test it for its useability.
-
Here is a description of each input field in the provided source code:
length: An integer input used as the period for the ATR (Average True Range) calculation. Default value is 1.
mult: A float input used as a multiplier for the ATR value. Default value is 2.
showLabels: A boolean input that determines whether to display buy/sell labels on the chart. Default value is false.
isSignalLabelEnabled: A boolean input that determines whether to display signal labels on the chart. Default value is true.
useClose: A boolean input that determines whether to use the close price for extrema calculations. Default value is true.
zcolorchange: A boolean input that determines whether to enable rising/decreasing highlighting for the ZLSMA (Zero-Lag Exponential Moving Average) line. Default value is false.
zlsmaLength: An integer input used as the length for the ZLSMA calculation. Default value is 50.
offset: An integer input used as an offset for the ZLSMA calculation. Default value is 0.
-
Ty for checking this out and good luck on your trading journey! Likes and comments are appreciated. 👍
--
Credits to:
▪ @everget – Chandelier Exit (CE)
▪ @netweaver2022 – ZLSMA

[MiV] Trading SessionHello, everyone!
Today I want to present my new script, which I hope will help not only me!
I'm sure that many people, like me, went through such a stage as "building their strategy". This is when you sit and test on the history how you would enter or exit a trade.
Recently I was doing the same thing and realized that my "tests" involve night time, when in reality I would be asleep and not trading! So I decided to create an indicator that would display my "working hours" so that the backtest I conduct would be as realistic as possible.
Also this indicator is able to display sessions of major exchanges and forex working hours, so it will be useful not only for cryptocurrency lovers.
In addition, we don't always trade every day and, for example, I don't trade on Sunday. That's why we added a feature that "turns off" the day and does not highlight it in color if you're not planning to trade on that day.
And finally, I added a notification of the beginning and end of the trading session. A small thing, but it may also be a useful feature for those who like to sit at the chart!
I will be glad to receive any comments and suggestions!
-----
Всем привет!
Хочу сегодня представить свой новый скрипт, который, надеюсь, поможет не только мне!
Уверен, что многие, как и я, проходили такой этап как "постройка своей стратегии". Это когда ты сидишь и тестируешь на истории то как бы ты входил или выходил из сделки.
Вот недавно я ровно также занимался этим и осознал, что мои "тесты" затрагивают и ночное время, когда в реальности я бы спал и не торговал! Поэтому я решил создать индикатор, который будет отображать мои "рабочие часы", чтобы бектест, который я провожу, был максимально реалистичным.
Также данный индикатор умеет отображать сессии крупных бирж и время работы форекса, так что полезным он будет не только для любителей криптовалюты.
Кроме того, мы же не всегда торгуем каждый день и например я не торгую в воскресенье. Поэтому добавлен функционал, который "выключает" день и не подсвечивает его цветом, если ты в этот день не планируешь торговать.
Ну и в заключении, добавил уведомление о начале и завершении торговой сессии. Мелочь, а тоже может быть полезной фичей для тех кто любит засесть за графиком!
Буду рад любым замечаниям и предложениям!

Divergence Backtester - V2Further attempts to study divergence impact on price in shorter terms.
Previous study can be found here:
In this script, we are trying to gather the stats based on last two pivot state together. For example, Individual table of Pivot High Projection is as explained below:
But, by looking at the bigger picture, we can further estimate following things regarding the current unconfirmed pivot and the new pivot which is yet to be formed.

Acrypto - Weighted StrategyHello traders!
I have been developing a fully customizable algo over the last year. The algorithm is based on a set of different strategies, each with its own weight (weighted strategy). The set of strategies that I currently use are 5:
MACD
Stochastic RSI
RSI
Supertrend
MA crossover
Moreover, the algo includes STOP losses criteria and a taking profit strategy. The algo must be optimized for the desired asset to achieves its full potential. The 1H and 4H dataframe give good results. The algo has been tested for several asset (same dataframe, different optimization values).
Important note:
Backtest the algorithm with different data stamps to avoid overfitting results
Best,
Alberto

Zendog V3 backtest DCA bot 3commasMAJOR UPDATE:
- Update to Pinescript v5
- MAJOR refactor for the logic of how orders are placed. BO order is placed when the condition is first encountered and we are not in a deal.
The extra SO orders (if based on price movement) are all placed on the next candle after BO order, instead of each being placed one after another.
Take profit (if percentage) and Stop loss are placed on the first candle after BO order because if BO and TP are on the same candle TV does not execute properly.
These changes should improve strategy accuracy when multiple prices are hit by the same candle.
- NEW FEATURE: Support to Stop deal using an external indicator (i.e. stop long deal when RSI > 80)
- NEW FEATURE: Support to trigger Safety orders using an external indicator (i.e. trigger each additional SO when RSI < 10, regardless of price movement)
The price movement logic may be implemented in the indicator that plots start / end signals. The SO size is calculated using the configuration of steps.
- NEW FEATURE: Safety order command for 3commas bot. This is implemented using Add funds in the quote currency (for pair BTCUSDT the quote currency is USDT)
The SO size is calculated using the configuration of steps, for exact order size (and price) use the built-in Steps table.
- NEW FEATURE: Addition of extra columns to the steps table: Required price for TP, Required % change for TP, Required % change for BEP (Breakeven point)
- Update to steps table to remove prices when Safety orders are not based on % price change
- The code is opensource. I will not be able to sustain merges for the script, but feel free to use and develop your own version and ping me on discord to review them
and maybe include in the original script

Combo Backtest 123 Reversal & TEMA1This is combo strategies for get a cumulative signal.
First strategy
This System was created from the Book "How I Tripled My Money In The
Futures Market" by Ulf Jensen, Page 183. This is reverse type of strategies.
The strategy buys at market, if close price is higher than the previous close
during 2 days and the meaning of 9-days Stochastic Slow Oscillator is lower than 50.
The strategy sells at market, if close price is lower than the previous close price
during 2 days and the meaning of 9-days Stochastic Fast Oscillator is higher than 50.
Second strategy
This study plots the TEMA1 indicator. TEMA1 ia s triple MA (Moving Average),
and is calculated as 3*MA - (3*MA(MA)) + (MA(MA(MA)))
WARNING:
- For purpose educate only
- This script to change bars colors.
Combo Backtest 123 Reversal & T3 Averages This is combo strategies for get a cumulative signal.
First strategy
This System was created from the Book "How I Tripled My Money In The
Futures Market" by Ulf Jensen, Page 183. This is reverse type of strategies.
The strategy buys at market, if close price is higher than the previous close
during 2 days and the meaning of 9-days Stochastic Slow Oscillator is lower than 50.
The strategy sells at market, if close price is lower than the previous close price
during 2 days and the meaning of 9-days Stochastic Fast Oscillator is higher than 50.
Second strategy
This indicator plots the moving average described in the January, 1998 issue
of S&C, p.57, "Smoothing Techniques for More Accurate Signals", by Tim Tillson.
This indicator plots T3 moving average presented in Figure 4 in the article.
T3 indicator is a moving average which is calculated according to formula:
T3(n) = GD(GD(GD(n))),
where GD - generalized DEMA (Double EMA) and calculating according to this:
GD(n,v) = EMA(n) * (1+v)-EMA(EMA(n)) * v,
where "v" is volume factor, which determines how hot the moving average’s response
to linear trends will be. The author advises to use v=0.7.
When v = 0, GD = EMA, and when v = 1, GD = DEMA. In between, GD is a less aggressive
version of DEMA. By using a value for v less than1, trader cure the multiple DEMA
overshoot problem but at the cost of accepting some additional phase delay.
In filter theory terminology, T3 is a six-pole nonlinear Kalman filter. Kalman
filters are ones that use the error — in this case, (time series - EMA(n)) —
to correct themselves. In the realm of technical analysis, these are called adaptive
moving averages; they track the time series more aggres-sively when it is making large
moves. Tim Tillson is a software project manager at Hewlett-Packard, with degrees in
mathematics and computer science. He has privately traded options and equities for 15 years.
WARNING:
- For purpose educate only
- This script to change bars colors.
Combo Backtest 123 Reversal & Stochastic Crossover This is combo strategies for get a cumulative signal.
First strategy
This System was created from the Book "How I Tripled My Money In The
Futures Market" by Ulf Jensen, Page 183. This is reverse type of strategies.
The strategy buys at market, if close price is higher than the previous close
during 2 days and the meaning of 9-days Stochastic Slow Oscillator is lower than 50.
The strategy sells at market, if close price is lower than the previous close price
during 2 days and the meaning of 9-days Stochastic Fast Oscillator is higher than 50.
Second strategy
This back testing strategy generates a long trade at the Open of the following
bar when the %K line crosses below the %D line and both are above the Overbought level.
It generates a short trade at the Open of the following bar when the %K line
crosses above the %D line and both values are below the Oversold level.
WARNING:
- For purpose educate only
- This script to change bars colors.

Pump blaster based on Pump FinderThis is based on a video I watched while searching for good indicators to use for scanning pumps across the crypto market.
You can probably find the video by searching for "Pump Finder On 15 Minute Chart With Best Trading Indicators".
The approach presented uses LSMA and BB B% to detect pumps.
Results:
It does detect many pumps, it also detects many dumps...
I'm not very impressed after this first attempt but might give it another try if I come up with maybe something I'm doing wrong while trying to automate in a script the original strategy from the video.
Instructions:
This indicator is compatible with the backtest script we use.
It plots 1 for buy and 2 for sell. The rest of the plots are for debugging the strategy and can be ignored.
It's meant to be used on 15mins tf
