AI Adaptive Oscillator [PhenLabs]📊 Algorithmic Adaptive Oscillator
Version: PineScript™ v6
📌 Description
The AI Adaptive Oscillator is a sophisticated technical indicator that employs ensemble learning and adaptive weighting techniques to analyze market conditions. This innovative oscillator combines multiple traditional technical indicators through an AI-driven approach that continuously evaluates and adjusts component weights based on historical performance. By integrating statistical modeling with machine learning principles, the indicator adapts to changing market dynamics, providing traders with a responsive and reliable tool for market analysis.
🚀 Points of Innovation:
Ensemble learning framework with adaptive component weighting
Performance-based scoring system using directional accuracy
Dynamic volatility-adjusted smoothing mechanism
Intelligent signal filtering with cooldown and magnitude requirements
Signal confidence levels based on multi-factor analysis
🔧 Core Components
Ensemble Framework : Combines up to five technical indicators with performance-weighted integration
Adaptive Weighting : Continuous performance evaluation with automated weight adjustment
Volatility-Based Smoothing : Adapts sensitivity based on current market volatility
Pattern Recognition : Identifies potential reversal patterns with signal qualification criteria
Dynamic Visualization : Professional color schemes with gradient intensity representation
Signal Confidence : Three-tiered confidence assessment for trading signals
🔥 Key Features
The indicator provides comprehensive market analysis through:
Multi-Component Ensemble : Integrates RSI, CCI, Stochastic, MACD, and Volume-weighted momentum
Performance Scoring : Evaluates each component based on directional prediction accuracy
Adaptive Smoothing : Automatically adjusts based on market volatility
Pattern Detection : Identifies potential reversal patterns in overbought/oversold conditions
Signal Filtering : Prevents excessive signals through cooldown periods and minimum change requirements
Confidence Assessment : Displays signal strength through intuitive confidence indicators (average, above average, excellent)
🎨 Visualization
Gradient-Filled Oscillator : Color intensity reflects strength of market movement
Clear Signal Markers : Distinct bullish and bearish pattern signals with confidence indicators
Range Visualization : Clean representation of oscillator values from -6 to 6
Zero Line : Clear demarcation between bullish and bearish territory
Customizable Colors : Color schemes that can be adjusted to match your chart style
Confidence Symbols : Intuitive display of signal confidence (no symbol, +, or ++) alongside direction markers
📖 Usage Guidelines
⚙️ Settings Guide
Color Settings
Bullish Color
Default: #2b62fa (Blue)
This setting controls the color representation for bullish movements in the oscillator. The color appears when the oscillator value is positive (above zero), with intensity indicating the strength of the bullish momentum. A brighter shade indicates stronger bullish pressure.
Bearish Color
Default: #ce9851 (Amber)
This setting determines the color representation for bearish movements in the oscillator. The color appears when the oscillator value is negative (below zero), with intensity reflecting the strength of the bearish momentum. A more saturated shade indicates stronger bearish pressure.
Signal Settings
Signal Cooldown (bars)
Default: 10
Range: 1-50
This parameter sets the minimum number of bars that must pass before a new signal of the same type can be generated. Higher values reduce signal frequency and help prevent overtrading during choppy market conditions. Lower values increase signal sensitivity but may generate more false positives.
Min Change For New Signal
Default: 1.5
Range: 0.5-3.0
This setting defines the minimum required change in oscillator value between consecutive signals of the same type. It ensures that new signals represent meaningful changes in market conditions rather than minor fluctuations. Higher values produce fewer but potentially higher-quality signals, while lower values increase signal frequency.
AI Core Settings
Base Length
Default: 14
Minimum: 2
This fundamental setting determines the primary calculation period for all technical components in the ensemble (RSI, CCI, Stochastic, etc.). It represents the lookback window for each component’s base calculation. Shorter periods create a more responsive but potentially noisier oscillator, while longer periods produce smoother signals with potential lag.
Adaptive Speed
Default: 0.1
Range: 0.01-0.3
Controls how quickly the oscillator adapts to new market conditions through its volatility-adjusted smoothing mechanism. Higher values make the oscillator more responsive to recent price action but potentially more erratic. Lower values create smoother transitions but may lag during rapid market changes. This parameter directly influences the indicator’s adaptiveness to market volatility.
Learning Lookback Period
Default: 150
Minimum: 10
Determines the historical data range used to evaluate each ensemble component’s performance and calculate adaptive weights. This setting controls how far back the AI “learns” from past performance to optimize current signals. Longer periods provide more stable weight distribution but may be slower to adapt to regime changes. Shorter periods adapt more quickly but may overreact to recent anomalies.
Ensemble Size
Default: 5
Range: 2-5
Specifies how many technical components to include in the ensemble calculation.
Understanding The Interaction Between Settings
Base Length and Learning Lookback : The base length determines the reactivity of individual components, while the lookback period determines how their weights are adjusted. These should be balanced according to your timeframe - shorter timeframes benefit from shorter base lengths, while the lookback should generally be 10-15 times the base length for optimal learning.
Adaptive Speed and Signal Cooldown : These settings control sensitivity from different angles. Increasing adaptive speed makes the oscillator more responsive, while reducing signal cooldown increases signal frequency. For conservative trading, keep adaptive speed low and cooldown high; for aggressive trading, do the opposite.
Ensemble Size and Min Change : Larger ensembles provide more stable signals, allowing for a lower minimum change threshold. Smaller ensembles might benefit from a higher threshold to filter out noise.
Understanding Signal Confidence Levels
The indicator provides three distinct confidence levels for both bullish and bearish signals:
Average Confidence (▲ or ▼) : Basic signal that meets the minimum pattern and filtering criteria. These signals indicate potential reversals but with moderate confidence in the prediction. Consider using these as initial alerts that may require additional confirmation.
Above Average Confidence (▲+ or ▼+) : Higher reliability signal with stronger underlying metrics. These signals demonstrate greater consensus among the ensemble components and/or stronger historical performance. They offer increased probability of successful reversals and can be traded with less additional confirmation.
Excellent Confidence (▲++ or ▼++) : Highest quality signals with exceptional underlying metrics. These signals show strong agreement across oscillator components, excellent historical performance, and optimal signal strength. These represent the indicator’s highest conviction trade opportunities and can be prioritized in your trading decisions.
Confidence assessment is calculated through a multi-factor analysis including:
Historical performance of ensemble components
Degree of agreement between different oscillator components
Relative strength of the signal compared to historical thresholds
✅ Best Use Cases:
Identify potential market reversals through oscillator extremes
Filter trade signals based on AI-evaluated component weights
Monitor changing market conditions through oscillator direction and intensity
Confirm trade signals from other indicators with adaptive ensemble validation
Detect early momentum shifts through pattern recognition
Prioritize trading opportunities based on signal confidence levels
Adjust position sizing according to signal confidence (larger for ++ signals, smaller for standard signals)
⚠️ Limitations
Requires sufficient historical data for accurate performance scoring
Ensemble weights may lag during dramatic market condition changes
Higher ensemble sizes require more computational resources
Performance evaluation quality depends on the learning lookback period length
Even high confidence signals should be considered within broader market context
💡 What Makes This Unique
Adaptive Intelligence : Continuously adjusts component weights based on actual performance
Ensemble Methodology : Combines strength of multiple indicators while minimizing individual weaknesses
Volatility-Adjusted Smoothing : Provides appropriate sensitivity across different market conditions
Performance-Based Learning : Utilizes historical accuracy to improve future predictions
Intelligent Signal Filtering : Reduces noise and false signals through sophisticated filtering criteria
Multi-Level Confidence Assessment : Delivers nuanced signal quality information for optimized trading decisions
🔬 How It Works
The indicator processes market data through five main components:
Ensemble Component Calculation :
Normalizes traditional indicators to consistent scale
Includes RSI, CCI, Stochastic, MACD, and volume components
Adapts based on the selected ensemble size
Performance Evaluation :
Analyzes directional accuracy of each component
Calculates continuous performance scores
Determines adaptive component weights
Oscillator Integration :
Combines weighted components into unified oscillator
Applies volatility-based adaptive smoothing
Scales final values to -6 to 6 range
Signal Generation :
Detects potential reversal patterns
Applies cooldown and magnitude filters
Generates clear visual markers for qualified signals
Confidence Assessment :
Evaluates component agreement, historical accuracy, and signal strength
Classifies signals into three confidence tiers (average, above average, excellent)
Displays intuitive confidence indicators (no symbol, +, ++) alongside direction markers
💡 Note:
The AI Adaptive Oscillator performs optimally when used with appropriate timeframe selection and complementary indicators. Its adaptive nature makes it particularly valuable during changing market conditions, where traditional fixed-weight indicators often lose effectiveness. The ensemble approach provides a more robust analysis by leveraging the collective intelligence of multiple technical methodologies. Pay special attention to the signal confidence indicators to optimize your trading decisions - excellent (++) signals often represent the most reliable trade opportunities.
"a股近10年第二天溢价的股票" için komut dosyalarını ara

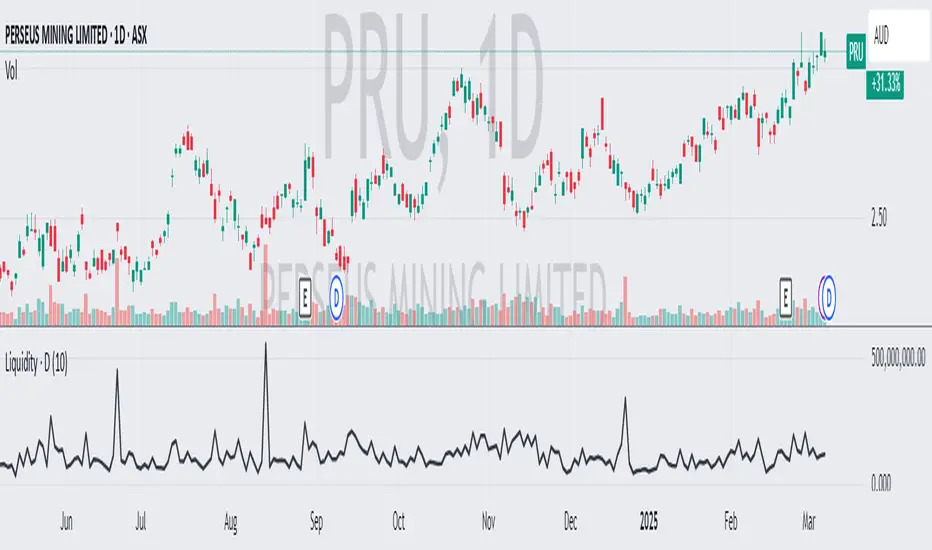
Average Daily LiquidityIt is important to ensure sufficient stock trading liquidity so that you have sufficient volume to enter the trade and most importantly sufficient liquidity to exit the trade. Because daily trading liquidity can jump around so much by price changes and volume changes, it is important to smooth out the liquidity by using a moving average. Some use a 5 days (trading week) moving average, others use 10 day (2 weeks), 20 day ("month") and some use 65 day (quarter). The default is 10 days based upon the work of Colin Nicholson (The Aggressive Investor and Building Wealth in the Stock Market). Liquidity line changes color dependent upon the chart background luminescence. The amount you are planning to invest in a stock should have a liquidity of 10 (default) times that amount.
EMA 5 Alert Candle ShortThe 5 EMA (Exponential Moving Average) Strategy is a simple yet effective trading strategy that helps traders identify short-term trends and potential entry and exit points. This strategy is widely used in intraday and swing trading, particularly in forex, stocks, and crypto markets.
Components of the 5 EMA Strategy
5 EMA: A fast-moving average that reacts quickly to price movements.
15-minute or 1-hour timeframe (commonly used, but adaptable to other timeframes).
Candlestick Patterns: To confirm entry signals.
How the 5 EMA Strategy Works
Buy (Long) Setup:
Price Above the 5 EMA: The price should be trading above the 5 EMA.
Pullback to the 5 EMA: A minor retracement or consolidation near the 5 EMA.
Bullish Candlestick Confirmation: A bullish candle (e.g., engulfing or pin bar) forms near the 5 EMA.
Entry: Enter a long trade at the close of the bullish candle.
Stop Loss: Place below the recent swing low or 5-10 pips below the 5 EMA.
Take Profit: Aim for a risk-reward ratio of at least 1:2 or trail the stop using a higher EMA (e.g., 10 or 20 EMA).
Sell (Short) Setup:
Price Below the 5 EMA: The price should be trading below the 5 EMA.
Pullback to the 5 EMA: A small retracement towards the 5 EMA.
Bearish Candlestick Confirmation: A bearish candle (e.g., engulfing or pin bar) near the 5 EMA.
Entry: Enter a short trade at the close of the bearish candle.
Stop Loss: Place above the recent swing high or 5-10 pips above the 5 EMA.
Take Profit: Aim for a 1:2 risk-reward ratio or use a trailing stop.
Additional Filters for Better Accuracy
Higher Timeframe Confirmation: Check the trend on a higher timeframe (e.g., 1-hour or 4-hour).
Volume Confirmation: Enter trades when volume is increasing.
Avoid Sideways Market: Use the strategy only when the market is trending.
Advantages of the 5 EMA Strategy
✔️ Simple and easy to use.
✔️ Works well in trending markets.
✔️ Helps traders capture short-term momentum.
Disadvantages
❌ Less effective in choppy or sideways markets.
❌ Requires discipline in following stop-loss rules.

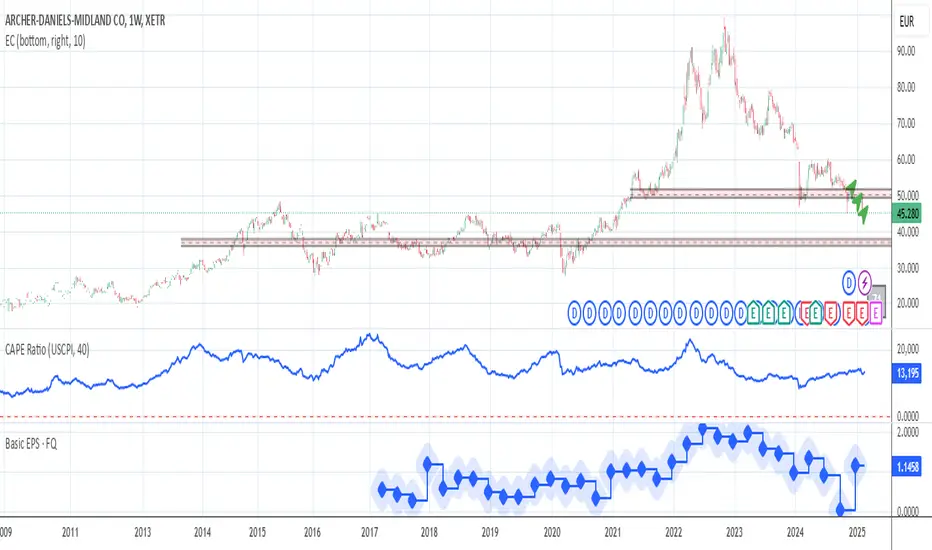
CAPE / Shiller PE Ratio - cristianhkrThe Cyclically Adjusted Price-to-Earnings Ratio (CAPE Ratio), also known as the Shiller P/E Ratio, is a long-term valuation measure for stocks. It was developed by Robert Shiller and smooths out earnings fluctuations by using an inflation-adjusted average of the last 10 years of earnings.
This TradingView Pine Script indicator calculates the CAPE Ratio for a specific stock by:
Fetching historical Earnings Per Share (EPS) data using request.earnings().
Adjusting the EPS for inflation by dividing it by the Consumer Price Index (CPI).
Computing the 10-year (40-quarter) moving average of the inflation-adjusted EPS.
Calculating the CAPE Ratio as (Stock Price) / (10-year Average EPS adjusted for inflation).
Plotting the CAPE Ratio on the chart with a reference line at CAPE = 20, a historically significant threshold.
Cryptolabs Global Liquidity Cycle Momentum IndicatorCryptolabs Global Liquidity Cycle Momentum Indicator (LMI-BTC)
This open-source indicator combines global central bank liquidity data with Bitcoin price movements to identify medium- to long-term market cycles and momentum phases. It is designed for traders who want to incorporate macroeconomic factors into their Bitcoin analysis.
How It Works
The script calculates a Liquidity Index using balance sheet data from four central banks (USA: ECONOMICS:USCBBS, Japan: FRED:JPNASSETS, China: ECONOMICS:CNCBBS, EU: FRED:ECBASSETSW), augmented by the Dollar Index (TVC:DXY) and Chinese 10-year bond yields (TVC:CN10Y). This index is:
- Logarithmically scaled (math.log) to better represent large values like central bank balances and Bitcoin prices.
- Normalized over a 50-period range to balance fluctuations between minimum and maximum values.
- Compared to prior-year values, with the number of bars dynamically adjusted based on the timeframe (e.g., 252 for 1D, 52 for 1W), to compute percentage changes.
The liquidity change is analyzed using a Chande Momentum Oscillator (CMO) (period: 24) to measure momentum trends. A Weighted Moving Average (WMA) (period: 10) acts as a signal line. The Bitcoin price is also plotted logarithmically to highlight parallels with liquidity cycles.
Usage
Traders can use the indicator to:
- Identify global liquidity cycles influencing Bitcoin price trends, such as expansive or restrictive monetary policies.
- Detect momentum phases: Values above 50 suggest overbought conditions, below -50 indicate oversold conditions.
- Anticipate trend reversals by observing CMO crossovers with the signal line.
It performs best on higher timeframes like daily (1D) or weekly (1W) charts. The visualization includes:
- CMO line (green > 50, red < -50, blue neutral), signal line (white), Bitcoin price (gray).
- Horizontal lines at 50, 0, and -50 for improved readability.
Originality
This indicator stands out from other momentum tools like RSI or basic price analysis due to:
- Unique Data Integration: Combines four central bank datasets, DXY, and CN10Y as macroeconomic proxies for Bitcoin.
- Dynamic Prior-Year Analysis: Calculates liquidity changes relative to historical values, adjustable by timeframe.
- Logarithmic Normalization: Enhances visibility of extreme values, critical for cryptocurrencies and macro data.
This combination offers a rare perspective on the interplay between global liquidity and Bitcoin, unavailable in other open-source scripts.
Settings
- CMO Period: Default 24, adjustable for faster/slower signals.
- Signal WMA: Default 10, for smoothing the CMO line.
- Normalization Window: Default 50 periods, customizable.
Users can modify these parameters in the Pine Editor to tailor the indicator to their strategy.
Note
This script is designed for medium- to long-term analysis, not scalping. For optimal results, combine it with additional analyses (e.g., on-chain data, support/resistance levels). It does not guarantee profits but supports informed decisions based on macroeconomic trends.
Data Sources
- Bitcoin: INDEX:BTCUSD
- Liquidity: ECONOMICS:USCBBS, FRED:JPNASSETS, ECONOMICS:CNCBBS, FRED:ECBASSETSW
- Additional: TVC:DXY, TVC:CN10Y

Auto-Length Moving Average + Trend Signals (Zeiierman)█ Overview
The Auto-Length Moving Average + Trend Signals (Zeiierman) is an easy-to-use indicator designed to help traders dynamically adjust their moving average length based on market conditions. This tool adapts in real-time, expanding and contracting the moving average based on trend strength and momentum shifts.
The indicator smooths out price fluctuations by modifying its length while ensuring responsiveness to new trends. In addition to its adaptive length algorithm, it incorporates trend confirmation signals, helping traders identify potential trend reversals and continuations with greater confidence.
This indicator suits scalpers, swing traders, and trend-following investors who want a self-adjusting moving average that adapts to volatility, momentum, and price action dynamics.
█ How It Works
⚪ Dynamic Moving Average Length
The core feature of this indicator is its ability to automatically adjust the length of the moving average based on trend persistence and market conditions:
Expands in strong trends to reduce noise.
Contracts in choppy or reversing markets for faster reaction.
This allows for a more accurate moving average that aligns with current price dynamics.
⚪ Trend Confirmation & Signals
The indicator includes built-in trend detection logic, classifying trends based on market structure. It evaluates trend strength based on consecutive bars and smooths out transitions between bullish, bearish, and neutral conditions.
Uptrend: Price is persistently above the adjusted moving average.
Downtrend: Price remains below the adjusted moving average.
Neutral: Price fluctuates around the moving average, indicating possible consolidation.
⚪ Adaptive Trend Smoothing
A smoothing factor is applied to enhance trend readability while minimizing excessive lag. This balances reactivity with stability, making it easier to follow longer-term trends while avoiding false signals.
█ How to Use
⚪ Trend Identification
Bullish Trend: The indicator confirms an uptrend when the price consistently stays above the dynamically adjusted moving average.
Bearish Trend: A downtrend is recognized when the price remains below the moving average.
⚪ Trade Entry & Exit
Enter long when the dynamic moving average is green and a trend signal occurs. Exit when the price crosses below the dynamic moving average.
Enter short when the dynamic moving average is red and a trend signal occurs. Exit when the price crosses above the dynamic moving average.
█ Slope-Based Reset
This mode resets the trend counter when the moving average slope changes direction.
⚪ Interpretation & Insights
Best for trend-following traders who want to filter out noise and only reset when a clear shift in momentum occurs.
Higher slope length (N): More stable trends, fewer resets.
Lower slope length (N): More reactive to small price swings, frequent resets.
Useful in swing trading to track significant trend reversals.
█ RSI-Based Reset
The counter resets when the Relative Strength Index (RSI) crosses predefined overbought or oversold levels.
⚪ Interpretation & Insights
Best for reversal traders who look for extreme overbought/oversold conditions.
High RSI threshold (e.g., 80/20): Fewer resets, only extreme conditions trigger adjustments.
Lower RSI threshold (e.g., 60/40): More frequent resets, detecting smaller corrections.
Great for detecting exhaustion in trends before potential reversals.
█ Volume-Based Reset
A reset occurs when current volume significantly exceeds its moving average, signaling a shift in market participation.
⚪ Interpretation & Insights
Best for traders who follow institutional activity (high volume often means large players are active).
Higher volume SMA length: More stable trends, only resets on massive volume spikes.
Lower volume SMA length: More reactive to short-term volume shifts.
Useful in identifying breakout conditions and trend acceleration points.
█ Bollinger Band-Based Reset
A reset occurs when price closes above the upper Bollinger Band or below the lower Bollinger Band, signaling potential overextension.
⚪ Interpretation & Insights
Best for traders looking for volatility-based trend shifts.
Higher Bollinger Band multiplier (k = 2.5+): Captures only major price extremes.
Lower Bollinger Band multiplier (k = 1.5): Resets on moderate volatility changes.
Useful for detecting overextensions in strong trends before potential retracements.
█ MACD-Based Reset
A reset occurs when the MACD line crosses the signal line, indicating a momentum shift.
⚪ Interpretation & Insights
Best for momentum traders looking for trend continuation vs. exhaustion signals.
Longer MACD lengths (260, 120, 90): Captures major trend shifts.
Shorter MACD lengths (10, 5, 3): Reacts quickly to momentum changes.
Useful for detecting strong divergences and market shifts.
█ Stochastic-Based Reset
A reset occurs when Stochastic %K crosses overbought or oversold levels.
⚪ Interpretation & Insights
Best for short-term traders looking for fast momentum shifts.
Longer Stochastic length: Filters out false signals.
Shorter Stochastic length: Captures quick intraday shifts.
█ CCI-Based Reset
A reset occurs when the Commodity Channel Index (CCI) crosses predefined overbought or oversold levels. The CCI measures the price deviation from its statistical mean, making it a useful tool for detecting overextensions in price action.
⚪ Interpretation & Insights
Best for cycle traders who aim to identify overextended price deviations in trending or ranging markets.
Higher CCI threshold (e.g., ±200): Detects extreme overbought/oversold conditions before reversals.
Lower CCI threshold (e.g., ±10): More sensitive to trend shifts, useful for early signal detection.
Ideal for detecting momentum shifts before price reverts to its mean or continues trending strongly.
█ Momentum-Based Reset
A reset occurs when Momentum (Rate of Change) crosses zero, indicating a potential shift in price direction.
⚪ Interpretation & Insights
Best for trend-following traders who want to track acceleration vs. deceleration.
Higher momentum length: Captures longer-term shifts.
Lower momentum length: More responsive to short-term trend changes.
█ How to Interpret the Trend Strength Table
The Trend Strength Table provides valuable insights into the current market conditions by tracking how the dynamic moving average is adjusting based on trend persistence. Each metric in the table plays a role in understanding the strength, longevity, and stability of a trend.
⚪ Counter Value
Represents the current length of trend persistence before a reset occurs.
The higher the counter, the longer the current trend has been in place without resetting.
When this value reaches the Counter Break Threshold, the moving average resets and contracts to become more reactive.
Example:
A low counter value (e.g., 10) suggests a recent trend reset, meaning the market might be changing directions frequently.
A high counter value (e.g., 495) means the trend has been ongoing for a long time, indicating strong trend persistence.
⚪ Trend Strength
Measures how strong the current trend is based on the trend confirmation logic.
Higher values indicate stronger trends, while lower values suggest weaker trends or consolidations.
This value is dynamic and updates based on price action.
Example:
Trend Strength of 760 → Indicates a high-confidence trend.
Trend Strength of 50 → Suggests weak price action, possibly a choppy market.
⚪ Highest Trend Score
Tracks the strongest trend score recorded during the session.
Helps traders identify the most dominant trend observed in the timeframe.
This metric is useful for analyzing historical trend strength and comparing it with current conditions.
Example:
Highest Trend Score = 760 → Suggests that at some point, there was a strong trend in play.
If the current trend strength is much lower than this value, it could indicate trend exhaustion.
⚪ Average Trend Score
This is a rolling average of trend strength across the session.
Provides a bigger picture of how the trend strength fluctuates over time.
If the average trend score is high, the market has had persistent trends.
If it's low, the market may have been choppy or sideways.
Example:
Average Trend Score of 147 vs. Current Trend Strength of 760 → Indicates that the current trend is significantly stronger than the historical average, meaning a breakout might be occurring.
Average Trend Score of 700+ → Suggests a strong trending market overall.
█ Settings
⚪ Dynamic MA Controls
Base MA Length – Sets the starting length of the moving average before dynamic adjustments.
Max Dynamic Length – Defines the upper limit for how much the moving average can expand.
Trend Confirmation Length – The number of bars required to validate an uptrend or downtrend.
⚪ Reset & Adaptive Conditions
Reset Condition Type – Choose what triggers the moving average reset (Slope, RSI, Volume, MACD, etc.).
Trend Smoothing Factor – Adjusts how smoothly the moving average responds to price changes.
-----------------
Disclaimer
The content provided in my scripts, indicators, ideas, algorithms, and systems is for educational and informational purposes only. It does not constitute financial advice, investment recommendations, or a solicitation to buy or sell any financial instruments. I will not accept liability for any loss or damage, including without limitation any loss of profit, which may arise directly or indirectly from the use of or reliance on such information.
All investments involve risk, and the past performance of a security, industry, sector, market, financial product, trading strategy, backtest, or individual's trading does not guarantee future results or returns. Investors are fully responsible for any investment decisions they make. Such decisions should be based solely on an evaluation of their financial circumstances, investment objectives, risk tolerance, and liquidity needs.

Custom Support LineIt is made with the following conditions in mind.
1. At the center of the candle at the moment,
Out of the last 10 candles, the low price (L) is within 3% of each other, drawing one line at the low prices of the candles.
2. Out of the last 10 candles, the market price (O) is within 3% of each other, drawing one line at the low end of each candle.
3.Out of the last 10 candles, the closing price (C) is within 3% of each other, and one line is drawn at the lower prices of the candles.
4. Draw one line when the three lines match the above three conditions.
We wanted to create a clear support line according to the above conditions.

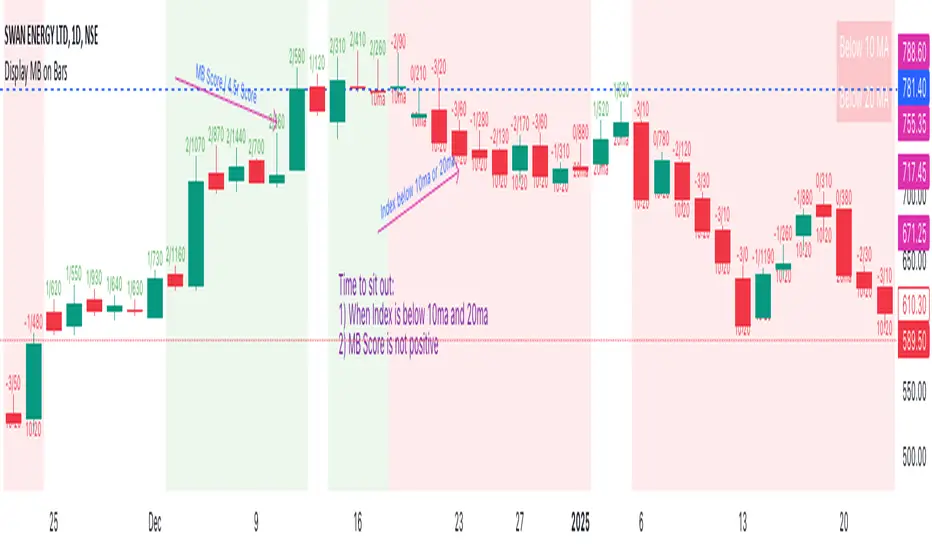
Display MB on BarsDescription
The "Display MB on Bars" Pine Script indicator is designed to visually represent Market Breadth values and R4.5 scores on trading charts. This script enables traders to highlight and analyze key market behavior using pre-defined thresholds for MB scores and dynamically calculated R4.5 values. Additionally, it includes a moving average status table to assess price levels relative to the 10-day and 20-day moving averages.
Features:
1. COB Date Matching: Displays data corresponding to specific "COB dates" provided by the user.
2. MB Value Visualization:
o Highlights bars with a background color based on MB values:
Red if MB ≤ MB_Red (default: -1).
Green if MB ≥ MB_Green (default: 3).
3. R4.5 Scores Display:
o Creates a label on the chart with the MB and R4.5 values when conditions are met (e.g., R4.5 > 200 or specific MB thresholds).
4. Index Moving Average Comparison:
o Calculates 10-day and 20-day moving averages for the selected symbol (default: NSE:NIFTYMIDSML400).
o Shows the price position relative to these moving averages in a table.
How to Use:
1. Configure Inputs:
o COB Dates: Enter a comma-separated list of dates in the format DD-MM-YYYY.
o MB Values: Provide the corresponding MB scores for the COB dates.
o R4.5 Values: Provide the R4.5 scores for the COB dates.
o Set the thresholds for MB values (MB Red<= and MB Green>=).
o Toggle features like MB, RS (R4.5), and the moving average status table.
2. Interpret the Output:
o Observe background colors on the bars:
Red: Indicates MB is less than or equal to the lower threshold.
Green: Indicates MB exceeds the upper threshold.
o Check labels above bars for R4.5 and MB values when conditions are met.
o Refer to the status table on the top-right corner to understand price positions relative to 10-day and 20-day moving averages.
This script is especially useful for traders seeking insights into custom metrics like MB and R4.5, enabling quick identification of key patterns and trends in the market.
Dynamic Market Structure DetectorTitle: Dynamic Market Structure Detector – Real-Time BoS & ChoCH Signals
Short Description:
Identify market structure dynamically with real-time Break of Structure (BoS) and Change of Character (ChoCH) signals. Highlight untested support and resistance zones to improve trading precision.
Full Description:
The Dynamic Market Structure Detector is a powerful TradingView indicator designed for traders who want to automate the identification of key market structure levels. This indicator simplifies market analysis by dynamically tracking swing highs and lows, marking critical Break of Structure (BoS) and Change of Character (ChoCH) points, and highlighting untested support and resistance zones.
Key Features:
1. Real-Time Signals:
• Marks Break of Structure (BoS) and Change of Character (ChoCH) points as they occur.
• Automatically updates as the market evolves.
2. Dynamic Swing Highs and Lows:
• Tracks swing highs and lows based on user-defined sensitivity (Swing Length).
• Adjust swing length to tailor signals for intraday or swing trading.
3. Untested Zones Highlight:
• Visualize untested support and resistance zones dynamically.
• Opacity settings allow customization for better chart readability.
4. Customizable Inputs:
• Swing Length:
Adjust the sensitivity of BoS and ChoCH signals.
• Smaller Swing Length values (e.g., 3–5): Capture short-term market movements, ideal for intraday trading.
• Larger Swing Length values (e.g., 10–20): Focus on significant market structure changes for swing or positional trading.
Experiment with these values to find the best fit for your trading style.
• Untested Zone Opacity:
Control the visibility of highlighted support and resistance zones.
• Lower opacity values (e.g., 10–50): Make the zones more prominent, helpful for darker chart backgrounds.
• Higher opacity values (e.g., 70–90): Provide subtle highlights, better suited for lighter chart setups.
• A value of 100% renders the zones completely transparent (invisible).
Use this setting to customize the visual appearance of your chart while still retaining key zone information.
5. User-Friendly Visualization:
• Color-coded labels for BoS (Green) and ChoCH (Red).
• Highlight zones for untested areas using customizable colors (Support: Blue, Resistance: Orange).
Why Use This Indicator?
• Simplifies market structure analysis by automating key calculations.
• Helps traders identify potential trend reversals and continuation points.
• Reduces the need for manual charting, saving time and effort.
• Provides visual clarity on untested zones for better decision-making.
Recommended Usage:
• Intraday Traders: Use smaller Swing Length values (e.g., 3–5) to capture short-term market movements.
• Swing Traders: Opt for higher Swing Length values (e.g., 10–20) to focus on larger market structure changes.
• Monitor untested zones for potential price reactions, enhancing your trade entries and exits.
Notes :
This indicator is best suited for traders who prefer price action trading and market structure analysis. While the indicator provides reliable insights, it is recommended to use it in conjunction with other analysis tools for a holistic trading approach.
Credits:
Developed by TradeTech Analysis to empower traders with automated tools for smarter trading decisions.

Breakout Detection using EMAs and Mansfield Relative StrengthThis script identifies breakout opportunities based on a combination of price action, volume, and relative strength. It is designed for daily timeframe charts and helps traders pinpoint strong bullish setups with the following criteria:
Price Action: Stock price is above both the 10-day EMA and 5-week EMA.
EMA Trends: The 10-day EMA is above the 20-day EMA, and the 5-week EMA is above the 10-week EMA, confirming bullish momentum.
Customizable Parameters: Customize the index for the Mansfield Relative Strength, the volume multiplier, and the price breakout look-back period.
Price Breakout: The price is at a 3-month high, indicating strength.
Volume Breakout: A volume spike occurs, surpassing the 20-day average volume by a user-defined multiplier.
Features:
Generates clear breakout signals with a green triangle below the bar.
Integrated Mansfield Relative Strength for relative performance analysis.
Alerts for when all conditions are met, ensuring you never miss an opportunity.
How to Use:
Add this script to a daily chart of your chosen stock.
Look for green triangle signals indicating a potential breakout.
Adjust the parameters to suit your trading strategy and preferred index for the Mansfield Relative Strength.
This tool is ideal for swing traders looking to combine technical analysis with relative strength metrics for high-conviction bullish setups.

Composite Indicator (CCI + ATR)Composite Indicator (CCI + ATR)
The Composite Indicator (CCI + ATR) combines the Commodity Channel Index (CCI) with the Average True Range (ATR) , providing traders with a dynamic tool for identifying entry and exit points based on momentum and volatility. This indicator is particularly useful for markets like cryptocurrencies, which often exhibit sharp sell-offs and gradual upward trends.
Key Features
Momentum Analysis with CCI: The CCI calculates price momentum by comparing the current price level to its average over a specific period. The indicator generates signals when CCI crosses predefined thresholds.
- Buy Signal: Triggered when CCI crosses above the lower threshold (e.g., -100).
- Sell Signal: Triggered when CCI crosses below the upper threshold (e.g., +100).
Volatility Filtering with ATR: The ATR measures market volatility, ensuring signals occur only during significant price movements.
Separate multipliers for buy and sell signals allow tailored filtering based on market behavior.
Stop Loss Calculation: Dynamic stop loss levels are calculated using the ATR multiplier to adapt to market volatility, offering better risk management.
How It Works
CCI Calculation: The CCI is calculated using the typical price ((High + Low + Close) / 3) and a user-defined length. It detects momentum changes by measuring deviations from the average price.
ATR Calculation: The ATR determines the average price range over a specified period, identifying the market’s volatility. The ATR SMA acts as a baseline to filter signals.
Buy Signal: A buy signal is triggered when:
- CCI crosses above the lower threshold (e.g., -100).
- ATR exceeds its SMA multiplied by the buy multiplier (e.g., 1.0).
Sell Signal: A sell signal is triggered when:
- CCI crosses below the upper threshold (e.g., +100).
- ATR exceeds its SMA multiplied by the sell multiplier (e.g., 0.95).
Stop Loss Integration:
- Long positions: Stop loss = Low – (ATR * ATR Multiplier)
- Short positions: Stop loss = High + (ATR * ATR Multiplier)
Advantages
Combines momentum (CCI) and volatility (ATR) for precise signal generation.
Customizable thresholds and multipliers for different market conditions.
Dynamic stop loss ensures better risk management in volatile markets.
Suggested Parameter Settings
CCI Length: 20 (default). Adjust as follows:
- 10–15: Shorter timeframes (e.g., 5-15 minutes).
- 20: General use for 1-hour timeframes.
- 30–50: Longer timeframes (e.g., 4-hour or daily charts).
CCI Threshold: 100 (default). Adjust as follows:
- 50–75: For more frequent signals in ranging markets.
- 100: Balanced for most trading conditions.
- 150–200: For strong trends to reduce noise.
ATR Length: 14 (default). Adjust as follows:
- 10–14: For assets with moderate volatility.
- 20: For assets with lower volatility.
ATR Buy Multiplier: 1.0 (default). Adjust as follows:
- 0.9–1.0: For gradual uptrends in crypto markets.
- 1.1–1.2: For stronger trend filtering.
ATR Sell Multiplier: 0.95 (default). Adjust as follows:
- 0.8–0.95: For sharp sell-offs.
- 1.0–1.1: For stable downward trends.
ATR Multiplier (Stop Loss): 1.5 (default). Adjust as follows:
- 1.0–1.2: For shorter timeframes or less volatile markets.
- 2.0–2.5: For highly volatile markets like cryptocurrencies.
Example Use Cases
Scalping (5-15 minute charts): Use CCI Length = 10, CCI Threshold = 75, ATR Buy Multiplier = 0.9, ATR Sell Multiplier = 0.8.
Day Trading (1-hour charts): Use CCI Length = 20, CCI Threshold = 100, ATR Buy Multiplier = 1.0, ATR Sell Multiplier = 0.95.
Swing Trading (4-hour or daily charts): Use CCI Length = 30, CCI Threshold = 150, ATR Buy Multiplier = 1.2, ATR Sell Multiplier = 1.0.
Final Thoughts The Composite Indicator (CCI + ATR) is a versatile tool designed to enhance trading decisions by combining momentum analysis with volatility filtering. Whether scalping or swing trading, this indicator provides actionable insights and robust risk management to navigate complex markets effectively.

Dynamic Support and Resistance Pivot Strategy The Dynamic Support and Resistance Pivot Strategy is a flexible and adaptive tool designed to identify short-term support and resistance levels using the concept of price pivots.
### Key Elements of the Strategy
1. Pivot points as support and resistance levels
Pivots are significant turning points on the price chart, often marking local highs and lows where the price has reversed direction. A pivot high occurs when the price forms a local peak, while a pivot low occurs when the price forms a local trough. When a new pivot high is formed, it creates a resistance level. Conversely, when a new pivot low is formed, it creates a support level.
The strategy continuously updates these levels as new pivots are detected, ensuring they remain relevant to the current market conditions. By identifying these price levels, the strategy dynamically adjusts to market conditions, allowing it to adapt to both trending and ranging markets, since it has a long target and can perform reversal operations.
2. Entry Criteria
- Buy (Long): A long position is triggered when the price is near the support level and then crosses it from below to above. This suggests that the price has found support and may start moving upwards.
- Sell (Short): A short position is triggered when the price is near the resistance level and then crosses it from above to below. This indicates that the price may be reversing and moving downward.
3. Support/Resistance distance (%)
- This parameter establishes a percentage range around the identified support and resistance level. For example, if the Support Resistance Distance is 0.4% (default), the closing price must be within a range of 0.4% above support or below the resistance to be considered "close" and trigger a trade.
4. Exit criteria
- Take profit = 27 %
- Stop loss = 10 %
- Reversal if a new entry point is identified in the opposite direction
5. No Repainting
- The Dynamic Support and Resistance Pivot Strategy is not subject to repainting.
6. Position Sizing by Equity and risk management
- This strategy has a default configuration to operate with 35% of the equity. The stop loss is set to 10% from the entry price. This way, the strategy is putting at risk about 10% of 35% of equity, that is, around 3.5% of equity for each trade. The percentage of equity and stop loss can be adjusted by the user according to their risk management.
7. Backtest results
- This strategy was subjected to backtest and operations in replay mode on **1000000MOGUSDT.P**, with the inclusion of transaction fees at 0.12% and slipagge of 5 ticks, and the past results have shown consistent profitability. Past results are no guarantee of future results. The strategy's backtest results may even be due to overfitting with past data.
8. Chart Visualization
- Support and resistance levels are displayed as green (support) and red (resistance) lines.
- Pivot prices are displayed as green (pivot low) and red (pivot high) labels.
In this image above, the Support/Resistance distance (%) parameter was set to 0.8.
9. Default Configuration
Chart Timeframe: 1h
Pivot Lengh: 2
Support/Resistance distance (%): 0.4*
Stop Loss: 10 %
Take Profit: 27 %
* This parameter can alternatively be set to 0.8.
10. Alternative Configuration
Chart Timeframe: 20 min
Pivot Lengh: 4
Support/Resistance distance (%): 0.1
Stop Loss: 10 %
Take Profit: 25 %
BYBIT:1000000MOGUSDT.P

AlphaEdge Crypto Tracker [CHE]AlphaEdge Crypto Tracker
Efficiently Identify Top Performers and Underperformers Among 40 Crypto Assets at a Glance
In the fast-paced world of cryptocurrency trading, staying ahead requires the ability to quickly assess the performance of multiple assets simultaneously. AlphaEdge Crypto Tracker is an advanced Pine Script™ indicator designed for TradingView that empowers traders to effortlessly monitor and evaluate 40 different crypto assets in real-time.
This tool is my Christmas gift to all traders. I wish you all a Merry Christmas and successful trades in the coming year!
Why It’s Important to Identify Winners and Losers Among 40 Assets at a Glance:
1. Time Efficiency: Managing a diverse portfolio can be overwhelming. With AlphaEdge Crypto Tracker, traders can swiftly identify which assets are performing exceptionally well (winners) and which are underperforming (losers) without the need to analyze each asset individually.
2. Informed Decision-Making: By having a clear overview of top gainers and losers, traders can make strategic decisions such as reallocating investments, taking profits, or cutting losses, thereby optimizing their trading strategies.
3. Risk Management: Quickly spotting underperforming assets helps in mitigating potential losses and adjusting positions to maintain a balanced and profitable portfolio.
4. Opportunity Identification: Recognizing top-performing assets allows traders to capitalize on emerging trends and maximize their returns by focusing on the most promising opportunities.
Key Features of AlphaEdge Crypto Tracker :
- Comprehensive Asset Tracking: Monitors 40 crypto assets simultaneously, providing a broad view of the market landscape.
- Max Gain and Adjusted Max Loss Calculations: Utilizes a 14-bar (configurable) period to calculate the highest gains and the adjusted maximum losses for each asset, offering insights into potential profitability and risk.
- Dynamic Ranking: Automatically sorts and ranks assets based on their performance, highlighting the top 10 gainers and top 10 losers for easy comparison.
- Customizable Display:
- Table Settings: Adjust the size, position, and colors of the performance table to fit your chart layout.
- Interactive Tooltips: Hover over asset names to view detailed tooltips, enhancing usability and information accessibility.
- Visual Alerts: Changes in asset performance are visually indicated through background color updates, allowing for immediate recognition of significant shifts.
- User-Friendly Interface: Intuitive table layout with clear headers and organized data presentation, making it easy for traders of all levels to interpret the information.
How It Works:
1. Data Calculation: For each of the 40 tracked assets, AlphaEdge Crypto Tracker calculates the maximum gain and adjusted maximum loss over the defined trading period.
2. Sorting and Ranking: The assets are sorted based on their maximum gains and adjusted maximum losses, automatically updating to reflect the latest market movements.
3. Real-Time Display: The top 10 gainers and losers are displayed in a neatly organized table directly on your TradingView chart, providing immediate visual insights.
4. Customization: Users can tailor the tracking period, select specific assets to monitor, and adjust the table’s appearance to match their trading style and preferences.
Conclusion:
AlphaEdge Crypto Tracker is an essential tool for cryptocurrency traders seeking to enhance their market analysis and decision-making processes. By providing a comprehensive and customizable overview of multiple assets, it enables traders to efficiently identify profitable opportunities and manage risks effectively. Whether you’re a seasoned trader or just starting, AlphaEdge Crypto Tracker equips you with the insights needed to navigate the dynamic crypto market with confidence.
Get Started Today:
Integrate AlphaEdge Crypto Tracker into your TradingView setup and take control of your crypto trading strategy with unparalleled clarity and precision.
Disclaimer:
The content provided, including all code and materials, is strictly for educational and informational purposes only. It is not intended as, and should not be interpreted as, financial advice, a recommendation to buy or sell any financial instrument, or an offer of any financial product or service. All strategies, tools, and examples discussed are provided for illustrative purposes to demonstrate coding techniques and the functionality of Pine Script within a trading context.
Any results from strategies or tools provided are hypothetical, and past performance is not indicative of future results. Trading and investing involve high risk, including the potential loss of principal, and may not be suitable for all individuals. Before making any trading decisions, please consult with a qualified financial professional to understand the risks involved.
By using this script, you acknowledge and agree that any trading decisions are made solely at your discretion and risk.
License Information:
This Pine Script™ code is subject to the terms of the Mozilla Public License 2.0. You can view the full license (mozilla.org).
© chervolino

Enhanced Kaufman Adaptive Moving Average (KAMA) with Bollinger B# Enhanced Kaufman Adaptive Moving Average (KAMA) with Bollinger Bands
## Overview
This indicator combines the Kaufman Adaptive Moving Average (KAMA) with Bollinger Bands to create a comprehensive trading system. It provides adaptive trend following capabilities while measuring market volatility and potential reversal points.
## Key Features
- Adaptive moving average that adjusts to market conditions
- Dynamic Bollinger Bands for volatility measurement
- Color-coded KAMA line indicating trend direction
- Integrated buy/sell signals based on multiple confirmations
- Customizable parameters for both KAMA and Bollinger Bands
- Optional bar confirmation wait feature
- Built-in alert conditions for trade signals
## Main Components
### 1. Kaufman Adaptive Moving Average (KAMA)
- Adapts to market volatility using an efficiency ratio
- Changes color based on trend direction (green for uptrend, red for downtrend)
- Adjustable parameters for fine-tuning:
- Base Length: Controls the main calculation period (default: 10)
- Fast EMA Length: For rapid market response (default: 2)
- Slow EMA Length: For stable market conditions (default: 30)
### 2. Bollinger Bands
- Standard deviation-based volatility bands
- Customizable length and standard deviation multiplier
- Includes expansion threshold for volatility measurement
- Components:
- Upper Band: Upper volatility threshold
- Middle Band: Simple moving average
- Lower Band: Lower volatility threshold
## Signal Generation
### Buy Signals
Generated when:
1. KAMA color changes from red to green
2. Price closes above KAMA
3. Price closes above the middle Bollinger Band
4. Signals are marked with:
- Green triangles below the candles
- "B" labels for easy identification
### Sell Signals
Generated when:
1. KAMA color changes from green to red
2. Price closes below KAMA
3. Price closes below the middle Bollinger Band
4. Signals are marked with:
- Red triangles above the candles
- "S" labels for easy identification
## Customizable Parameters
### KAMA Settings
- Base Length (1-50)
- Fast EMA Length (1-10)
- Slow EMA Length (10-50)
- Source Price Selection
- Direction Highlight Toggle
- Bar Confirmation Option
### Bollinger Bands Settings
- Length (default: 20)
- Standard Deviation Multiplier (default: 2.0)
- Expansion Threshold (0.1-3.0)
## Alert Functionality
Built-in alerts for:
- Buy signals with customizable messages
- Sell signals with customizable messages
## Best Practices
### Timeframe Selection
- Works well on multiple timeframes
- Recommended for 15m to 4h charts for optimal signal generation
- Higher timeframes provide more reliable trend signals
### Parameter Optimization
- Adjust KAMA lengths based on trading style:
- Shorter lengths for day trading
- Longer lengths for swing trading
- Fine-tune BB multiplier based on market volatility
- Consider waiting for bar confirmation in volatile markets
### Risk Management
- Use in conjunction with other indicators for confirmation
- Consider market conditions and volatility when trading signals
- Implement proper position sizing and stop-loss levels
## Technical Notes
- Written in Pine Script™ v6
- Overlay indicator (displays on price chart)
- Compatible with all TradingView-supported markets
- Resource-efficient implementation for smooth performance
## Disclaimer
This indicator is provided under the Mozilla Public License 2.0. While it can be a valuable tool for technical analysis, it should not be used as the sole basis for trading decisions. Always combine with proper risk management and additional analysis methods.
Dual Timeframe Stochastic Momentum Index w/buy sell signalsThis indicator combines momentum analysis across two timeframes to identify high-probability trading opportunities. It plots the Stochastic Momentum Index (SMI) for both the chart timeframe and a higher timeframe (default 10 minutes) to help traders align with the broader market trend.
Key Features
Displays SMI and its EMA for both timeframes
Background shading indicates favorable trading conditions
Signal dots mark potential entry points
Customizable parameters for fine-tuning
Signals Explained
Bullish Signals (Green Dots)
Appear when the chart timeframe SMI crosses above its EMA
Only trigger during periods when the higher timeframe shows:
SMI is above its EMA (increasing momentum)
SMI is between -40 and +40 (not overbought/oversold)
Bearish Signals (Red Dots)
Appear when the chart timeframe SMI crosses below its EMA
Only trigger during periods when the higher timeframe shows:
SMI is below its EMA (decreasing momentum)
SMI is between -40 and +40 (not overbought/oversold)
Settings
%K Length: Lookback period for SMI calculation (default: 10)
%D Length: Smoothing period for primary calculation (default: 3)
EMA Length: Smoothing period for signal line (default: 3)
Alternative Timeframe: Higher timeframe for trend analysis (default: 10 minutes)
Best Practices
Use higher timeframe signals to determine market bias
Wait for signal dots in the chart timeframe for entry timing
Avoid trades when higher timeframe SMI is in extreme zones (above 40 or below -40)
Consider additional confirmation from price action or other indicators
Note: This indicator combines trend and momentum analysis but should be used as part of a complete trading strategy that includes proper risk management.
Wick Detection (1 and 0) - AYNETDetailed Scientific Explanation
1. Wick Detection Logic
Definition of a Wick:
A wick, also known as a shadow, represents the price action outside the range of a candlestick's body (the region between open and close).
Upper Wick: Occurs when the high value exceeds the greater of open and close.
Lower Wick: Occurs when the low value is lower than the smaller of open and close.
Upper Wick Detection:
pinescript
Kodu kopyala
bool has_upper_wick = high > math.max(open, close)
This checks if the high price of the candle is greater than the maximum of the open and close prices. If true, an upper wick exists.
Lower Wick Detection:
pinescript
Kodu kopyala
bool has_lower_wick = low < math.min(open, close)
This checks if the low price of the candle is less than the minimum of the open and close prices. If true, a lower wick exists.
2. Binary Representation
The presence of a wick is encoded as a binary value for simplicity and computational analysis:
Upper Wick: Represented as 1 if present, otherwise 0.
pinescript
Kodu kopyala
float upper_wick_binary = has_upper_wick ? 1 : 0
Lower Wick: Represented as 1 if present, otherwise 0. This value is inverted (-1) for visualization purposes.
pinescript
Kodu kopyala
float lower_wick_binary = has_lower_wick ? 1 : 0
3. Visualization with Histograms
The plot function is used to create histograms for visualizing the binary wick data:
Upper Wicks: Plotted as positive values with green columns:
pinescript
Kodu kopyala
plot(upper_wick_binary, title="Upper Wick", color=color.new(color.green, 0), style=plot.style_columns, linewidth=2)
Lower Wicks: Plotted as negative values with red columns:
pinescript
Kodu kopyala
plot(lower_wick_binary * -1, title="Lower Wick", color=color.new(color.red, 0), style=plot.style_columns, linewidth=2)
Features and Applications
1. Wick Visualization:
Upper wicks are displayed as positive green columns.
Lower wicks are displayed as negative red columns.
This provides a clear visual representation of wick presence in historical data.
2. Technical Analysis:
Wick formations often indicate market sentiment:
Upper Wicks: Sellers pushed the price lower after buyers drove it higher, signaling rejection at the top.
Lower Wicks: Buyers pushed the price higher after sellers drove it lower, signaling rejection at the bottom.
3. Signal Generation:
Traders can use wick detection to build strategies, such as identifying key price levels or market reversals.
Enhancements and Future Improvements
1. Wick Length Measurement
Instead of binary detection, measure the actual length of the wick:
pinescript
Kodu kopyala
float upper_wick_length = high - math.max(open, close)
float lower_wick_length = math.min(open, close) - low
This approach allows for thresholds to identify significant wicks:
pinescript
Kodu kopyala
bool significant_upper_wick = upper_wick_length > 10 // For wicks longer than 10 units.
bool significant_lower_wick = lower_wick_length > 10
2. Alerts for Long Wicks
Trigger alerts when significant wicks are detected:
pinescript
Kodu kopyala
alertcondition(significant_upper_wick, title="Long Upper Wick", message="A significant upper wick has been detected.")
alertcondition(significant_lower_wick, title="Long Lower Wick", message="A significant lower wick has been detected.")
3. Combined Wick Analysis
Analyze both upper and lower wicks to assess volatility:
pinescript
Kodu kopyala
float total_wick_length = upper_wick_length + lower_wick_length
bool high_volatility = total_wick_length > 20 // Combined wick length exceeds 20 units.
Conclusion
This script provides a compact and computationally efficient way to detect candlestick wicks and represent them as binary data. By visualizing the data with histograms, traders can easily identify wick formations and use them for technical analysis, signal generation, and volatility assessment. The approach can be extended further to measure wick length, detect significant wicks, and integrate these insights into automated trading systems.

FTMO Rules MonitorFTMO Rules Monitor: Stay on Track with Your FTMO Challenge Goals
TLDR; You can test with this template whether your strategy for one asset would pass the FTMO challenges step 1 then step 2, then with real money conditions.
Passing a prop firm challenge is ... challenging.
I believe a toolkit allowing to test in minutes whether a strategy would have passed a prop firm challenge in the past could be very powerful.
The FTMO Rules Monitor is designed to help you stay within FTMO’s strict risk management guidelines directly on your chart. Whether you’re aiming for the $10,000 or the $200,000 account challenge, this tool provides real-time tracking of your performance against FTMO’s rules to ensure you don’t accidentally breach any limits.
NOTES
The connected indicator for this post doesn't matter.
It's just a dummy double supertrends (see below)
The strategy results for this script post does not matter as I'm posting a FTMO rules template on which you can connect any indicator/strategy.
//@version=5
indicator("Supertrends", overlay=true)
// Supertrend 1 Parameters
var string ST1 = "Supertrend 1 Settings"
st1_atrPeriod = input.int(10, "ATR Period", minval=1, maxval=50, group=ST1)
st1_factor = input.float(2, "Factor", minval=0.5, maxval=10, step=0.5, group=ST1)
// Supertrend 2 Parameters
var string ST2 = "Supertrend 2 Settings"
st2_atrPeriod = input.int(14, "ATR Period", minval=1, maxval=50, group=ST2)
st2_factor = input.float(3, "Factor", minval=0.5, maxval=10, step=0.5, group=ST2)
// Calculate Supertrends
= ta.supertrend(st1_factor, st1_atrPeriod)
= ta.supertrend(st2_factor, st2_atrPeriod)
// Entry conditions
longCondition = direction1 == -1 and direction2 == -1 and direction1 == 1
shortCondition = direction1 == 1 and direction2 == 1 and direction1 == -1
// Optional: Plot Supertrends
plot(supertrend1, "Supertrend 1", color = direction1 == -1 ? color.green : color.red, linewidth=3)
plot(supertrend2, "Supertrend 2", color = direction2 == -1 ? color.lime : color.maroon, linewidth=3)
plotshape(series=longCondition, location=location.belowbar, color=color.green, style=shape.triangleup, title="Long")
plotshape(series=shortCondition, location=location.abovebar, color=color.red, style=shape.triangledown, title="Short")
signal = longCondition ? 1 : shortCondition ? -1 : na
plot(signal, "Signal", display = display.data_window)
To connect your indicator to this FTMO rules monitor template, please update it as follow
Create a signal variable to store 1 for the long/buy signal or -1 for the short/sell signal
Plot it in the display.data_window panel so that it doesn't clutter your chart
signal = longCondition ? 1 : shortCondition ? -1 : na
plot(signal, "Signal", display = display.data_window)
In the FTMO Rules Monitor template, I'm capturing this external signal with this input.source variable
entry_connector = input.source(close, "Entry Connector", group="Entry Connector")
longCondition = entry_connector == 1
shortCondition = entry_connector == -1
🔶 USAGE
This indicator displays essential FTMO Challenge rules and tracks your progress toward meeting each one. Here’s what’s monitored:
Max Daily Loss
• 10k Account: $500
• 25k Account: $1,250
• 50k Account: $2,500
• 100k Account: $5,000
• 200k Account: $10,000
Max Total Loss
• 10k Account: $1,000
• 25k Account: $2,500
• 50k Account: $5,000
• 100k Account: $10,000
• 200k Account: $20,000
Profit Target
• 10k Account: $1,000
• 25k Account: $2,500
• 50k Account: $5,000
• 100k Account: $10,000
• 200k Account: $20,000
Minimum Trading Days: 4 consecutive days for all account sizes
🔹 Key Features
1. Real-Time Compliance Check
The FTMO Rules Monitor keeps track of your daily and total losses, profit targets, and trading days. Each metric updates in real-time, giving you peace of mind that you’re within FTMO’s rules.
2. Color-Coded Visual Feedback
Each rule’s status is shown clearly with a ✓ for compliance or ✗ if the limit is breached. When a rule is broken, the indicator highlights it in red, so there’s no confusion.
3. Completion Notification
Once all FTMO requirements are met, the indicator closes all open positions and displays a celebratory message on your chart, letting you know you’ve successfully completed the challenge.
4. Easy-to-Read Table
A table on your chart provides an overview of each rule, your target, current performance, and whether you’re meeting each goal. The table adjusts its color scheme based on your chart settings for optimal visibility.
5. Dynamic Position Sizing
Integrated ATR-based position sizing helps you manage risk and avoid large drawdowns, ensuring each trade aligns with FTMO’s risk management principles.
Daveatt

Globex Trap ZoneGlobex Trap Indicator
A powerful tool designed to identify potential trading opportunities by analyzing the relationship between Globex session ranges and Supply & Demand zones during regular trading hours.
Key Features
Tracks and visualizes Globex session price ranges
Identifies key Supply & Demand zones during regular trading hours
Highlights potential trap areas where price might experience significant reactions
Fully customizable time ranges and visual settings
Clear labeling of Globex highs and lows
How It Works
The indicator tracks two key periods:
Globex Session (Default: 6:00 PM - 9:30 AM)
Monitors overnight price action
Marks session high and low
Helps identify potential range breakouts
Supply & Demand Zone (Default: 8:00 AM - 11:00 AM)
Tracks price action during key market hours
Identifies potential reaction zones
Helps spot institutional trading areas
Best Practices for Using This Indicator
Use on 1-hour timeframe or lower for optimal visualization
Best suited for futures and other instruments traded during Globex sessions
Pay attention to areas where Globex range and Supply/Demand zones overlap
Use in conjunction with your existing trading strategy for confirmation
Recommended minimum of 10 days of historical data for context
Settings Explanation
Globex Session: Customizable time range for overnight trading session
Supply & Demand Zone: Adjustable time range for regular trading hours
Days to Look Back: Number of historical days to display (default: 10)
Visual Settings: Customizable colors and transparency for both zones
Important Notes
All times are based on exchange timezone
The indicator respects overnight sessions and properly handles timezone transitions
Historical data requirements: Minimum 10 days recommended
Performance impact: Optimized for smooth operation with minimal resource usage
Disclaimer
Past performance is not indicative of future results. This indicator is designed to be used as part of a comprehensive trading strategy and should not be relied upon as the sole basis for trading decisions.
Updates and Support
I actively maintain this indicator and welcome feedback from the trading community. Please feel free to leave comments or suggestions for improvements.

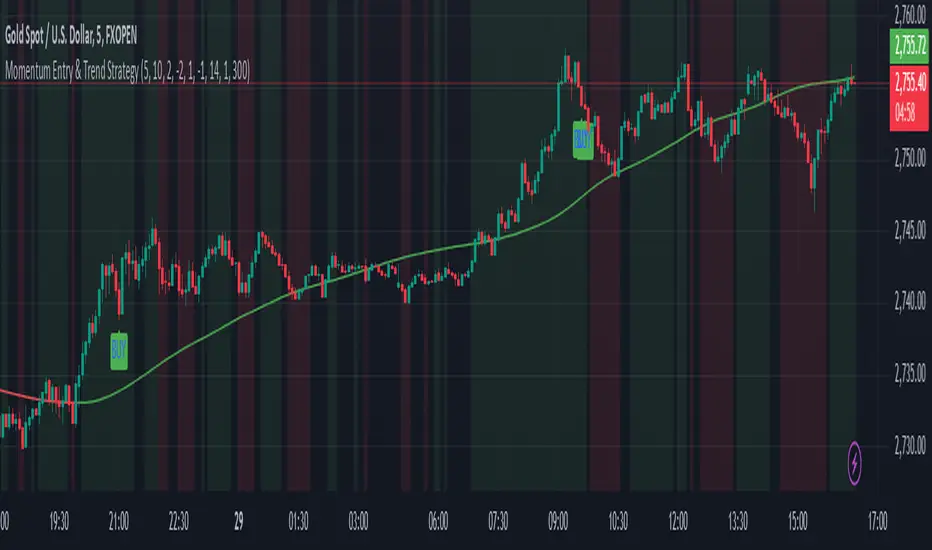
Momentum Entry & Trend Strategy M5Momentum Entry & Trend Strategy M5
Description:
The Momentum Entry & Trend Strategy M5 is an indicator script designed to assist traders in determining optimal buy and sell moments based on momentum and trend analysis. This script operates using two different momentum levels—Momentum Length for Entry (5) and Momentum Length for Trend (10)—along with the HMA (Hull Moving Average) indicator for trend confirmation.
Key Features:
Momentum Entry: Calculates momentum using the difference between the current price and the price from previous periods to determine the strength and direction of price movements.
Trend Identification: Utilizes two momentum levels (5 and 10) to identify bullish and bearish trend conditions.
HMA for Trend Confirmation: The HMA indicator is used to provide trend confirmation signals. When HMA indicates bullish, a buy signal is displayed; conversely, a bearish HMA results in a sell signal.
Signal Display: Displays buy (BUY) and sell (SELL) signals on the chart when the conditions for market entry are met, providing clear visualization for traders.
Background Color: Offers a green background for uptrends and a red background for downtrends, allowing traders to easily identify the overall market condition.
ATR (Average True Range): Calculates and plots a smoothed ATR to help traders measure market volatility.
Settings:
Momentum Length for Entry: 5 (to determine entry signals)
Momentum Length for Trend: 10 (to determine trend conditions)
HMA Length: 300 (period length for HMA to confirm trends)
ATR Length: 14 (period length for ATR to measure volatility)
Benefits:
This script is designed to provide visual and data-driven guidance for better trading decision-making. By combining momentum and trend analysis, traders can enhance the accuracy of their signals and reduce the risk of errors when identifying entry and exit points in the market.
Note:
This script is intended for use on the M5 time frame but can be adjusted for other time frames as needed. It is always recommended to conduct thorough testing before applying trading strategies on a live account.
Indicator SELL UBScript Name: UB Sell Indicator based on 10Y Volume and Trend
Description: This indicator uses the 10-year interest rate (10Y1!) volume and price data to generate sell signals on the UB contract. When the 10Y1! volume exceeds a fixed threshold and the 10Y1! price is rising, a sell signal is issued to help traders anticipate bearish moves on the UB.
Features:
10Y1! Volume: Identifies periods of high volume.
10Y1! Price: Detects bullish trends in the 10Y1!.
Sell Signals: Displays red arrows to indicate selling opportunities on UB when conditions are met.
Visual Indicators: Colors and arrows for easy signal interpretation.
Parameters:
Fixed Volume Threshold: 114 (modifiable as needed).
Moving Average Period: 10 (to calculate the 10Y1! price trend).
Usage:
Watch for red arrows to identify selling opportunities on UB.
Combine with other analyses and indicators for a complete trading strategy.
Author: Jm Smeers
Publication Date: 26/10/2024

FuTech V-Spike & V-HighlighterFuTech V-Spike & V-Highlighter
In the context of trading and technical analysis, this volume spike & volume highlighter indicator is the perfect indicator used to assess market activity and make informed trading decisions.
Let's Understand in brief as below :
1) Volume Spike :
A volume spike refers to a sudden, significant increase in trading volume compared to the average volume over a specific period.
This spike can indicate heightened interest in a particular security, often preceding price movements.
Traders may look for volume spikes as signals for potential buy or sell opportunities because they can suggest that a stock is experiencing increased activity, possibly due to news, earnings releases, or other catalysts.
Characteristics of a Volume Spike:
Assess the sudden increase in trading volume.
It Can occur in both upward and downward price movements.
Often compared to the average volume over a defined period (e.g., the last 20 days).
2) Volume Highlighter:
A volume highlighter emphasizes significant changes in trading volume on a price chart. This indicator typically uses color coding to highlight periods of high volume, making it easier for traders to identify volume spikes at a glance.
How this indicator works:
a) Volume Spike will calculate the highest volume spike as per the user defined threshold multiplier. (Multiplier = when volume exceeds a certain threshold)
b) The threshold Multiplier can be set based on a fixed number or as a multiple of the Exponential Moving Average volume. Volume Spike Multiplier default is 1.5, means the EMA volume should cross 1.5 times the user defined lookback period
c) The result is derived from the user defined lookback candles by using its EMA instead of SMA, which will give us more precise results.
d) By default, last 10 candles EMA average is used to calculate the Volume Spike but you can choose your lookback period as many days, weeks, months, years of your choice !
e) In Volume Spike -
- Green candle will show Yellow color Bar as Bullish sentiments, whereas
- Red candle will show Black Bar as Bearish sentiments.
f) Volume Highlighter will highlight the candles background if the highest volume is crossing as per the the user defined lookback period
g) Default Lookback period is 20, Color coding (e.g., Blue for bullish spikes, Red for bearish spikes) helps traders quickly assess the volume context.
h) Volume Highlighter plotting shapes and positions can be modified
Illustration:
From the Above pic,
If last Volume Spike is 10 lookback candles, Spike multiplier is 1.5 and Highlighter lookback candles is 20,
Then yellow candle means the spike in volume which is 1.5 times higher than the last 10 candles
Highlighting color defines the highest volumes trading from the last 20 candles which is either Blue (Bullish) or Red (Bearish) sentiments
Conclusion :
Using FuTech V-Spike & V-Highlighter indicator - will help traders identify potential trading opportunities and better understand market dynamics.
By analyzing volume in conjunction with price movements, traders can make more informed decisions based on market sentiment.
Thank you !
Jai Swaminarayan Dasna Das !
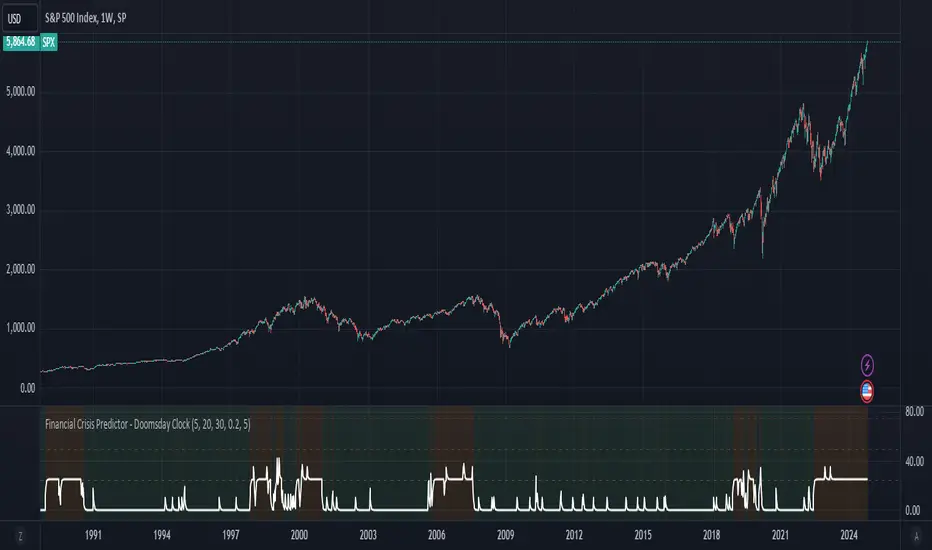
He Hari ! Bas Ek Tu Raji Tha !

Financial Crisis Predictor - Doomsday ClockThe **Financial Crisis Predictor - Doomsday Clock** is a composite indicator that evaluates multiple market conditions to determine financial risk levels. It combines four key metrics: market volatility (via VIX), yield curve spread, stock market momentum, and credit risk (via high-yield spread). Each metric contributes to a weighted "risk score," scaled between 0 and 100, which helps gauge the probability of a financial crisis. Here's a breakdown of how it works:
### 1. **Market Volatility (VIX)**
- **How it's measured:**
- Uses the VIX index, which represents expected market volatility.
- Applies two exponential moving averages (EMAs) to smooth out the data—one fast and one slow.
- Triggers a signal if the fast EMA crosses above the slow EMA and VIX exceeds a defined threshold (default is 30).
- **Weighting:**
- Contributes up to 35% of the total risk score when active.
### 2. **Yield Curve Spread**
- **How it's measured:**
- Takes the difference between the yields of 10-year and 2-year U.S. Treasury bonds (inversion indicates recession risk).
- If the spread drops below a certain threshold (default is 0.2), it signals a potential recession.
- **Weighting:**
- Contributes up to 25% of the risk score.
### 3. **Stock Market Momentum**
- **How it's measured:**
- Analyzes the S&P 500 (SPY) using a 20-day EMA for price momentum.
- Checks for a cross under the 20-day EMA and if the 5-day rate of change (ROC) is less than -2.
- This combination signals bearish market momentum.
- **Weighting:**
- Contributes up to 20% of the risk score.
### 4. **Credit Risk (High Yield Spread)**
- **How it's measured:**
- Assesses high-yield corporate bond spreads using EMAs, similar to the VIX logic.
- A crossover of the fast EMA above the slow EMA combined with spreads exceeding a defined threshold (default is 5.0) indicates increased credit risk.
- **Weighting:**
- Contributes up to 20% of the total risk score.
### 5. **Risk Score Calculation**
- The final **risk score** ranges from 0 to 100 and is calculated using the weighted sum of the four indicators.
- The score is smoothed to minimize false signals and maintain stability.
### 6. **Risk Zones**
- **Extreme Risk:** If the risk score is ≥ 75, indicating a severe crisis warning.
- **High Risk:** If the risk score is between 15 and 75, signaling heightened risk.
- **Moderate Risk:** If the risk score is between 10 and 15, representing potential concerns.
- **Low Risk:** If the risk score is < 10, suggesting stable conditions.
### 7. **Visual & Alerts**
- The indicator plots the risk score on a chart with color-coded backgrounds to indicate risk levels: green (low), yellow (moderate), orange (high), and red (extreme).
- Alert conditions are set for each risk zone, notifying users when the risk level transitions into a higher zone.
This indicator aims to quickly detect potential financial crises by aggregating signals from key market factors, making it a versatile tool for traders, analysts, and risk managers.
Macro Timeframes with Opening PriceDescription: Macro Timeframe Horizontal Line Indicator
This indicator highlights macro periods on the chart by drawing a horizontal line at the opening price of each macro period. The macro timeframe is defined as the last 10 minutes of an hour (from :50 to :00) and the first 10 minutes of the following hour (from :00 to :10).
A horizontal black line is plotted at the opening price of the macro period, starting at :50 and extending through the duration of the macro window. However, you can customize it however you see fit.
The background of the macro period is highlighted with a customizable color to visually distinguish the timeframe.
The horizontal line updates at each macro period, ensuring that the opening price for every macro session is accurately reflected on the chart.
This tool is useful for traders who want to track the behavior of price within key macro intervals and visually assess price movement and volatility during these periods.