[REPOST] Indicators: 3 Different Adaptive Moving Averages*** NOTE: This is a repost with updated scripts to workaround the recent script engine changes ****
As the volatility rises, all Adaptive Moving Averages (AMA) become more sensitive and adapt faster to the price changes. As the volatility decreases, they slow down significantly compared to normal EMA. This makes it an excellent choice for detecting ranging markets (look for horizontal lines).
I have included 3 AMAs here:
- Kaufman's AMA. This makes use of Kaufman's Efficiency Ratio as the smoothing constant.
- Adaptive RSI. This adapts standard RSI to a smoothing constant.
- Tushar Chande's Variable Index Dynamic Average (VIDYA). This uses a pivotal smoothing constant, which is fixed, and varies the speed by using a factor based on the relative volatility to increase or decrease the value of SC.
For reference, I have plotted an EMA(10). This uses a fixed smoothing constant.
This is my 25th indicators post (Yayy!), so decided to include a bunch of AMAs. Enjoy :)
Feel free to "Make mine" and use these in your charts. Appreciate any comments / feedback.
"averages" için komut dosyalarını ara

ka66: Average Bar RangeAverages price ranges (high - low) across a set of bars in a given timeframe. Additionally, also plots the Average True Range (ATR) as a better comparison for volatility.
Configurable period and averaging mechanism.
Useful for gauging minimum profits and price movement over a period, a filter for historical volatility.
Furthermore, executing trades is better done with channels like ATR/Keltner channels, or Bollinger Bands.
Multi-Moving Average Buy/Sell IndicatorThis Multi-Moving Average Buy/Sell Indicator is a powerful and customizable tool designed to help traders identify potential buy and sell signals based on the interaction between price and multiple moving averages. Whether you're a day trader, swing trader, or long-term investor, this indicator provides clear visual cues and alerts to help you make informed trading decisions.
Key Features
1. Multiple Moving Averages
The indicator calculates four key moving averages:
9-period MA
20-period MA
50-period MA
180-period MA
You can choose the type of moving average:
SMA (Simple Moving Average)
EMA (Exponential Moving Average)
WMA (Weighted Moving Average)
2. Custom Timeframe
Select a custom timeframe from a user-friendly dropdown menu:
1 Minute
5 Minutes
15 Minutes
30 Minutes
1 Hour
4 Hours
Daily
Weekly
The indicator dynamically adjusts to the selected timeframe, making it suitable for all trading styles.
3. Buy/Sell Signals
Buy Signal: Triggered when the price crosses above any of the moving averages.
Sell Signal: Triggered when the price crosses below any of the moving averages.
Signals are displayed as labels on the chart:
Green "BUY" Label: Below the bar when a buy signal is triggered.
Red "SELL" Label: Above the bar when a sell signal is triggered.
4. Visualization
Toggle the visibility of all moving averages using the showAllMAs input.
Moving averages are plotted with distinct colors for easy identification:
9 MA: Blue
20 MA: Orange
50 MA: Purple
180 MA: Teal
5. Alerts
The indicator generates alerts for buy and sell signals, which can be used for notifications or automated trading.
How to Use
Add the Indicator:
Open TradingView and go to the Pine Script Editor.
Copy and paste the script into the editor.
Click Add to Chart.
Configure Inputs:
maType: Choose the type of moving average (SMA, EMA, WMA).
timeframe: Select a custom timeframe (e.g., "1 Minute", "Daily").
showSignals: Toggle to show or hide buy/sell signals.
showAllMAs: Toggle to show or hide all moving averages.
Interpret the Signals:
Look for green "BUY" labels below the bars for potential buy opportunities.
Look for red "SELL" labels above the bars for potential sell opportunities.
Set Alerts:
Use the built-in alert system to get notified when buy or sell signals are triggered.
Example Use Cases
Day Trading
Use a 1-minute or 5-minute timeframe with an EMA for quick signals.
Example Inputs:
maType = "EMA"
timeframe = "5 Minutes"
showAllMAs = true
Swing Trading
Use a daily timeframe with an SMA for longer-term signals.
Example Inputs:
maType = "SMA"
timeframe = "Daily"
showAllMAs = false
Why Use This Indicator?
Versatility: Suitable for all trading styles and timeframes.
Customization: Choose your preferred moving average type and timeframe.
Clear Signals: Easy-to-read buy/sell labels and moving averages.
Alerts: Never miss a trading opportunity with built-in alerts.
Limitations
False Signals:
The indicator may generate false signals in choppy or sideways markets. Always combine it with other tools (e.g., RSI, volume analysis) for better accuracy.
Timeframe Dependency:
The effectiveness of the signals depends on the selected timeframe. Shorter timeframes may produce more signals but with higher noise.
No Backtesting:
The script does not include backtesting functionality. Test the strategy manually on historical data.
Customization Options
Add More Moving Averages: Modify the script to include additional moving averages (e.g., 200 MA).
Change Signal Logic: Adjust the conditions for buy/sell signals (e.g., require confirmation from multiple moving averages).
Add Alerts for Specific MAs: Create separate alerts for signals based on specific moving averages (e.g., only 9 MA or 50 MA).

Multiple MAs Signals with RSI MA Filter & Signal About the Script
The "Multiple Moving Averages Signals with RSI MA Filter and Golden Signals" script is a comprehensive trading tool designed to provide traders with detailed insights and actionable signals based on multiple moving averages and RSI (Relative Strength Index). This script combines traditional moving average crossovers with RSI filtering to enhance the accuracy of trading signals and includes "golden" signals to highlight significant long-term trend changes.
This script integrates several technical indicators and concepts to create a robust and versatile trading tool. Here's why this combination is both original and useful:
1. Multiple Moving Averages:
- Why Use Multiple MAs: Different types of moving averages (SMA, EMA, SMMA, WMA, VWMA, Hull) offer unique perspectives on price trends and volatility. Combining them allows traders to capture a more comprehensive view of the market.
- Purpose: Using multiple moving averages helps identify trend direction, support/resistance levels, and potential reversal points.
2. RSI MA Filter:
- Why Use RSI: RSI is a momentum oscillator that measures the speed and change of price movements. It is used to identify overbought or oversold conditions in a market.
- Purpose: Filtering signals with RSI moving averages ensures that trades are taken in line with the prevailing momentum, reducing the likelihood of false signals.
3. Golden Signals:
- Why Use Golden Crosses: A golden cross (50-period MA crossing above the 200-period MA) is a well-known bullish signal, while a death cross (50-period MA crossing below the 200-period MA) is bearish. These signals are widely followed by traders and institutions.
- Purpose: Highlighting these significant long-term signals helps traders identify major buy or sell opportunities and align with broader market trends.
How the Script Works
1. Moving Average Calculations:
- The script calculates multiple moving averages (MA1 to MA5) based on user-selected types (SMA, EMA, SMMA, WMA, VWMA, Hull) and periods (9, 21, 50, 100, 200).
- Golden Moving Averages: Separately calculates 50-period and 200-period moving averages for generating golden signals.
2. RSI and RSI MA Filter:
- RSI Calculation: Computes the RSI for the given period.
- RSI MA: Calculates a moving average of the RSI to smooth out the RSI values and reduce noise.
- RSI MA Filter: Traders can enable/disable RSI filtering and set custom thresholds to refine long and short signals based on RSI momentum.
3. Long & Short Signal Generation:
- Long Signal: Generated when the short-term moving average crosses above both the mid-term and long-term moving averages, and the RSI MA is below the specified threshold (if enabled).
- Short Signal: Generated when the short-term moving average crosses below both the mid-term and long-term moving averages, and the RSI MA is above the specified threshold (if enabled).
4. Golden Signals:
- Golden Long Signal: Triggered when the 50-period golden moving average crosses above the 200-period golden moving average.
- Golden Short Signal: Triggered when the 50-period golden moving average crosses below the 200-period golden moving average.
How to Use the Script
1. Customize Inputs:
- Moving Averages: Choose the type of moving averages and set the periods for up to five different moving averages.
- RSI Settings: Adjust the RSI period and its moving average period. Enable or disable RSI filtering and set custom thresholds for long and short signals.
- Signal Colors: Customize the colors for long, short, and golden signals.
- Enable/Disable Signals: Toggle the visibility of long, short, and golden signals.
2. Observe Plots and Signals:
- The script plots the selected moving averages on the chart.
- Long and short signals are marked with labels on the chart, with customizable colors for easy identification.
- Golden signals are highlighted with specific labels to indicate significant long-term trend changes.
3. Analyze and Trade:
- Use the generated signals as part of your trading strategy. The script provides visual cues to help you make informed decisions about entering or exiting trades based on multiple technical indicators.
Unique Features
1. Integration of Multiple Moving Averages: Combines various moving average types to provide a holistic view of market trends.
2. RSI MA Filtering: Enhances signal accuracy by incorporating RSI momentum, reducing the likelihood of false signals.
3. Golden Signals: Highlights significant long-term trend changes, aligning with broader market movements.
4. Customizability: Offers extensive customization options, allowing traders to tailor the script to their specific trading strategies and preferences.
feel free to comments.

Hamid Double RSIRSI with Moving Average and Another RSI
This script combines two Relative Strength Index (RSI) indicators with configurable moving averages. It allows traders to track momentum and market strength with adjustable periods for both the RSI and moving averages. The script also allows you to choose different data sources for each RSI, offering flexibility in analysis.
Features:
Two RSIs: One with a shorter period and another with a longer period .
Moving Averages: Each RSI has its own configurable moving average . The moving averages help smooth out the RSI and provide clearer trends.
Customizable Inputs: Adjust the RSI period and the length of the moving averages. You can also choose different sources for each RSI (e.g., close, open, high, low).
Mid Line: A horizontal line at 50, which is commonly used as the neutral level for the RSI. It helps identify whether the RSI is above or below neutral, indicating bullish or bearish conditions.
Overbought and Oversold Levels: Horizontal lines at 70 (overbought) and 30 (oversold) to highlight when the asset might be overbought or oversold according to the RSI.
How it works:
RSI Calculation: The script calculates two RSIs using different lengths
Moving Averages: A Simple Moving Average (SMA) is applied to both RSIs to smooth their values and help identify trends.
Overbought/Oversold Indicators: The script includes horizontal lines at 70 and 30 to show overbought and oversold conditions. The mid line is plotted at 50 to highlight neutral levels.
This indicator is useful for traders who want to compare the behavior of two RSIs over different time periods and use the moving averages to filter out noise. The ability to customize the source data for each RSI makes this script adaptable to different trading strategies.

Dual Moving Average with DotsOverview:
The Dual Moving Average with Dots is a powerful technical analysis tool designed to assist traders in identifying potential trend reversals and confirming trend strength. This indicator combines the simplicity of dual moving averages with visual markers in the form of dots above candles, providing clear signals for both trend following and reversal opportunities.
Key Features:
Dual Moving Averages:
Choose between Simple Moving Average (SMA) and Exponential Moving Average (EMA) for two distinct moving averages.
Customize the source for each moving average, including options such as open, close, high, low, and more.
Adjust the periods for both moving averages to suit your trading preferences.
Visual Signals:
Green Dot: A green triangle-up dot appears above candles where the closing price is greater than both selected moving averages. This signals potential bullish strength and trend continuation.
Red Dot: A red triangle-down dot appears above candles where the closing price is lower than either of the selected moving averages. This signals potential bearish weakness and trend reversal.
Flexible Configuration:
Tailor the indicator to your trading strategy by adjusting parameters such as moving average type, source, and period for each average.
Gain insights into market dynamics by visually interpreting the relationship between closing prices and moving averages.
How to Use:
Trend Confirmation:
Confirm a bullish trend when the green dot appears above a candle, suggesting that the closing price is above both moving averages.
Confirm a bearish trend when the red dot appears above a candle, suggesting that the closing price is below either of the moving averages.
Reversal Signals:
Watch for potential trend reversals when red dots appear, signaling that the closing price is below one of the moving averages.
Customization for Strategy:
Experiment with different combinations of moving average types, sources, and periods to align the indicator with your unique trading strategy.
Usage Tips:
Combine the Dual Moving Average with Dots with other technical indicators for comprehensive market analysis.
Look for confluence with support/resistance levels or chart patterns to enhance the robustness of your trading decisions.
Variety Step RSI w/ Dynamic Zones [Loxx]Variety Step RSI w/ Dynamic Zones is a stepped RSI calculation with Discontinued Signal Lines. This indicator includes 7 types of RSI to choose from. The addition of the Discontinued Signal Lines allows this indicator to better identify momentum shifts in price so traders have better defined long/short signals.
Enhanced Moving Average Calculation with Stepped Moving Average and the Advantages over Regular RSI
Technical analysis plays a crucial role in understanding and predicting market trends. One popular indicator used by traders and analysts is the Relative Strength Index (RSI). However, an enhanced approach called Stepped Moving Average, in combination with the Slow RSI function, offers several advantages over regular RSI calculations.
█ Stepped Moving Average and Moving Averages:
The Stepped Moving Average function serves as a crucial component in the calculation of moving averages. Moving averages smooth out price data over a specific period to identify trends and potential trading signals. By employing the Stepped Moving Average function, traders can enhance the accuracy of moving averages and make more informed decisions.
Stepped Moving Average takes two parameters:
The current RSI value and a size parameter. It computes the next step in the moving average calculation by determining the upper and lower bounds of the moving average range. It accomplishes this by adjusting the values of smax and smin based on the given RSI and size.
Furthermore, Stepped Moving Average introduces the concept of a trend variable. By comparing the previous trend value with the current RSI and the previous upper and lower bounds, it updates the trend accordingly. This feature enables traders to identify potential shifts in market sentiment and make timely adjustments to their trading strategies.
█ Advantages over Regular RSI:
Enhanced Range Boundaries:
The inclusion of size parameters in Stepped Moving Average allows for more precise determination of the upper and lower bounds of the moving average range. This feature provides traders with a clearer understanding of the potential price levels that can influence market behavior. Consequently, it aids in setting more effective entry and exit points for trades.
Improved Trend Identification:
The trend variable in Stepped Moving Average helps traders identify changes in market trends more accurately. By considering the previous trend value and comparing it to the current RSI and previous bounds, Stepped Moving Average captures trend reversals with greater precision. This capability empowers traders to respond swiftly to market shifts and potentially capture more profitable trading opportunities.
Smoother Moving Averages:
Stepped Moving Average's ability to adjust the moving average range bounds based on trend changes and size parameters results in smoother moving averages. Regular RSI calculations may produce jagged or erratic results due to abrupt market movements. Stepped Moving Average mitigates this issue by dynamically adapting the range boundaries, thereby providing traders with more reliable and consistent moving average signals.
Complementary Functionality with Slow RSI:
Stepped Moving Average and Slow RSI function in harmony to provide a comprehensive trading analysis toolkit. While Stepped Moving Average refines the moving average calculation process, Slow RSI offers a more accurate representation of market strength. The combination of these two functions facilitates a deeper understanding of market dynamics and assists traders in making better-informed decisions.
What is a Discontinued Signal Line (DSL)?
Many indicators employ signal lines to more easily identify trends or desired states of the indicator. The concept of a signal line is straightforward: by comparing a value to its smoothed, slightly lagging state, one can determine the current momentum or state.
The Discontinued Signal Line builds on this fundamental idea by extending it: rather than having a single signal line, multiple lines are used based on the indicator's current value.
The "signal" line is calculated as follows:
When a specific level is crossed in the desired direction, the EMA of that value is calculated for the intended signal line.
When that level is crossed in the opposite direction, the previous "signal" line value is "inherited," becoming a sort of level.
This approach combines signal lines and levels, aiming to integrate the advantages of both methods.
In essence, DSL enhances the signal line concept by inheriting the previous signal line's value and converting it into a level.
Extras
-Alerts
-Signals
Related indicators:
Step RSI

Step RSI [Loxx]Enhanced Moving Average Calculation with Stepped Moving Average and the Advantages over Regular RSI
Technical analysis plays a crucial role in understanding and predicting market trends. One popular indicator used by traders and analysts is the Relative Strength Index (RSI). However, an enhanced approach called Stepped Moving Average, in combination with the Slow RSI function, offers several advantages over regular RSI calculations.
Stepped Moving Average and Moving Averages:
The Stepped Moving Average function serves as a crucial component in the calculation of moving averages. Moving averages smooth out price data over a specific period to identify trends and potential trading signals. By employing the Stepped Moving Average function, traders can enhance the accuracy of moving averages and make more informed decisions.
Stepped Moving Average takes two parameters: the current RSI value and a size parameter. It computes the next step in the moving average calculation by determining the upper and lower bounds of the moving average range. It accomplishes this by adjusting the values of smax and smin based on the given RSI and size.
Furthermore, Stepped Moving Average introduces the concept of a trend variable. By comparing the previous trend value with the current RSI and the previous upper and lower bounds, it updates the trend accordingly. This feature enables traders to identify potential shifts in market sentiment and make timely adjustments to their trading strategies.
Advantages over Regular RSI:
Enhanced Range Boundaries:
The inclusion of size parameters in Stepped Moving Average allows for more precise determination of the upper and lower bounds of the moving average range. This feature provides traders with a clearer understanding of the potential price levels that can influence market behavior. Consequently, it aids in setting more effective entry and exit points for trades.
Improved Trend Identification:
The trend variable in Stepped Moving Average helps traders identify changes in market trends more accurately. By considering the previous trend value and comparing it to the current RSI and previous bounds, Stepped Moving Average captures trend reversals with greater precision. This capability empowers traders to respond swiftly to market shifts and potentially capture more profitable trading opportunities.
Smoother Moving Averages:
Stepped Moving Average's ability to adjust the moving average range bounds based on trend changes and size parameters results in smoother moving averages. Regular RSI calculations may produce jagged or erratic results due to abrupt market movements. Stepped Moving Average mitigates this issue by dynamically adapting the range boundaries, thereby providing traders with more reliable and consistent moving average signals.
Complementary Functionality with Slow RSI:
Stepped Moving Average and Slow RSI function in harmony to provide a comprehensive trading analysis toolkit. While Stepped Moving Average refines the moving average calculation process, Slow RSI offers a more accurate representation of market strength. The combination of these two functions facilitates a deeper understanding of market dynamics and assists traders in making better-informed decisions.
Extras
-Alerts
-Signals

Custom Moving Average Ribbon with EMA Table & Text ColorComprehensive Description of the Custom Moving Average Ribbon with EMA Table & Text Color
The Custom Moving Average Ribbon with EMA Table & Text Color is a highly flexible and customizable indicator designed for traders who use multiple moving averages to assess trends, strength, and potential market reversals. It plots up to 8 moving averages (either SMA, EMA, WMA, or VWMA) on the price chart and displays a table summarizing the moving averages’ values, periods, and colors. The table also allows for the customization of the text color, making it easier to align with your chart’s theme or preference.
Key Features:
Multiple Moving Averages: You can display up to 8 moving averages (MA), each of which can be customized in terms of:
Type: SMA (Simple Moving Average), EMA (Exponential Moving Average), WMA (Weighted Moving Average), or VWMA (Volume-Weighted Moving Average).
Period: Each moving average has a user-defined period, which allows for flexibility depending on your trading style (short-term, medium-term, or long-term).
Enable/Disable: Each moving average can be independently enabled or disabled based on your preference.
Moving Average Ribbon: The indicator visualizes multiple moving averages as a ribbon, giving traders insight into the market's underlying trend. The interaction between these moving averages provides essential signals:
Uptrend: Shorter-term MAs above longer-term MAs, all sloping upward.
Downtrend: Shorter-term MAs below longer-term MAs, sloping downward.
Consolidation: MAs tightly packed, indicating low volatility or a sideways market.
Customizable Table: The indicator includes a table that displays:
The Name of each moving average (e.g., MA 1, MA 2, etc.).
The Period used for each moving average.
The Current Value of each moving average.
Color Coding for easier visual identification on the chart.
Text Color Customization: You can change the text color in the table to match your chart style or to ensure high visibility.
Responsive Design: This indicator works on any time frame, whether you're a day trader, swing trader, or long-term investor, and the table adjusts dynamically as new data comes in.
How to Use the Indicator
a) Trend Identification
The Custom Moving Average Ribbon helps in identifying trends and their strength. Here’s how you can interpret the plotted moving averages:
Uptrend (Bullish):
If the shorter-term moving averages (e.g., 5-period, 10-period) are above the longer-term moving averages (e.g., 50-period, 200-period), and all the MAs are sloping upward, it suggests a strong bullish trend.
The greater the separation between the moving averages, the stronger the uptrend.
Use the table to quickly verify the current value of each MA and confirm that the price is staying above most or all of the MAs.
Downtrend (Bearish):
When shorter-term moving averages are below the longer-term moving averages and all MAs are sloping downward, this indicates a bearish trend.
Greater separation between MAs indicates a stronger downtrend.
Neutral/Consolidating Market:
If the MAs are tightly packed and frequently crossing each other, the market is likely consolidating, and a strong trend is not in play.
In these situations, it’s better to wait for a clearer signal before taking any positions.
b) Reversal Signals
Golden Cross: When a short-term moving average (e.g., 50-period) crosses above a long-term moving average (e.g., 200-period), this is considered a bullish signal, suggesting a possible upward trend.
Death Cross: When a short-term moving average crosses below a long-term moving average, it’s considered a bearish signal, indicating a potential downward trend.
c) Using the Table for Quick Reference
The table allows you to monitor:
The current price value relative to each moving average. If the price is above most MAs, the market is likely in an uptrend, and if below, in a downtrend.
Changes in MA values: If you see values of shorter-term MAs moving closer to or crossing longer-term MAs, this could indicate a weakening trend or a potential reversal.
How to Combine this Indicator with Other Indicators for a Solid Strategy
The Custom Moving Average Ribbon is powerful on its own but can be enhanced when combined with other technical indicators to form a comprehensive trading strategy.
1. Combining with RSI (Relative Strength Index)
How It Works: RSI is a momentum oscillator that measures the speed and change of price movements, typically over 14 periods. It ranges from 0 to 100, with readings above 70 considered overbought and below 30 considered oversold.
Strategy:
Overbought in an Uptrend: If the moving average ribbon indicates an uptrend but the RSI shows the market is overbought (RSI > 70), it could signal a pullback or correction is imminent.
Oversold in a Downtrend: If the moving average ribbon indicates a downtrend but the RSI shows oversold conditions (RSI < 30), a bounce or reversal may be on the horizon.
2. Combining with MACD (Moving Average Convergence Divergence)
How It Works: MACD tracks the difference between two exponential moving averages, typically the 12-period and 26-period EMAs. It generates buy and sell signals based on crossovers and divergences.
Strategy:
Trend Confirmation: Use the MACD to confirm the direction and momentum of the trend indicated by the moving average ribbon. For example, if the MACD line crosses above the signal line while the shorter-term MAs are above the longer-term MAs, it confirms strong bullish momentum.
Divergences: Watch for divergences between price action and MACD. If price is making higher highs but MACD is making lower highs, it could signal a weakening trend, which you can verify using the moving averages.
3. Combining with Bollinger Bands
How It Works: Bollinger Bands plot two standard deviations above and below a moving average, typically the 20-period SMA. The bands widen during periods of high volatility and contract during periods of low volatility.
Strategy:
Breakout or Reversal: If price action moves above the upper Bollinger Band while the shorter-term MAs are crossing above the longer-term MAs, it confirms a strong breakout. Conversely, if price touches or falls below the lower Bollinger Band and the shorter MAs start crossing below the longer-term MAs, it indicates a potential breakdown.
Mean Reversion: In sideways markets, when the moving averages are tightly packed, Bollinger Bands can help spot mean reversion opportunities (buy near the lower band, sell near the upper band).
4. Combining with Volume Indicators
How It Works: Volume is a crucial confirmation indicator for any trend or breakout. Combining volume with the moving average ribbon can enhance your strategy.
Strategy:
Trend Confirmation: If the price breaks above the moving averages and is accompanied by high volume, it confirms a strong breakout. Similarly, if price breaks below the moving averages on high volume, it signals a strong downtrend.
Divergence: If price continues to trend in one direction but volume decreases, it could indicate a weakening trend, helping you prepare for a reversal.
Example Strategies Using the Indicator
Trend-Following Strategy:
Use the moving average ribbon to identify the main trend.
Combine with MACD or RSI for confirmation of momentum.
Enter trades when the shorter-term MAs confirm the trend and the confirmation indicator (MACD or RSI) aligns with the trend.
Exit trades when the moving averages start converging or when your confirmation indicator shows signs of reversal.
Reversal Strategy:
Wait for significant crossovers in the moving averages (Golden Cross or Death Cross).
Confirm the reversal with divergence in MACD or RSI.
Use Bollinger Bands to fine-tune your entry and exit points based on overbought/oversold conditions.
Conclusion
The Custom Moving Average Ribbon with EMA Table & Text Color indicator provides a robust framework for traders looking to use multiple moving averages to gauge trend direction, strength, and potential reversals. By combining it with other technical indicators like RSI, MACD, Bollinger Bands, and volume, you can develop a solid trading strategy that enhances accuracy, reduces false signals, and maximizes profit potential in various market conditions.
This indicator offers high flexibility with customization options, making it suitable for traders of all levels and strategies. Whether you're trend-following, scalping, or swing trading, this tool provides invaluable insights into market movements.

Multi-Method Moving Average v6.0Multi-Methods Moving Average Indicator is a versatile tool designed for traders who want to identify key price levels that can act as support and resistance in the market. This indicator utilizes multiple moving averages (MAs) to help visualize price trends and potential reversal points, aiding traders in making informed decisions.
Features
Multiple Moving Averages: The indicator calculates and displays six different moving averages (MA1 to MA6) based on user-defined periods. This allows traders to analyze short-term and long-term trends effectively.
Customizable Inputs: Users can customize the periods for each moving average and select the type of moving average (SMA, EMA, WMA) that best suits their trading strategy.
Price Source Selection: The indicator allows users to choose the price source (Open, Close, High, Low, or the average of Open and Close) for calculating the moving averages, providing flexibility in analysis.
Color-Coded Signals: The moving averages are color-coded based on the current price relative to the moving average, helping traders quickly identify bullish or bearish conditions.
How to Use
Adding the Indicator:
Open TradingView and navigate to the chart you wish to analyze.
Click on the "Indicators" button at the top of the chart.
Search for "Multi-Methods Moving Average" and select the indicator to add it to your chart.
Customizing Settings:
Click on the gear icon next to the indicator's name in the chart legend to open the settings menu.
Adjust the periods for each moving average to fit your trading style. Common settings include 9, 26, 52, 100, 200, and 500 periods.
Choose the type of moving average you prefer (SMA, EMA, or WMA).
Select the price source that aligns with your trading strategy.
Interpreting the Indicator:
Moving Averages: Observe the position of the moving averages relative to the price. If the price is above the moving average, it indicates a bullish trend; if below, it suggests a bearish trend.
Crossover Signals: Look for crossovers between the moving averages. A crossover where a shorter moving average crosses above a longer moving average may signal a potential buy opportunity, while a crossover in the opposite direction may indicate a sell opportunity.
Support and Resistance Levels: Use the moving averages as dynamic support and resistance levels. Price often reacts at these levels, providing potential entry and exit points for trades.
Risk Management:
Always combine the insights from this indicator with other forms of analysis, such as price action, volume analysis, and market sentiment.
Set stop-loss and take-profit levels based on the identified support and resistance levels to manage your risk effectively.
Conclusion
The Support & Resistance Indicator is an essential tool for traders looking to enhance their market analysis. By leveraging multiple moving averages and customizable settings, traders can gain a clearer understanding of market trends and make more informed trading decisions.

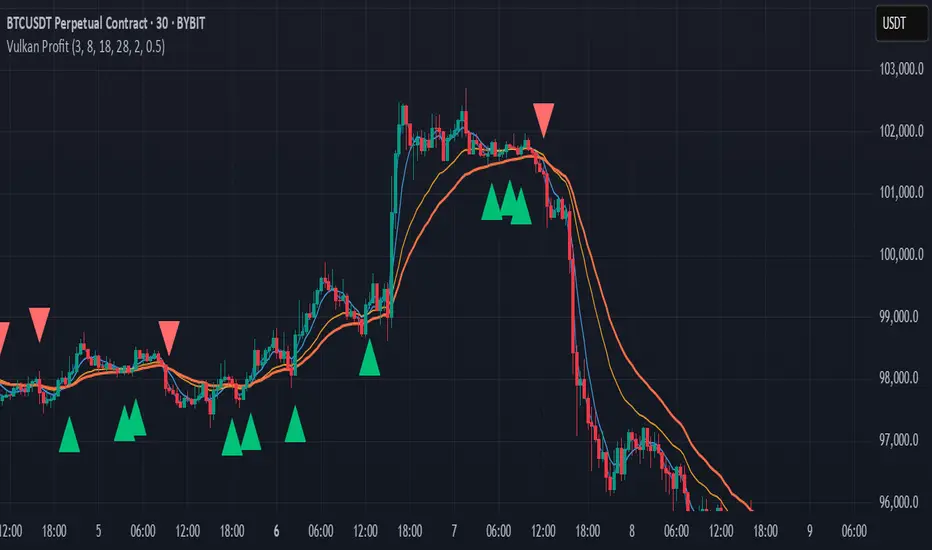
Vulkan Profit
Overview
The Vulkan Profit indicator is a trend-following tool that identifies potential entry and exit points by monitoring the relationship between short-term and long-term moving averages. It generates clear buy and sell signals when specific moving average conditions align, making it useful for traders looking to confirm trend changes across multiple timeframes.
How It Works
The indicator utilizes four different moving averages:
Fast WMA (period 3) - A highly responsive weighted moving average
Medium WMA (period 8) - A less sensitive weighted moving average
Fast EMA (period 18) - A responsive exponential moving average
Slow EMA (period 28) - A slower exponential moving average
These moving averages are grouped into two categories:
Short-term MAs: Fast WMA and Medium WMA
Long-term MAs: Fast EMA and Slow EMA
Signal Generation Logic
The Vulkan Profit indicator generates signals based on the relative positions of these moving averages:
Buy Signal (Green Triangle)
A buy signal appears when the minimum value of the short-term MAs becomes greater than the maximum value of the long-term MAs. In other words, when both short-term MAs cross above both long-term MAs.
Sell Signal (Red Triangle)
A sell signal appears when the maximum value of the short-term MAs becomes less than the minimum value of the long-term MAs. In other words, when both short-term MAs cross below both long-term MAs.
Visual Components
Moving Averages - All four moving averages can be displayed or hidden
Signal Arrows - Green triangles for buy signals, red triangles for sell signals
Colored Line - A line that changes color based on the current market stance (green for bullish, red for bearish)
Customization Options
The indicator offers several customization settings:
Toggle the visibility of moving averages
Toggle the visibility of buy/sell signals
Adjust the color, width, and position of the signal line
Choose between different line styles (Line, Stepline, Histogram)
Practical Trading Applications
Trend Identification: The relative positioning of all moving averages helps identify the current market trend
Entry/Exit Points: The buy and sell signals can be used as potential entry and exit points
Trend Confirmation: The colored line provides ongoing confirmation of the trend direction
Filter: Can be used in conjunction with other indicators as a trend filter
Trading Strategy Suggestions
Trend Following: Enter long positions on buy signals and exit on sell signals during trending markets
Confirmation Tool: Use the signals to confirm trades identified by other indicators
Timeframe Analysis: Apply the indicator across multiple timeframes for stronger confirmation
Risk Management: Place stop-loss orders below recent swing lows for long positions and above recent swing highs for short positions
Tips for Best Results
The indicator performs best in trending markets and may generate false signals in ranging or highly volatile markets
Consider the broader market context before taking trades based solely on these signals
Use appropriate position sizing and risk management regardless of the indicator's signals
The longer timeframes generally produce more reliable signals with fewer false positives
The Vulkan Profit indicator combines the responsiveness of short-term averages with the stability of long-term averages to capture significant trend changes while filtering out minor price fluctuations.
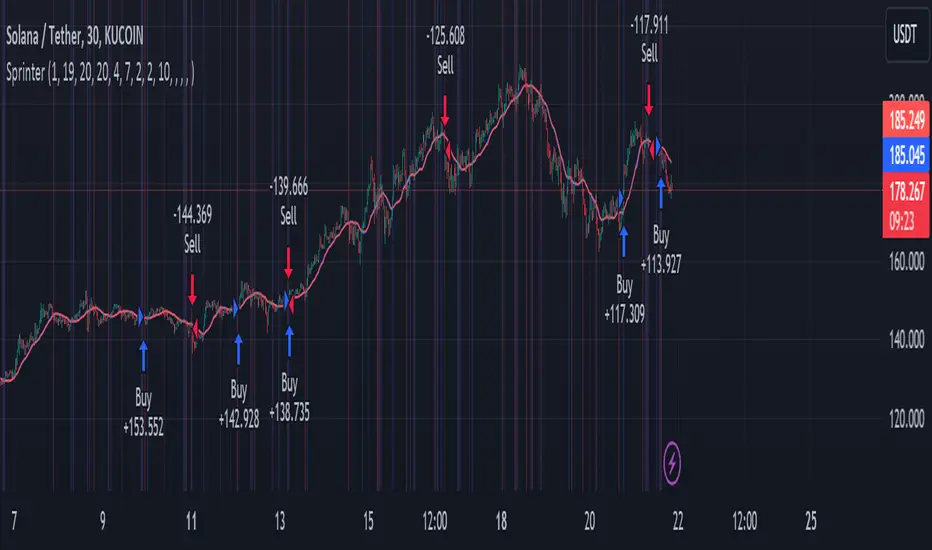
Big RunnerPresenting the "Big Runner" technique, dubbed "Sprinter," which is intended to help traders looking for momentum chances recognise important market swings. This approach maximises profit potential while controlling risk by using trend ribbons and moving averages to identify entry and exit locations.
Important characteristics:
Moving Averages: To determine the direction of the underlying trend, moving averages, both rapid and slow, are used. Depending on their preferred trading strategy, traders can alter the duration of these averages.
Trend Ribbon: Shows phases of bullish and bearish momentum by using a ribbon indicator to visualise the strength of the trend. Trend transitions are simple to spot for traders so they can make wise decisions.
Buy and Sell Signals: This tool generates buy and sell signals that indicate possible entry and exit opportunities based on the crossing and crossunder of moving averages.
Stop Loss/Take Profit Management: This feature enables traders to successfully apply risk management methods by giving them the ability to set stop loss and take profit levels as a percentage of the entry price.
Dynamic Position Sizing: Optimises capital allocation for every trade by dynamically calculating position size depending on leverage and portfolio proportion.
Implementation:
Long Entry: Started when a bullish trend is indicated by a price cross above the fast and slow moving averages. To control risk and lock in earnings, stop loss and take profit thresholds are established appropriately.
Short Entry: Indicates a bearish trend when the price crosses below both moving averages. The concepts of risk management are similar, with dynamic calculations used to determine take-profit and stop-loss levels.
Extra Personalisation:
Take Profit/Stop Loss Management: Provides the ability to select a take profit and stop loss
API Integration: This feature improves execution flexibility and efficiency by enabling traders to include custom parameters for automated trading.
Notice:
Trading entails risk, and performances in the past do not guarantee future outcomes. Before making any trades with this approach, careful analysis and risk management are necessary.
In summary:
By integrating risk management procedures with technical indicators, the "Big Runner" strategy provides a thorough method for identifying noteworthy market changes and achieving the best possible trading results. Traders can adjust parameters to suit their interests and style of trading, giving them the confidence to traverse volatile market situations.
Hull MA with Alerts and LabelsThis script is designed to help traders visually track market trends using various types of moving averages (MAs) and to receive alerts when certain conditions are met. Here’s a detailed breakdown of how the script works:
1. User Inputs and Customization:
MA Length: Traders can define the length of the moving average (default is 100).
Confirmation Candles: The trader can specify how many candles must confirm a trend before the script triggers a signal (default is 1).
MA Variation: The trader can choose between different moving average types: Simple Moving Average (SMA), Exponential Moving Average (EMA), Weighted Moving Average (WMA), or Hull Moving Average (HMA).
Source: Traders select the price source for the moving average calculation (e.g., close price).
Ribbon Transparency: Allows control over the transparency level of the ribbon plotted between the moving averages.
Bullish/Bearish Ribbon Colors: The user can choose the colors for bullish and bearish trends.
2. Moving Average Calculations:
The script provides multiple options for calculating moving averages:
SMA (Simple Moving Average)
EMA (Exponential Moving Average)
WMA (Weighted Moving Average)
HMA (Hull Moving Average)
For the Hull Moving Average (HMA), it uses a specific formula that smoothens the movement and reduces lag, which is helpful for more reactive trend detection.
3. Plotting Moving Averages and Trend Ribbon:
The script calculates two key moving averages:
MHULL: The main moving average, selected based on the user’s chosen MA variation and source.
SHULL: A shifted version of the MHULL to help compare trends (shifted by 2 bars).
These two moving averages are plotted on the chart for visualization. MHULL is plotted in green (or another color if changed), while SHULL is plotted in red. A ribbon is drawn between MHULL and SHULL to indicate trends visually. The ribbon changes color depending on whether the trend is bullish (MHULL > SHULL) or bearish (MHULL < SHULL). The ribbon’s transparency can be adjusted for visual clarity.
4. Trend Detection:
Bullish Trend: The script checks if the price has closed above MHULL for the defined number of confirmation candles. If confirmed, a bullish trend is detected.
Bearish Trend: Similarly, the script checks if the price has closed below SHULL for the confirmation period, indicating a bearish trend.
The script tracks whether the market is in a bullish or bearish trend and prevents repeated signals by remembering the current trend state.
5. Alerts and Labels:
Bullish Alerts and Labels: When a confirmed bullish trend is detected (i.e., price closes above MHULL for the entire confirmation period and MHULL > SHULL), the script triggers an alert notifying the trader of the bullish condition. A "BULLISH" label is placed on the chart near the low of the candle where the trend was confirmed.
Bearish Alerts and Labels: If a confirmed bearish trend is detected (i.e., price closes below SHULL for the confirmation period and MHULL < SHULL), the script triggers an alert for the bearish condition. A "BEARISH" label is placed on the chart near the high of the candle where the trend was confirmed.
These alerts and labels help traders act quickly on trend changes and align their trading strategy with market conditions.
6. Practical Use for Traders:
For traders, this script offers:
Customizability : It allows traders to define the length and type of moving averages, choose price sources, and control how signals are confirmed.
Visual Trend Representation : The plotted MA lines and colored ribbons help traders easily see market direction.
Early Warnings : With alerts and labels, the script gives traders early signals when trends are shifting, allowing them to adjust positions accordingly.
Trend Confirmation : The script waits for a user-defined number of confirmation candles before signaling a new trend, reducing false signals.
Overall, the script helps traders automate their strategy by tracking moving averages and alerting them when key trend conditions are met.

ATR Bands with Optional Risk/Reward Colors█ OVERVIEW
This indicator projects ATR bands and, optionally, colors them based on a risk/reward advantage for those who trade breakouts/breakdowns using moving averages as partial or full exit points.
█ DEFINITIONS
► True Range
The True Range is a measure of the volatility of a financial asset and is defined as the maximum difference among one of the following values:
- The high of the current period minus the low of the current period.
- The absolute value of the high of the current period minus the closing price of the previous period.
- The absolute value of the low of the current period minus the closing price of the previous period.
► Average True Range
The Average True Range was developed by J. Welles Wilder Jr. and was introduced in his 1978 book titled "New Concepts in Technical Trading Systems". It is calculated as an average of the true range values over a certain number of periods (usually 14) and is commonly used to measure volatility and set stop-loss and profit targets (1).
For example, if you are looking at a daily chart and you want to calculate the 14-day ATR, you would take the True Range of the previous 14 days, calculate their average, and this would be the ATR for that day. The process is then repeated every day to obtain a series of ATR values over time.
The ATR can be smoothed using different methods, such as the Simple Moving Average (SMA), the Exponential Moving Average (EMA), or others, depending on the user's preferences or analysis needs.
► ATR Bands
The ATR bands are created by adding or subtracting the ATR from a reference point (usually the closing price). This process generates bands around the central point that expand and contract based on market volatility, allowing traders to assess dynamic support and resistance levels and to adapt their trading strategies to current market conditions.
█ INDICATOR
► ATR Bands
The indicator provides all the essential parameters for calculating the ATR: period length, time frame, smoothing method, and multiplier.
It is then possible to choose the reference point from which to create the bands. The most commonly used reference points are Open, High, Low, and Close, but you can also choose the commonly used candle averages: HL2, HLC3, HLCC4, OHLC4. Among these, there is also a less common "OC2", which represents the average of the candle body. Additionally, two parameters have been specifically created for this indicator: Open/Close and High/Low.
With the "Open/Close" parameter, the upper band is calculated from the higher value between Open and Close, while the lower one is calculated from the lower value between Open and Close. In the case of bullish candles, therefore, the Close value is taken as the starting point for the upper band and the Open value for the lower one; conversely, in bearish candles, the Open value is used for the upper band and the Close value for the lower band. This setting can be useful for precautionally generating broader bands when trading with candlesticks like hammers or inverted hammers.
The "High/Low" parameter calculates the upper band starting from the High and the lower band starting from the Low. Among all the available options, this one allows drawing the widest bands.
Other possible options to improve the drawing of ATR bands, aligning them with the price action, are:
• Doji Smoothing: When the current candle is a doji (having the same Open and Close price), the bands assume the values they had on the previous candle. This can be useful to avoid steep fluctuations of the bands themselves.
• Extend to High/Low: Extends the bands to the High or Low values when they exceed the value of the band.
• Round Last Cent: Expands the upper band by one cent if the price ends with x.x9, and the lower band if the price ends with x.x1. This function only works when the asset's tick is 0.01.
► Risk/Reward Advantage
The indicator optionally colors the ATR bands after setting a breakpoint, one or two risk/reward ratios, and a series of moving averages. This function allows you to know in advance whether entering a trade can provide an advantage over the risk. The band is colored when the ratio between the distance from the break point to the band and the distance from the break point to the first available moving average reaches at least the set ratio value. It is possible to set two colorings, one for a minimum risk/reward ratio and one for an optimal risk/reward ratio.
The break point can be chosen between High/Low (High in case of breakout, Low in case of breakdown) or Open/Close (on breakouts, Close with bullish candles or Open with bearish candles; on breakdowns, Close with bearish candles or Open with bullish candles).
It is possible to choose up to 10 moving averages of various types, including the VWAP with the Anchor Period (2).
Depending on the "Price to MA" setting, the bands can be individually or simultaneously colored.
By selecting "Single Direction," the risk/reward calculation is performed only when all moving averages are above or below the break point, resulting in only one band being colored at a time. For this reason, when the break point is in between the moving averages, the calculation is not executed. This setting can be useful for strategies involving price movement from a level towards a series of specific moving averages (for example, in reversals starting from a certain level towards the VWAP with possible partial take profits on some previous moving averages, or simply in trend following towards one or more moving averages).
Choosing "Both Directions" the risk/reward ratio is calculated based on the first available moving averages both above and below the price. This setting is useful for those who operate in range bound markets or simply take advantage of movements between moving averages.
█ NOTE
This script may not be suitable for scalping strategies that require immediate entries due to the inability to know the ATR of a candle in advance until its closure. Once the candle is closed, you should have time to place a stop or stop-limit order, so your strategy should not anticipate an immediate start with the next candle. Even more conveniently, if your strategy involves an entry on a pullback, you can place a limit order at the breakout level.
(1) www.tradingview.com
(2) For convenience, the code for the Anchor Period has been entirely copied from the VWAP code provided by TradingView.

[blackcat] L1 Magic Moving AverageThis is a code snippet written in the Pine programming language for TradingView platform. It is an implementation of a custom technical indicator called "L1 Magic Moving Average".
Moving averages are widely used in technical analysis to identify trends and reversals in the price of an asset. The idea behind moving averages is to smooth out the price data by calculating the average price over a certain period of time. This helps to filter out the noise in the price data and provides a clearer picture of the underlying trend.
The Magic Moving Average (MMA) is a custom moving average that is calculated using a combination of three different types of moving averages: simple moving average (SMA), exponential moving average (EMA), and weighted moving average (WMA). The MMA is designed to be more responsive to changes in the price of an asset compared to traditional moving averages.
The code starts by defining the input parameters for the indicator. The length parameter determines the number of periods used for calculating the moving averages. The source parameter specifies the price data used to calculate the moving averages. Finally, the smoothness parameter adjusts the weighting of the WMA component of the MMA.
Once the input parameters are defined, the code calculates the MMA by adding the SMA, EMA, and WMA components. The SMA and EMA components are calculated using the standard functions provided by TradingView. The WMA component is calculated using a custom function that takes into account the smoothness parameter.
After the MMA is calculated, the code plots it on the chart as two lines, one for the current value and one for the previous value. The two lines are then filled with colors depending on the position of the current MMA relative to its previous value. If the current value is higher than the previous value, the plot is filled with yellow color, otherwise, it is filled with fuchsia color.
In addition to the plot, the code also includes logic for generating buy and sell signals based on the crossover of the MMA and its previous value. If the MMA crosses above its previous value, a buy signal is generated. Conversely, if the MMA crosses below its previous value, a sell signal is generated. When a signal is generated, an alert is triggered to notify the user.
Finally, the code also includes labels for the generated signals. When a buy signal is generated, a green "B" label is placed at the bottom of the candle. Similarly, when a sell signal is generated, a red "S" label is placed at the top of the candle. These labels help the user to quickly identify the signals on the chart.
Overall, this code provides a simple yet effective way of generating trading signals based on the Magic Moving Average. By using a combination of different types of moving averages, the indicator is able to capture different aspects of the price movement and generate signals that are more reliable. The flexibility of the input parameters also allows the user to adjust the indicator to their specific trading needs.

Momentum Cloud.V33🌟 Introducing MomentumCloud.V33 🌟
MomentumCloud.V33 is a cutting-edge indicator designed to help traders capture market momentum with clarity and precision. This versatile tool combines moving averages, directional movement indexes (DMI), and volume analysis to provide real-time insights into trend direction and strength. Whether you’re a scalper, day trader, or swing trader, MomentumCloud.V33 adapts to your trading style and timeframe, making it an essential addition to your trading toolkit. 📈💡
🔧 Customizable Parameters:
• Moving Averages: Adjust the periods of the fast (MA1) and slow (MA2) moving averages to fine-tune your trend analysis.
• DMI & ADX: Customize the DMI length and ADX smoothing to focus on strong, actionable trends.
• Volume Multiplier: Modify the cloud thickness based on trading volume, emphasizing trends with significant market participation.
📊 Trend Detection:
• Color-Coded Clouds:
• Green Cloud: Indicates a strong uptrend, suggesting buying opportunities.
• Red Cloud: Indicates a strong downtrend, signaling potential short trades.
• Gray Cloud: Reflects a range-bound market, helping you avoid low-momentum periods.
• Dynamic Volume Integration: The cloud thickness adjusts dynamically with trading volume, highlighting strong trends supported by high market activity.
📈 Strength & Momentum Analysis:
• Strength Filtering: The ADX component ensures that only strong trends are highlighted, filtering out market noise and reducing false signals.
• Visual Momentum Gauge: The cloud color and thickness provide a quick visual representation of market momentum, enabling faster decision-making.
🔔 Alerts:
• Custom Alerts: Set up alerts for when the trend shifts or reaches critical levels, keeping you informed without needing to constantly monitor the chart.
🎨 Visual Enhancements:
• Gradient Cloud & Shadows: The indicator features a gradient-filled cloud with shadowed moving averages, enhancing both aesthetics and clarity on your charts.
• Adaptive Visual Cues: MomentumCloud.V33’s color transitions and dynamic thickness provide an intuitive feel for the market’s rhythm.
🚀 Quick Guide to Using MomentumCloud.V33
1. Add the Indicator: Start by adding MomentumCloud.V33 to your chart. Customize the settings such as MA periods, DMI length, and volume multiplier to match your trading style.
2. Analyze the Market: Observe the color-coded cloud and its thickness to gauge market momentum and trend direction. The thicker the cloud, the stronger the trend.
3. Set Alerts: Activate alerts for trend changes or key levels to capture trading opportunities without needing to watch the screen continuously.
⚙️ How It Works:
MomentumCloud.V33 calculates market momentum by combining moving averages, DMI, and volume. The cloud color changes based on the trend direction, while its thickness reflects the strength of the trend as influenced by trading volume. This integrated approach ensures you can quickly identify robust market movements, making it easier to enter and exit trades at optimal points.
Settings Overview:
• Moving Averages: Define the lengths for the fast and slow moving averages.
• DMI & ADX: Adjust the DMI length and ADX smoothing to focus on significant trends.
• Volume Multiplier: Customize the multiplier to control cloud thickness, highlighting volume-driven trends.
📚 How to Use MomentumCloud.V33:
• Trend Identification: The direction and color of the cloud indicate the prevailing trend, while the cloud’s thickness suggests the trend’s strength.
• Trade Execution: Use the green cloud to look for long entries and the red cloud for short positions. The gray cloud advises caution, as it represents a range-bound market.
• Alerts: Leverage the custom alerts to stay on top of market movements and avoid missing critical trading opportunities.
Unleash the power of trend and momentum analysis with MomentumCloud.V33! Happy trading! 📈🚀✨

VIX, ATR, and Volatility Indicatorhere what the indictor do !
The "VIX, ATR, and Volatility Indicator" combines the Volatility Index (VIX), Average True Range (ATR), and moving averages to provide insights into market volatility.
VIX (Volatility Index):
The VIX measures the expected volatility in the market over the next 30 days. A higher VIX value indicates increased market volatility, while a lower value suggests lower volatility.
ATR (Average True Range):
The ATR is a technical indicator that measures the average range between high and low prices over a specified period. It provides a sense of the market's volatility by considering price movements. Higher ATR values indicate greater volatility, while lower values indicate lower volatility.
Moving Averages:
The indicator calculates both an Exponential Moving Average (EMA) and Simple Moving Average (SMA) with a specific period (e.g., 50).
Moving averages smooth out price data to identify trends and potential areas of support or resistance.
Volatility Detection:
By comparing the current closing price to the EMA and SMA, the indicator determines if there is high volatility.
If the current closing price is higher than either the EMA or SMA, it indicates potential high volatility.
Visualization:
The VIX and ATR are typically plotted on the chart, providing a visual representation of market volatility and price range.
Additionally, markers or labels may be used to highlight periods of high volatility when the current price exceeds the moving averages.
what are the VIX and ATR
Volatility Index (VIX):
Monitor the VIX value from financial platforms or market data providers. A higher VIX value indicates increased market volatility, suggesting potential trading opportunities. Conversely, a lower VIX value indicates lower volatility, which may influence your trading strategy.
Average True Range (ATR):
Calculate the ATR manually or use charting platforms that provide ATR as an indicator.
Plot the ATR on your trading chart to visualize the range of price movements.
Determine suitable entry and exit points based on ATR values. For example, higher ATR values may indicate larger potential price swings, while lower ATR values may suggest a more stable market.
how it work
Fetching VIX Data:
The request.security function is used to fetch the daily VIX data from the "CBOE:VIX" symbol. It retrieves the closing price of the VIX for each day.
Calculating ATR:
The ta.atr function calculates the Average True Range (ATR) with a period of 14. ATR measures the average range between the high and low prices over the specified period, providing an indication of market volatility.
Calculating Moving Averages:
Two types of moving averages are calculated: Exponential Moving Average (EMA) and Simple Moving Average (SMA). Both moving averages are calculated using a period of 50, but you can adjust the period as needed.
The ta.ema function calculates the Exponential Moving Average, which places greater weight on recent prices.
The ta.sma function calculates the Simple Moving Average, which gives equal weight to all prices in the period.
Identifying High Volatility:
The indicator determines if there is high volatility by comparing the current closing price to both the EMA and SMA.
If the current closing price is higher than either the EMA or SMA, the isHighVolatility variable is set to true, indicating potential high volatility.
Plotting the Indicators:
The VIX and ATR are plotted using the plot function, assigning colors and line widths for visual differentiation.
The plotshape function is used to plot markers below the bars to indicate highly volatile periods. The isHighVolatility variable determines when the markers appear.

Advanced BB Bands with PlotThis code implements an advanced version of Bollinger Bands with additional moving averages, ATR-based bands, step lines, market direction indicators, and real-time data display. Here’s a breakdown of the functionality:
1. Inputs and Parameters:
length: The base period used for calculating the moving averages and the typical price.
atr_length: The length used for calculating the Average True Range (ATR).
step_length: The period for calculating step lines (highest high and lowest low over a given period).
2. Core Calculations:
Typical Price: (high + low + close) / 3 is the base for the moving averages.
ATR: ta.atr(atr_length) is used to create dynamic bands around the moving averages.
PL Dot: An average of the typical prices from the current and past two bars. This provides a short-term trend indicator.
3. Multiple Moving Averages (MAs):
Three simple moving averages (ma1, ma2, ma3) are calculated using different multiples of the base length. These help indicate short-, mid-, and long-term trends.
4. Step Lines:
Step Up: Highest close over the step_length.
Step Down: Lowest close over the step_length. These act as short-term support and resistance levels.
5. Outer Bands:
Upper Band: ma1 + 2 * ATR, an upper boundary based on ATR volatility.
Lower Band: ma1 - 2 * ATR, a lower boundary. Together, these form a dynamic range around the short-term moving average.
6. Market Direction:
Bullish or Bearish condition is determined by comparing ma1 and ma2. If ma1 is above ma2, the market is bullish; otherwise, it's bearish. This decision is displayed on the TradingView chart using a table.
7. Visual Elements:
Moving Averages (ma1, ma2, ma3): Plotted in different colors (blue, purple, white) to indicate different timeframes.
PL Dot: A step line plot for the PL Dot, which helps in spotting short-term trends.
Step Lines: Step-up and step-down levels plotted in lime and red, respectively.
Outer Bands: Upper and lower ATR-based bands plotted in aqua, with a filled region between the bands for easy visualization of price volatility.
Candlestick Coloring: Green bars for bullish and red for bearish price action.
8. Real-Time Board Display:
A table is created in the top-right corner of the chart to display:
The current closing price.
The market direction ("Bullish" or "Bearish").
The PL Dot value. The table updates on the most recent bar (barstate.islast).
9. Dynamic Labels:
On the most recent bar, labels are added dynamically to the upper and lower bands and the ma1. These labels help in identifying the values of key indicators directly on the chart.
10. Signals and Alerts:
Bullish and Bearish Cross: Visual signals are plotted on the chart when ma1 crosses above or below ma2. These are represented as up and down triangles, providing potential buy/sell signals.
Key Features Summarized:
Multi-Timeframe Moving Averages: 3 MAs based on different timeframes.
Dynamic ATR Bands: ATR-based upper and lower boundaries for volatility measurement.
Step Lines: Short-term high and low lines for support/resistance.
PL Dot: A short-term trend identifier.
Real-Time Dashboard: Live updates of price, trend, and PL Dot on the chart.
Visual Alerts: Dynamic labeling and crossover signals to assist in decision-making.
This script is designed for traders who want to track price movement within bands, evaluate trends across multiple timeframes, and visualize short-term market direction with dynamic alerts.

Varanormal Mac N Cheez Strategy v1Mac N Cheez Strategy (Set a $200 Take profit Manually)
It's super cheesy. Strategy does the following:
Here's a detailed explanation of what the entire script does, including its key components, functionality, and purpose.
1. Strategy Setup and Input Parameters:
Strategy Name: The script is named "NQ Futures $200/day Strategy" and is set as an overlay, meaning all elements (like moving averages and signals) are plotted on the price chart.
Input Parameters:
fastLength: This sets the length of the fast moving average. The user can adjust this value, and it defaults to 9.
slowLength: This sets the length of the slow moving average. The user can adjust this value, and it defaults to 21.
dailyTarget: The daily profit target, which defaults to $200. If set to 0, this disables the daily profit target.
stopLossAmount: The fixed stop-loss amount per trade, defaulting to $100. This value is used to calculate how much you're willing to lose on a single trade.
trailOffset: This value sets the distance for a trailing stop. It helps protect profits by automatically adjusting the stop-loss as the price moves in your favor.
2. Calculating the Moving Averages:
fastMA: The fast moving average is calculated using the ta.sma() function on the close price with a period length of fastLength. The ta.sma() function calculates the simple moving average.
slowMA: The slow moving average is also calculated using ta.sma() but with the slowLength period.
These moving averages are used to determine trend direction and identify entry points.
3. Buy and Sell Signal Conditions:
longCondition: This is the buy condition. It occurs when the fast moving average crosses above the slow moving average. The script uses ta.crossover() to detect this crossover event.
shortCondition: This is the sell condition. It occurs when the fast moving average crosses below the slow moving average. The script uses ta.crossunder() to detect this crossunder event.
4. Executing Buy and Sell Orders:
Buy Orders: When the longCondition is true (i.e., fast MA crosses above slow MA), the script enters a long position using strategy.entry("Buy", strategy.long).
Sell Orders: When the shortCondition is true (i.e., fast MA crosses below slow MA), the script enters a short position using strategy.entry("Sell", strategy.short).
5. Setting Stop Loss and Trailing Stop:
Stop-Loss for Long Positions: The stop-loss is calculated as the entry price minus the stopLossAmount. If the price falls below this level, the trade is exited automatically.
Stop-Loss for Short Positions: The stop-loss is calculated as the entry price plus the stopLossAmount. If the price rises above this level, the short trade is exited.
Trailing Stop: The trail_offset dynamically adjusts the stop-loss as the price moves in favor of the trade, locking in profits while still allowing room for market fluctuations.
6. Conditional Daily Profit Target:
The script includes a daily profit target that automatically closes all trades once the total profit for the day reaches or exceeds the dailyTarget.
Conditional Logic:
If the dailyTarget is greater than 0, the strategy checks whether the strategy.netprofit (total profit for the day) has reached or exceeded the target.
If the strategy.netprofit >= dailyTarget, the script calls strategy.close_all(), closing all open trades for the day and stopping further trading.
If dailyTarget is set to 0, this logic is skipped, and the script continues trading without a daily profit target.
7. Plotting Moving Averages:
plot(fastMA): This plots the fast moving average as a blue line on the price chart.
plot(slowMA): This plots the slow moving average as a red line on the price chart. These help visualize the crossover points and the trend direction on the chart.
8. Plotting Buy and Sell Signals:
plotshape(): The script uses plotshape() to add visual markers when buy or sell conditions are met:
"Long Signal": When a buy condition (longCondition) is met, a green marker is plotted below the price bar with the label "Long".
"Short Signal": When a sell condition (shortCondition) is met, a red marker is plotted above the price bar with the label "Short".
These markers help traders quickly see when buy or sell signals occurred on the chart.
In addition, triangle markers are plotted:
Green Triangle: Indicates where a buy entry occurred.
Red Triangle: Indicates where a sell entry occurred.
Summary of What the Script Does:
Inputs: The script allows the user to adjust moving average lengths, daily profit targets, stop-loss amounts, and trailing stop offsets.
Signals: It generates buy and sell signals based on the crossovers of the fast and slow moving averages.
Order Execution: It executes long positions on buy signals and short positions on sell signals.
Stop-Loss and Trailing Stop: It sets dynamic stop-losses and uses a trailing stop to protect profits.
Daily Profit Target: The strategy stops trading for the day once the net profit reaches the daily target (unless the target is disabled by setting it to 0).
Visual Markers: It plots moving averages and buy/sell signals directly on the main price chart to aid in visual analysis.
This script is designed to trade based on moving average crossovers, with robust risk management features like stop-loss and trailing stops, along with an optional daily profit target to limit daily trading activity. Let me know if you need further clarification or want to adjust any specific part of the script!

+ Ultimate MAWhat is the "Ultimate MA" exactly, you ask? Simple. It actually takes as its influence the Rex Dog Moving Average (which I have included as an MA in some of my other indicators), an invention by xkavalis that is simply an average of different length moving averages.
It's available for free on his account, so take a look at it.
I've recently become drawn to using fibonacci sequence numbers as lookbacks for moving averages, and they work really well (I'm honestly beginning to think the number doesn't matter).
You can see where this is going. The Ultimate MA is an average of several (eight) moving averages of varying lengths (5 - 144) all of fibonacci numbers. Sounds pretty basic, right? That's not actually the case, however.
If you were to take all these numbers, add them up, then average them by eight you'd get ~46. Now, stick a 46 period moving average on the chart and compare it to this one and see what you get. They track price very differently. Still, this all sort of sounds like I'm copying the RDMA, which isn't a sin in itself but is hardly grounds for releasing a new MA into the wild.
The actual initial problem I wanted to tackle was how to take in to account for the entire range of price action in a candle in a moving average. ohlc4 sort of does this, but it's still just one line that is an average of all these prices, and I thought there might be a better way not claiming that what I came upon is, but I like it).
My solution was to plot two moving averages: one an average of price highs, and the other an average of lows, thus creating a high/low price channel. Perhaps this is not a new thing at all. I don't know. This is just an idea I had that I figured I could implement easily enough.
Originally I had just applied this to a 21 period EMA, but then the idea sort of expanded into what you see here. I kept thinking "is 21 the best?" What about faster or slower? Then I thought about the RDMA and decided on this implimentation.
Further, I take the high and low moving averages and divide them by two in order to get a basis. You can turn all this stuff on or off, though I do like the default settings.
After that I wanted to add bands to it to measure volatility. There is an RDMA version that utilizes ATR bands, but I could never find myself happy with these.
I just wanted something... else. I also, actually made my own version of xkavalis' RDMA bands with some of the extra stuff I included here, but obviously didn't feel comfortable releasing it as an indicator as I hadn't changed it enough significantly in my mind to fairly do so. I eventually settled on Bollinger Bands as an appropriate solution to apply to the situation. I really like them. It took some fiddling because I had to create a standard deviation for both the high and low MAs instead of just one, and then figure out the best combination of moving averages and standard deviations to add and subtract to get the bands right.
Then I decided I wanted to add a few different moving averages to choose from instead of just an EMA even though I think it's the "best." I didn't want to make things too complicated, so I just went with the standards--EMA, SMA, WMA, HMA-- + 1, the ALMA (which gives some adjustability with its offset and sigma).
Also, you can run more than one moving average at a time (try running an HMA with a slower one).
Oh yeah, the bands? You can set them, in a dropdown box, to be based on which ever moving average you want.
Furthermore, this is a multi-timeframe indicator, so if you want to run it on a higher time frame than the one you are trading on, it's great for that.
ALSO, I actually have the basis color setup as multi-timeframe. What this means is that if you are looking at an hourly chart, you can set the color to a 4h (or higher) chart if you want, and if the current candle is above or below the previous close of the basis on that higher timeframe you will know simply by looking at the color of it ((while still being on the hourly chart). It's just a different way of utilizing higher timeframe information, but without the indicator itself plotted as higher timeframe.
I'm nearly finished. Almost last thing is a 233 period moving average. It's plotted as an average of the SMA, EMA, and Kijun-sen.
Lastly, there are alerts for price crossing the inner border of the bands, or the 233 MA.
Below is a zoomed in look at a chart.
Much credit and gratitude to xkavalis for coming up with the idea of an average of moving averages.
Pullback Entry Zone FinderPullback Entry Zone Finder
Overview:
This indicator is designed to help traders identify potential buying opportunities during short-term pullbacks, particularly when faster-moving averages show signs of converging back towards slower ones. It visually flags potential zones where price might find support and resume its upward movement, based on moving average dynamics and price proximity.
How It Works:
The indicator utilizes four customizable moving averages (Trigger, Short-term, Intermediate, and Long-term) and Average True Range (ATR) to pinpoint specific conditions:
Pullback Detection: It identifies when the fast 'Trigger MA' is below the 'Short-term MA', indicating a potential short-term pullback or consolidation phase.
MA Convergence: Crucially, it looks for signs that the pullback might be weakening by detecting when the gap between the Short-term MA and the Trigger MA is narrowing (maConverging). This suggests the faster average is starting to catch up, potentially preceding a move back up.
Base Buy Zone (Orange Diamond): This signal appears when both the Pullback and Convergence conditions are met simultaneously. It indicates the general area where conditions are becoming favourable for a potential entry.
Refined Entry Zones:
Prime Entry Zone (Green Diamond): This appears within a Base Buy Zone if the bar's low comes within a specified percentage (Max Distance %) of the Short-term MA. It suggests price has pulled back close to the dynamic support of the Short MA.
ATR Entry Zone (Purple Diamond): This appears within a Base Buy Zone if the bar's low comes within the specified percentage (Max Distance %) of an ATR-based target level. This target level (Buy ATR Target Level, plotted as a purple line when active) is calculated by adding a multiple (ATR Multiplier %) of the ATR to the Short-term MA, providing a volatility-adjusted potential entry area.
Visual Elements:
Moving Averages: Four lines representing the Trigger, Short-term, Intermediate, and Long-term MAs (colors and opacity are customizable). Use the Intermediate and Long-term MAs to gauge the broader market trend.
Orange Diamond (Below Bar): Indicates a 'Base Buy Zone' where a pullback and MA convergence are detected.
Green Diamond (Below Bar): Indicates a 'Prime Entry Zone' where price is close to the Short-term MA during a Base Buy Zone.
Purple Diamond (Below Bar): Indicates an 'ATR Entry Zone' where price is close to the ATR-based target level during a Base Buy Zone.
Purple Line: Plots the calculated 'Buy ATR Target Level' only when the Base Buy Zone condition is active.
Input Parameters:
Moving Averages: Customize the Length and Type (EMA, SMA, WMA, VWMA) for all four moving averages.
ATR Settings: Adjust the ATR Length, the ATR Multiplier % (for calculating the target level), and the Max Distance % (for triggering the Prime and ATR Entry Zones).
Visualization: Set the colors for the four Moving Average lines.
How to Use:
Look for the Orange Diamond as the initial signal that pullback/convergence conditions are met.
The Green and Purple Diamonds suggest price has reached potentially more optimal entry levels within that zone, based on proximity to the Short MA or the ATR target, respectively.
Always consider the signals within the context of the broader trend, indicated by the Intermediate and Long-term MAs. This indicator is generally more effective when used to find entries during pullbacks within an established uptrend (e.g., Intermediate MA > Long MA).
Combine these signals with other forms of analysis, such as chart patterns, support/resistance levels, volume analysis, or other indicators for confirmation.
Disclaimer:
You should always use proper risk management techniques and conduct your own analysis before making any trading decisions. This indicator, or any other, will be of no use if you don't have good risk management.

Grease Trap V1.0The Grease Trap V1.0 indicator is a dynamic, Fibonacci-based strategy that calculates unique moving averages to generate trading signals. Below is an overview of its main components and functionality:
How It Works
Fibonacci Grouped Averages:
Dynamic Fibonacci Sequence:
The indicator uses a custom function that dynamically builds a Fibonacci sequence. The user can set the number of Fibonacci elements for two separate calculations:
One for the Indicator Average (default: 9 elements).
One for the Base Average (default: 14 elements).
Grouped Averaging:
Using these Fibonacci numbers, the script groups historical closing prices into segments. For each group (with a length determined by a Fibonacci number), it computes an average. These individual group averages are then averaged together to produce a single dynamic average.
Plotting and Visual Cues:
Two Lines:
The indicator plots two lines on the chart:
Primary Dynamic Fibonacci Grouped Average
Base Dynamic Fibonacci Grouped Average
Color Coding:
The colors of these lines change based on their relationship to the current high price and to each other. For example, if the primary average is above the high or crosses above the base average, it might be shown in green or yellow, whereas certain conditions trigger red, signaling caution.
Crossover Dots:
When the primary average crosses above the base (a bullish signal), a green dot is plotted. Conversely, when it crosses below (a bearish signal), a red dot is displayed. These dots help visually pinpoint the moments of potential trade entry or exit.
Trading Signals and Orders:
Buy Signal:
Triggered when the primary average crosses above the base average. On a buy signal:
If in a short position, it closes that position.
Then, it enters a long position.
Sell Signal:
Triggered when the primary average crosses below the base average. On a sell signal:
If in a long position, it closes that position.
Then, it enters a short position.
Profit Target Management:
The indicator includes automated profit management:
For long positions, it sets an exit order when the price rises by a user-defined percentage (default: 2%).
For short positions, it sets an exit order when the price falls by a similar percentage.
Alerts:
The script is equipped with alert conditions. Traders receive notifications whenever a buy or sell signal is generated, helping them stay on top of potential trading opportunities.
Customization
User Inputs:
Traders can adjust:
The number of Fibonacci elements for each average calculation.
Profit target percentages for both long and short positions.
Data Length Requirement:
The script ensures it uses at least 200 data points (or the total number of available bars, whichever is greater) for a robust calculation of the averages.
In Summary
The Grease Trap V1.0 indicator combines the mathematical elegance of Fibonacci sequences with dynamic grouped averaging. It offers:
Innovative Moving Averages: Based on Fibonacci groupings of historical price data.
Clear Visual Cues: Through color-coded lines and crossover dots.
Automated Trading Actions: With built-in order management and profit targets.
Alert Notifications: So traders are instantly aware of key market signals.
This makes the Grease Trap V1.0 a comprehensive tool for both signal generation and automated strategy execution, suitable for traders looking to integrate Fibonacci principles into their trading systems.
