High/low crypto strategy with MACD/PSAR/ATR/EWaveToday I am glad to bring you another great creation of mine, this time suited for crypto markets.
MARKET
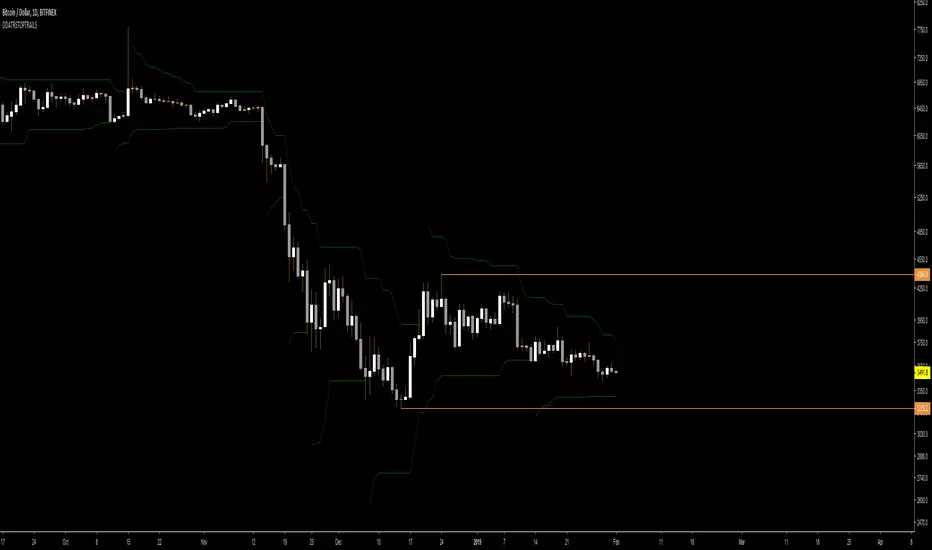
Its a high and low strategy, designed for crypto markets( btcusd , btcusdt and so on), and suited for for higher time charts : like 1hour, 4hours, 1 day and so on.
Preferably to use 1h time charts.
COMPONENTS
Higher high and lower low between different candle points
MACD with simple moving average
PSAR for uptrend and downtrend
Trenddirection made of a modified moving average and ATR
And lastly elliot wave oscillator to have an even better precision for entries and exits.
ENTRY DESCRIPTION
For entries we have : when the first condition is meet(we have a succession on higher high or lower lows), then we check the macd histogram level, then we pair that with psar for the direction of the trend, then we check the trend direction based on atr levels with MA applied on it and lastly to confirm the direction we check the level of elliot wave oscillator. If they are all on the same page we have a short or a long entry.
STATS
Its a low win percentage , we usually have between 10-20% win rate, but at the same time we use a 1:30 risk reward ratio .
By this we achieve an avg profit factor between 1.5- 2.5 between different currencies.
RISK MANAGEMENT
In this example, the stop loss is 0.5% of the price fluctuation ( 10.000 -> 9950 our sl), and tp is 15% (10.000 - > 11500).
In this example also we use a 100.000 capital account, risking 5% on each trade, but since its underleveraged, we only use 5000 of that ammount on every trade. With leveraged it can be achieved better profits and of course at the same time we will encounter bigger losses.
The comission applied is 5$ and a slippage of 5 points aswell added.
For any questions or suggestions regarding the script , please let me know.
"atr" için komut dosyalarını ara

Trailing Stop LossTrailing stop loss indicator to determine when to exit a position.
Multiple trailing stop loss calculation techniques are implemented:
ATR: Determines stop loss using a gap from recent highest value, that gap is defined by the ATR value and a multiplier
MA: Just a simple moving average used as a stop-loss
Percentage: Uses a percentage of the price
The script also implements alerting to be notified when the stop loss price is reached.

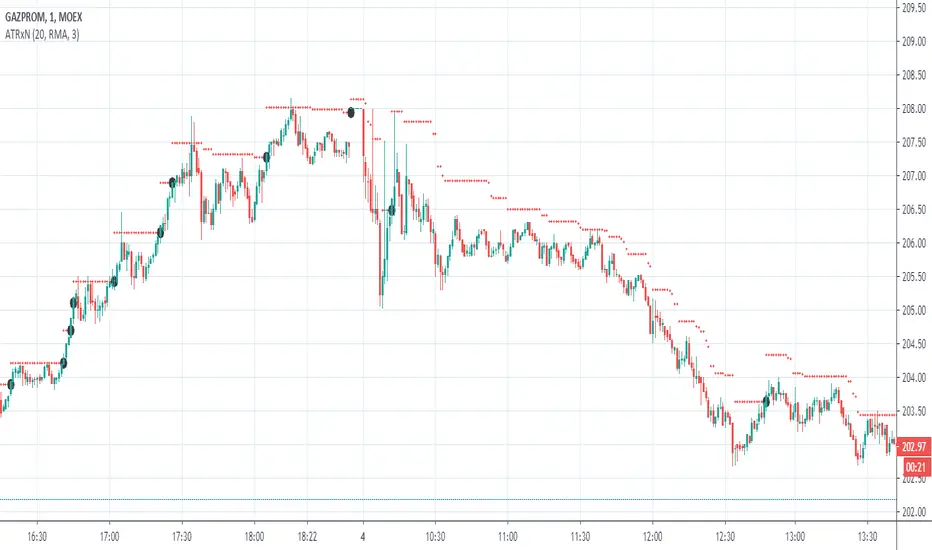
ATRxNIndacator shows price range calculated as previous closing price +/- ATR * multiplier
Setup options: multiplier, average type (RMA, EMA,SMA,WMA), Source and number of point to average
Индикатор показывает диапазон цен рассчитанный как цена предыдущего закрытия +/- ATR * множитель
Настраивается : Множитель, тип усреднения (RMA, EMA,SMA,WMA), Источник и Длина усреднения
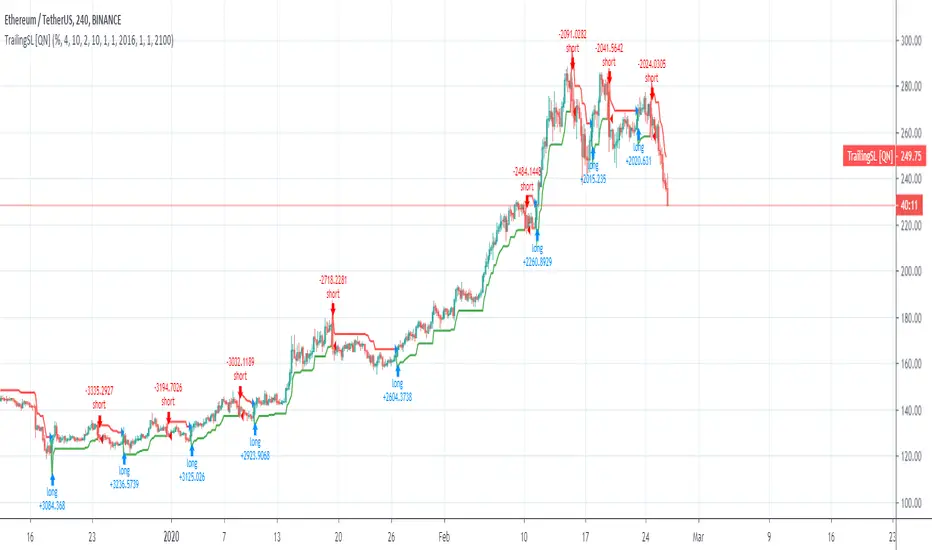
Trailing SL Strategy [QuantNomad]I'm a big fan of simple strategies.
This one is a very simple one. So it consists only from one Trailing SL. When SL is hit, the position is reversed and SL is tracked for a new position.
You can choose one of 3 types of SL:
% of your price
ATR - it is calculated as current ATR * multiplier
Absolute
As you can see even this simple strategy can show pretty good results.
BEST Supertrend MAHello traders,
That one is an experiment
I was curious to see what a supertrend based on moving average cross could give
How does it work?
Bull event: fast moving average crossing over the slow moving average
Bear event: fast moving average crossing under the slow moving average
When the event is triggered, the script will plot the Supertrend as follow
UP Trend = ohlc4+ ATR * Factor
DOWN Trend = ohlc4- ATR * Factor
Interesting to see the results given by ohlc4 vs hl2 and hl3
Documentation: www.tradingview.com
This is an alternative of the classical Supertrend based on candle close being above/beyond the previous Supertrend level.
Hope you'll enjoy it and it will improve your trading making you a better trader
Dave

BEST Supertrend CCIHello traders
Today I present you a Supertrend not based on candle close but based on a CCI (Commodity Channel Index)
How does it work?
Bull event: CCI crossing over the 0 line
Bear event: CCI crossing below the 0 line
When the event is triggered, the script will plot the Supertrend as follow
UP Trend = High + ATR * Factor
DOWN Trend = Low - ATR * Factor
This is an alternative of the classical Supertrend based on candle close being above/beyond the previous Supertrend level.
Hope you'll enjoy it and it will improve your trading making you a better trader
Dave

Premarket High/LowThe script draws the high and low of the premarket session and based on these levels the ATR is added and also displayed on the chart as lines.
You can change:
- The Session Timeframe
- The ATR Multiple
- If the Aftermarket Session should be included

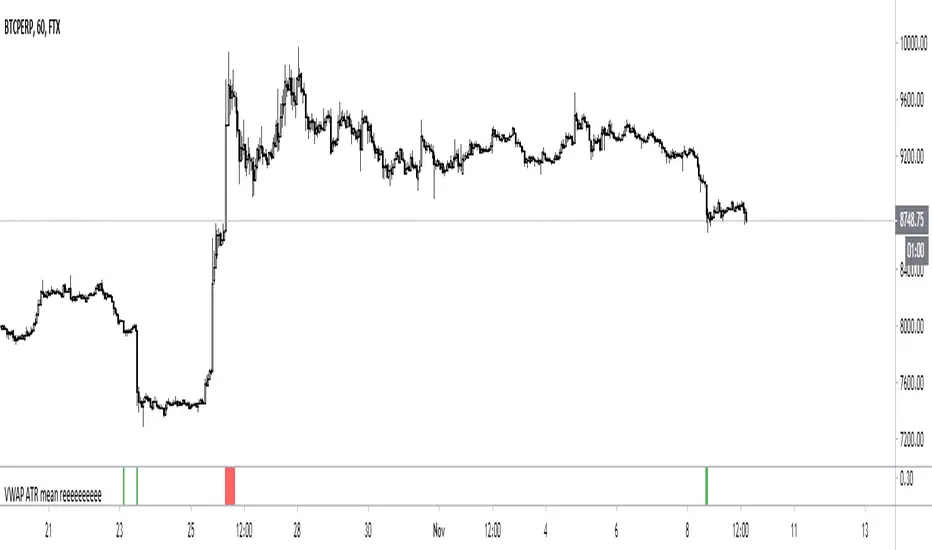
VWAP ATR mean reeeeeeeeeeMean reversion strategy which lets you set a VWAP length, ATR length - then creates signal when distance closing price from VWAP is greater than ATR x a multiplier which you set
CSA 5-Step Daily & Weekly ATR18-09-2019
The CSA 5-Step Daily & Weekly ATR will plot the Daily and Weekly ATR despite the time frame selected.
Daily = White
Weekly = Yellow

Average True Range with EMAIncreasing and decreasing volatility in respect to ATR crossing an ema of ATR.
Ema acts as a proxy for look-back period as per Historical Volatility Percentile.
ATR is a proxy for Volatility as per standard deviation.
Divergence below ema means low volatility: the more divergence, the lower.
Divergence above the ema means high volatility.

No Nonsense NNFX VP Strategy for Back Testing Indicators| jhAfter putting the whole system together, sat down to benchmark the various confirmation indicators, shrink it down to backtest individual confirmation indicators.
Results for 24 periods way better than 10, then again it's only one pair. :)
More details below.
//////////////////////////////////////////////////////////////////////////////////////////////////////////////////////////////////
//Designed per No Nonsense Forex VP rules
//For testing your individual indicators before the full system
//Originated from causecelebre
//Tried to put in as much VP rules as possible
///////////////////////////////////////////////////
//Rules Implemented:
///////////////////////////////////////////////////
// - SL 1.5 x ATR
// - TP 1 x ATR
//
// - Entry conditions
//// - Entry from 1 x confirmation
// - Exit conditions
//// - Exit on confirmation flip
///////////////////////////////////////////////////
//Trades entries
///////////////////////////////////////////////////
// - First entry L1 or S1 with standard SL and TP
///////////////////////////////////////////////////
//Included Indicators and settings
///////////////////////////////////////////////////
// - Confirmtion = SSL 10
///////////////////////////////////////////////////
//Credits
// Strategy causecelebre www.tradingview.com
// SSL Channel ErwinBeckers www.tradingview.com
//////////////////////////////////////////////////////////////////////////////////////////////////////////////////////////////////
//Change log
//First release. Testing of indicators
//////////////////////////////////////////////////////////////////////////////////////////////////////////////////////////////////

Super Moving Average
Plots one of several types of moving average types
Supports ATR/Kelter Channels
Supports Bollinger Bands
Velocity squeezes shown on the moving average to identify possible turning points
Supports ATR based stop for MA Trend Reversals
MA Trend reversal alert conditions
See related Moving Average Ribbon script.

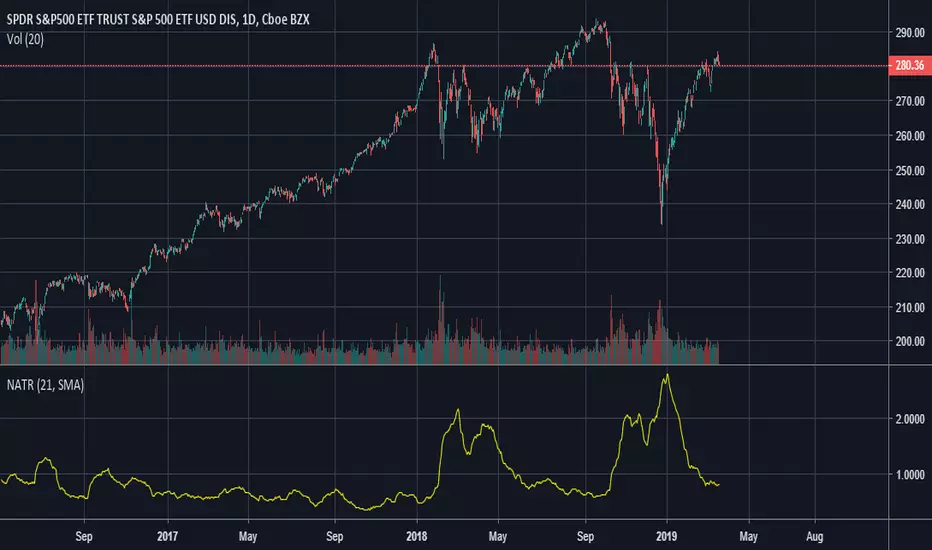
Normalized Average True RangeThis is a Normalized ATR, which means it displays ATR as a percentage instead of absolute price. For example, a value of 1 indicates a true range of 1% in a given period.
This indicator creates a moving average of the volatility of a product going back X number of periods and is useful for deciding what to trade. For example, if used on a daily chart, one product displays a value of 4 you can reasonably expect it to have larger price swings and movement compared to another product that displays 1.
It does not predict direction, rather the size of moves.
Comparative ATR%Comparison of the ATR (Average Trading Range) of multiple coins. The ATRs are shown as percentage.

Index Adaptive Keltner Channels [DW]This study is an experiment in adaptive filtering. The process in this study was inspired by KAMA and ZLEMA filtering techniques.
First, data is given an optional modification for lag reduction.
Then, an adaptive filter of your choice is calculated. There are 6 different adaptive filters to choose from in this study:
-Commodity Channel Index Adaptive Moving Average (CCIAMA)
-Relative Strength Index Adaptive Moving Average (RSIAMA)
-%R Adaptive Moving Average (%RAMA)
-Klinger Volume Oscillator Adaptive Moving Average (KVOAMA)
-Money Flow Index Adaptive Moving Average (MFIAMA)
-Correlation Coefficient Adaptive Moving Average (CCAMA)
Next, ATR is calculated using the specified adaptive filter.
A set of ranges is calculated by multiplying ATR by the square root of the sampling period, then dividing it by 2 and 4.
And Finally, the ranges are added to and subtracted from the adaptive filter to generate the channels.
Custom bar colors are included. The formula for the color scheme is based on filter direction and price.
