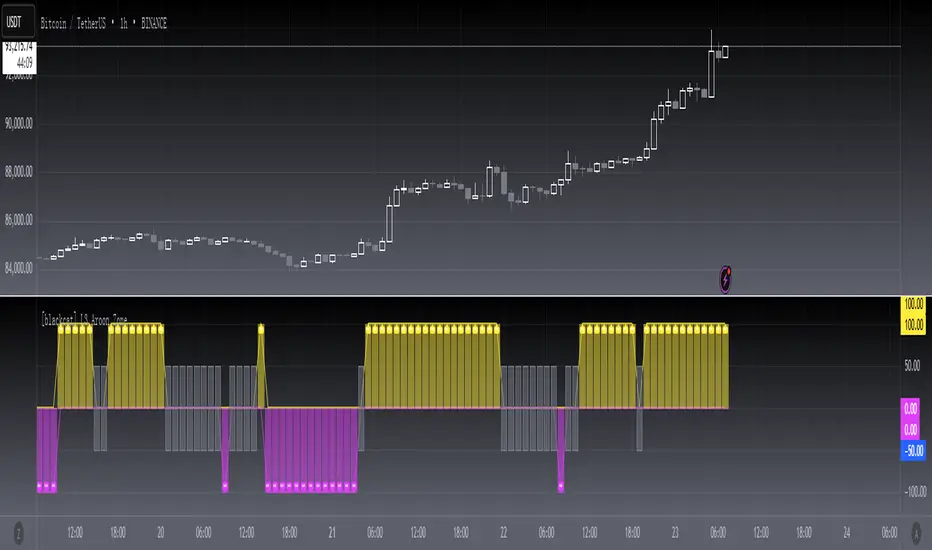
[blackcat] L3 Aroon ZoneLevel 3
Background
The Aroon indicator developed by Tushar Chanand indicates whether there is a trend price or is located in a trading area.
Function
Classical Aroon can also show the beginning of a new trend, its strength and expectation of changes from trade areas to trends. However, it produces too much noise when is bull or bear during sideways. In this improved version, I use bars without "blur cross" to classify bull, bear and sideways, which could look better to know the status of current market.
Since Chinese uses red for bull, green for bear, while others use green for bull and red for bear, i try to avoid to use red or green, which may be confusing. I use my style of color for bull and bear:
Yellow --> Bull
Fuchsia --> Bear
Gray --> Sideways
Remarks
Feedbacks are appreciated.
"aroon" için komut dosyalarını ara
Harmonic Trend Fusion [kikfraben]📈 Harmonic Trend Fusion - Your Personal Trading Assistant
This versatile tool combines multiple indicators to provide a holistic view of market trends and potential signals.
🚀 Key Features:
Multi-Indicator Synergy: Benefit from the combined insights of Aroon, DMI, MACD, Parabolic SAR, RSI, Supertrend, and SMI Ergodic Oscillator, all in one powerful indicator.
Customizable Plot Options: Tailor your chart by choosing which signals to visualize. Whether you're interested in trendlines, histograms, or specific indicators, the choice is yours.
Color-Coded Trends: Quickly identify bullish and bearish trends with the color-coded visualizations. Stay ahead of market movements with clear and intuitive signals.
Table Display: Stay informed at a glance with the interactive table. It dynamically updates to reflect the current market sentiment, providing you with key information and trend direction.
Precision Control: Fine-tune your analysis with precision control over indicator parameters. Adjust lengths, colors, and other settings to align with your unique trading strategy.
🛠️ How to Use:
Customize Your View: Select which indicators to display and adjust plot options to suit your preferences.
Table Insights: Monitor the dynamic table for real-time updates on market sentiment and trend direction.
Indicator Parameters: Experiment with different lengths and settings to find the combination that aligns with your trading style.
Whether you're a seasoned trader or just starting, Harmonic Trend Fusion equips you with the tools you need to navigate the markets confidently. Take control of your trading journey and enhance your decision-making process with this comprehensive trading assistant.


5 in 1 (rsi,aroon,stoch,macd,adx di)5 indicators in 1.
You can choose wich one you want to see (rsi ,aroon,macd,stoch or adx di)
Usefull to save space for other indicators


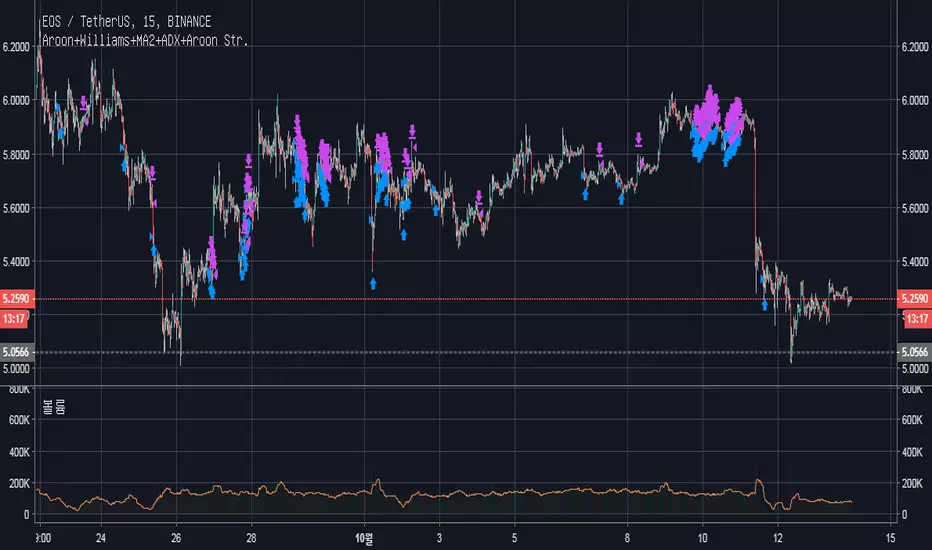
Aroon+Williams+MA2+ADX+Aroon Str.Inspired by the Watchbot strategy which makes about +60% profit in two months.
cafe.naver.com
This is customized to "EOSUSDT, 15 min, Binance" as a default.
I want to add the function for avoiding the recurrence of the trading for 24 ticks(period), but don't know how to yet.
SExI - Super Exhaustion Indicator [Da_Prof]As we know, the RSI can remain at "overbought" or "oversold" levels for long periods of time while the price continues in that direction. The SExI (Super Exhaustion Indicator) is an indicator designed to help detect exhaustion of strong moves.
The SExI is a combination of the RSI and "upper" Aroon. For the indicator to trigger, the RSI has to be above or below a top/bottom trigger line when the Aroon has had a set number of drives up or down correspondingly. An Aroon top drive is defined as the Aroon hitting 100% on the current candle when the previous candle was below 100%. An Aroon bottom drive is defined as the Aroon hitting 0% on the current candle when the previous candle was above 0%. Consecutive top or bottom drives are counted and exhaustion triggers when these drives hit a setpoint (default is 5 drives = the Aroon exhaustion trigger). When Aroon exhaustion is triggered and the RSI is correspondingly above/below a trigger line, the overall indicator signals exhaustion. There are two lines for bottoms and tops, one each for a "normal" trigger and and an "extreme" trigger.
The Aroon drives are visualized at the top and bottom of the indicator. The RSI is plotted as a line that crosses top and bottom trigger lines. There are extreme trigger values for both the bottom and top exhaustion triggers.
--Da_Prof

Indicators Combination Framework v3 IND [DTU]Hello All,
This script is a framework to analyze and see the results by combine selected indicators for (long, short, longexit, shortexit) conditions.
I was designed this for beginners and users to facilitate to see effects of the technical indicators combinations on the chart WITH NO CODE
You can improve your strategies according the results of this system by connecting the framework to a strategy framework/template such as Pinecoder, Benson, daveatt or custom.
This is enhanced version of my previous indicator "Indicators & Conditions Test Framework "
Currently there are 93 indicators (23 newly added) connected over library. You can also import an External Indicator or add Custom indicator (In the source)
It is possible to change it from Indicator to strategy (simple one) by just remarking strategy parts in the source code and see real time profit of your combinations
Feel free to change or use it in your source
Special thanks goes to Pine wizards: Trading view (built-in Indicators), @Rodrigo, @midtownsk8rguy, @Lazybear, @Daveatt and others for their open source codes and contributions
SIMPLE USAGE
1. SETTING: Show Alerts= True (To see your entries and Exists)
2. Define your Indicators (ex: INDICATOR1: ema(close,14), INDICATOR2: ema(close,21), INDICATOR3: ema(close,200)
3. Define Your Combinations for long & Short Conditions
a. For Long: (INDICATOR1 crossover INDICATOR2) AND (INDICATOR3 < close)
b. For Short: (INDICATOR1 crossunder INDICATOR2) AND (INDICATOR3 > close)
4. Select Strategy/template (Import strategy to chart) that you export your signals from the list
5. Analyze the best profit by changing Indicators values
SOME INDICATORS DETAILS
Each Indicator includes:
- Factorization : Converting the selected indicator to Double, triple Quadruple such as EMA to DEMA, TEMA QEMA
- Log : Simple or log10 can be used for calculation on function entries
- Plot Type : You can overlay the indicator on the chart (such ema) or you can use stochastic/Percentrank approach to display in the variable hlines range
- Extended Parametes : You can use default parameters or you can use extended (P1,P2) parameters regarding to indicator type and your choice
- Color : You can define indicator color and line properties
- Smooth : you can enable swma smooth
- indicators : you can select one of the 93 function like ema(),rsi().. to define your indicator
- Source : you can select from already defined indicators (IND1-4), External Indicator (EXT), Custom Indicator (CUST), and other sources (close, open...)
CONDITION DETAILS
- There are are 4 type of conditions, long entry, short entry, long exit, short exit.
- Each condition are built up from 4 combinations that joined with "AND" & "OR" operators
- You can see the results by enabling show alerts check box
- If you only wants to enter long entry and long exit, just fill these conditions
- If "close on opposite" checkbox selected on settings, long entry will be closed on short entry and vice versa
COMBINATIONS DETAILS
- There are 4 combinations that joined with "AND" & "OR" operators for each condition
- combinations are built up from compare 1st entry with 2nd one by using operator
- 1st and 2nd entries includes already defined indicators (IND1-5), External Indicator (EXT), Custom Indicator (CUST), and other sources (close, open...)
- Operators are comparison values such as >,<, crossover,...
- 2nd entry include "VALUE" parameter that will use to compare 1st indicator with value area
- If 2nd indicator selected different than "VALUE", value are will mean previous value of the selection. (ex: value area= 2, 2nd entry=close, means close )
- Selecting "NONE" for the 1st entry will disable calculation of current and following combinations
JOINS DETAILS
- Each combination will join wiht the following one with the JOIN (AND, OR) operator (if the following one is not equal "NONE")
CUSTOM INDICATOR
- Custom Indicator defines harcoded in the source code.
- You can call it with "CUST" in the Indicator definition source or combination entries source
- You can change or implement your custom indicator by updating the source code
EXTERNAL INDICATOR
- You can import an external indicator by selecting it from the ext source.
- External Indicator should be already imported to the chart and it have an plot function to output its signal
EXPORTING SIGNAL
- You can export your result to an already defined strategy template such as Pine coders, Benson, Daveatt Strategy templates
- Or you can define your custom export for other future strategy templates
ALERTS
- By enabling show alerts checkbox, you can see long entry exits on the bottom, and short entry exits aon the top of the chart
ADDITIONAL INFO
- You can see all off the inputs descriptions in the tooltips. (You can also see the previous version for details)
- Availability to set start, end dates
- Minimize repainting by using security function options (Secure, Semi Secure, Repaint)
- Availability of use timeframes
-
Version 3 INDICATORS LIST (More to be added):
▼▼▼ OVERLAY INDICATORS ▼▼▼
alma(src,len,offset=0.85,sigma=6).-------Arnaud Legoux Moving Average
ama(src,len,fast=14,slow=100).-----------Adjusted Moving Average
accdist().-------------------------------Accumulation/distribution index.
cma(src,len).----------------------------Corrective Moving average
dema(src,len).---------------------------Double EMA (Same as EMA with 2 factor)
ema(src,len).----------------------------Exponential Moving Average
gmma(src,len).---------------------------Geometric Mean Moving Average
highest(src,len).------------------------Highest value for a given number of bars back.
hl2ma(src,len).--------------------------higest lowest moving average
hma(src,len).----------------------------Hull Moving Average.
lagAdapt(src,len,perclen=5,fperc=50).----Ehlers Adaptive Laguerre filter
lagAdaptV(src,len,perclen=5,fperc=50).---Ehlers Adaptive Laguerre filter variation
laguerre(src,len).-----------------------Ehlers Laguerre filter
lesrcp(src,len).-------------------------lowest exponential esrcpanding moving line
lexp(src,len).---------------------------lowest exponential expanding moving line
linreg(src,len,loffset=1).---------------Linear regression
lowest(src,len).-------------------------Lovest value for a given number of bars back.
mcginley(src, len.-----------------------McGinley Dynamic adjusts for market speed shifts, which sets it apart from other moving averages, in addition to providing clear moving average lines
percntl(src,len).------------------------percentile nearest rank. Calculates percentile using method of Nearest Rank.
percntli(src,len).-----------------------percentile linear interpolation. Calculates percentile using method of linear interpolation between the two nearest ranks.
previous(src,len).-----------------------Previous n (len) value of the source
pivothigh(src,BarsLeft=len,BarsRight=2).-Previous pivot high. src=src, BarsLeft=len, BarsRight=p1=2
pivotlow(src,BarsLeft=len,BarsRight=2).--Previous pivot low. src=src, BarsLeft=len, BarsRight=p1=2
rema(src,len).---------------------------Range EMA (REMA)
rma(src,len).----------------------------Moving average used in RSI. It is the exponentially weighted moving average with alpha = 1 / length.
sar(start=len, inc=0.02, max=0.02).------Parabolic SAR (parabolic stop and reverse) is a method to find potential reversals in the market price direction of traded goods.start=len, inc=p1, max=p2. ex: sar(0.02, 0.02, 0.02)
sma(src,len).----------------------------Smoothed Moving Average
smma(src,len).---------------------------Smoothed Moving Average
super2(src,len).-------------------------Ehlers super smoother, 2 pole
super3(src,len).-------------------------Ehlers super smoother, 3 pole
supertrend(src,len,period=3).------------Supertrend indicator
swma(src,len).---------------------------Sine-Weighted Moving Average
tema(src,len).---------------------------Triple EMA (Same as EMA with 3 factor)
tma(src,len).----------------------------Triangular Moving Average
vida(src,len).---------------------------Variable Index Dynamic Average
vwma(src,len).---------------------------Volume Weigted Moving Average
volstop(src,len,atrfactor=2).------------Volatility Stop is a technical indicator that is used by traders to help place effective stop-losses. atrfactor=p1
wma(src,len).----------------------------Weigted Moving Average
vwap(src_).------------------------------Volume Weighted Average Price (VWAP) is used to measure the average price weighted by volume
▼▼▼ NON OVERLAY INDICATORS ▼▼
adx(dilen=len, adxlen=14, adxtype=0).----adx. The Average Directional Index (ADX) is a used to determine the strength of a trend. len=>dilen, p1=adxlen (default=14), p2=adxtype 0:ADX, 1:+DI, 2:-DI (def:0)
angle(src,len).--------------------------angle of the series (Use its Input as another indicator output)
aroon(len,dir=0).------------------------aroon indicator. Aroons major function is to identify new trends as they happen.p1 = dir: 0=mid (default), 1=upper, 2=lower
atr(src,len).----------------------------average true range. RMA of true range.
awesome(fast=len=5,slow=34,type=0).------Awesome Oscilator is an indicator used to measure market momentum. defaults : fast=len= 5, p1=slow=34, p2=type: 0=Awesome, 1=difference
bbr(src,len,mult=1).---------------------bollinger %%
bbw(src,len,mult=2).---------------------Bollinger Bands Width. The Bollinger Band Width is the difference between the upper and the lower Bollinger Bands divided by the middle band.
cci(src,len).----------------------------commodity channel index
cctbbo(src,len).-------------------------CCT Bollinger Band Oscilator
change(src,len).-------------------------A.K.A. Momentum. Difference between current value and previous, source - source . is most commonly referred to as a rate and measures the acceleration of the price and/or volume of a security
cmf(len=20).-----------------------------Chaikin Money Flow Indicator used to measure Money Flow Volume over a set period of time. Default use is len=20
cmo(src,len).----------------------------Chande Momentum Oscillator. Calculates the difference between the sum of recent gains and the sum of recent losses and then divides the result by the sum of all price movement over the same period.
cog(src,len).----------------------------The cog (center of gravity) is an indicator based on statistics and the Fibonacci golden ratio.
copcurve(src,len).-----------------------Coppock Curve. was originally developed by Edwin Sedge Coppock (Barrons Magazine, October 1962).
correl(src,len).-------------------------Correlation coefficient. Describes the degree to which two series tend to deviate from their ta.sma values.
count(src,len).--------------------------green avg - red avg
cti(src,len).----------------------------Ehler s Correlation Trend Indicator by
dev(src,len).----------------------------ta.dev() Measure of difference between the series and its ta.sma
dpo(len).--------------------------------Detrended Price OScilator is used to remove trend from price.
efi(len).--------------------------------Elders Force Index (EFI) measures the power behind a price movement using price and volume.
eom(len=14,div=10000).-------------------Ease of Movement.It is designed to measure the relationship between price and volume.p1 = div: 10000= (default)
falling(src,len).------------------------ta.falling() Test if the `source` series is now falling for `length` bars long. (Use its Input as another indicator output)
fisher(len).-----------------------------Fisher Transform is a technical indicator that converts price to Gaussian normal distribution and signals when prices move significantly by referencing recent price data
histvol(len).----------------------------Historical volatility is a statistical measure used to analyze the general dispersion of security or market index returns for a specified period of time.
kcr(src,len,mult=2).---------------------Keltner Channels Range
kcw(src,len,mult=2).---------------------ta.kcw(). Keltner Channels Width. The Keltner Channels Width is the difference between the upper and the lower Keltner Channels divided by the middle channel.
klinger(type=len).-----------------------Klinger oscillator aims to identify money flow’s long-term trend. type=len: 0:Oscilator 1:signal
macd(src,len).---------------------------MACD (Moving Average Convergence/Divergence)
mfi(src,len).----------------------------Money Flow Index s a tool used for measuring buying and selling pressure
msi(len=10).-----------------------------Mass Index (def=10) is used to examine the differences between high and low stock prices over a specific period of time
nvi().-----------------------------------Negative Volume Index
obv().-----------------------------------On Balance Volume
pvi().-----------------------------------Positive Volume Index
pvt().-----------------------------------Price Volume Trend
ranges(src,upper=len, lower=-5).---------ranges of the source. src=src, upper=len, v1:lower=upper . returns: -1 source=upper otherwise 0
rising(src,len).-------------------------ta.rising() Test if the `source` series is now rising for `length` bars long. (Use its Input as another indicator output)
roc(src,len).----------------------------Rate of Change
rsi(src,len).----------------------------Relative strength Index
rvi(src,len).----------------------------The Relative Volatility Index (RVI) is calculated much like the RSI, although it uses high and low price standard deviation instead of the RSI’s method of absolute change in price.
smi_osc(src,len,fast=5, slow=34).--------smi Oscillator
smi_sig(src,len,fast=5, slow=34).--------smi Signal
stc(src,len,fast=23,slow=50).------------Schaff Trend Cycle (STC) detects up and down trends long before the MACD. Code imported from
stdev(src,len).--------------------------Standart deviation
trix(src,len) .--------------------------the rate of change of a triple exponentially smoothed moving average.
tsi(src,len).----------------------------The True Strength Index indicator is a momentum oscillator designed to detect, confirm or visualize the strength of a trend.
ultimateOsc(len.-------------------------Ultimate Oscillator indicator (UO) indicator is a technical analysis tool used to measure momentum across three varying timeframes
variance(src,len).-----------------------ta.variance(). Variance is the expectation of the squared deviation of a series from its mean (ta.sma), and it informally measures how far a set of numbers are spread out from their mean.
willprc(src,len).------------------------Williams %R
wad().-----------------------------------Williams Accumulation/Distribution.
wvad().----------------------------------Williams Variable Accumulation/Distribution.
HISTORY
v3.01
ADD: 23 new indicators added to indicators list from the library. Current Total number of Indicators are 93. (to be continued to adding)
ADD: 2 more Parameters (P1,P2) for indicator calculation added. Par:(Use Defaults) uses only indicator(Source, Length) with library's default parameters. Par:(Use Extra Parameters P1,P2) use indicator(Source,Length,p1,p2) with additional parameters if indicator needs.
ADD: log calculation (simple, log10) option added on indicator function entries
ADD: New Output Signals added for compatibility on exporting condition signals to different Strategy templates.
ADD: Alerts Added according to conditions results
UPD: Indicator source inputs now display with indicators descriptions
UPD: Most off the source code rearranged and some functions moved to the new library. Now system work like a little bit frontend/backend
UPD: Performance improvement made on factorization and other source code
UPD: Input GUI rearranged
UPD: Tooltips corrected
REM: Extended indicators removed
UPD: IND1-IND4 added to indicator data source. Now it is possible to create new indicators with the previously defined indicators value. ex: IND1=ema(close,14) and IND2=rsi(IND1,20) means IND2=rsi(ema(close,14),20)
UPD: Custom Indicator (CUST) added to indicator data source and Combination Indicator source.
UPD: Volume added to indicator data source and Combination Indicator source.
REM: Custom indicators removed and only one custom indicator left
REM: Plot Type "Org. Range (-1,1)" removed
UPD: angle, rising, falling type operators moved to indicator library

pandas_taLibrary "pandas_ta"
Level: 3
Background
Today is the first day of 2022 and happy new year every tradingviewers! May health and wealth go along with you all the time. I use this chance to publish my 1st PINE v5 lib : pandas_ta
This is not a piece of cake like thing, which cost me a lot of time and efforts to build this lib. Beyond 300 versions of this script was iterated in draft.
Function
Library "pandas_ta"
PINE v5 Counterpart of Pandas TA - A Technical Analysis Library in Python 3 at github.com
The Original Pandas Technical Analysis (Pandas TA) is an easy to use library that leverages the Pandas package with more than 130 Indicators and Utility functions and more than 60 TA Lib Candlestick Patterns.
I realized most of indicators except Candlestick Patterns because tradingview built-in Candlestick Patterns are even more powerful!
I use this to verify pandas_ta python version indicators for myself, but I realize that maybe many may need similar lib for pine v5 as well.
Function Brief Descriptions (Pls find details in script comments)
bton --> Binary to number
wcp --> Weighted Closing Price (WCP)
counter --> Condition counter
xbt --> Between
ebsw --> Even Better SineWave (EBSW)
ao --> Awesome Oscillator (AO)
apo --> Absolute Price Oscillator (APO)
xrf --> Dynamic shifted values
bias --> Bias (BIAS)
bop --> Balance of Power (BOP)
brar --> BRAR (BRAR)
cci --> Commodity Channel Index (CCI)
cfo --> Chande Forcast Oscillator (CFO)
cg --> Center of Gravity (CG)
cmo --> Chande Momentum Oscillator (CMO)
coppock --> Coppock Curve (COPC)
cti --> Correlation Trend Indicator (CTI)
dmi --> Directional Movement Index(DMI)
er --> Efficiency Ratio (ER)
eri --> Elder Ray Index (ERI)
fisher --> Fisher Transform (FISHT)
inertia --> Inertia (INERTIA)
kdj --> KDJ (KDJ)
kst --> 'Know Sure Thing' (KST)
macd --> Moving Average Convergence Divergence (MACD)
mom --> Momentum (MOM)
pgo --> Pretty Good Oscillator (PGO)
ppo --> Percentage Price Oscillator (PPO)
psl --> Psychological Line (PSL)
pvo --> Percentage Volume Oscillator (PVO)
qqe --> Quantitative Qualitative Estimation (QQE)
roc --> Rate of Change (ROC)
rsi --> Relative Strength Index (RSI)
rsx --> Relative Strength Xtra (rsx)
rvgi --> Relative Vigor Index (RVGI)
slope --> Slope
smi --> SMI Ergodic Indicator (SMI)
sqz* --> Squeeze (SQZ) * NOTE: code sufferred from very strange error, code was commented.
sqz_pro --> Squeeze PRO(SQZPRO)
xfl --> Condition filter
stc --> Schaff Trend Cycle (STC)
stoch --> Stochastic (STOCH)
stochrsi --> Stochastic RSI (STOCH RSI)
trix --> Trix (TRIX)
tsi --> True Strength Index (TSI)
uo --> Ultimate Oscillator (UO)
willr --> William's Percent R (WILLR)
alma --> Arnaud Legoux Moving Average (ALMA)
xll --> Dynamic rolling lowest values
dema --> Double Exponential Moving Average (DEMA)
ema --> Exponential Moving Average (EMA)
fwma --> Fibonacci's Weighted Moving Average (FWMA)
hilo --> Gann HiLo Activator(HiLo)
hma --> Hull Moving Average (HMA)
hwma --> HWMA (Holt-Winter Moving Average)
ichimoku --> Ichimoku Kinkō Hyō (ichimoku)
jma --> Jurik Moving Average Average (JMA)
kama --> Kaufman's Adaptive Moving Average (KAMA)
linreg --> Linear Regression Moving Average (linreg)
mgcd --> McGinley Dynamic Indicator
rma --> wildeR's Moving Average (RMA)
sinwma --> Sine Weighted Moving Average (SWMA)
ssf --> Ehler's Super Smoother Filter (SSF) © 2013
supertrend --> Supertrend (supertrend)
xsa --> X simple moving average
swma --> Symmetric Weighted Moving Average (SWMA)
t3 --> Tim Tillson's T3 Moving Average (T3)
tema --> Triple Exponential Moving Average (TEMA)
trima --> Triangular Moving Average (TRIMA)
vidya --> Variable Index Dynamic Average (VIDYA)
vwap --> Volume Weighted Average Price (VWAP)
vwma --> Volume Weighted Moving Average (VWMA)
wma --> Weighted Moving Average (WMA)
zlma --> Zero Lag Moving Average (ZLMA)
entropy --> Entropy (ENTP)
kurtosis --> Rolling Kurtosis
skew --> Rolling Skew
xev --> Condition all
zscore --> Rolling Z Score
adx --> Average Directional Movement (ADX)
aroon --> Aroon & Aroon Oscillator (AROON)
chop --> Choppiness Index (CHOP)
xex --> Condition any
cksp --> Chande Kroll Stop (CKSP)
dpo --> Detrend Price Oscillator (DPO)
long_run --> Long Run
psar --> Parabolic Stop and Reverse (psar)
short_run --> Short Run
vhf --> Vertical Horizontal Filter (VHF)
vortex --> Vortex
accbands --> Acceleration Bands (ACCBANDS)
atr --> Average True Range (ATR)
bbands --> Bollinger Bands (BBANDS)
donchian --> Donchian Channels (DC)
kc --> Keltner Channels (KC)
massi --> Mass Index (MASSI)
natr --> Normalized Average True Range (NATR)
pdist --> Price Distance (PDIST)
rvi --> Relative Volatility Index (RVI)
thermo --> Elders Thermometer (THERMO)
ui --> Ulcer Index (UI)
ad --> Accumulation/Distribution (AD)
cmf --> Chaikin Money Flow (CMF)
efi --> Elder's Force Index (EFI)
ecm --> Ease of Movement (EOM)
kvo --> Klinger Volume Oscillator (KVO)
mfi --> Money Flow Index (MFI)
nvi --> Negative Volume Index (NVI)
obv --> On Balance Volume (OBV)
pvi --> Positive Volume Index (PVI)
dvdi --> Dual Volume Divergence Index (DVDI)
xhh --> Dynamic rolling highest values
pvt --> Price-Volume Trend (PVT)
Remarks
I also incorporated func descriptions and func test script in commented mode, you can test the functino with the embedded test script and modify them as you wish.
This is a Level 3 free and open source indicator library.
Feedbacks are appreciated.
This is not the end of pandas_ta lib publication, but it is start point with pine v5 lib function and I will add more and more funcs into this lib for my own indicators.
Function Name List:
bton()
wcp()
count()
xbt()
ebsw()
ao()
apo()
xrf()
bias()
bop()
brar()
cci()
cfo()
cg()
cmo()
coppock()
cti()
dmi()
er()
eri()
fisher()
inertia()
kdj()
kst()
macd()
mom()
pgo()
ppo()
psl()
pvo()
qqe()
roc()
rsi()
rsx()
rvgi()
slope()
smi()
sqz_pro()
xfl()
stc()
stoch()
stochrsi()
trix()
tsi()
uo()
willr()
alma()
wcx()
xll()
dema()
ema()
fwma()
hilo()
hma()
hwma()
ichimoku()
jma()
kama()
linreg()
mgcd()
rma()
sinwma()
ssf()
supertrend()
xsa()
swma()
t3()
tema()
trima()
vidya()
vwap()
vwma()
wma()
zlma()
entropy()
kurtosis()
skew()
xev()
zscore()
adx()
aroon()
chop()
xex()
cksp()
dpo()
long_run()
psar()
short_run()
vhf()
vortex()
accbands()
atr()
bbands()
donchian()
kc()
massi()
natr()
pdist()
rvi()
thermo()
ui()
ad()
cmf()
efi()
ecm()
kvo()
mfi()
nvi()
obv()
pvi()
dvdi()
xhh()
pvt()

Multiple Symbol Trend Screener [Pineify]Multiple Symbol Trend Screener Pineify – Ultimate Multi-Indicator Scanner for TradingView
Empower your trading with deep market insights across multiple symbols using this feature-rich Pine Script screener. The Multiple Symbol Trend Screener Pineify enables traders to monitor and compare trends, reversals, and consolidations in real-time across the biggest equity symbols on TradingView, through a synergistic blend of popular technical indicators.
Key Features
Monitor up to 15 symbols and their trends simultaneously
Integrates 7 professional-grade indicators: MA Distance, Aroon, Parabolic SAR (PSAR), ADX, Supertrend, Keltner Channel, and BBTrend
Color-coded table display for instant visual assessment
Customizable lookback periods, indicator types, and calculation methods
SEO optimized for multi-symbol trend detection, screener, and advanced TradingView indicator
How It Works
This indicator leverages TradingView’s Pine Script v6 and request.security() to process multiple symbols across selected timeframes. Data populates a dynamic table, updating each cell based on the calculated value of every underlying indicator. MA Distance highlights deviation from moving averages; Aroon flags emerging trend strength; PSAR marks potential trend reversals; ADX assesses trend momentum; Supertrend detects bullish/bearish phases; Keltner Channel and BBTrend offer volatility and power insights.
Set up your preferred symbols and timeframes
Each indicator runs its calculation per symbol using its parameter group
All results are displayed in a table for a comprehensive dashboard view
Trading Ideas and Insights
Traders can use this screener for cross-market comparison, directional bias, entry/exit filtering, and comprehensive trend evaluation. The screener is excellent for swing trading, day trading, and portfolio tracking. It enables confirmation across multiple frameworks — for example, spotting momentum with ADX before confirming direction with Supertrend and PSAR.
Identify correlated movements or divergences across selected assets
Spot synchronized trend changes for basket trading ideas
Filter symbols by volatility, strength, or trend status for precise trade selection
How Multiple Indicators Work Together
The screener’s edge lies in its intelligent correlation of popular indicators. MA Distance measures the proximity to chosen moving averages, ideal for spotting overbought/oversold conditions. Aroon reveals the strength of new price trends, PSAR indicates reversal signals, and ADX quantifies the momentum of these trends. Supertrend provides a directional phase, while Keltner Channel & BBTrend analyze volatility shifts and band compressions. This amalgamation allows for a robust, multi-dimensional market snapshot, capturing details missed by single-indicator tools.
By displaying all key metrics side-by-side, the screener enables holistic decision-making, revealing confluence zones and contradiction areas across multiple tickers and timeframes.
Unique Aspects
Original implementation combining seven independent trend and momentum indicators for each symbol
Rich customization for symbols, timeframes, and all indicator parameters
Intuitive color-coding for quick reading of bullish/bearish/neutral signals
Comprehensive dashboard for instant actionable insights
How to Use
Load the indicator onto your TradingView chart
Go to the script’s settings and input your preferred symbols and relevant timeframes
Set your desired parameters for each indicator group: Moving Average type, Aroon length, PSAR values, ADX smoothing, etc.
Observe the results in the top-right table, then use it to filter candidates and validate trade setups
The screener is suitable for all timeframes and asset classes available on TradingView. Make sure your chart’s timeframe matches the one used in the scanner for optimal accuracy.
Customization
Choose up to 15 symbols to monitor in a single dashboard
Customize lookback periods, indicator types, colors, and display settings
Configure alerting options and thresholds for advanced trade automation
Conclusion
The Multiple Symbol Trend Screener Pineify sets a new standard for multi-asset screening on TradingView. By elegantly merging seven proven technical indicators, the screener delivers powerful trend detection, reversal analysis, and volatility monitoring — all in one dashboard. Take your trading to new heights with in-depth, customizable market surveillance.

taLibrary "ta"
█ OVERVIEW
This library holds technical analysis functions calculating values for which no Pine built-in exists.
Look first. Then leap.
█ FUNCTIONS
cagr(entryTime, entryPrice, exitTime, exitPrice)
It calculates the "Compound Annual Growth Rate" between two points in time. The CAGR is a notional, annualized growth rate that assumes all profits are reinvested. It only takes into account the prices of the two end points — not drawdowns, so it does not calculate risk. It can be used as a yardstick to compare the performance of two instruments. Because it annualizes values, the function requires a minimum of one day between the two end points (annualizing returns over smaller periods of times doesn't produce very meaningful figures).
Parameters:
entryTime : The starting timestamp.
entryPrice : The starting point's price.
exitTime : The ending timestamp.
exitPrice : The ending point's price.
Returns: CAGR in % (50 is 50%). Returns `na` if there is not >=1D between `entryTime` and `exitTime`, or until the two time points have not been reached by the script.
█ v2, Mar. 8, 2022
Added functions `allTimeHigh()` and `allTimeLow()` to find the highest or lowest value of a source from the first historical bar to the current bar. These functions will not look ahead; they will only return new highs/lows on the bar where they occur.
allTimeHigh(src)
Tracks the highest value of `src` from the first historical bar to the current bar.
Parameters:
src : (series int/float) Series to track. Optional. The default is `high`.
Returns: (float) The highest value tracked.
allTimeLow(src)
Tracks the lowest value of `src` from the first historical bar to the current bar.
Parameters:
src : (series int/float) Series to track. Optional. The default is `low`.
Returns: (float) The lowest value tracked.
█ v3, Sept. 27, 2022
This version includes the following new functions:
aroon(length)
Calculates the values of the Aroon indicator.
Parameters:
length (simple int) : (simple int) Number of bars (length).
Returns: ( [float, float ]) A tuple of the Aroon-Up and Aroon-Down values.
coppock(source, longLength, shortLength, smoothLength)
Calculates the value of the Coppock Curve indicator.
Parameters:
source (float) : (series int/float) Series of values to process.
longLength (simple int) : (simple int) Number of bars for the fast ROC value (length).
shortLength (simple int) : (simple int) Number of bars for the slow ROC value (length).
smoothLength (simple int) : (simple int) Number of bars for the weigted moving average value (length).
Returns: (float) The oscillator value.
dema(source, length)
Calculates the value of the Double Exponential Moving Average (DEMA).
Parameters:
source (float) : (series int/float) Series of values to process.
length (simple int) : (simple int) Length for the smoothing parameter calculation.
Returns: (float) The double exponentially weighted moving average of the `source`.
dema2(src, length)
An alternate Double Exponential Moving Average (Dema) function to `dema()`, which allows a "series float" length argument.
Parameters:
src : (series int/float) Series of values to process.
length : (series int/float) Length for the smoothing parameter calculation.
Returns: (float) The double exponentially weighted moving average of the `src`.
dm(length)
Calculates the value of the "Demarker" indicator.
Parameters:
length (simple int) : (simple int) Number of bars (length).
Returns: (float) The oscillator value.
donchian(length)
Calculates the values of a Donchian Channel using `high` and `low` over a given `length`.
Parameters:
length (int) : (series int) Number of bars (length).
Returns: ( [float, float, float ]) A tuple containing the channel high, low, and median, respectively.
ema2(src, length)
An alternate ema function to the `ta.ema()` built-in, which allows a "series float" length argument.
Parameters:
src : (series int/float) Series of values to process.
length : (series int/float) Number of bars (length).
Returns: (float) The exponentially weighted moving average of the `src`.
eom(length, div)
Calculates the value of the Ease of Movement indicator.
Parameters:
length (simple int) : (simple int) Number of bars (length).
div (simple int) : (simple int) Divisor used for normalzing values. Optional. The default is 10000.
Returns: (float) The oscillator value.
frama(source, length)
The Fractal Adaptive Moving Average (FRAMA), developed by John Ehlers, is an adaptive moving average that dynamically adjusts its lookback period based on fractal geometry.
Parameters:
source (float) : (series int/float) Series of values to process.
length (int) : (series int) Number of bars (length).
Returns: (float) The fractal adaptive moving average of the `source`.
ft(source, length)
Calculates the value of the Fisher Transform indicator.
Parameters:
source (float) : (series int/float) Series of values to process.
length (simple int) : (simple int) Number of bars (length).
Returns: (float) The oscillator value.
ht(source)
Calculates the value of the Hilbert Transform indicator.
Parameters:
source (float) : (series int/float) Series of values to process.
Returns: (float) The oscillator value.
ichimoku(conLength, baseLength, senkouLength)
Calculates values of the Ichimoku Cloud indicator, including tenkan, kijun, senkouSpan1, senkouSpan2, and chikou. NOTE: offsets forward or backward can be done using the `offset` argument in `plot()`.
Parameters:
conLength (int) : (series int) Length for the Conversion Line (Tenkan). The default is 9 periods, which returns the mid-point of the 9 period Donchian Channel.
baseLength (int) : (series int) Length for the Base Line (Kijun-sen). The default is 26 periods, which returns the mid-point of the 26 period Donchian Channel.
senkouLength (int) : (series int) Length for the Senkou Span 2 (Leading Span B). The default is 52 periods, which returns the mid-point of the 52 period Donchian Channel.
Returns: ( [float, float, float, float, float ]) A tuple of the Tenkan, Kijun, Senkou Span 1, Senkou Span 2, and Chikou Span values. NOTE: by default, the senkouSpan1 and senkouSpan2 should be plotted 26 periods in the future, and the Chikou Span plotted 26 days in the past.
ift(source)
Calculates the value of the Inverse Fisher Transform indicator.
Parameters:
source (float) : (series int/float) Series of values to process.
Returns: (float) The oscillator value.
kvo(fastLen, slowLen, trigLen)
Calculates the values of the Klinger Volume Oscillator.
Parameters:
fastLen (simple int) : (simple int) Length for the fast moving average smoothing parameter calculation.
slowLen (simple int) : (simple int) Length for the slow moving average smoothing parameter calculation.
trigLen (simple int) : (simple int) Length for the trigger moving average smoothing parameter calculation.
Returns: ( [float, float ]) A tuple of the KVO value, and the trigger value.
pzo(length)
Calculates the value of the Price Zone Oscillator.
Parameters:
length (simple int) : (simple int) Length for the smoothing parameter calculation.
Returns: (float) The oscillator value.
rms(source, length)
Calculates the Root Mean Square of the `source` over the `length`.
Parameters:
source (float) : (series int/float) Series of values to process.
length (int) : (series int) Number of bars (length).
Returns: (float) The RMS value.
rwi(length)
Calculates the values of the Random Walk Index.
Parameters:
length (simple int) : (simple int) Lookback and ATR smoothing parameter length.
Returns: ( [float, float ]) A tuple of the `rwiHigh` and `rwiLow` values.
stc(source, fast, slow, cycle, d1, d2)
Calculates the value of the Schaff Trend Cycle indicator.
Parameters:
source (float) : (series int/float) Series of values to process.
fast (simple int) : (simple int) Length for the MACD fast smoothing parameter calculation.
slow (simple int) : (simple int) Length for the MACD slow smoothing parameter calculation.
cycle (simple int) : (simple int) Number of bars for the Stochastic values (length).
d1 (simple int) : (simple int) Length for the initial %D smoothing parameter calculation.
d2 (simple int) : (simple int) Length for the final %D smoothing parameter calculation.
Returns: (float) The oscillator value.
stochFull(periodK, smoothK, periodD)
Calculates the %K and %D values of the Full Stochastic indicator.
Parameters:
periodK (simple int) : (simple int) Number of bars for Stochastic calculation. (length).
smoothK (simple int) : (simple int) Number of bars for smoothing of the %K value (length).
periodD (simple int) : (simple int) Number of bars for smoothing of the %D value (length).
Returns: ( [float, float ]) A tuple of the slow %K and the %D moving average values.
stochRsi(lengthRsi, periodK, smoothK, periodD, source)
Calculates the %K and %D values of the Stochastic RSI indicator.
Parameters:
lengthRsi (simple int) : (simple int) Length for the RSI smoothing parameter calculation.
periodK (simple int) : (simple int) Number of bars for Stochastic calculation. (length).
smoothK (simple int) : (simple int) Number of bars for smoothing of the %K value (length).
periodD (simple int) : (simple int) Number of bars for smoothing of the %D value (length).
source (float) : (series int/float) Series of values to process. Optional. The default is `close`.
Returns: ( [float, float ]) A tuple of the slow %K and the %D moving average values.
supertrend(factor, atrLength, wicks)
Calculates the values of the SuperTrend indicator with the ability to take candle wicks into account, rather than only the closing price.
Parameters:
factor (float) : (series int/float) Multiplier for the ATR value.
atrLength (simple int) : (simple int) Length for the ATR smoothing parameter calculation.
wicks (simple bool) : (simple bool) Condition to determine whether to take candle wicks into account when reversing trend, or to use the close price. Optional. Default is false.
Returns: ( [float, int ]) A tuple of the superTrend value and trend direction.
szo(source, length)
Calculates the value of the Sentiment Zone Oscillator.
Parameters:
source (float) : (series int/float) Series of values to process.
length (simple int) : (simple int) Length for the smoothing parameter calculation.
Returns: (float) The oscillator value.
t3(source, length, vf)
Calculates the value of the Tilson Moving Average (T3).
Parameters:
source (float) : (series int/float) Series of values to process.
length (simple int) : (simple int) Length for the smoothing parameter calculation.
vf (simple float) : (simple float) Volume factor. Affects the responsiveness.
Returns: (float) The Tilson moving average of the `source`.
t3Alt(source, length, vf)
An alternate Tilson Moving Average (T3) function to `t3()`, which allows a "series float" `length` argument.
Parameters:
source (float) : (series int/float) Series of values to process.
length (float) : (series int/float) Length for the smoothing parameter calculation.
vf (simple float) : (simple float) Volume factor. Affects the responsiveness.
Returns: (float) The Tilson moving average of the `source`.
tema(source, length)
Calculates the value of the Triple Exponential Moving Average (TEMA).
Parameters:
source (float) : (series int/float) Series of values to process.
length (simple int) : (simple int) Length for the smoothing parameter calculation.
Returns: (float) The triple exponentially weighted moving average of the `source`.
tema2(source, length)
An alternate Triple Exponential Moving Average (TEMA) function to `tema()`, which allows a "series float" `length` argument.
Parameters:
source (float) : (series int/float) Series of values to process.
length (float) : (series int/float) Length for the smoothing parameter calculation.
Returns: (float) The triple exponentially weighted moving average of the `source`.
trima(source, length)
Calculates the value of the Triangular Moving Average (TRIMA).
Parameters:
source (float) : (series int/float) Series of values to process.
length (int) : (series int) Number of bars (length).
Returns: (float) The triangular moving average of the `source`.
trima2(src, length)
An alternate Triangular Moving Average (TRIMA) function to `trima()`, which allows a "series int" length argument.
Parameters:
src : (series int/float) Series of values to process.
length : (series int) Number of bars (length).
Returns: (float) The triangular moving average of the `src`.
trix(source, length, signalLength, exponential)
Calculates the values of the TRIX indicator.
Parameters:
source (float) : (series int/float) Series of values to process.
length (simple int) : (simple int) Length for the smoothing parameter calculation.
signalLength (simple int) : (simple int) Length for smoothing the signal line.
exponential (simple bool) : (simple bool) Condition to determine whether exponential or simple smoothing is used. Optional. The default is `true` (exponential smoothing).
Returns: ( [float, float, float ]) A tuple of the TRIX value, the signal value, and the histogram.
uo(fastLen, midLen, slowLen)
Calculates the value of the Ultimate Oscillator.
Parameters:
fastLen (simple int) : (series int) Number of bars for the fast smoothing average (length).
midLen (simple int) : (series int) Number of bars for the middle smoothing average (length).
slowLen (simple int) : (series int) Number of bars for the slow smoothing average (length).
Returns: (float) The oscillator value.
vhf(source, length)
Calculates the value of the Vertical Horizontal Filter.
Parameters:
source (float) : (series int/float) Series of values to process.
length (simple int) : (simple int) Number of bars (length).
Returns: (float) The oscillator value.
vi(length)
Calculates the values of the Vortex Indicator.
Parameters:
length (simple int) : (simple int) Number of bars (length).
Returns: ( [float, float ]) A tuple of the viPlus and viMinus values.
vzo(length)
Calculates the value of the Volume Zone Oscillator.
Parameters:
length (simple int) : (simple int) Length for the smoothing parameter calculation.
Returns: (float) The oscillator value.
williamsFractal(period)
Detects Williams Fractals.
Parameters:
period (int) : (series int) Number of bars (length).
Returns: ( [bool, bool ]) A tuple of an up fractal and down fractal. Variables are true when detected.
wpo(length)
Calculates the value of the Wave Period Oscillator.
Parameters:
length (simple int) : (simple int) Length for the smoothing parameter calculation.
Returns: (float) The oscillator value.
█ v7, Nov. 2, 2023
This version includes the following new and updated functions:
atr2(length)
An alternate ATR function to the `ta.atr()` built-in, which allows a "series float" `length` argument.
Parameters:
length (float) : (series int/float) Length for the smoothing parameter calculation.
Returns: (float) The ATR value.
changePercent(newValue, oldValue)
Calculates the percentage difference between two distinct values.
Parameters:
newValue (float) : (series int/float) The current value.
oldValue (float) : (series int/float) The previous value.
Returns: (float) The percentage change from the `oldValue` to the `newValue`.
donchian(length)
Calculates the values of a Donchian Channel using `high` and `low` over a given `length`.
Parameters:
length (int) : (series int) Number of bars (length).
Returns: ( [float, float, float ]) A tuple containing the channel high, low, and median, respectively.
highestSince(cond, source)
Tracks the highest value of a series since the last occurrence of a condition.
Parameters:
cond (bool) : (series bool) A condition which, when `true`, resets the tracking of the highest `source`.
source (float) : (series int/float) Series of values to process. Optional. The default is `high`.
Returns: (float) The highest `source` value since the last time the `cond` was `true`.
lowestSince(cond, source)
Tracks the lowest value of a series since the last occurrence of a condition.
Parameters:
cond (bool) : (series bool) A condition which, when `true`, resets the tracking of the lowest `source`.
source (float) : (series int/float) Series of values to process. Optional. The default is `low`.
Returns: (float) The lowest `source` value since the last time the `cond` was `true`.
relativeVolume(length, anchorTimeframe, isCumulative, adjustRealtime)
Calculates the volume since the last change in the time value from the `anchorTimeframe`, the historical average volume using bars from past periods that have the same relative time offset as the current bar from the start of its period, and the ratio of these volumes. The volume values are cumulative by default, but can be adjusted to non-accumulated with the `isCumulative` parameter.
Parameters:
length (simple int) : (simple int) The number of periods to use for the historical average calculation.
anchorTimeframe (simple string) : (simple string) The anchor timeframe used in the calculation. Optional. Default is "D".
isCumulative (simple bool) : (simple bool) If `true`, the volume values will be accumulated since the start of the last `anchorTimeframe`. If `false`, values will be used without accumulation. Optional. The default is `true`.
adjustRealtime (simple bool) : (simple bool) If `true`, estimates the cumulative value on unclosed bars based on the data since the last `anchor` condition. Optional. The default is `false`.
Returns: ( [float, float, float ]) A tuple of three float values. The first element is the current volume. The second is the average of volumes at equivalent time offsets from past anchors over the specified number of periods. The third is the ratio of the current volume to the historical average volume.
rma2(source, length)
An alternate RMA function to the `ta.rma()` built-in, which allows a "series float" `length` argument.
Parameters:
source (float) : (series int/float) Series of values to process.
length (float) : (series int/float) Length for the smoothing parameter calculation.
Returns: (float) The rolling moving average of the `source`.
supertrend2(factor, atrLength, wicks)
An alternate SuperTrend function to `supertrend()`, which allows a "series float" `atrLength` argument.
Parameters:
factor (float) : (series int/float) Multiplier for the ATR value.
atrLength (float) : (series int/float) Length for the ATR smoothing parameter calculation.
wicks (simple bool) : (simple bool) Condition to determine whether to take candle wicks into account when reversing trend, or to use the close price. Optional. Default is `false`.
Returns: ( [float, int ]) A tuple of the superTrend value and trend direction.
vStop(source, atrLength, atrFactor)
Calculates an ATR-based stop value that trails behind the `source`. Can serve as a possible stop-loss guide and trend identifier.
Parameters:
source (float) : (series int/float) Series of values that the stop trails behind.
atrLength (simple int) : (simple int) Length for the ATR smoothing parameter calculation.
atrFactor (float) : (series int/float) The multiplier of the ATR value. Affects the maximum distance between the stop and the `source` value. A value of 1 means the maximum distance is 100% of the ATR value. Optional. The default is 1.
Returns: ( [float, bool ]) A tuple of the volatility stop value and the trend direction as a "bool".
vStop2(source, atrLength, atrFactor)
An alternate Volatility Stop function to `vStop()`, which allows a "series float" `atrLength` argument.
Parameters:
source (float) : (series int/float) Series of values that the stop trails behind.
atrLength (float) : (series int/float) Length for the ATR smoothing parameter calculation.
atrFactor (float) : (series int/float) The multiplier of the ATR value. Affects the maximum distance between the stop and the `source` value. A value of 1 means the maximum distance is 100% of the ATR value. Optional. The default is 1.
Returns: ( [float, bool ]) A tuple of the volatility stop value and the trend direction as a "bool".
Removed Functions:
allTimeHigh(src)
Tracks the highest value of `src` from the first historical bar to the current bar.
allTimeLow(src)
Tracks the lowest value of `src` from the first historical bar to the current bar.
trima2(src, length)
An alternate Triangular Moving Average (TRIMA) function to `trima()`, which allows a
"series int" length argument.

Trend Background by Alejandro PThis indicator is a comprehensive trend indicator designed to help traders filter market conditions for their trading.
The indicator has the option to use a classic Simple Moving Average as a trend filer or a more advanced Simple Moving Average Slope.
The indicator can also use the Aroon indicator as the trend filter and both the SMA and Aroon can be used together to only trade in strong trends.
The Simple Moving Average Slope and the Aroon filters can allow you to filter our 3 market conditions. 1- Upwards Trend, 2- Downwards Trend, 3- Ranging
By tuning these filters to your strategy you can make sure you are only taking trades when the trend is on your side and you can even filter out ranging market conditions to trade the best strategies depending on the market conditions.
Technical details:
If the Simple Moving Average filter is on and the Slope filter if off the indicator will determine the trend by where the price is relative to the moving average. If the price is higher than the SMA then the trend will be bullish, if the price is below the SMA the trend will be bearish.
If SMA filter and Slope FIlter are both on then the trend es defined by the slope of the SMA, this means that if the SMA slope is increasing then the trend will be bullish, if the slow is negative then it will be bearish, but if the slope is within a certain percentile that is classified as neutral then there will be no trend or a neutral market.
If the Aroon filter is enabled this will calculate the trend by the percent of candles with new highs or lows in a similar way as the SMA slope filter works
If both filters are enabled then both filters will have to coincide for a bull or bear trend to be determined.

FS Scorpion TailKey Features & Components:
1. Custom Date & Chart-Based Controls
The software allows users to define whether they want signals to start on a specific date (useSpecificDate) or base calculations on the visible chart’s range (useRelativeScreenSumLeft and useRelativeScreenSumRight).
Users can input the number of stocks to buy/sell per signal and decide whether to sell only for profit.
2. Technical Indicators Used
EMA (Exponential Moving Average): Users can define the length of the EMA and specify if buy/sell signals should occur when the EMA is rising or falling.
MACD (Moving Average Convergence Divergence): MACD crossovers, slopes of the MACD line, signal line, and histogram are used for generating buy/sell signals.
ATR (Average True Range): Signals are generated based on rising or falling ATR.
Aroon Indicator: Buy and sell signals are based on the behavior of the Aroon upper and lower lines.
RSI (Relative Strength Index): Tracks whether the RSI and its moving average are rising or falling to generate signals.
Bollinger Bands: Buy/sell signals depend on the basis, upper, and lower band behavior (rising or falling).
3. Signal Detection
The software creates arrays for each indicator to store conditions for buy/sell signals.
The allTrue() function checks whether all conditions for buy/sell signals are true, ensuring that only valid signals are plotted.
Signals are differentiated between buy-only, sell-only, and both buy and sell (dual signal).
4. Visual Indicators
Vertical Lines: When buy, sell, or dual signals are detected, vertical lines are drawn at the corresponding bar with configurable colors (green for buy, red for sell, silver for dual).
Buy/Sell Labels: Visual labels are plotted directly on the chart to denote buy or sell signals, allowing for clear interpretation of the strategy.
5. Cash Flow & Metrics Display
The software maintains an internal ledger of how many stocks are bought/sold, their prices, and whether a profit is being made.
A table is displayed at the bottom right of the chart, showing:
Initial investment
Current stocks owned
Last buy price
Market stake
Net profit
The table background turns green for profit and red for loss.
6. Dynamic Decision Making
Buy Condition: If a valid buy signal is generated, the software decrements the cash balance and adds stocks to the inventory.
Sell Condition: If the sell signal is valid (and meets the profit requirement), stocks are sold, and cash is incremented.
A fallback check ensures the sell logic prevents selling more stocks than are available and adjusts stock holding appropriately (e.g., sell half).
Customization and Usage
Indicator Adjustments: The user can choose which indicators to activate (e.g., EMA, MACD, RSI) via input controls. Each indicator has specific customizable parameters such as lengths, slopes, and conditions.
Signal Flexibility: The user can adjust conditions for buying and selling based on various technical indicators, which adds flexibility in implementing trading strategies. For example, users may require the RSI to be higher than its moving average or trigger sales only when MACD crosses under the signal line.
Profit Sensitivity: The software allows the option to sell only when a profit is assured by checking if the current price is higher than the last buy price.
Summary of Usage:
Indicator Selection: Enable or disable technical indicators like EMA, MACD, RSI, Aroon, ATR, and Bollinger Bands to fit your trading strategy.
Custom Date/Chart Settings: Choose whether to calculate based on specific time ranges or visible portions of the chart.
Dynamic Signal Plotting: Once buy or sell conditions are met, the software will visually plot signals on your chart, giving clear entry and exit points.
Investment Tracking: Real-time tracking of stock quantities, investments, and profit ensures a clear view of your trading performance.
Backtesting: Use this software for backtesting your strategy by analyzing how buy and sell signals would have performed historically based on the chosen indicators.
Conclusion
The FS Scorpion Tail software is a robust and flexible trading tool, allowing traders to develop custom strategies based on multiple well-known technical indicators. Its visual aid, coupled with real-time investment tracking, makes it valuable for systematic traders looking to automate or refine their trading approach.

RSI Weighted Trend System I [InvestorUnknown]The RSI Weighted Trend System I is an experimental indicator designed to combine both slow-moving trend indicators for stable trend identification and fast-moving indicators to capture potential major turning points in the market. The novelty of this system lies in the dynamic weighting mechanism, where fast indicators receive weight based on the current Relative Strength Index (RSI) value, thus providing a flexible tool for traders seeking to adapt their strategies to varying market conditions.
Dynamic RSI-Based Weighting System
The core of the indicator is the dynamic weighting of fast indicators based on the value of the RSI. In essence, the higher the absolute value of the RSI (whether positive or negative), the higher the weight assigned to the fast indicators. This enables the system to capture rapid price movements around potential turning points.
Users can choose between a threshold-based or continuous weight system:
Threshold-Based Weighting: Fast indicators are activated only when the absolute RSI value exceeds a user-defined threshold. Below this threshold, fast indicators receive no weight.
Continuous Weighting: By setting the weight threshold to zero, the fast indicators always receive some weight, although this can result in more false signals in ranging markets.
// Calculate weight for Fast Indicators based on RSI (Slow Indicator weight is kept to 1 for simplicity)
f_RSI_Weight_System(series float rsi, simple float weight_thre) =>
float fast_weight = na
float slow_weight = na
if weight_thre > 0
if math.abs(rsi) <= weight_thre
fast_weight := 0
slow_weight := 1
else
fast_weight := 0 + math.sqrt(math.abs(rsi))
slow_weight := 1
else
fast_weight := 0 + math.sqrt(math.abs(rsi))
slow_weight := 1
Slow and Fast Indicators
Slow Indicators are designed to identify stable trends, remaining constant in weight. These include:
DMI (Directional Movement Index) For Loop
CCI (Commodity Channel Index) For Loop
Aroon For Loop
Fast Indicators are more responsive and designed to spot rapid trend shifts:
ZLEMA (Zero-Lag Exponential Moving Average) For Loop
IIRF (Infinite Impulse Response Filter) For Loop
Each of these indicators is calculated using a for-loop method to generate a moving average, which captures the trend of a given length range.
RSI Normalization
To facilitate the weighting system, the RSI is normalized from its usual 0-100 range to a -1 to 1 range. This allows for easy scaling when calculating weights and helps the system adjust to rapidly changing market conditions.
// Normalize RSI (1 to -1)
f_RSI(series float rsi_src, simple int rsi_len, simple string rsi_wb, simple string ma_type, simple int ma_len) =>
output = switch rsi_wb
"RAW RSI" => ta.rsi(rsi_src, rsi_len)
"RSI MA" => ma_type == "EMA" ? (ta.ema(ta.rsi(rsi_src, rsi_len), ma_len)) : (ta.sma(ta.rsi(rsi_src, rsi_len), ma_len))
Signal Calculation
The final trading signal is a weighted average of both the slow and fast indicators, depending on the calculated weights from the RSI. This ensures a balanced approach, where slow indicators maintain overall trend guidance, while fast indicators provide timely entries and exits.
// Calculate Signal (as weighted average)
sig = math.round(((DMI*slow_w) + (CCI*slow_w) + (Aroon*slow_w) + (ZLEMA*fast_w) + (IIRF*fast_w)) / (3*slow_w + 2*fast_w), 2)
Backtest Mode and Performance Metrics
This version of the RSI Weighted Trend System includes a comprehensive backtesting mode, allowing users to evaluate the performance of their selected settings against a Buy & Hold strategy. The backtesting includes:
Equity calculation based on the signals generated by the indicator.
Performance metrics table comparing Buy & Hold strategy metrics with the system’s signals, including: Mean, positive, and negative return percentages, Standard deviations (of all, positive and negative returns), Sharpe Ratio, Sortino Ratio, and Omega Ratio
f_PerformanceMetrics(series float base, int Lookback, simple float startDate, bool Annualize = true) =>
// Initialize variables for positive and negative returns
pos_sum = 0.0
neg_sum = 0.0
pos_count = 0
neg_count = 0
returns_sum = 0.0
returns_squared_sum = 0.0
pos_returns_squared_sum = 0.0
neg_returns_squared_sum = 0.0
// Loop through the past 'Lookback' bars to calculate sums and counts
if (time >= startDate)
for i = 0 to Lookback - 1
r = (base - base ) / base
returns_sum += r
returns_squared_sum += r * r
if r > 0
pos_sum += r
pos_count += 1
pos_returns_squared_sum += r * r
if r < 0
neg_sum += r
neg_count += 1
neg_returns_squared_sum += r * r
float export_array = array.new_float(12)
// Calculate means
mean_all = math.round((returns_sum / Lookback) * 100, 2)
mean_pos = math.round((pos_count != 0 ? pos_sum / pos_count : na) * 100, 2)
mean_neg = math.round((neg_count != 0 ? neg_sum / neg_count : na) * 100, 2)
// Calculate standard deviations
stddev_all = math.round((math.sqrt((returns_squared_sum - (returns_sum * returns_sum) / Lookback) / Lookback)) * 100, 2)
stddev_pos = math.round((pos_count != 0 ? math.sqrt((pos_returns_squared_sum - (pos_sum * pos_sum) / pos_count) / pos_count) : na) * 100, 2)
stddev_neg = math.round((neg_count != 0 ? math.sqrt((neg_returns_squared_sum - (neg_sum * neg_sum) / neg_count) / neg_count) : na) * 100, 2)
// Calculate probabilities
prob_pos = math.round((pos_count / Lookback) * 100, 2)
prob_neg = math.round((neg_count / Lookback) * 100, 2)
prob_neu = math.round(((Lookback - pos_count - neg_count) / Lookback) * 100, 2)
// Calculate ratios
sharpe_ratio = math.round(mean_all / stddev_all * (Annualize ? math.sqrt(Lookback) : 1), 2)
sortino_ratio = math.round(mean_all / stddev_neg * (Annualize ? math.sqrt(Lookback) : 1), 2)
omega_ratio = math.round(pos_sum / math.abs(neg_sum), 2)
// Set values in the array
array.set(export_array, 0, mean_all), array.set(export_array, 1, mean_pos), array.set(export_array, 2, mean_neg),
array.set(export_array, 3, stddev_all), array.set(export_array, 4, stddev_pos), array.set(export_array, 5, stddev_neg),
array.set(export_array, 6, prob_pos), array.set(export_array, 7, prob_neu), array.set(export_array, 8, prob_neg),
array.set(export_array, 9, sharpe_ratio), array.set(export_array, 10, sortino_ratio), array.set(export_array, 11, omega_ratio)
// Export the array
export_array
The metrics help traders assess the effectiveness of their strategy over time and can be used to optimize their settings.
Calibration Mode
A calibration mode is included to assist users in tuning the indicator to their specific needs. In this mode, traders can focus on a specific indicator (e.g., DMI, CCI, Aroon, ZLEMA, IIRF, or RSI) and fine-tune it without interference from other signals.
The calibration plot visualizes the chosen indicator's performance against a zero line, making it easy to see how changes in the indicator’s settings affect its trend detection.
Customization and Default Settings
Important Note: The default settings provided are not optimized for any particular market or asset. They serve as a starting point for experimentation. Traders are encouraged to calibrate the system to suit their own trading strategies and preferences.
The indicator allows deep customization, from selecting which indicators to use, adjusting the lengths of each indicator, smoothing parameters, and the RSI weight system.
Alerts
Traders can set alerts for both long and short signals when the indicator flips, allowing for automated monitoring of potential trading opportunities.

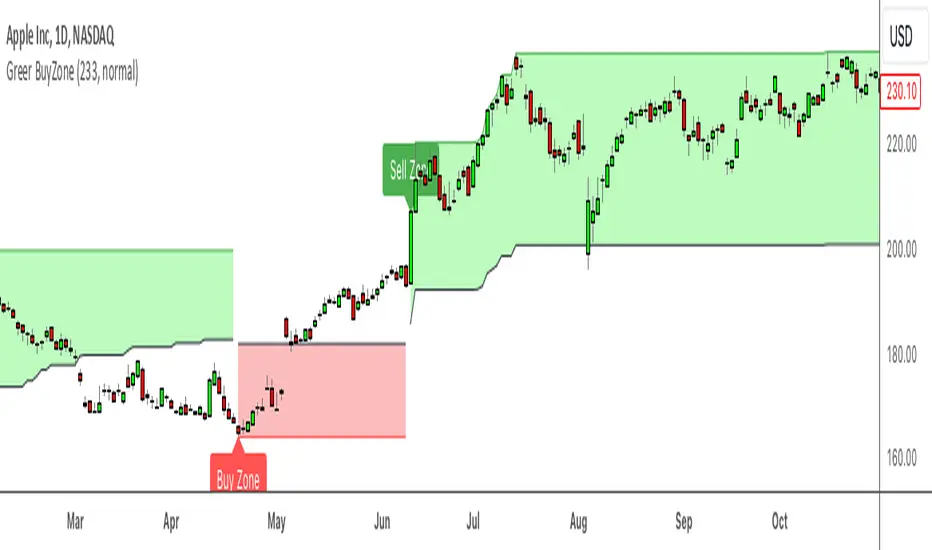
Greer BuyZone toolGreer BuyZone Tool
Description:
The Greer BuyZone Tool is a custom Pine Script indicator designed to help identify potential long-term investment opportunities by marking BuyZones on the chart. This tool utilizes the Aroon indicator in combination with Fibonacci numbers to define periods where the asset might be a good candidate for dollar-cost averaging.
Features:
BuyZone Detection: The script identifies and marks the beginning and end of a BuyZone with vertical lines and labels.
Visual Markers: A red vertical line and label indicate the start of a BuyZone, while a green vertical line and label mark the end of a BuyZone.
Aroon Indicator Calculation: Utilizes the Aroon indicator with a Fibonacci length (233) to determine key price levels.
How to Use:
Setup: Add the Greer BuyZone Tool to your TradingView chart. It will display vertical lines and labels marking the BuyZone periods.
BuyZone Identification: Use the red lines and labels ("BZ Begins ->>") to identify the start of a BuyZone, and the green lines and labels ("<<- BZ Ends") to determine when the BuyZone ends.
Long-Term Investment: This tool is intended for long-term investing and dollar-cost averaging strategies, not for day trading.
Disclaimer:
This script is provided for informational purposes only and is not intended as financial advice. The Greer BuyZone Tool is designed to assist in identifying potential long-term investment opportunities and is not suitable for day trading. The use of this tool involves risk, and there is no guarantee of profitability. Users are advised to conduct their own research and consult with a qualified financial advisor before making any investment decisions. The creator of this script assumes no liability for any losses or damages resulting from the use of this indicator.
Author: Sean Lee Greer
Date: 9/1/2024
MA Ratio Weighted Trend System I [InvestorUnknown]The MA Ratio Weighted Trend System I combines slow and fast indicators to identify stable trends and capture potential market turning points. By dynamically adjusting the weight of fast indicators based on the Moving Average Ratio (MAR), the system aims to provide timely entry and exit signals while maintaining overall trend stability through slow indicators.
Slow and Fast Indicators with Dynamic Weighting
Slow Indicators: Designed for stable trend identification, these indicators maintain a constant weight in the overall signal calculation. They include:
DMI For Loop (Directional Movement Index)
CCI For Loop (Commodity Channel Index)
Aroon For Loop
Fast Indicators: Aim to detect rapid market changes and potential turning points. Their weights are dynamically adjusted based on the absolute value of the Moving Average Ratio (MAR). Fast indicators include:
ZLEMA For Loop (Zero-Lag Exponential Moving Average)
IIRF For Loop (Infinite Impulse Response Filter)
Dynamic Weighting Mechanism:
Moving Average Ratio (MAR) is calculated as the ratio of the price to its moving average, minus one (for simplicity and visualization).
Weight Calculation
Fast indicator weights are determined based on the absolute value of MAR, possibly with an offset to avoid scenarios where MAR follows rapid price reversals too closely:
// Function to calculate weights based on MAR
f_mar_weights(series float mar, simple int offset, simple float weight_thre) =>
o_mar = math.abs(mar )
float fast_weight = 0
float slow_weight = 1
if o_mar != 0
if weight_thre > 0
if o_mar <= weight_thre
fast_weight := o_mar
else
fast_weight := o_mar
Threshold-Based vs. Continuous Weighting:
Threshold-Based: Fast indicators receive weight only when the absolute MAR exceeds a user-defined threshold (weight_thre).
Continuous: By setting weight_thre to zero, fast indicators always receive some weight, though this may increase false signals.
Offset Mechanism
The offset parameter shifts the MAR used for weighting by a certain number of bars. This helps avoid situations where the MAR follows sudden price movements too closely, preventing fast indicators from failing to provide timely exit signals.
Signal Calculation
The final signal is a weighted average of the slow and fast indicators:
// Calculate Signal (as weighted average)
float sig = math.round(((DMI*slow_w) + (CCI*slow_w) + (Aroon*slow_w) + (ZLEMA*fast_w) + (IIRF*fast_w)) / (3*slow_w + 2*fast_w), 2)
Backtesting and Performance Metrics
Enables users to test the indicator's performance over historical data, comparing it to a buy-and-hold strategy.
Alerts
Set up alerts for when the signal crosses above or below the thresholds.
alertcondition(long_alert, "LONG (MAR Weighted Trend System)", "MAR Weighted Trend System flipped ⬆LONG⬆")
alertcondition(short_alert, "SHORT (MAR Weighted Trend System)", "MAR Weighted Trend System flipped ⬇Short⬇")
Important Notes
Customization: Due to the experimental nature of this indicator, users are strongly encouraged to adjust and calibrate the settings to align with their trading strategies and market conditions.
Default Settings Disclaimer: The default settings are not optimized or recommended for any specific use and serve only as placeholders for the indicator's publication.
Backtest Results Disclaimer: Historical backtest results are not indicative of future performance. Market conditions change, and past results do not guarantee future outcomes.
FMS Suite [KFB Quant]FMS Suite
Overview
The FMS Suite is a powerful and adaptive trend and momentum analysis tool that leverages multiple technical indicators to deliver a comprehensive signal for market direction. This suite combines the strengths of the Aroon, DMI, RSI, Supertrend, and Trix indicators, offering traders a well-rounded perspective on market trends.
How It Works
The FMS Suite integrates five essential components to assess market behavior:
Aroon Indicator : Detects trend strength and direction by analyzing the frequency of recent highs and lows over multiple timeframes. Directional Movement Index (DMI) : Measures the direction and strength of trends, with an ADX component for better trend assessment. Relative Strength Index (RSI) : Evaluates market momentum by indicating overbought or oversold conditions, with signals derived from the 50-line. Supertrend : Utilizes ATR-based volatility measures to establish dynamic support and resistance levels, signaling potential trend changes. Trix : A triple-smoothed EMA oscillator that highlights trend reversals using rate-of-change dynamics.
Each component is calculated across three separate timeframes (fast, medium, and slow), which are then averaged to produce a final FMS Signal . Users can also apply signal smoothing to reduce noise and enhance clarity.
Key Features
Customizable Parameters : Adjust the lengths for each component (fast, medium, slow) to optimize the indicator's responsiveness to different markets. Signal Smoothing Options : Select from various smoothing methods, including SMA, EMA, DEMA, and WMA, to fine-tune the FMS signal. Visual Representation : The FMS Suite plots a histogram representing the raw signal and a smoother line for clearer trend visualization. The background color shifts dynamically to indicate long, short, or neutral conditions. Threshold-Based Alerts : Set your own long and short thresholds, tailoring the indicator to your trading strategy and market outlook. Informative Table Display : An integrated table provides an at-a-glance summary of the current FMS and smoothed FMS signals, along with their respective scores and market state.
How to Use
Trend Confirmation : Utilize the FMS histogram and smoothed signal to validate or challenge existing trend assumptions. Trade Entries and Exits : Identify potential buy (long) or sell (short) signals based on the relationship between the FMS signal and predefined thresholds. Strategy Customization : Fine-tune the indicator settings to align with your trading style, whether it’s short-term scalping or long-term trend following.
Important Considerations
Not Predictive : The FMS Suite does not predict future price movements and should be used in conjunction with other analysis methods. It is based on historical price data, and past performance is not indicative of future results. Settings and Backtesting : Experiment with different lengths and smoothing techniques to optimize performance for specific instruments and market conditions. Always backtest thoroughly.
Disclaimer: This tool is provided for informational and educational purposes only and should not be considered as financial advice. Always conduct your own research and consult with a licensed financial advisor before making any investment decisions.

Z-Score Weighted Trend System I [InvestorUnknown]The Z-Score Weighted Trend System I is an advanced and experimental trading indicator designed to utilize a combination of slow and fast indicators for a comprehensive analysis of market trends. The system is designed to identify stable trends using slower indicators while capturing rapid market shifts through dynamically weighted fast indicators. The core of this indicator is the dynamic weighting mechanism that utilizes the Z-score of price , allowing the system to respond effectively to significant market movements.
Dynamic Z-Score-Based Weighting System
The Z-Score Weighted Trend System I utilizes the Z-score of price to assign weights dynamically to fast indicators. This mechanism is designed to capture rapid market shifts at potential turning points, providing timely entry and exit signals.
Traders can choose from two primary weighting mechanisms:
Threshold-Based Weighting: The fast indicators are given weight only when the absolute Z-score exceeds a user-defined threshold. Below this threshold, fast indicators have no impact on the final signal.
Continuous Weighting: By setting the threshold to zero, fast indicators always contribute to the final signal, regardless of Z-score levels. However, this increases the likelihood of false signals during ranging or low-volatility markets
// Calculate weight for Fast Indicators based on Z-Score (Slow Indicator weight is kept to 1 for simplicity)
f_zscore_weights(series float z, simple float weight_thre) =>
float fast_weight = na
float slow_weight = na
if weight_thre > 0
if math.abs(z) <= weight_thre
fast_weight := 0
slow_weight := 1
else
fast_weight := 0 + math.sqrt(math.abs(z))
slow_weight := 1
else
fast_weight := 0 + math.sqrt(math.abs(z))
slow_weight := 1
Choice of Z-Score Normalization
Traders have the flexibility to select different Z-score processing methods to better suit their trading preferences:
Raw Z-Score or Moving Average: Traders can opt for either the raw Z-score or a moving average of the Z-score to smooth out fluctuations.
Normalized Z-Score (ranging from -1 to 1) or Z-Score Percentile: The normalized Z-score is simply the raw Z-score divided by 3, while the Z-score percentile utilizes a normal distribution for transformation.
f_zscore_perc(series float zscore_src, simple int zscore_len, simple string zscore_a, simple string zscore_b, simple string ma_type, simple int ma_len) =>
z = (zscore_src - ta.sma(zscore_src, zscore_len)) / ta.stdev(zscore_src, zscore_len)
zscore = switch zscore_a
"Z-Score" => z
"Z-Score MA" => ma_type == "EMA" ? (ta.ema(z, ma_len)) : (ta.sma(z, ma_len))
output = switch zscore_b
"Normalized Z-Score" => (zscore / 3) > 1 ? 1 : (zscore / 3) < -1 ? -1 : (zscore / 3)
"Z-Score Percentile" => (f_percentileFromZScore(zscore) - 0.5) * 2
output
Slow and Fast Indicators
The indicator uses a combination of slow and fast indicators:
Slow Indicators (constant weight) for stable trend identification: DMI (Directional Movement Index), CCI (Commodity Channel Index), Aroon
Fast Indicators (dynamic weight) to identify rapid trend shifts: ZLEMA (Zero-Lag Exponential Moving Average), IIRF (Infinite Impulse Response Filter)
Each indicator is calculated using for-loop methods to provide a smoothed and averaged view of price data over varying lengths, ensuring stability for slow indicators and responsiveness for fast indicators.
Signal Calculation
The final trading signal is determined by a weighted combination of both slow and fast indicators. The slow indicators provide a stable view of the trend, while the fast indicators offer agile responses to rapid market movements. The signal calculation takes into account the dynamic weighting of fast indicators based on the Z-score:
// Calculate Signal (as weighted average)
float sig = math.round(((DMI*slow_w) + (CCI*slow_w) + (Aroon*slow_w) + (ZLEMA*fast_w) + (IIRF*fast_w)) / (3*slow_w + 2*fast_w), 2)
Backtest Mode and Performance Metrics
The indicator features a detailed backtesting mode, allowing traders to compare the effectiveness of their selected settings against a traditional Buy & Hold strategy. The backtesting provides:
Equity calculation based on signals generated by the indicator.
Performance metrics comparing Buy & Hold metrics with the system’s signals, including: Mean, positive, and negative return percentages, Standard deviations, Sharpe, Sortino, and Omega Ratios
// Calculate Performance Metrics
f_PerformanceMetrics(series float base, int Lookback, simple float startDate, bool Annualize = true) =>
// Initialize variables for positive and negative returns
pos_sum = 0.0
neg_sum = 0.0
pos_count = 0
neg_count = 0
returns_sum = 0.0
returns_squared_sum = 0.0
pos_returns_squared_sum = 0.0
neg_returns_squared_sum = 0.0
// Loop through the past 'Lookback' bars to calculate sums and counts
if (time >= startDate)
for i = 0 to Lookback - 1
r = (base - base ) / base
returns_sum += r
returns_squared_sum += r * r
if r > 0
pos_sum += r
pos_count += 1
pos_returns_squared_sum += r * r
if r < 0
neg_sum += r
neg_count += 1
neg_returns_squared_sum += r * r
float export_array = array.new_float(12)
// Calculate means
mean_all = math.round((returns_sum / Lookback), 4)
mean_pos = math.round((pos_count != 0 ? pos_sum / pos_count : na), 4)
mean_neg = math.round((neg_count != 0 ? neg_sum / neg_count : na), 4)
// Calculate standard deviations
stddev_all = math.round((math.sqrt((returns_squared_sum - (returns_sum * returns_sum) / Lookback) / Lookback)) * 100, 2)
stddev_pos = math.round((pos_count != 0 ? math.sqrt((pos_returns_squared_sum - (pos_sum * pos_sum) / pos_count) / pos_count) : na) * 100, 2)
stddev_neg = math.round((neg_count != 0 ? math.sqrt((neg_returns_squared_sum - (neg_sum * neg_sum) / neg_count) / neg_count) : na) * 100, 2)
// Calculate probabilities
prob_pos = math.round((pos_count / Lookback) * 100, 2)
prob_neg = math.round((neg_count / Lookback) * 100, 2)
prob_neu = math.round(((Lookback - pos_count - neg_count) / Lookback) * 100, 2)
// Calculate ratios
sharpe_ratio = math.round((mean_all / stddev_all * (Annualize ? math.sqrt(Lookback) : 1))* 100, 2)
sortino_ratio = math.round((mean_all / stddev_neg * (Annualize ? math.sqrt(Lookback) : 1))* 100, 2)
omega_ratio = math.round(pos_sum / math.abs(neg_sum), 2)
// Set values in the array
array.set(export_array, 0, mean_all), array.set(export_array, 1, mean_pos), array.set(export_array, 2, mean_neg),
array.set(export_array, 3, stddev_all), array.set(export_array, 4, stddev_pos), array.set(export_array, 5, stddev_neg),
array.set(export_array, 6, prob_pos), array.set(export_array, 7, prob_neu), array.set(export_array, 8, prob_neg),
array.set(export_array, 9, sharpe_ratio), array.set(export_array, 10, sortino_ratio), array.set(export_array, 11, omega_ratio)
// Export the array
export_array
//}
Calibration Mode
A Calibration Mode is included for traders to focus on individual indicators, helping them fine-tune their settings without the influence of other components. In Calibration Mode, the user can visualize each indicator separately, making it easier to adjust parameters.
Alerts
The indicator includes alerts for long and short signals when the indicator changes direction, allowing traders to set automated notifications for key market events.
// Alert Conditions
alertcondition(long_alert, "LONG (Z-Score Weighted Trend System)", "Z-Score Weighted Trend System flipped ⬆LONG⬆")
alertcondition(short_alert, "SHORT (Z-Score Weighted Trend System)", "Z-Score Weighted Trend System flipped ⬇Short⬇")
Important Note:
The default settings of this indicator are not optimized for any particular market condition. They are generic starting points for experimentation. Traders are encouraged to use the calibration tools and backtesting features to adjust the system to their specific trading needs.
The results generated from the backtest are purely historical and are not indicative of future results. Market conditions can change, and the performance of this system may differ under different circumstances. Traders and investors should exercise caution and conduct their own research before using this indicator for any trading decisions.
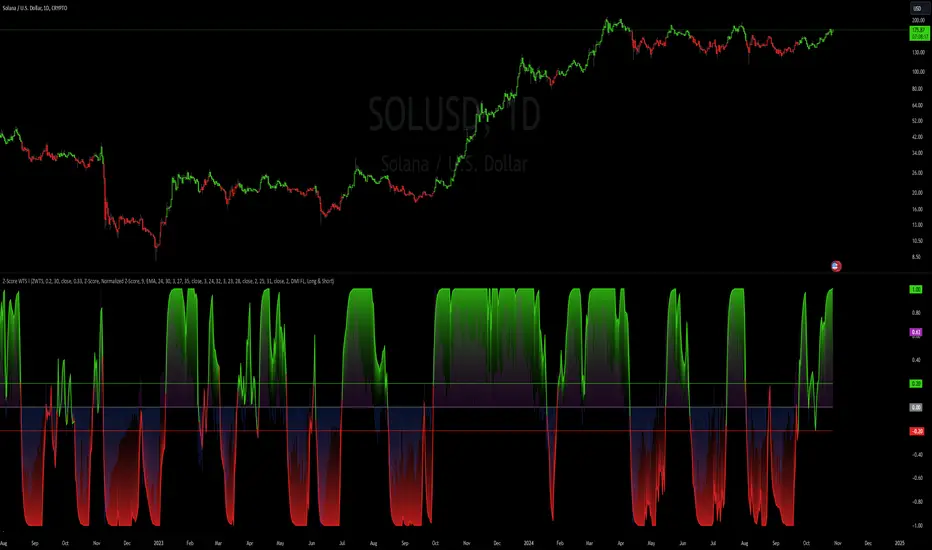
Machine Learning: Multiple Logistic Regression
Multiple Logistic Regression Indicator
The Logistic Regression Indicator for TradingView is a versatile tool that employs multiple logistic regression based on various technical indicators to generate potential buy and sell signals. By utilizing key indicators such as RSI, CCI, DMI, Aroon, EMA, and SuperTrend, the indicator aims to provide a systematic approach to decision-making in financial markets.
How It Works:
Technical Indicators:
The script uses multiple technical indicators such as RSI, CCI, DMI, Aroon, EMA, and SuperTrend as input variables for the logistic regression model.
These indicators are normalized to create categorical variables, providing a consistent scale for the model.
Logistic Regression:
The logistic regression function is applied to the normalized input variables (x1 to x6) with user-defined coefficients (b0 to b6).
The logistic regression model predicts the probability of a binary outcome, with values closer to 1 indicating a bullish signal and values closer to 0 indicating a bearish signal.
Loss Function (Cross-Entropy Loss):
The cross-entropy loss function is calculated to quantify the difference between the predicted probability and the actual outcome.
The goal is to minimize this loss, which essentially measures the model's accuracy.
// Error Function (cross-entropy loss)
loss(y, p) =>
-y * math.log(p) - (1 - y) * math.log(1 - p)
// y - depended variable
// p - multiple logistic regression
Gradient Descent:
Gradient descent is an optimization algorithm used to minimize the loss function by adjusting the weights of the logistic regression model.
The script iteratively updates the weights (b1 to b6) based on the negative gradient of the loss function with respect to each weight.
// Adjusting model weights using gradient descent
b1 -= lr * (p + loss) * x1
b2 -= lr * (p + loss) * x2
b3 -= lr * (p + loss) * x3
b4 -= lr * (p + loss) * x4
b5 -= lr * (p + loss) * x5
b6 -= lr * (p + loss) * x6
// lr - learning rate or step of learning
// p - multiple logistic regression
// x_n - variables
Learning Rate:
The learning rate (lr) determines the step size in the weight adjustment process. It prevents the algorithm from overshooting the minimum of the loss function.
Users can set the learning rate to control the speed and stability of the optimization process.
Visualization:
The script visualizes the output of the logistic regression model by coloring the SMA.
Arrows are plotted at crossover and crossunder points, indicating potential buy and sell signals.
Lables are showing logistic regression values from 1 to 0 above and below bars
Table Display:
A table is displayed on the chart, providing real-time information about the input variables, their values, and the learned coefficients.
This allows traders to monitor the model's interpretation of the technical indicators and observe how the coefficients change over time.
How to Use:
Parameter Adjustment:
Users can adjust the length of technical indicators (rsi_length, cci_length, etc.) and the Z score length based on their preference and market characteristics.
Set the initial values for the regression coefficients (b0 to b6) and the learning rate (lr) according to your trading strategy.
Signal Interpretation:
Buy signals are indicated by an upward arrow (▲), and sell signals are indicated by a downward arrow (▼).
The color-coded SMA provides a visual representation of the logistic regression output by color.
Table Information:
Monitor the table for real-time information on the input variables, their values, and the learned coefficients.
Keep an eye on the learning rate to ensure a balance between model adjustment speed and stability.
Backtesting and Validation:
Before using the script in live trading, conduct thorough backtesting to evaluate its performance under different market conditions.
Validate the model against historical data to ensure its reliability.

CVD - Cumulative Volume Delta (Chart)█ OVERVIEW
This indicator displays cumulative volume delta (CVD) as an on-chart oscillator. It uses intrabar analysis to obtain more precise volume delta information compared to methods that only use the chart's timeframe.
The core concepts in this script come from our first CVD indicator , which displays CVD values as plot candles in a separate indicator pane. In this script, CVD values are scaled according to price ranges and represented on the main chart pane.
█ CONCEPTS
Bar polarity
Bar polarity refers to the position of the close price relative to the open price. In other words, bar polarity is the direction of price change.
Intrabars
Intrabars are chart bars at a lower timeframe than the chart's. Each 1H chart bar of a 24x7 market will, for example, usually contain 60 bars at the lower timeframe of 1min, provided there was market activity during each minute of the hour. Mining information from intrabars can be useful in that it offers traders visibility on the activity inside a chart bar.
Lower timeframes (LTFs)
A lower timeframe is a timeframe that is smaller than the chart's timeframe. This script utilizes a LTF to analyze intrabars, or price changes within a chart bar. The lower the LTF, the more intrabars are analyzed, but the less chart bars can display information due to the limited number of intrabars that can be analyzed.
Volume delta
Volume delta is a measure that separates volume into "up" and "down" parts, then takes the difference to estimate the net demand for the asset. This approach gives traders a more detailed insight when analyzing volume and market sentiment. There are several methods for determining whether an asset's volume belongs in the "up" or "down" category. Some indicators, such as On Balance Volume and the Klinger Oscillator , use the change in price between bars to assign volume values to the appropriate category. Others, such as Chaikin Money Flow , make assumptions based on open, high, low, and close prices. The most accurate method involves using tick data to determine whether each transaction occurred at the bid or ask price and assigning the volume value to the appropriate category accordingly. However, this method requires a large amount of data on historical bars, which can limit the historical depth of charts and the number of symbols for which tick data is available.
In the context where historical tick data is not yet available on TradingView, intrabar analysis is the most precise technique to calculate volume delta on historical bars on our charts. This indicator uses intrabar analysis to achieve a compromise between simplicity and accuracy in calculating volume delta on historical bars. Our Volume Profile indicators use it as well. Other volume delta indicators in our Community Scripts , such as the Realtime 5D Profile , use real-time chart updates to achieve more precise volume delta calculations. However, these indicators aren't suitable for analyzing historical bars since they only work for real-time analysis.
This is the logic we use to assign intrabar volume to the "up" or "down" category:
• If the intrabar's open and close values are different, their relative position is used.
• If the intrabar's open and close values are the same, the difference between the intrabar's close and the previous intrabar's close is used.
• As a last resort, when there is no movement during an intrabar and it closes at the same price as the previous intrabar, the last known polarity is used.
Once all intrabars comprising a chart bar are analyzed, we calculate the net difference between "up" and "down" intrabar volume to produce the volume delta for the chart bar.
█ FEATURES
CVD resets
The "cumulative" part of the indicator's name stems from the fact that calculations accumulate during a period of time. By periodically resetting the volume delta accumulation, we can analyze the progression of volume delta across manageable chunks, which is often more useful than looking at volume delta accumulated from the beginning of a chart's history.
You can configure the reset period using the "CVD Resets" input, which offers the following selections:
• None : Calculations do not reset.
• On a fixed higher timeframe : Calculations reset on the higher timeframe you select in the "Fixed higher timeframe" field.
• At a fixed time that you specify.
• At the beginning of the regular session .
• On trend changes : Calculations reset on the direction change of either the Aroon indicator, Parabolic SAR , or Supertrend .
• On a stepped higher timeframe : Calculations reset on a higher timeframe automatically stepped using the chart's timeframe and following these rules:
Chart TF HTF
< 1min 1H
< 3H 1D
<= 12H 1W
< 1W 1M
>= 1W 1Y
Specifying intrabar precision
Ten options are included in the script to control the number of intrabars used per chart bar for calculations. The greater the number of intrabars per chart bar, the fewer chart bars can be analyzed.
The first five options allow users to specify the approximate amount of chart bars to be covered:
• Least Precise (Most chart bars) : Covers all chart bars by dividing the current timeframe by four.
This ensures the highest level of intrabar precision while achieving complete coverage for the dataset.
• Less Precise (Some chart bars) & More Precise (Less chart bars) : These options calculate a stepped LTF in relation to the current chart's timeframe.
• Very precise (2min intrabars) : Uses the second highest quantity of intrabars possible with the 2min LTF.
• Most precise (1min intrabars) : Uses the maximum quantity of intrabars possible with the 1min LTF.
The stepped lower timeframe for "Less Precise" and "More Precise" options is calculated from the current chart's timeframe as follows:
Chart Timeframe Lower Timeframe
Less Precise More Precise
< 1hr 1min 1min
< 1D 15min 1min
< 1W 2hr 30min
> 1W 1D 60min
The last five options allow users to specify an approximate fixed number of intrabars to analyze per chart bar. The available choices are 12, 24, 50, 100, and 250. The script will calculate the LTF which most closely approximates the specified number of intrabars per chart bar. Keep in mind that due to factors such as the length of a ticker's sessions and rounding of the LTF, it is not always possible to produce the exact number specified. However, the script will do its best to get as close to the value as possible.
As there is a limit to the number of intrabars that can be analyzed by a script, a tradeoff occurs between the number of intrabars analyzed per chart bar and the chart bars for which calculations are possible.
Display
This script displays raw or cumulative volume delta values on the chart as either line or histogram oscillator zones scaled according to the price chart, allowing traders to visualize volume activity on each bar or cumulatively over time. The indicator's background shows where CVD resets occur, demarcating the beginning of new zones. The vertical axis of each oscillator zone is scaled relative to the one with the highest price range, and the oscillator values are scaled relative to the highest volume delta. A vertical offset is applied to each oscillator zone so that the highest oscillator value aligns with the lowest price. This method ensures an accurate, intuitive visual comparison of volume activity within zones, as the scale is consistent across the chart, and oscillator values sit below prices. The vertical scale of oscillator zones can be adjusted using the "Zone Height" input in the script settings.
This script displays labels at the highest and lowest oscillator values in each zone, which can be enabled using the "Hi/Lo Labels" input in the "Visuals" section of the script settings. Additionally, the oscillator's value on a chart bar is displayed as a tooltip when a user hovers over the bar, which can be enabled using the "Value Tooltips" input.
Divergences occur when the polarity of volume delta does not match that of the chart bar. The script displays divergences as bar colors and background colors that can be enabled using the "Color bars on divergences" and "Color background on divergences" inputs.
An information box in the lower-left corner of the indicator displays the HTF used for resets, the LTF used for intrabars, the average quantity of intrabars per chart bar, and the number of chart bars for which there is LTF data. This is enabled using the "Show information box" input in the "Visuals" section of the script settings.
FOR Pine Script™ CODERS
• This script utilizes `ltf()` and `ltfStats()` from the lower_tf library.
The `ltf()` function determines the appropriate lower timeframe from the selected calculation mode and chart timeframe, and returns it in a format that can be used with request.security_lower_tf() .
The `ltfStats()` function, on the other hand, is used to compute and display statistical information about the lower timeframe in an information box.
• The script utilizes display.data_window and display.status_line to restrict the display of certain plots.
These new built-ins allow coders to fine-tune where a script’s plot values are displayed.
• The newly added session.isfirstbar_regular built-in allows for resetting the CVD segments at the start of the regular session.
• The VisibleChart library developed by our resident PineCoders team leverages the chart.left_visible_bar_time and chart.right_visible_bar_time variables to optimize the performance of this script.
These variables identify the opening time of the leftmost and rightmost visible bars on the chart, allowing the script to recalculate and draw objects only within the range of visible bars as the user scrolls.
This functionality also enables the scaling of the oscillator zones.
These variables are just a couple of the many new built-ins available in the chart.* namespace.
For more information, check out this blog post or look them up by typing "chart." in the Pine Script™ Reference Manual .
• Our ta library has undergone significant updates recently, including the incorporation of the `aroon()` indicator used as a method for resetting CVD segments within this script.
Revisit the library to see more of the newly added content!
Look first. Then leap.

ADX + DI x Upgraded to Pine v4 x KingThiesAverage Directional Movement Index
Momentum based tool to measure trend strength on scale of 1-100
Similar to the aroon but incorporates a 3rd measure, while aroon uses two
The majority of these calculations were pre-existing in older pine scripts but have since been updated
signals are given when -DI and +DI cross, ADX illustrates corresponding strength at time of cross
Full Intro
ADX can help investors to identify trend strengths, as di - di determines the trend direction, while d - d is an impulse indicator. If the ADX is below 20, it can be considered impulsive, while it is above 25 on a trend line.
A trading signal can be generated when the di - DI line is switched to d - d and vice versa. If the di-line crosses and the ADX is above 20 (ideally 25), a potential buy signal could ebb away.
If the ADX is above 20, there is the possibility of potential short selling if the DI crosses over DI. You can also use crosses to get out of the current deal if you need it for a long time.
If the di-line is crossed and the Adx is below 20 (or 25), there may be opportunities to enter the potential for short trading, but only if di are above or below DI or if the price is trendy and may not prove to be the ideal time to start trading.
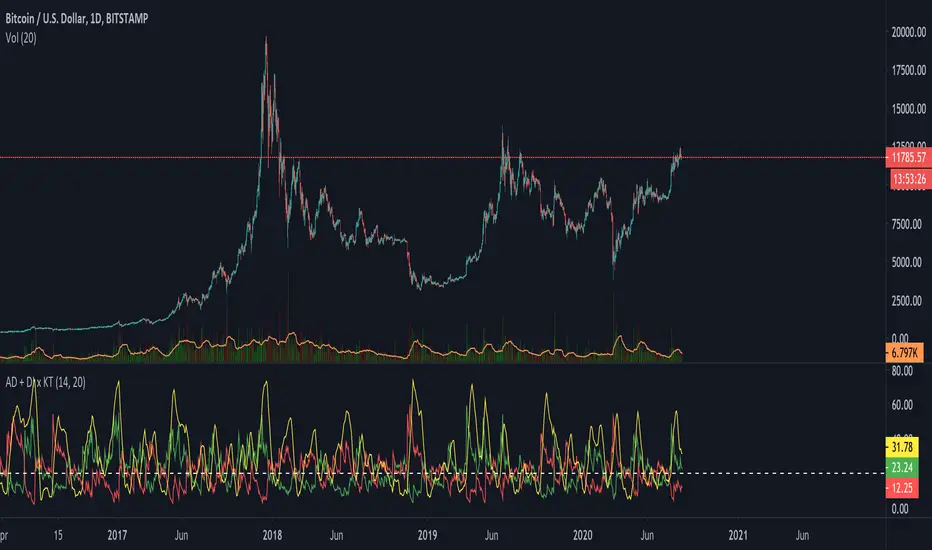
DynLenLibLibrary "DynLenLib"
sum_dyn(src, len)
Parameters:
src (float)
len (int)
lag_dyn(src, len)
Parameters:
src (float)
len (int)
highest_dyn(src, len)
Parameters:
src (float)
len (int)
lowest_dyn(src, len)
Parameters:
src (float)
len (int)
var_dyn(src, len)
Parameters:
src (float)
len (int)
stdev_dyn(src, len)
Parameters:
src (float)
len (int)
hl2()
hlc3()
ohlc4()
sma_dyn(src, len)
Parameters:
src (float)
len (int)
ema_dyn(src, len)
Parameters:
src (float)
len (int)
rma_dyn(src, len)
Parameters:
src (float)
len (int)
smma_dyn(src, len)
Parameters:
src (float)
len (int)
wma_dyn(src, len)
Parameters:
src (float)
len (int)
vwma_dyn(price, vol, len)
Parameters:
price (float)
vol (float)
len (int)
hma_dyn(src, len)
Parameters:
src (float)
len (int)
dema_dyn(src, len)
Parameters:
src (float)
len (int)
tema_dyn(src, len)
Parameters:
src (float)
len (int)
kama_dyn(src, erLen, fastLen, slowLen)
Parameters:
src (float)
erLen (int)
fastLen (int)
slowLen (int)
mcginley_dyn(src, len)
Parameters:
src (float)
len (int)
median_price()
true_range()
atr_dyn(len)
Parameters:
len (int)
bbands_dyn(src, len, mult)
Parameters:
src (float)
len (int)
mult (float)
bb_percent_b(src, len, mult)
Parameters:
src (float)
len (int)
mult (float)
bb_bandwidth(src, len, mult)
Parameters:
src (float)
len (int)
mult (float)
keltner_dyn(src, lenEMA, lenATR, multATR)
Parameters:
src (float)
lenEMA (int)
lenATR (int)
multATR (float)
donchian_dyn(len)
Parameters:
len (int)
choppiness_index(len)
Parameters:
len (int)
vol_stop(lenATR, mult)
Parameters:
lenATR (int)
mult (float)
roc_dyn(src, len)
Parameters:
src (float)
len (int)
rsi_dyn(src, len)
Parameters:
src (float)
len (int)
stoch_dyn(kLen, dLen, smoothK)
Parameters:
kLen (int)
dLen (int)
smoothK (int)
stoch_rsi_dyn(rsiLen, stochLen, kSmooth, dLen)
Parameters:
rsiLen (int)
stochLen (int)
kSmooth (int)
dLen (int)
cci_dyn(src, len)
Parameters:
src (float)
len (int)
cmo_dyn(src, len)
Parameters:
src (float)
len (int)
trix_dyn(len)
Parameters:
len (int)
tsi_dyn(shortLen, longLen)
Parameters:
shortLen (int)
longLen (int)
ultimate_osc(len1, len2, len3)
Parameters:
len1 (int)
len2 (int)
len3 (int)
dpo_dyn(src, len)
Parameters:
src (float)
len (int)
willr_dyn(len)
Parameters:
len (int)
macd_dyn(src, fastLen, slowLen, sigLen)
Parameters:
src (float)
fastLen (int)
slowLen (int)
sigLen (int)
ppo_dyn(src, fastLen, slowLen, sigLen)
Parameters:
src (float)
fastLen (int)
slowLen (int)
sigLen (int)
aroon_dyn(len)
Parameters:
len (int)
dmi_adx_dyn(diLen, adxLen)
Parameters:
diLen (int)
adxLen (int)
vortex_dyn(len)
Parameters:
len (int)
coppock_dyn(rocLen1, rocLen2, wmaLen)
Parameters:
rocLen1 (int)
rocLen2 (int)
wmaLen (int)
rvi_dyn(len)
Parameters:
len (int)
price_osc_dyn(src, fastLen, slowLen)
Parameters:
src (float)
fastLen (int)
slowLen (int)
rci_dyn(src, len)
Parameters:
src (float)
len (int)
obv()
pvt()
cmf_dyn(len)
Parameters:
len (int)
adl()
chaikin_osc_dyn(fastLen, slowLen)
Parameters:
fastLen (int)
slowLen (int)
mfi_dyn(len)
Parameters:
len (int)
volume_osc_dyn(fastLen, slowLen)
Parameters:
fastLen (int)
slowLen (int)
up_down_volume()
cvd()
supertrend_dyn(atrLen, mult)
Parameters:
atrLen (int)
mult (float)
envelopes_dyn(src, len, pct)
Parameters:
src (float)
len (int)
pct (float)
linreg_line_slope(src, len)
Parameters:
src (float)
len (int)
lsma_dyn(src, len)
Parameters:
src (float)
len (int)
corrcoef_dyn(a, b, len)
Parameters:
a (float)
b (float)
len (int)
psar(step, maxStep)
Parameters:
step (float)
maxStep (float)
pivots_standard()
williams_alligator(src, jawLen, teethLen, lipsLen)
Parameters:
src (float)
jawLen (int)
teethLen (int)
lipsLen (int)
twap_dyn(src, len)
Parameters:
src (float)
len (int)
vwap_anchored(price, volume, reset)
Parameters:
price (float)
volume (float)
reset (bool)
performance_pct(len)
Parameters:
len (int)
