Aroon OscillatorAroon Oscillator for the Aroon indicator. This creates an oscillator out of the upper and lower aroon plots.
"aroon" için komut dosyalarını ara

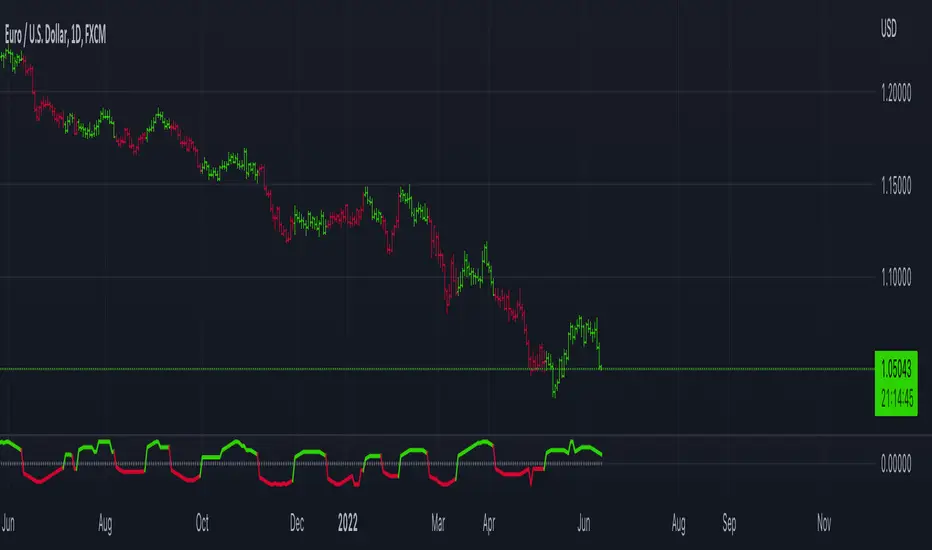
Aroon Oscillator of Adaptive RSI [Loxx]Aroon Oscillator of Adaptive RSI uses RSI to calculate AROON in attempt to capture more trend and momentum quicker than Aroon or RSI alone. Aroon Oscillator of Adaptive RSI has three different types of RSI calculations and the choice of either fixed, VHF Adaptive, or Band-pass Adaptive cycle measures to calculate RSI.
Arron Oscillator:
The Aroon Oscillator was developed by Tushar Chande in 1995 as part of the Aroon Indicator system. Chande’s intention for the system was to highlight short-term trend changes. The name Aroon is derived from the Sanskrit language and roughly translates to “dawn’s early light.”
The Aroon Oscillator is a trend-following indicator that uses aspects of the Aroon Indicator (Aroon Up and Aroon Down) to gauge the strength of a current trend and the likelihood that it will continue.
Aroon oscillator readings above zero indicate that an uptrend is present, while readings below zero indicate that a downtrend is present. Traders watch for zero line crossovers to signal potential trend changes. They also watch for big moves, above 50 or below -50 to signal strong price moves.
Wilders' RSI:
The Relative Strength Index (RSI) is a well versed momentum based oscillator which is used to measure the speed (velocity) as well as the change (magnitude) of directional price movements. Essentially RSI, when graphed, provides a visual mean to monitor both the current, as well as historical, strength and weakness of a particular market. The strength or weakness is based on closing prices over the duration of a specified trading period creating a reliable metric of price and momentum changes. Given the popularity of cash settled instruments (stock indexes) and leveraged financial products (the entire field of derivatives); RSI has proven to be a viable indicator of price movements.
RSX RSI:
RSI is a very popular technical indicator, because it takes into consideration market speed, direction and trend uniformity. However, the its widely criticized drawback is its noisy (jittery) appearance. The Jurk RSX retains all the useful features of RSI, but with one important exception: the noise is gone with no added lag.
Rapid RSI:
Rapid RSI Indicator, from Ian Copsey's article in the October 2006 issue of Stocks & Commodities magazine.
RapidRSI resembles Wilder's RSI, but uses a SMA instead of a WilderMA for internal smoothing of price change accumulators.
VHF Adaptive Cycle:
Vertical Horizontal Filter (VHF) was created by Adam White to identify trending and ranging markets. VHF measures the level of trend activity, similar to ADX DI. Vertical Horizontal Filter does not, itself, generate trading signals, but determines whether signals are taken from trend or momentum indicators. Using this trend information, one is then able to derive an average cycle length.
Band-pass Adaptive Cycle
Even the most casual chart reader will be able to spot times when the market is cycling and other times when longer-term trends are in play. Cycling markets are ideal for swing trading however attempting to “trade the swing” in a trending market can be a recipe for disaster. Similarly, applying trend trading techniques during a cycling market can equally wreak havoc in your account. Cycle or trend modes can readily be identified in hindsight. But it would be useful to have an objective scientific approach to guide you as to the current market mode.
There are a number of tools already available to differentiate between cycle and trend modes. For example, measuring the trend slope over the cycle period to the amplitude of the cyclic swing is one possibility.
We begin by thinking of cycle mode in terms of frequency or its inverse, periodicity. Since the markets are fractal ; daily, weekly, and intraday charts are pretty much indistinguishable when time scales are removed. Thus it is useful to think of the cycle period in terms of its bar count. For example, a 20 bar cycle using daily data corresponds to a cycle period of approximately one month.
When viewed as a waveform, slow-varying price trends constitute the waveform's low frequency components and day-to-day fluctuations (noise) constitute the high frequency components. The objective in cycle mode is to filter out the unwanted components--both low frequency trends and the high frequency noise--and retain only the range of frequencies over the desired swing period. A filter for doing this is called a bandpass filter and the range of frequencies passed is the filter's bandwidth.
Included:
-Toggle on/off bar coloring
-Customize RSI signal using fixed, VHF Adaptive, and Band-pass Adaptive calculations
-Choose from three different RSI types
Happy trading!
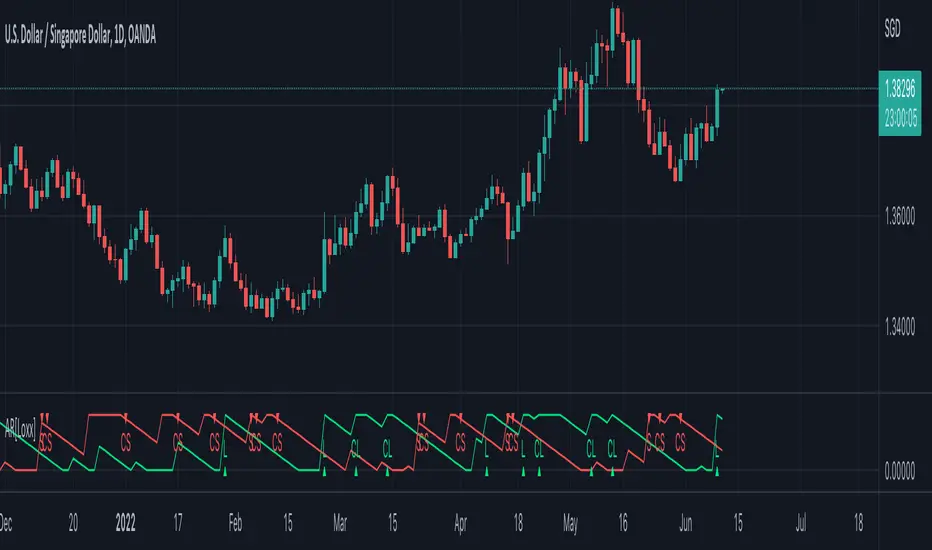
Aroon [Loxx]The Aroon indicator is a technical indicator that is used to identify trend changes in the price of an asset, as well as the strength of that trend. In essence, the indicator measures the time between highs and the time between lows over a time period. The idea is that strong uptrends will regularly see new highs, and strong downtrends will regularly see new lows. The indicator signals when this is happening, and when it isn't.
Included:
-Long and short signal cross entries
-Continuation long and shorts entries calculated by lagged same-signal cross-ups and cross-downs
This is an exact clone of the "Aroon" for MT4 indicator
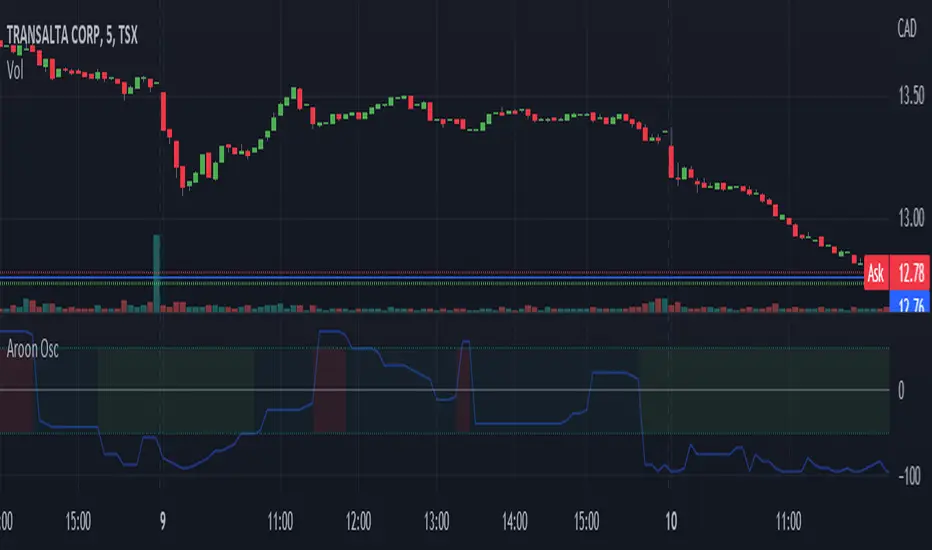
Aroon Oscillator [bkeevil]The Aroon Oscillator is intended to highlight short-term trend changes by comparing the number of periods since the last high with the number of periods since the last low.
Since the crossover rules for this oscillator frequently give false signals, I have opted for a more general approach: When the oscillator passes above the 50 line, the background of the indicator will turn green, indicating a general short term buy condition. When the oscillator passes below the -50 line, the background of the indicator will turn red, indicating a general short term sell condition. Use this indicator in combination with other indicators and price signals to identify short term trend changes.
This version improves on existing versions by:
Adding background colors to indicate general buy/sell conditions
More visually appealing
Uses the latest version 5 features
Well documented source code that conforms to the style guide
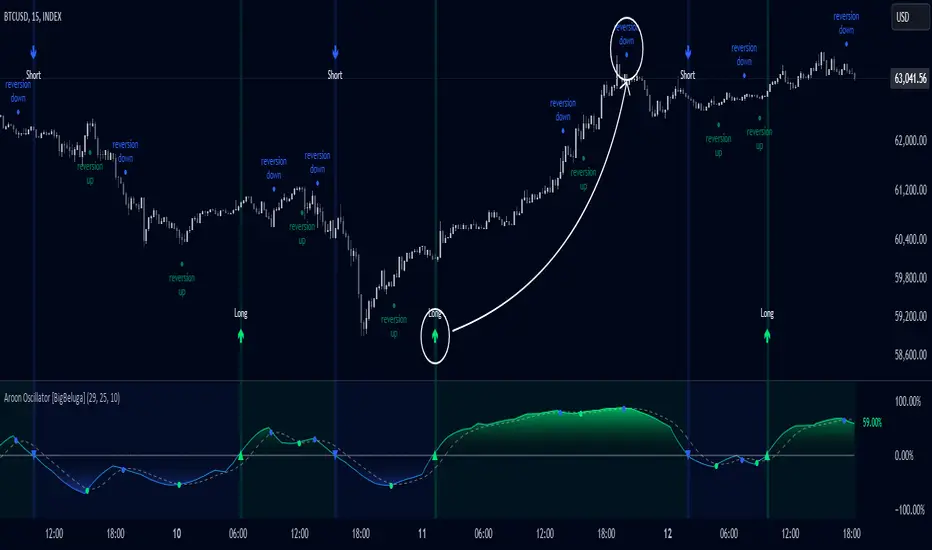
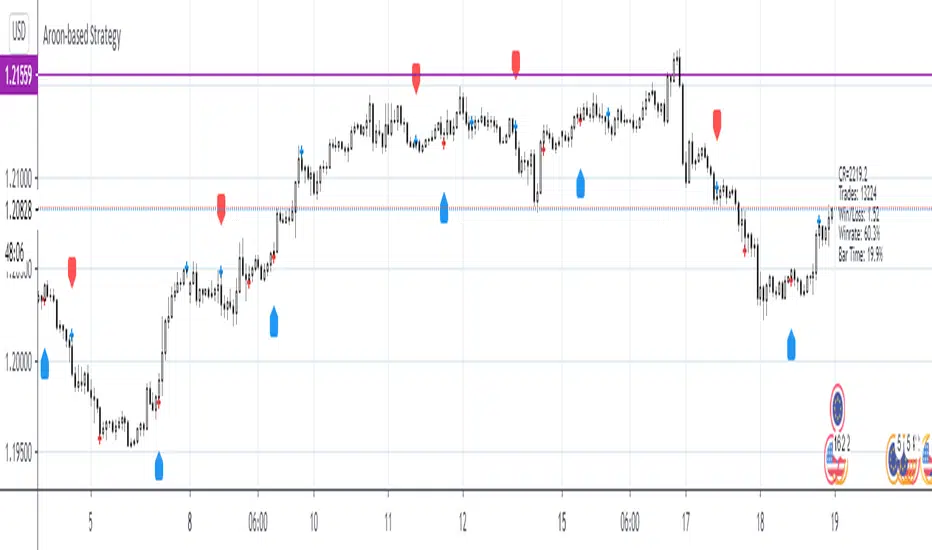
Aroon Oscillator [BigBeluga]Aroon Oscillator with Mean Reversion & Trend Signals is a versatile tool that helps traders identify both trend direction and potential mean reversion points. The core Aroon Oscillator tracks the strength of a trend by measuring how long it has been since a high or low price occurred within a specified period. This oscillator provides trend-following signals (LONG/SHORT) along with mean reversion signals, giving traders both the ability to ride trends and anticipate reversals.
The unique feature of this indicator is the Mean Reversion Signals, marked with dots on the main chart, indicating potential points where the trend might reverse or retrace. In addition, trend-following signals (LONG and SHORT) are plotted directly on the chart, providing clear entry and exit points when a trend is beginning or ending.
🔵 IDEA
The Aroon Oscillator with Mean Reversion indicator provides a combined approach of trend analysis and mean reversion. The core idea is to track the health and momentum of trends, while also identifying when those trends might reverse or slow down. This dual approach allows traders to both follow the prevailing market direction and also capture mean reversion opportunities.
The oscillator is smoothed with John Ehlers' Zero Lag function , which helps reduce noise and improves signal clarity by removing lag without sacrificing the indicator's responsiveness.
The indicator uses color-coded signals and an easy-to-read oscillator to visually represent different types of signals on the chart. This makes it easy for traders to spot important changes in market trends and take action based on both the trend-following and mean reversion aspects of the indicator.
🔵 KEY FEATURES & USAGE
Trend Following Signals (LONG/SHORT):
In addition to mean reversion signals, the indicator also provides clear trend-following signals. LONG signals (green arrows) are plotted when the oscillator crosses above zero, indicating a potential uptrend. Conversely, SHORT signals (blue arrows) are plotted when the oscillator crosses below zero, signaling a potential downtrend.
Mean Reversion Signals:
This indicator features unique mean reversion signals, represented by dots on the main chart. These signals occur when the oscillator crosses over or under a smoother signal line, indicating that the current trend might be losing strength and a reversal or retracement is possible. Green dots represent a possible upward reversion, while blue dots signal a potential downward reversion.
Color-Coded Signals and Oscillator:
The Aroon Oscillator is color-coded to make it visually easier for traders to differentiate between trends and mean reversion signals. When the oscillator is above zero, the area is filled with green, and when it is below zero, the area is filled with blue. This visual representation helps traders quickly identify the current market condition at a glance.
🔵 CUSTOMIZATION
Aroon Length & Smoothing: Control the sensitivity of the Aroon Oscillator by adjusting the lookback period and smoothing settings, allowing traders to fine-tune the indicator to match different market conditions.
Mean Reversion Signals: Enable or disable mean reversion signals based on your trading preferences. Adjust the signal line length to control when these reversal signals are triggered.
Color Customization: Customize the colors for the oscillator and signals to match your chart’s color scheme for better visual clarity.
Aroon Oscillator StrategyThis is simple strategy based on Aroon Oscillator. I have found that using length 144 or 169 on hourly chart shows excellent results.
Tested on SPY , QQQ and AAPL. Especially when you look at AAPL results , it has 60% profitable in recent trades. ( Dont assume this will be same for other stocks or ETFs)
Aroon Oscillator setting : 169 ( 169 is square root of 13 ... you can also use fib level 144 , which is square root of 12 )
BUY
When Aroon Oscillator crosses above zero line
Add
if Long position is already opened, and current close is less than BUY price and RSI 13 crossing above 30 line
Exit
when Aroon Oscialltor crosses below zero line
Stop Loss
default stop loss has been set to 5%
Note: I have not plotted RSI to the chart. Please include RSI 13 to see how position gets added ... Also add ema 169 to see how the price is aligned with the Aroon Oscillator
Warning
For the educational purposes only

Aroon Oscillator strategy by SauciusThis strategy suits better for stock, indexes and commodities sufficiently volatile but with not so strong trend, where perspective of future quotations are not so certain.
For these financial instruments this system works better than others based on classical trend oscillator (like Supertrend)
This strategy starts from the idea of the creator of Aroon lines, Tushar Chande, whose suggested to an unique Aroon Oscillator (defined as Aroon Up - Aroon Down), instead of 2 lines (for reference, original article avaible in:" Stocks & Commodities , V. 13:9 : A Time Price Oscillator by Tushar Chande, Ph .D."" - paragraph: "more patterns").
Use middle line for taking position, and the extreme ones (high and low) for exiting from long/short position. Extreme lines are not use for opening position against the trend.
Best values are for EU stocks and indexes: 19 periods, middle line = - 25 (ecxpecially for shares, give the general tendency of growing). Therefore also levels for exiting long/short position are not specular (levelhigh stops at + 75, low at -85 since stocks when go down, fall often heavily)
Please give feedback for improving this strategy! All the best,
MS .

Aroon Modified: binarized and smoothedThree views of Aroon Indicator - original, binarized and smoothed.
More 'readable' variations of this indicator will help to appreciate its role and integrate into trading strategies more readily.
Note that the smoothed Aroon can be viewed as a channel indicator when normalized to price series.

Aroon Single Line This indicator converts double lined Aroon indicator into a single line oscillator.
It is simply obtained by subtracting Aroon down from Aroon Up.
*If Oscillator points 100 value, it means there is a Strong Uptrend.
*If Oscillator points values between 100 and 40, it means there is an uptrend.
*If Oscillator points values between 20 and -20, it means no trend, it is sideways.But, when it is sideways; generally, oscillator makes FLAT LINES
between 20 and -20 values. 0 value is pointed out when the trend is downward as well, which means aroon up=aroon down.
*If Oscillator points values between -40 and -100, it means there is a downtrend.
*If Oscillator points -100 value, it means there is a Strong downtrend.
(20, 40) and (-20, -40) intervals are not mentioned, because; generally these are transition values and hard to comment, it will be more certain to
wait till values are between or at the reference values given.

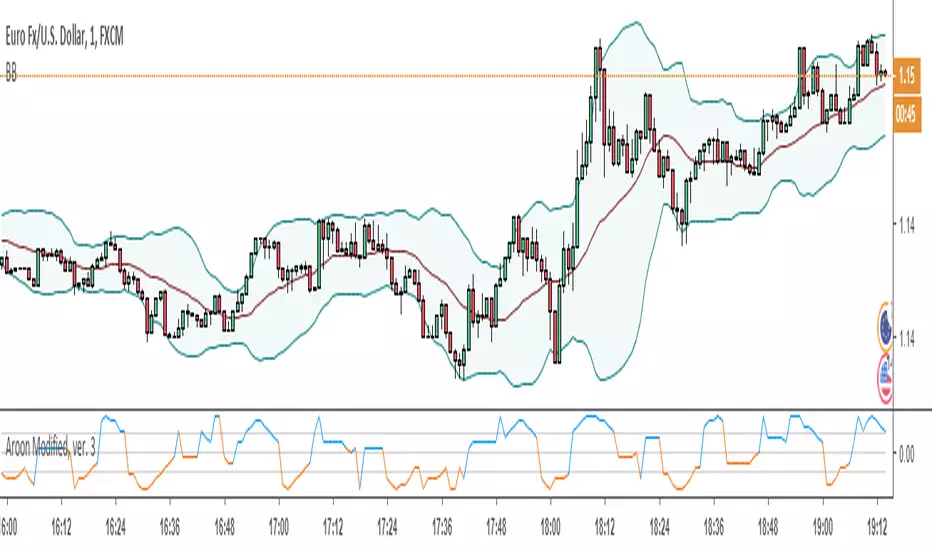
Aroon Modified, ver. 3Several views of Aroon Indicator - original, binarized, smoothed and differenced.
More 'readable' variations of this indicator will help to appreciate its role and integrate into trading strategies more readily.
***Added differenced Aroon view as well as corrected minor shortcomings***
Aroon 3 EMA cross 3 EMA Cross 5 15 and 30 combined with Aroon Indicator,
Red Arrow -> Short
Green Arrow -> Long
Blue Cross -> Close

Aroon w/ crossovers highlightedThis is the basic aroon, with a vertical green or red band to highlight bullish or bearish crossovers

Bollinger Bands And Aroon Scalping (by Coinrule)Many technical indicators can be profitable in certain market conditions while failing in others. No indicator is perfect alone.
All the best trading strategies involve multiple indicators and leverage the benefit of each of them. The following is an optimised strategy based on Bollinger Bands and the Aroon indicator.
The Bollinger Bands are among the most famous and widely used indicators. They can suggest when an asset is oversold or overbought in the short term, thus provide the best time for buying and selling it.
A strategy buying dips can work well during times of uptrend. Downtrends will result in a drawdown for the P&L of the strategy. The suggested approach minimises the drawdowns, ensuring that the system trades only when it's more likely to close the trade in profit.
The Setup
ENTRY
The price crosses below the basis line of the Bollinger Band indicator
The Aroon Indicator is above 90
EXIT
The price crosses below the upper Bollinger Band
The Aroon Indicator drops below 70
The Aroon Indicator plays a key role in this strategy. It acts as a confirmation that the asset is currently in an uptrend. On the other hand, it acts as a stop if market conditions deteriorate. The strategy uses an Aroon Indicator set to 288 periods to provide a longer-term view on market conditions, not being heavily dependent on short-term volatility.
The best time frame for this strategy based on our backtest is the 4-hr . The 1-hr can work well with three times more trades, on average. As trades increase, the profitability decreases. Yet again, this is the confirmation that trading more does not mean gaining more.
To make the results more realistic, the strategy assumes each order to trade 30% of the available capital. A trading fee of 0.1% is taken into account. The fee is aligned to the base fee applied on Binance, which is the largest cryptocurrency exchange.

MTF Aroon [Takazudo]Multi Timeframe Aroon implementation. This study highlights the background when the strong signal is detected.
This study was intented to use as a part of buy/sell strategies.

Trend-Following Combo-SuperTrend, EMA, Aroon, DMI, Laguerre RSIThis is a trend-following indicator which condenses two SuperTrend indicators -- one based on analysis over a shorter period of time (1.5, 7), and one based on analysis over a longer period of time (1.65, 100) -- into a single indicator which appears on your chart only when both the shorter- and longer-term analysis indicates a "SuperTrend" in the same direction.
Additionally, potential trade entry indicators are displayed in the form of up and down arrows when (by default) three of the following five indicators suggest that the market is trending in the same direction as both the shorter- and longer-term SuperTrend indicators:
EMA Crossover (8, 15)
Aroon Indicator (8)
Aroon Oscillator (8)
Directional Movement Index (DI +/-) (8)
Laguerre RSI (13)
You may update the parameters of any of the indicators to match your own preferences.
Additionally, you may also adjust the "Threshold" of indicators that must be in agreement with the SuperTrend to show a potential trade entry arrow. Bear in mind that if you set the Indicator Threshold too low, you will see more frequent trade entry arrows, many of which will not be profitable if taken. Similarly, set this value too high, and you will see fewer trade entry arrows that may not appear until after most of the "juice" in the trend has evaporated. Ideal values for the threshold seem to be between 2-4, depending on the symbol you are trading.
The following image shows all of the indicators referenced above on a 5-minute chart of the SPY during a single trading day:
And, here is the same period of time showing only the Trend-Following Combo indicator with default settings:
This indicator would not have been possible save for work contributed by the following:
SuperTrend by Rajandran R
Aroon w/ crossovers highlighted by seiglerj
Aroon Oscillator by jcrewolinsky
Directional Movement Index by TradingView
Laguerre RSI (Self Adjusting Alpha with Fractals Energy) by everget

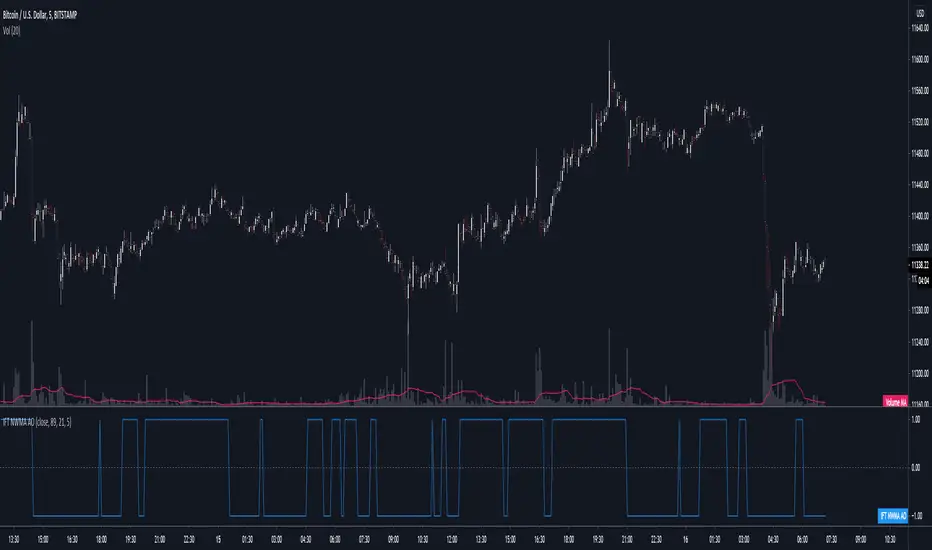
Inverse Fisher Transform of NWMA Aroon Oscillator As originally described by Manfred G. Dürschner. Applies an inverse fisher transform to an aroon oscillator calculated using smoothed price. Smoothing is done via NWMA or "Moving Average 3.0".
Signals are Buy > 0 and Sell < 0
length 1 must be at least twice length 2 (lambda >= 2.0)
Keltner-Aroon-EFI FlowKeltner-Aroon-EFI Flow - |K| |A| |E| |F|
KAE Flow is a quantitative trend-aggregation engine designed to determine the dominant market bias by fusing three distinct market dimensions: Volatility, Trend Strength, and Volume.
This script does not rely on a single metric. Instead, it creates a composite "Flow" score derived from the Daily timeframe to act as a high-level bias filter for intraday or swing trading.
1. The Quantitative Logic (The Engine)
The core of this indicator is the KAE Engine, which polls data from the Daily timeframe (by default) to ensure you are always trading in alignment with the macro trend. It aggregates three logical components:
K (Keltner Channels): Measures Volatility Breakouts.
Logic: Returns bullish if price closes above the Upper Channel, bearish if below the Lower Channel. This captures the expansion phase of price action.
A (Aroon): Measures Trend Age & Strength.
Logic: Returns bullish only if the Aroon Up is > 70 and dominating the Aroon Down. This ensures the trend is not just present, but mathematically strong.
E (Elder’s Force Index): Measures Volume-Weighted Momentum.
Logic: Uses volume pressure to confirm price moves. Positive smoothed force indicates bullish accumulation.
2. Signal Processing (ALMA)
Raw data is noisy. The KAE Flow takes the aggregated raw score from the components above and runs it through an ALMA (Arnaud Legoux Moving Average).
Why ALMA? It offers the best balance between smoothness and responsiveness, removing "false flips" in the trend bias while reacting quickly to genuine reversals.
The Color (The Bias):
Deep Blue: Strong Bullish Flow (KAE Score > 0.1). Look for Long entries .
White: Strong Bearish Flow (KAE Score < -0.1). Look for Short entries.
Gray: Neutral/Transition. Volatility is contracting or the trend is conflicting.
5. Settings & Configuration
Keltner/Aroon/EFI Lengths: Fully customizable to fit different asset classes (Crypto vs. Forex).
Active Smoothing: Toggle ALMA on/off.
Active Components: You can toggle specific engines (K, A, or E) on or off. Default uses Keltner + Aroon for a pure Price/Time analysis.
Risk Warning: This indicator pulls higher-timeframe data (Daily) to color lower-timeframes. While this provides a powerful macro view, be aware that closed candle data is used to prevent repainting issues in real-time.
D_Quant --- Trade With Discipline

[blackcat] L2 Ehlers SwamiCharts AroonLevel: 2
Background
John F. Ehlers introuced SwamiCharts Aroon Indicator in Mar, 2012.
Function
The Aroon indicator is a technical indicator that is used to identify trend changes in the price of an asset, as well as the strength of that trend. In essence, the indicator measures the time between highs and the time between lows over a time period.
In “Introducing SwamiCharts” in Mar, 2012, authors John Ehlers & Ric Way presented the use of SwamiCharts to better visualize market activity using an indicator that presents a heatmap visualization. The authors provided descriptions for the construction of SwamiCharts using Aroon indicator.
Key Signal
Aroon ---> Aroon array
Plot4~33 ---> SwamiCharts Aroon
short ---> Short entry signal
Pros and Cons
100% John F. Ehlers definition translation, even variable names are the same. This help readers who would like to use pine to read his book.
Remarks
The 77th script for Blackcat1402 John F. Ehlers Week publication.
Readme
In real life, I am a prolific inventor. I have successfully applied for more than 60 international and regional patents in the past 12 years. But in the past two years or so, I have tried to transfer my creativity to the development of trading strategies. Tradingview is the ideal platform for me. I am selecting and contributing some of the hundreds of scripts to publish in Tradingview community. Welcome everyone to interact with me to discuss these interesting pine scripts.
The scripts posted are categorized into 5 levels according to my efforts or manhours put into these works.
Level 1 : interesting script snippets or distinctive improvement from classic indicators or strategy. Level 1 scripts can usually appear in more complex indicators as a function module or element.
Level 2 : composite indicator/strategy. By selecting or combining several independent or dependent functions or sub indicators in proper way, the composite script exhibits a resonance phenomenon which can filter out noise or fake trading signal to enhance trading confidence level.
Level 3 : comprehensive indicator/strategy. They are simple trading systems based on my strategies. They are commonly containing several or all of entry signal, close signal, stop loss, take profit, re-entry, risk management, and position sizing techniques. Even some interesting fundamental and mass psychological aspects are incorporated.
Level 4 : script snippets or functions that do not disclose source code. Interesting element that can reveal market laws and work as raw material for indicators and strategies. If you find Level 1~2 scripts are helpful, Level 4 is a private version that took me far more efforts to develop.
Level 5 : indicator/strategy that do not disclose source code. private version of Level 3 script with my accumulated script processing skills or a large number of custom functions. I had a private function library built in past two years. Level 5 scripts use many of them to achieve private trading strategy.

FFT Strategy Bi-Directional Stop/Profit/Trailing + VMA + AroonThis strategy uses the Fast Fourier Transform inspired from the source code of @tbiktag for the Fast Fourier Transform & @lazybear for the VMA filter.
If you are not familiar with the Fast Fourier transform it is a variation of the Discrete Fourier Transform. Veritasium on youtube has a great video on it with a follow up recommendation from 3brown1blue. In short it will extract all the frequencies from a set of data. @tbiktag laid the groundwork for creating the indicator which will allow you to isolate only those signals which are the most relevant and remove the noise. I recommend having @tbiktag's FFT Transform indicator side by side with this to understand what my variation is doing by setting similar settings .
Using this idea, you can then optimize a strategy to the frequencies that are best. The main entry signal is when the FFT Signal crosses above or below the 0 line .
Included with this strategy is the ability to optionally bi-directionally set:
Stop Loss
Trailing Stop Loss
Take Profit
Trailing Take Profit
Entries are optionally further filtered by use of the VMA using the algorithm from LazyBear which allows you to adjust a variable moving average with 3 market trend detections. Green represents upwards momentum; Blue sideways trading and Red downwards momentum. The idea being to filter out buy or sell entries unless the market is moving in that direction, and this makes a big difference as you can see for yourself when you turn it off or on. Turning it off will change the color of the FFT signal to orange instead of the green, blue, red colors .
I have added 2 custom stop loss types as well for experimentation:
1. VMA Filter stop loss to exit the trade if the VMA detects a market trend direction change matching the rules you have set. I have set this to off by default, but it is there so you can see what affect it may have on other tickers. It can increase the profit factor but usually at a cost of net profit.
2. The Aroon Filter stop loss with different lengths for the short or long direction. For the Aroon strategy (which is a trend change detector) it is considered bullish if the upper line (green in my code) is above 70 and the lower line (red in my code) is below 30 and the opposite for the bearish case. With this in mind, I have set it to filter by default only the extreme ends (99 and 1) to increase profit factor and net profit but I encourage you to try different settings and see how it affects things. Turning this off yields much higher net profit but at the cost of the profit factor and drawdown . To disable this just uncheck the 'Use Aroon Filter Long' (or short) and it will also hide the aroon graphics and crosses on the plot.
I will be adding more features in an attempt to lower the drawdown on this strategy but I hope you enjoy what I have so far!

Cronos Trend Aroon by Zekis"The Aroon indicator is a technical indicator that is used to identify when trends are likely to change direction. In essence, the indicator measures the time it takes for the price to reach the highest and lowest points over a given timeframe as a percentage of total time. The indicator consists of the "Aroon up" line, which measures the strength of the uptrend, and the "Aroon down" line, which measures the strength of the downtrend."
Classic Aroon indicator with few changes:
1. Colors for trends: red line and red background = downtrend
green line and green background = uptrend
2. Crossover is signaled with an yellow stripe
3. Alerts are enabled for longs/entries and shorts/exits
Enjoy!
@ Zekis
