Algorithm Builder - Single Trend+ (Plug&Play)Hello traders
I. SCRIPTS ACCESS AND TRIALS
1. For the trial request access, they have to be done through my website .
2. My website URL is in this script signature at the very bottom (you'll have to scroll down a bit and going past the long description) and in my profile status available here : Daveatt
Due to the new scripts publishing house rules, I won't mention the URL here directly. As I value my partnership with TradingView very much, I prefer showing you the way for finding them :)
3. You may also contact me directly for more information
II. Algorithm Builder - Single Trend+ Plug&Play
2.1 Concept
That script is an upgrade of the Single Trend:
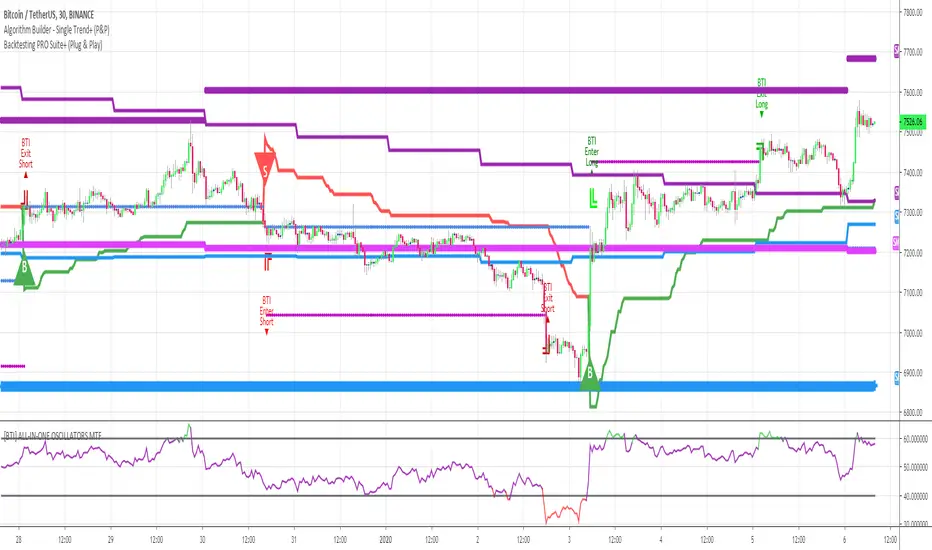
The Algorithm Builder - Single Trend+ (Plug & Play) is made to detect the convergence of many unrelated indicators, and give a BUY or SELL signal whenever all the selected sub-indicators are converging in the same direction.
The Single Trend+ (Plug & Play) gives one single entry per identified trend - unlike the Multiple Trends editions (also available on my scripts page) which may give more than 1 entry per trend.
The traders select the sub-indicators they want, and see in real-time the BUY and SELL triangles being updated.
III. Plug & Play
Hope you're ready to be impressed. Because, what I'm about to introduce, is my best-seller feature - and available across many of my indicators.
In TradingView, there is a feature called "Indicator on Indicator" meaning you can use an external indicator as a data source for another indicator.
I'm using that feature to connect any external indicator to our Algorithm Builder Single Trend+ Plug & Play (hence the plug and play name).
Let's assume you have your RSI divergence indicator - which is not part of the Algorithm Builder - but noticed that the convergence of an RSI divergence and a MACD gives strong signals.
I mentioned an RSI divergence, but you may connect any oscillator (MACD, On balance volume, stochastic RSI, True Strenght index, and many more..) or non-oscillator (divergence, trendline break, higher highs/lower lows, candlesticks pattern, price action, harmonic patterns, ...) indicators.
Any indicator that displays visual signals are eligible for this feature .... in other words.... all possible indicators. You're welcome :)
THE SKY IS (or more likely your imagination) is the limit :)
Fear no more. The Plug&Play technology allows you to connect it and use it in the convergence/confluence calculations.
Hence, whenever the MACD and RSI divergence will be in the same direction for the first time, you'll get a signal. For the first time only because this is a Single trend edition - you may enter multiple times using our Algorithm Builders - Multiple Trends editions.
To connect your external indicator to ours, we're using a native TradingView feature, which is not available for all users.
It depends on your TradingView subscription plan ( More info here )
If you intend to use our Algorithm Plug&Play indicator, and/or our Backtest Plug&Play suites, then you must upgrade your TradingView account to enjoy those features.
We value our relationship with our customers seriously, and that's why we're warning you that a compatible TradingView account type is required - at least PRO+ or PREMIUM to add more than 1 Plug&Play indicator per account.
We go in-depth on our website why the Plug&Play is an untapped opportunity for many traders out there - URL available on my profile status and signature
IV. Why the Algorithm Builder Single Trend+ (Plug&Play) may help you
I worked with many traders during my career, and their feedback about trading is often pretty similar.
They all tried a lot of complicated indicators, losing their capital, and finally getting back to the basics (even to the basic indicators if I might say)
The art is finding a good combination of indicators and setting strict money/risk management rules.
Easy in concept, but more than 90+% of traders lose money on the markets... which teach us that trading is not only about drawing trendlines, or using cool indicators but finding ways to ease our psychology while trading.
4.1 The Algorithm Builder trading framework
The sub-indicators (full list on our website) weren't chosen randomly. They're based on a trading method we've developed over the last 6 years - while working with traders and other trading quants.
The Algo Builders are made to detect a convergence - and as such, will give a signal once a trend has been identified.
They're not made to detect reversal but have been designed to give a signal when all sub-indicators are either ALL bullish (green) or ALL bearish (red).
We provide a framework based on indicators we selected because they:
1. make sense to be used altogether
2. work on asset classes like INDEX, CRYPTO, STOCK OPTIONS, FOREX, COMMODITIES
3. it may expand your knowledge about what detecting a convergence with pre-selected indicator really means
4.2 Supports and Resistances
The indicator displays the main algorithmic supports and resistances according to our trading method.
I think they're relevant for all asset classes, but you're absolutely free to use any different supports/resistances logic if you want to.
I'm not against it because I know that pivots, Fibonacci levels, etc. may work very well also.
4.3 Choose your favorite risk management algorithm
1/ Pre-defined Algo S/R method using:
- a supertrend of the stop-loss
- the nearest algorithmic resistances for the take profit levels.
2/ Define your own Stop-loss and Take-profits level in real-time
Stop-Loss Management
For what's following, let's assume that 2 is the stop-loss value you inserted in the indicator, and the Algorithm Builder gives a BUY signal.
This is NOT a recommendation at all, only an example to explain how this feature works.
- %Trailing: The Stop-Loss starts 2% away from the entry price - and will move up (because we're on a BUY trade as per our example) every time your trade will gain 2% profit
- Percentage: The Stop-Loss stays static 2% away from the entry price. There is no trailing here
- TP Trailing: This is a very awesome feature. The stop-loss is set 2% away when the trades start.
When the TP1 is hit, the stop-loss will be moved to the Entry price (also called breakeven).
When the TP2 is hit, the SL is moved to the previous TP1 position
- Fixed: Set the Stop-Loss at a fixed position (value should be in currency/units)
Take Profits Management
You can manage up to 2 take profit levels defined as a percentage or price value.
The expected input is in percentage value (for instance, setting the % target of TP1 to 2% will set the TP1 level 2% away from the entry price
4.4 Built-in Trade Manager
This is very likely the most loved utility script that we shared on TradingView.
It's included in your Algorithm Builder - Single Trend+, and will certainly help you immensely to analyze your charts and your trades.
We made sure that all the graphical elements on the chart will be updated in real-time whenever our user change anything on the indicator configuration.
You'll also be able to change the Trade Manager labels positions as you wish :)
4.5 Built-in Risk-to-Reward Panel
The good stuff doesn't stop here.
You'll notice that this sometimes green (when in a LONG), sometimes red (when in a SHORT) panel at the right of your chart.
It displays for the selected trading algorithmic (see 2.3.2 above), a ton of useful real-time analytics.
- Entry Price: the price when the Algorithm Builder will give a signal.
- The Trade PnL in percentage.
- Entry Stop Loss: Distance (in currency/units) between the selected stop-loss algorithm (percent, trailing, TP trailing, etc.) and the entry price.
- Entry TP1: Distance (in currency/units) between the entry price and the first take profit
- Entry TP2: Distance (in currency/units) between the entry price and the second take profit
- Risk/Reward TP1: Using the Stop-loss distance at entry, and Take Profit 1 at entry to compute the risk-to-reward ratio.
- Risk/Reward TP2: Using the Stop-loss distance at entry, and Take Profit 2 at entry to compute the risk-to-reward ratio.
For more details, please check the guides section of my website. Links are in my signature and profile status.
4.6Hard Exits
Our trading method is known for the hard exits, also called invalidation.
The Single Trend+ includes a hard exit based on a MACD - settings are flexible and you may update them.
Having a stop-loss protecting your trade is a best practice - Protecting your stop-loss also from getting hit is incredible.
We prefer invalidate a few positions, even if sometimes we don't want to. Rather than the market hard exiting on us, and leaving with our hard-working money.
4.7 Alerts
Alerts are enabled for:
- BUY/SELL triangles signals
- Trade Manager (SL, TP1, TP2)
- Hard Exits
V. Pain points that we're trying to solve with our Algorithm Builders
Issue #1 There are many informations / indicators / strategies / backtests / noise. Finding the right ones is not a simple task.
Solution #1 A reliable system that removes the external noise is much needed in trading to stay "in the game".
Issue #2 Trading could be quite stressful - The majority doesn't lose in trading because technical analysis is hard, but because managing our psychology is one of the hardest things a human can do.
Solution #2 Some ways to reduce the "trading stress" could be: getting better quality signals and trading like a "machine". Forgetting about Twitter and trusting the system you designed.
Issue #3 Trading without strict rules and only based on what we feel, or what we think the market should do is the fastest way to kiss our money goodbye.
Only 1 indicator generally is not enough. Traders generally use a combination of several indicators but they're monitoring them individually.
It's normal then to feel exhausted at the end of the day ^^ (to say the least)... and exhaustion leads to mistakes which leads to..... (I'm sure you got it) ... capital loss.
Solution #3 As a trader, I needed a trading framework and a method. I offer our trading method but they're plenty others out there. We cannot claim obviously it's the best ever ....but let's say we're using those exact same
scripts ourselves for our trading. And this what we've been recommending our clients to trade with for the past years. Also, having a tool detecting the convergence of several indicators and giving 1 unique signal
for BUY/SELL position will save you a lot of time/energy, and perhaps might help you out getting better trading performance.
VI. Resolving a complex puzzle and having fun in the process
Trading has to stay a passion and not (only be) a source of intense stress.
The most successful traders I know are "trading geeks" - literally always looking for optimizing, searching for the best possible entries, setups, indicators, tools, etc.
For them, it's not even about the money anymore, but only about beating their previous performance.
Why are they doing this? Because it's fun
Might appears as a bold statement, but I guarantee that looking for setups is fun.
One of our users even told us, that it's like playing with "Legos" and we couldn't possibly agree more.
VII. Designing a system that "makes sense"
Another bold statement now. Brace yourselves ladies and gentlemen
The Algorithm Builders allow to design trading systems quickly. What could takes days/weeks/months to find out... might be now within your reach in less than a few hours.
With a bit of practice, less than an hour might be enough per asset/timeframe to find a system that makes sense to you and adapted to your trading capital and psychology.
Assuming our users read our guides and are fully committed to learning a new way of trading - then we do guarantee you'll be able to design kick-ass trading systems that make sense.
"Making sense" doesn't mean at all it's guaranteed to win, it means you're the one defining the convergence of indicators, using your Algorithm Builder, and observe that most of the time - whenever there is a BUY signal, the candlesticks are going upwards - whenever there is a SELL signal, it's going downwards.
This is a necessary step to make real progress from a trading analyst perspective - and hopefully could lead to profits.
VII. Algorithm Builder versus the main trader enemy(=psychology)
This indicator has the goal to help solving one of the MAIN issues encountered by traders.
Most of traders realize, they can't perform with only 1 indicator (or 1 price pattern or 1 price action) and need a combination of multiple indicators before getting in a trade.
Far from being a magic pill, if it could at least reduce the stress you have while trading, then we'll consider we made a great job - it's a technical "useless noise remover", and needs to be followed strictly.
Such trust in a trading system can only be built by testing your Algorithm Builder configuration on either:
1. a demo account
2. or a live account with small bids. And then, increasing progressively the bids if your capital increases progressively.
Though, you should still use your common sense. (for instance: if we get a BUY signal right on a big timeframe resistance we're hitting for the first time).
I'm aware this is a new way of trading but for many, and while we cannot foresee the future, neither predict performance, we believe it might save you a lot of time to find good signals.
My maximum level of happiness will be reached the day when our users will contact me and showing me setups being mine.
I'm sure that even I can learn from my users and, we can all learn from each other Algorithm Builder configuration
VIII. What is a wrong or bad configuration?
Simply put. If you see that most of your signals react such as described below:
1. a buy triangle predicts, most of the time an upwards move
2. a sell triangle predicts, most of the time a downwards move
3. you estimated yourself the stop-loss needed to give enough room for your trades.
4. take profits based on algorithmic support and resistances or your own take profit method.
So what's a good Algorithm Builder configuration? A configuration you're happy with and makes sense.
A better Algorithm Builder setup is one used in demo or a live account w/ small bids for a few weeks, and you're consistent in your trading performance.
If you have any doubt or question, please hit me up directly or ask in the comments section of this script.
I'll never claim I have the best trading methodology or the best indicators. You only will be the judge, and I'll appreciate all the questions and feedback you're sending my way.
They help me a ton to develop indicators based on all the requests I received.
Kind regards,
Dave
"algo" için komut dosyalarını ara
Algo Bands [ProjeAdam]OVERVIEW:
The Algo Bands indicator is a technical analysis tool that calculates the highest, lowest, and average price levels over a user-defined number of bars. It generates buy and sell signals based on price interactions with these levels, visualizing them as bands on the chart. Additionally, the indicator provides multi-timeframe analysis and integrates alerts for timely trading decisions.
ALGORITHM:
1. Initialization and Function Definition
The Algo Bands indicator starts by defining functions to calculate critical price levels:
- High Band : A smoothed average of recent high price levels.
- Low Band : A smoothed average of recent low price levels.
- Average Band : The midpoint between the High Band and Low Band.
The smoothing process utilizes a Smoothed Moving Average (SMMA) to reduce noise and ensure accurate signal generation.
2. Inputs and Band Calculation
The indicator accepts customizable inputs for flexibility in trading strategies:
- Backward Length : The number of bars to consider for calculating high and low values.
- Number of Lines : Specifies how many recent high or low values are averaged.
- Smoothing Period : The length of the SMMA to smooth price data.
Using these inputs:
- The High Band is calculated as the smoothed average of the highest price values.
- The Low Band is calculated as the smoothed average of the lowest price values.
- The Average Band is the midpoint of the High and Low Bands.
3. Plotting the Bands
The Algo Bands indicator plots three main lines on the price chart:
- High Band : Plotted as a red step line, representing resistance levels.
- Low Band : Plotted as a green step line, indicating support levels.
- Average Band : Plotted as an orange line, showing the midpoint or equilibrium price.
4. Buy and Sell Conditions
Sell Condition:
The indicator triggers a sell signal when either of the following conditions is met:
A. Crossunder Condition :
- The closing price crosses below the High Band.
- The candle closes below its open price, confirming bearish sentiment.
- The closing price remains below both the High Band and the previous bar's open price.
B. Rejection Condition :
- The high price exceeds the High Band during the bar.
- However, the closing price fails to hold above the High Band and closes lower than both the High Band and the open price.
Buy Condition:
The indicator triggers a buy signal when either of the following conditions is met:
A. Crossover Condition :
- The closing price crosses above the Low Band.
- The candle closes above its open price, indicating bullish momentum.
- The closing price remains above both the Low Band and the previous bar's open price.
B. Rejection Condition :
- The low price dips below the Low Band during the bar.
- However, the closing price recovers and closes higher than both the Low Band and the open price.
5. Signal Visualization
The indicator visually represents buy and sell signals as follows:
- Sell Signals : Displayed as a red downward label (🔴) above the bar.
- Buy Signals : Displayed as a green upward label (🟢) below the bar.
The background colors between the bands also reflect market direction:
- Red for bearish trends.
- Green for bullish trends.
6. Alerts
The Algo Bands indicator includes customizable alerts to notify traders of trading signals:
- Alerts are triggered when Buy or Sell conditions are met.
- Integration with Telegram allows real-time notifications for immediate action.
7. Multi-Timeframe Analysis
The indicator supports analysis across multiple timeframes, including:
- 1 Hour
- 4 Hours
- Daily
It calculates the High and Low Bands for these timeframes to provide a comprehensive view of the market trend.
HOW DOES THE INDICATOR WORK?
1. Price Band Calculation :
- The highest and lowest price values are dynamically identified for a user-defined range.
- These values are smoothed using SMMA to produce the High Band and Low Band.
2. Signal Generation :
- Sell signals occur when the price crosses below or rejects the High Band.
- Buy signals occur when the price crosses above or rejects the Low Band.
3. Visualization :
- The bands are plotted on the chart to display resistance, support, and price equilibrium.
- Buy and Sell signals are marked with labels and color-coded backgrounds.
4. Alerts :
- Custom alerts notify traders in real time when signals are triggered.
BENEFITS OF THE ALGO BANDS INDICATOR:
- Trend Identification : Identifies support, resistance, and price equilibrium levels.
- Clear Buy/Sell Signals : Helps traders make timely entry and exit decisions.
- Noise Reduction : SMMA smoothing minimizes false signals.
- Multi-Timeframe Analysis : Provides insights across 1-hour, 4-hour, and daily timeframes.
- Customizable Parameters : Users can adjust settings for their trading style.
- Real-Time Alerts : Immediate notifications ensure timely actions.
- Visual Clarity : Labels and background colors enhance signal visibility.
- Ease of Use : Suitable for traders of all levels, from beginners to experts.
If you have any ideas what to add to my work to add more sources or make calculations cooler, suggest in DM .

Algorithmic Kalman Filter [CRYPTIK1]Price action is chaos. Markets are driven by high-frequency algorithms, emotional reactions, and raw speculation, creating a constant stream of noise that obscures the true underlying trend. A simple moving average is too slow, too primitive to navigate this environment effectively. It lags, it gets chopped up, and it fails when you need it most.
This script implements an Algorithmic Kalman Filter (AKF), a sophisticated signal processing algorithm adapted from aerospace and robotic guidance systems. Its purpose is singular: to strip away market noise and provide a hyper-adaptive, self-correcting estimate of an asset's true trajectory.
The Concept: An Adaptive Intelligence
Unlike a moving average that mindlessly averages past data, the Kalman Filter operates on a two-step principle: Predict and Update.
Predict: On each new bar, the filter makes a prediction of the true price based on its previous state.
Update: It then measures the error between its prediction and the actual closing price. It uses this error to intelligently correct its estimate, learning from its mistakes in real-time.
The result is a flawlessly smooth line that adapts to volatility. It remains stable during chop and reacts swiftly to new trends, giving you a crystal-clear view of the market's real intention.
How to Wield the Filter: The Core Settings
The power of the AKF lies in its two tuning parameters, which allow you to calibrate the filter's "brain" to any asset or timeframe.
Process Noise (Q) - Responsiveness: This controls how much you expect the true trend to change.
A higher Q value makes the filter more sensitive and responsive to recent price action. Use this for highly volatile assets or lower timeframes.
A lower Q value makes the filter smoother and more stable, trusting that the underlying trend is slow-moving. Use this for higher timeframes or ranging markets.
Measurement Noise (R) - Smoothness: This controls how much you trust the incoming price data.
A higher R value tells the filter that the price is extremely noisy and to be more skeptical. This results in a much smoother, slower-moving line.
A lower R value tells the filter to trust the price data more, resulting in a line that tracks price more closely.
The interaction between Q and R is what gives the filter its power. The default settings provide a solid baseline, but a true operator will fine-tune these to perfectly match the rhythm of their chosen market.
Tactical Application
The AKF is not just a line; it's a complete framework for viewing the market.
Trend Identification: The primary signal. The filter's color code provides an unambiguous definition of the trend. Teal for an uptrend, Pink for a downtrend. No more guesswork.
Dynamic Support & Resistance: The filter itself acts as a dynamic level. Watch for price to pull back and find support on a rising (Teal) filter in an uptrend, or to be rejected by a falling (Pink) filter in a downtrend.
A Higher-Order Filter: Use the AKF's trend state to filter signals from your primary strategy. For example, only take long signals when the AKF is Teal. This single rule can dramatically reduce noise and eliminate low-probability trades.
This is a professional-grade tool for traders who are serious about gaining a statistical edge. Ditch the lagging averages. Extract the signal from the noise.

Algo Trading Signals - Buy/Sell System# 📊 Algo Trading Signals - Dynamic Buy/Sell System
## 🎯 Overview
**Algo Trading Signals** is a sophisticated intraday trading indicator designed for algorithmic traders and active day traders. This system generates precise buy and sell signals based on a dynamic box breakout strategy with intelligent position management, add-on entries, and automatic target adjustment.
The indicator creates a reference price box during a specified time window (default: 9:15 AM - 9:45 AM IST) and generates high-probability signals when price breaks out of this range with confirmation.
---
## ✨ Key Features
### 📍 **Smart Signal Generation**
- **Primary Entry Signals**: Clear buy/sell signals on confirmed breakouts above/below the reference box
- **Confirmation Bars**: Reduces false signals by requiring multiple bar confirmation before entry
- **Cooldown System**: Prevents overtrading with configurable cooldown periods between trades
- **Add-On Positions**: Automatically identifies optimal pullback entries for scaling into positions
### 📦 **Dynamic Reference Box**
- Creates a high/low range during your chosen time window
- Automatically updates after each successful trade
- Visual box display with color-coded boundaries (red=resistance, green=support)
- Mid-level reference line for market structure analysis
### 🎯 **Intelligent Position Management**
- **Automatic Target Calculation**: Sets profit targets based on average move distance
- **Add-On System**: Up to 3 additional entries on optimal pullbacks
- **Position Tracking**: Monitors active trades and remaining add-on capacity
- **Auto Box Shift**: Adjusts reference box after target hits for continued trading
### 📊 **Visual Clarity**
- **Color-Coded Labels**:
- 🟢 Green for BUY signals
- 🔴 Red for SELL signals
- 🔵 Blue for ADD-ON buys
- 🟠 Orange for ADD-ON sells
- ✓ Yellow for Target hits
- **TP Level Lines**: Dotted lines showing current profit targets
- **Hover Tooltips**: Detailed information on entry prices, targets, and add-on numbers
### 📈 **Real-Time Statistics**
Live performance dashboard showing:
- Total buy and sell signals generated
- Number of add-on positions taken
- Take profit hits achieved
- Current trade status (LONG/SHORT/None)
- Cooldown timer status
### 🔔 **Comprehensive Alerts**
Built-in alert conditions for:
- Primary buy entry signals
- Primary sell entry signals
- Add-on buy positions
- Add-on sell positions
- Buy take profit hits
- Sell take profit hits
---
## 🛠️ Configuration Options
### **Time Settings**
- **Box Start Hour/Minute**: Define when to begin tracking the reference range
- **Box End Hour/Minute**: Define when to lock the reference box
- **Default**: 9:15 AM - 9:45 AM (IST) - Perfect for Indian market opening range
### **Trade Settings**
- **Target Points (TP)**: Average move distance for profit targets (default: 40 points)
- **Breakout Confirmation Bars**: Number of bars to confirm breakout (default: 2)
- **Cooldown After Trade**: Bars to wait after closing position (default: 3)
- **Add-On Distance Points**: Minimum pullback for add-on entry (default: 40 points)
- **Max Add-On Positions**: Maximum additional positions allowed (default: 3)
### **Display Options**
- Toggle buy/sell signal labels
- Show/hide trading box visualization
- Show/hide TP level lines
- Show/hide statistics table
---
## 💡 How It Works
### **Phase 1: Box Formation (9:15 AM - 9:45 AM)**
The indicator tracks the high and low prices during your specified time window to create a reference box representing the opening range.
### **Phase 2: Breakout Detection**
After the box is locked, the system monitors for:
- **Bullish Breakout**: Price closes above box high for confirmation bars
- **Bearish Breakout**: Price closes below box low for confirmation bars
### **Phase 3: Signal Generation**
When confirmation requirements are met:
- Entry signal is generated with clear visual label
- Target price is calculated (Entry ± Target Points)
- Position tracking activates
- Cooldown timer starts
### **Phase 4: Position Management**
During active trade:
- **Add-On Logic**: If price pulls back by specified distance but stays within favorable range, additional entry signal fires
- **Target Monitoring**: Continuously checks if price reaches TP level
- **Box Adjustment**: After TP hit, box automatically shifts to new range for next opportunity
### **Phase 5: Trade Exit & Reset**
On target hit:
- Position closes with TP marker
- Statistics update
- Box repositions for next setup
- Cooldown activates
- System ready for next signal
---
## 📌 Best Use Cases
### **Ideal For:**
- ✅ Intraday breakout trading strategies
- ✅ Algorithmic trading systems (via alerts/webhooks)
- ✅ Opening range breakout (ORB) strategies
- ✅ Index futures (Nifty, Bank Nifty, Sensex)
- ✅ High-liquidity stocks with clear ranges
- ✅ Automated trading bots
- ✅ Scalping and day trading
### **Markets:**
- Indian Stock Market (NSE/BSE)
- Futures & Options
- Forex pairs
- Cryptocurrency (adjust timing for 24/7 markets)
- Global indices
---
## ⚙️ Integration with Algo Trading
This indicator is **algo-ready** and can be integrated with automated trading systems:
1. **TradingView Alerts**: Set up alert conditions for each signal type
2. **Webhook Integration**: Connect alerts to trading platforms via webhooks
3. **API Automation**: Use with brokers supporting TradingView integration (Zerodha, Upstox, Interactive Brokers, etc.)
4. **Signal Data Access**: All signals are plotted for external data retrieval
---
## 📖 Quick Start Guide
1. **Add Indicator**: Apply to your chart (works best on 1-5 minute timeframes)
2. **Configure Time Window**: Set your desired box formation period
3. **Adjust Parameters**: Tune confirmation bars, targets, and add-on settings to your trading style
4. **Set Alerts**: Create alert conditions for automated notifications
5. **Backtest**: Review historical signals to validate strategy performance
6. **Go Live**: Enable alerts and start receiving real-time trading signals
---
## ⚠️ Risk Disclaimer
This indicator is a **tool for analysis** and does not guarantee profits. Trading involves substantial risk of loss. Always:
- Use proper position sizing
- Implement stop losses (not included in this indicator)
- Test thoroughly before live trading
- Understand market conditions
- Never risk more than you can afford to lose
- Consider your risk tolerance and trading experience
**Past performance does not indicate future results.**
## 🔄 Version History
**v1.0** - Initial Release
- Dynamic box formation system
- Confirmed breakout signals
- Add-on position management
- Visual signal labels and statistics
- Comprehensive alert system
- Auto-adjusting target boxes
---
## 📞 Support & Feedback
If you find this indicator helpful:
- ⭐ Please leave a like/favorite
- 💬 Share your feedback in comments
- 📊 Share your results and improvements
- 🤝 Suggest features for future updates
---
## 🏷️ Tags
`breakout` `daytrading` `signals` `algo` `automated` `intraday` `ORB` `opening-range` `buy-sell` `scalping` `futures` `nifty` `banknifty` `algorithmic` `box-strategy`
*Remember: The best indicator is combined with proper risk management and trading discipline.* Use it at your own rist, not as financial advie

Algorithm Builder UNIVERSAL (m30)Hello traders 👋
I. 💎 SCRIPTS ACCESS AND TRIALS 💎
1. Every 3 weeks trial request access has to be done through my website .
2. My website URL is in this script signature at the very bottom (you'll have to scroll down a bit and going past the long description) and in my profile status available here : Daveatt
3. Many video tutorials explaining clearly how all our indicators work are available on your website > guides section.
4. You may also contact me directly for more information regarding the trading method included in the indicator or how to access it
2.1 Forewords
This indicator/trading framework is available only to our PREMIUM users.
We decided to call it "UNIVERSAL" because the tool gives very decent signals for STOCKS/PENNY STOCKS/FOREX/CRYPTO (USD & BTC pairing)/INDICES/COMMODITIES trading
(the asset classes that I'm not listing are not tested yet; though we should cover a wide range of tradable assets here)
This is a by-product of defining an algorithmic trading method... we were surprised ourselves those past few weeks while trading with it.
The entries displayed are most of the time amazing, and the invalidations allow to reduce the losses considerably (more wins and less losses => delighted trader)
A few examples below showing why it's "universal"
FOREX
INDICES
COMMODITIES
CRYPTO (BTC pairing)
The tool works in m30 timeframe but won't work with any other timeframe . Even if applied on a 30-minutes chart; we included higher timeframe indicators to enter more securely.
It includes :
- our proprietary method with fixed entries
- a hard exit system (built-in stop-loss)
- 🔔 Compatible with dynamic alerts 🔔
Dynamic alerts are bringing automated trading to a whole new level. The third-party solutions capturing TradingView alerts are able to use them.
- (optional) we let the users decide to use or not our built-in Trade Manager.
Regardless of the Trade Manager is used or not, one must mandatory exit, once a vertical hard exit bar appears.
- the Algorithmic Supports and Resistances used as safeguards and take profit zones.
Final words
We made it as simple as we could (to be honest it's a very simple system for the end-user) - even with several hundreds of calculations in the indicator.
Please hit me up for any question/feedback/comment
Become the BEST trader that you can be
Dave

Algo & Dark Pool Activity - Find Hidden LiquidityThe script is designed to highlight potential algorithmic buying pressure and dark pool accumulation proxies on a TradingView chart. It overlays signals directly on price bars so you can visually spot when unusual activity may be occurring.

[Algo/Fract] QuantBuilt for traders ready to Level Up.
Combine algorithmic strength tracking with fractal structure to deliver quant-style clarity on a live chart.
You trade with intuition. Quant trades with Data.
Together, you read the Unseen.
Features included are:
TT Candles
Quant Strength Index
Structural Retest Areas
Fractal Trend Colors
Gain Access at: www.algofract.com
or by visiting our Whop Marketplace: whop.com


Algorithmic Value Oscillator [CRYPTIK1]Algorithmic Value Oscillator
Introduction: What is the AVO? Welcome to the Algorithmic Value Oscillator (AVO), a powerful, modern momentum indicator that reframes the classic "overbought" and "oversold" concept. Instead of relying on a fixed lookback period like a standard RSI, the AVO measures the current price relative to a significant, higher-timeframe Value Zone .
This gives you a more contextual and structural understanding of price. The core question it answers is not just "Is the price moving up or down quickly?" but rather, " Where is the current price in relation to its recently established area of value? "
This allows traders to identify true "premium" (overbought) and "discount" (oversold) levels with greater accuracy, all presented with a clean, futuristic aesthetic designed for the modern trader.
The Core Concept: Price vs. Value The market is constantly trying to find equilibrium. The AVO is built on the principle that the high and low of a significant prior period (like the previous day or week) create a powerful area of perceived value.
The Value Zone: The range between the high and low of the selected higher timeframe.
Premium Territory (Distribution Zone): When the oscillator moves into the glowing pink/purple zone above +100, it is trading at a premium.
Discount Territory (Accumulation Zone): When the oscillator moves into the glowing teal/blue zone below -100, it is trading at a discount.
Key Features
1. Glowing Gradient Oscillator: The main oscillator line is a dynamic visual guide to momentum.
The line changes color smoothly from light blue to neon teal as bullish momentum increases.
It shifts from hot pink to bright purple as bearish momentum increases.
Multiple transparent layers create a professional "glow" effect, making the trend easy to see at a glance.
2. Dynamic Volatility Histogram: This histogram at the bottom of the indicator is a custom volatility meter. It has been engineered to be adaptive, ensuring that the visual differences between high and low volatility are always clear and dramatic, no matter your zoom level. It uses a multi-color gradient to visualize the intensity of market volatility.
3. Volatility Regime Dashboard: This simple on-screen table analyzes the histogram and provides a clear, one-word summary of the current market state: Compressing, Stable, or Expanding.
How to Use the AVO: Trading Strategies
1. Reversion Trading This is the most direct way to use the indicator.
Look for Buys: When the AVO line drops into the teal "Accumulation Zone" (below -100), the price is trading at a discount. Watch for the oscillator to form a bottom and start turning up as a signal that buying pressure is returning.
Look for Sells: When the AVO line moves into the pink "Distribution Zone" (above +100), the price is trading at a premium. Watch for the oscillator to form a peak and start turning down as a signal that selling pressure is increasing.
2. Best Practices & Settings
Timeframe Synergy: The AVO is most effective when your chart timeframe is lower than your selected "Value Zone Source." For example, if you trade on the 1-hour chart, set your Value Zone to "Previous Day."
Confirmation is Key: This indicator provides powerful context, but it should not be used in isolation. Always combine its readings with your primary analysis, such as market structure and support/resistance levels.

Weekly RSI Buy/Sell SignalsWeekly RSI Buy/Sell Signal Indicator
This indicator is designed to help traders identify high-probability buy and sell opportunities on the weekly chart by using the Relative Strength Index (RSI). By utilizing weekly RSI values, this indicator ensures signals align with broader market trends, providing a clearer view of potential price reversals and continuation.
How It Works:
Weekly RSI Calculation: This script calculates the RSI using a 14-period setting, focusing on the weekly timeframe regardless of the user’s current chart view. The weekly RSI is derived using request.security, allowing for consistent signals even on intraday charts.
Signal Conditions:
Buy Signal: A buy signal appears when the RSI crosses above the oversold threshold of 30, suggesting that price may be gaining momentum after a potential bottom.
Sell Signal: A sell signal triggers when the RSI crosses below the overbought threshold of 70, indicating a possible momentum shift downwards.
Visual Cues:
Buy/Sell Markers: Clear green "BUY" and red "SELL" markers are displayed on the chart when buy or sell conditions are met, making it easy to identify entry and exit points.
RSI Line and Thresholds: The weekly RSI value is plotted in real time with color-coded horizontal lines at 30 (oversold) and 70 (overbought), providing a visual reference for key levels.
This indicator is ideal for traders looking for reliable, trend-based signals on higher timeframes and can be a helpful tool for filtering out shorter-term market noise.

Algos Asia Sweep"Algos Asia Sweep" Indicator is here to help "Asia sweep" traders with statistics and technical analysis.
This indicator includes three main parts:
1. It shows the three major sessions (Asia, London, and New York) as three boxes on the chart, so users can easily find the difference in volume and volatility in each session and use it to take trades with their own strategy.
2. It displays a "statistics table" in the upper-right corner of the chart with information about the breakouts of Asia session highs and lows during the last X days (the number of days used for the calculations can be changed depending on different timeframes and the TradingView edition the user has; it appears in the "session counted" row).
3. It indicates on each day if the Asia session high/low has been broken by creating a circle above the first bar that breaks the Asia high and below the first bar that breaks the Asia low. In addition, it creates a horizontal line at the last session's Asia low and high if they have not yet been broken.
HOW THE CALCULATIONS WORK?
Every day, the script finds each session's high and low. The script counts the number of Asia sessions that have occurred since it started working, and on each day, it identifies if the Asia session high/low/both have been broken. At the end, the indicator divides the number of times the Asia session high/low/both have been broken by the number of sessions executed.
-The indicator is set to GMT+3. Change it to your timezone.
-The indicator can't be used in higher timeframes than 4H, and it is not recommended to use it in higher timeframes than 1H.
-Everything you get from this indicator is NOT considered trading advice. The programmer is not a financial advisor. Any action/decision you make based on this indicator is at your own discretion. Always do your own research and trade only based on your personal judgment.
I would like to know your opinion about using this indicator. Please let me know in the comments.

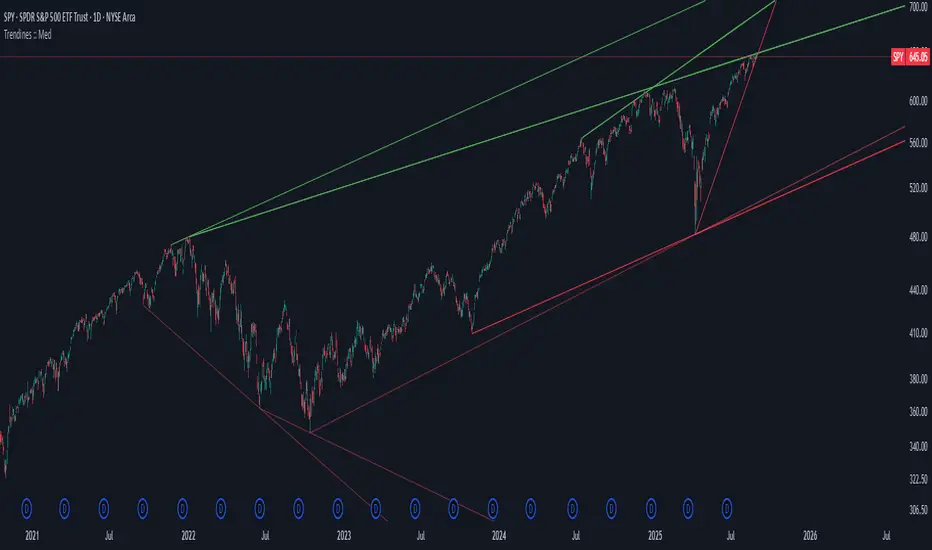
Algo + Trendlines :: Medium PeriodThis indicator helps me to avoid overlooking Trendlines / Algolines. So far it doesn't search explicitly for Algolines (I don't consider volume at all), but it's definitely now already not horribly bad.
These are meant to be used on logarithmic charts btw! The lines would be displayed wrong on linear charts.
The biggest challenge is that there are some technical restrictions in TradingView, f. e. a script stops executing if a for-loop would take longer than 0.5 sec.
So in order to circumvent this and still be able to consider as many candles from the past as possible, I've created multiple versions for different purposes that I use like this:
Algo + Trendlines :: Medium Period : This script looks for "temporary highs / lows" (meaning the bar before and after has lower highs / lows) on the daily chart, connects them and shows the 5 ones that are the closest to the current price (=most relevant). This one is good to find trendlines more thoroughly, but only up to 4 years ago.
Algo + Trendlines :: Long Period : This version looks instead at the weekly charts for "temporary highs / lows" and finds out which days caused these highs / lows and connects them, Taking data from the weekly chart means fewer data points to check whether a trendline is broken, which allows to detect trendlines from up to 12 years ago! Therefore it misses some trendlines. Personally I prefer this one with "Only Confirmed" set to true to really show only the most relevant lines. This means at least 3 candle highs / lows touched the line. These are more likely stronger resistance / support lines compared to those that have been touched only twice.
Very important: sometimes you might see dotted lines that suddenly stop after a few months (after 100 bars to be precise). This indicates you need to zoom further out for TradingView to be able to load the full line. Unfortunately TradingView doesn't render lines if the starting point was too long ago, so this is my workaround. This is also the script's biggest advantage: showing you lines that you might have missed otherwise since the starting bars were outside of the screen, and required you to scroll f. e back to 2015..
One more thing to know:
Weak colored line = only 2 "collision" points with candle highs/lows (= not confirmed)
Usual colored line = 3+ "collision" points (= confirmed)
Make sure to move this indicator above the ticker in the Object Tree, so that it is drawn on top of the ticker's candles!
More infos: www.reddit.com
Algo + Trendlines :: Long PeriodThis indicator helps me to avoid overlooking Trendlines / Algolines. So far it doesn't search explicitly for Algolines (I don't consider volume at all), but it's definitely now already not horribly bad.
These are meant to be used on logarithmic charts btw! The lines would be displayed wrong on linear charts.
The biggest challenge is that there are some technical restrictions in TradingView, f. e. a script stops executing if a for-loop would take longer than 0.5 sec.
So in order to circumvent this and still be able to consider as many candles from the past as possible, I've created multiple versions for different purposes that I use like this:
Algo + Trendlines :: Medium Period : This script looks for "temporary highs / lows" (meaning the bar before and after has lower highs / lows) on the daily chart, connects them and shows the 5 ones that are the closest to the current price (=most relevant). This one is good to find trendlines more thoroughly, but only up to 4 years ago.
Algo + Trendlines :: Long Period : This version looks instead at the weekly charts for "temporary highs / lows" and finds out which days caused these highs / lows and connects them, Taking data from the weekly chart means fewer data points to check whether a trendline is broken, which allows to detect trendlines from up to 12 years ago! Therefore it misses some trendlines. Personally I prefer this one with "Only Confirmed" set to true to really show only the most relevant lines. This means at least 3 candle highs / lows touched the line. These are more likely stronger resistance / support lines compared to those that have been touched only twice.
Very important: sometimes you might see dotted lines that suddenly stop after a few months (after 100 bars to be precise). This indicates you need to zoom further out for TradingView to be able to load the full line. Unfortunately TradingView doesn't render lines if the starting point was too long ago, so this is my workaround. This is also the script's biggest advantage: showing you lines that you might have missed otherwise since the starting bars were outside of the screen, and required you to scroll f. e back to 2015..
One more thing to know:
Weak colored line = only 2 "collision" points with candle highs/lows (= not confirmed)
Usual colored line = 3+ "collision" points (= confirmed)
Make sure to move this indicator above the ticker in the Object Tree, so that it is drawn on top of the ticker's candles!
More infos: www.reddit.com

Algorithmic Signal AnalyzerMeet Algorithmic Signal Analyzer (ASA) v1: A revolutionary tool that ushers in a new era of clarity and precision for both short-term and long-term market analysis, elevating your strategies to the next level.
ASA is an advanced TradingView indicator designed to filter out noise and enhance signal detection using mathematical models. By processing price movements within defined standard deviation ranges, ASA produces a smoothed analysis based on a Weighted Moving Average (WMA). The Volatility Filter ensures that only relevant price data is retained, removing outliers and improving analytical accuracy.
While ASA provides significant analytical advantages, it’s essential to understand its capabilities in both short-term and long-term use cases. For short-term trading, ASA excels at capturing swift opportunities by highlighting immediate trend changes. Conversely, in long-term trading, it reveals the overall direction of market trends, enabling traders to align their strategies with prevailing conditions.
Despite these benefits, traders must remember that ASA is not designed for precise trade execution systems where accuracy in timing and price levels is critical. Its focus is on analysis rather than order management. The distinction is crucial: ASA helps interpret price action effectively but may not account for real-time market factors such as slippage or execution delays.
Features and Functionality
ASA integrates multiple tools to enhance its analytical capabilities:
Customizable Moving Averages: SMA, EMA, and WMA options allow users to tailor the indicator to their trading style.
Signal Detection: Identifies bullish and bearish trends using the Relative Exponential Moving Average (REMA) and marks potential buy/sell opportunities.
Visual Aids: Color-coded trend lines (green for upward, red for downward) simplify interpretation.
Alert System: Notifications for trend swings and reversals enable timely decision-making.
Notes on Usage
ASA’s effectiveness depends on the context in which it is applied. Traders should carefully consider the trade-offs between analysis and execution.
Results may vary depending on market conditions and chart types. Backtesting with ASA on standard charts provides more reliable insights compared to non-standard chart types.
Short-term use focuses on rapid trend recognition, while long-term application emphasizes understanding broader market movements.
Takeaways
ASA is not a tool for precise trade execution but a powerful aid for interpreting price trends.
For short-term trading, ASA identifies quick opportunities, while for long-term strategies, it highlights trend directions.
Understanding ASA’s limitations and strengths is key to maximizing its utility.
ASA is a robust solution for traders seeking to filter noise, enhance analytical clarity, and align their strategies with market movements, whether for short bursts of activity or sustained trading goals.
Algo LinesThe primary objective of this indicator is to identify and draw significant trendlines based on pivot points. These trendlines can help traders make informed decisions by providing a visual representation of support and resistance levels in the market.The script consists of several input parameters, functions, and variables that work together to create dynamic trendlines based on pivot points. The input parameters allow users to customize the appearance and behavior of the indicator, including the colors of the trendlines, the timeframe, and the maximum number of crossed lines to display.
The core of the script is built around two main functions:
1. createLine(): This function is responsible for creating a new trendline based on the provided pivot points. It takes five arguments - pivot type, x1, y1, x2, and y2 coordinates - and returns a new line object. Depending on the pivot type, the function adds the new line to either the dtlArray (down trendline array) or utlArray (up trendline array).
2. getSlope(): This function calculates the slope of a given line and returns the extended price level based on the current bar index. It takes one argument - the line object - and uses its coordinates to compute the slope.
The script also employs several variables to store and manipulate pivot points and trendlines. These include arrays for up and down trendlines (dtlArray and utlArray), variables for storing pivot point coordinates (utlX1, utlY1, etc.), and temporary arrays for storing crossed trendlines (tempUtl and tempDtl).
Creating Trendlines
The Algo Lines script identifies pivot highs and pivot lows using the ta.pivothigh() and ta.pivotlow() functions. When a new pivot low is detected, the script updates the utlX1 and utlY1 variables with the previous pivot low coordinates, and the utlX2 and utlY2 variables with the current pivot low coordinates. If the rate of change between these points meets the minimum threshold specified by the user, the createLine() function is called to create a new up trendline.
Similarly, when a new pivot high is detected, the script updates the dtlX1 and dtlY1 variables with the previous pivot high coordinates, and the dtlX2 and dtlY2 variables with the current pivot high coordinates. If the rate of change between these points meets the minimum threshold specified by the user, the createLine() function is called to create a new down trendline.
Processing Trendlines
The Algo Lines script processes up and down trendlines separately. For each trendline in the utlArray, the script checks if the price has crossed the trendline based on the user's chosen cross source (either close or high/low). If the price crosses a trendline, the script creates a new dashed line with the pastColor and adds it to the temporary array (tempUtl). The original trendline is then deleted.
The same process is applied to the dtlArray, except that the temporary array used is tempDtl. In both cases, if the number of crossed lines exceeds the maximum specified by the user, the oldest crossed line is removed from the temporary array.
Conclusion
The Algo Lines indicator offers traders a powerful tool for identifying significant trendlines based on pivot points. By providing a customizable and dynamic visual representation of support and resistance levels, the script enables traders to make better-informed decisions in the market. The concise and well-structured Pine Script code adheres to TradingView's house rules and ensures a seamless integration with the platform.

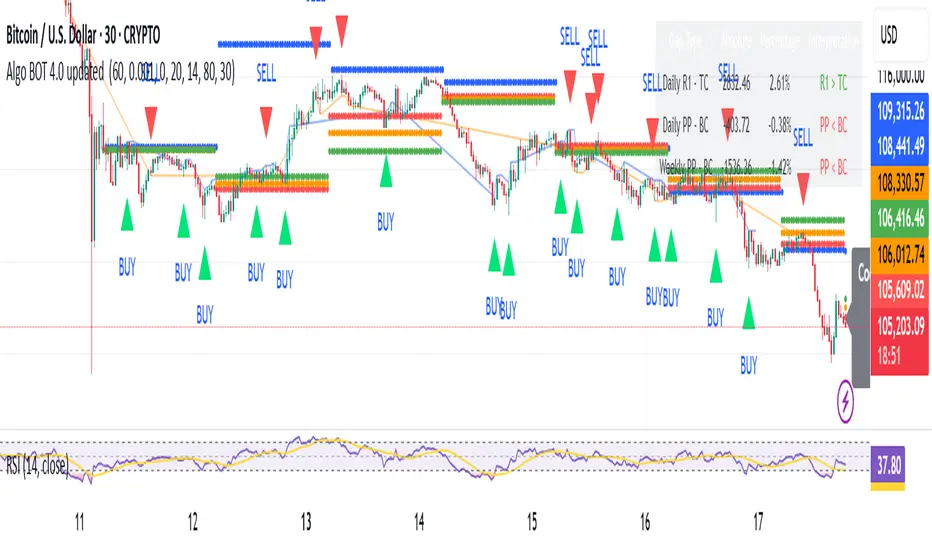
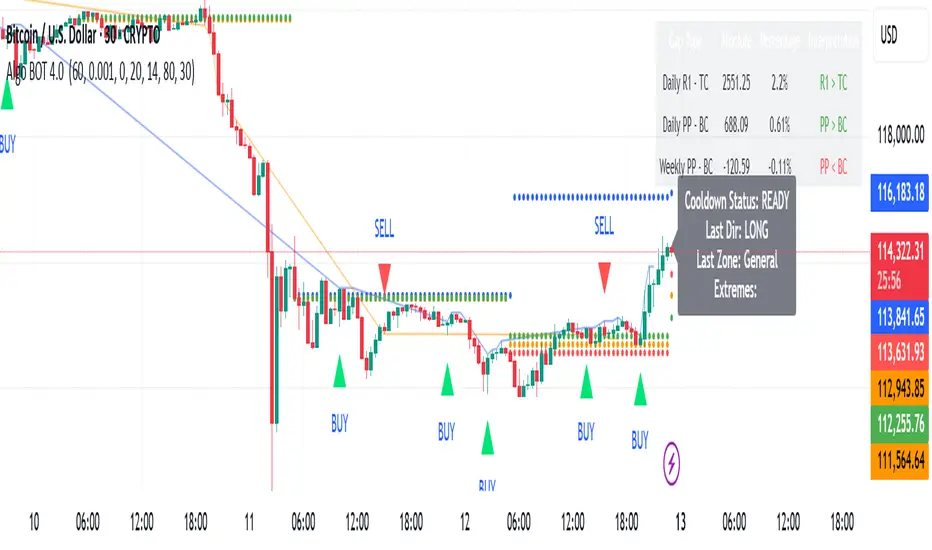
Algo BOT 4.0 updated Strategy Description:
Algo BOT 4.0 updated is a sophisticated multi-timeframe trading strategy that identifies high-probability reversal points using technical confluence. The strategy combines:
Core Components:
Multi-timeframe Pivot Analysis: Daily, Weekly, and Monthly pivot points with CPR (Central Pivot Range)
RSI Momentum Filter: Higher timeframe RSI (user-configurable) for trend bias
VWAP Dynamics: Volume-weighted average price with moving averages
Fibonacci Strength Analysis: Candle close positions relative to 38.2% Fib levels
Advanced Cooldown System: Prevents overtrading with dynamic gap requirements
Entry Logic:
Long Entries: RSI < 57 with bullish candle structure at key support levels
Short Entries: RSI > 43 with bearish candle structure at key resistance levels
Zone-based Filtering: Identifies trades near significant pivot points (D PP, D R1, D S1, W PP, M PP, VWAP)
Risk Management:
Dynamic cooldown periods between trades
Gap-based entry optimization to ensure sufficient price movement
Extreme price tracking for better entry timing
Multi-condition validation to reduce false signals
Alert System:
Real-time alerts for both long and short entries
Includes price, RSI value, and zone information
Visual signals with triangle markers on chart
Comprehensive status monitoring with cooldown timer
Algo BOT 4.0 Strategy Description:
Algo BOT 4.0 is a sophisticated multi-timeframe trading strategy that identifies high-probability reversal points using technical confluence. The strategy combines:
Core Components:
Multi-timeframe Pivot Analysis: Daily, Weekly, and Monthly pivot points with CPR (Central Pivot Range)
RSI Momentum Filter: Higher timeframe RSI (user-configurable) for trend bias
VWAP Dynamics: Volume-weighted average price with moving averages
Fibonacci Strength Analysis: Candle close positions relative to 38.2% Fib levels
Advanced Cooldown System: Prevents overtrading with dynamic gap requirements
Entry Logic:
Long Entries: RSI < 57 with bullish candle structure at key support levels
Short Entries: RSI > 43 with bearish candle structure at key resistance levels
Zone-based Filtering: Identifies trades near significant pivot points (D PP, D R1, D S1, W PP, M PP, VWAP)
Risk Management:
Dynamic cooldown periods between trades
Gap-based entry optimization to ensure sufficient price movement
Extreme price tracking for better entry timing
Multi-condition validation to reduce false signals
Alert System:
Real-time alerts for both long and short entries
Includes price, RSI value, and zone information
Visual signals with triangle markers on chart
Comprehensive status monitoring with cooldown timer
Algo Structure [ValiantTrader_]Explanation of the "Algo Structure" Trading Indicator
This Pine Script indicator, created by ValiantTrader_, is a multi-timeframe swing analysis tool that helps traders identify key price levels and market structure across different timeframes. Here's how it works and how traders can use it:
Core Components
1. Multi-Timeframe Swing Analysis
The indicator tracks swing highs and lows across:
The current chart timeframe
A higher timeframe (weekly by default)
An even higher timeframe (monthly by default)
2. Swing Detection Logic
Current timeframe swings: Identified when price makes a 3-bar high/low pattern
Higher timeframe swings: Uses the highest high/lowest low of the last 3 bars on those timeframes
3. Visual Elements
Horizontal lines marking swing points
Labels showing the timeframe and percentage distance from current price
An information table summarizing key levels
How Traders Use This Indicator
1. Identifying Key Levels
The indicator draws recent swing highs (red) and swing lows (green)
These levels act as potential support/resistance areas
Traders watch for price reactions at these levels
2. Multi-Timeframe Analysis
By seeing swings from higher timeframes (weekly, monthly), traders can:
Identify more significant support/resistance zones
Understand the broader market context
Spot confluence areas where multiple timeframes align
3. Measuring Price Distance
The percentage display shows how far current price is from each swing level
Helps assess potential reward/risk at current levels
Shows volatility between swings (wider % = more volatile moves)
4. Table Summary
The info table provides a quick reference for:
Exact price levels of swings
Percentage ranges between highs and lows
Comparison across timeframes
5. Trading Applications
Breakout trading: When price moves beyond a swing high/low
Mean reversion: Trading bounces between swing levels
Trend confirmation: Higher highs/lows in multiple timeframes confirm trends
Support/resistance trading: Entering trades at swing levels with other confirmation
Customization Options
Traders can adjust:
The higher timeframes analyzed
Whether to show the timeframe labels
Whether to display swing levels
Whether to show the info table
The indicator also includes price alerts for new swing highs/lows on the current timeframe, allowing traders to get notifications when market structure changes.
This tool is particularly valuable for traders who incorporate multi-timeframe analysis into their strategy, helping them visualize important price levels across different time perspectives

TopTenAlgo 2. HFT Algo for CryptoEN: High Frequency Trade Algo TVQ is an advanced algorithmic system developed using Volume Weighted / Exponential Moving Averages, vWap and Ichimoku . Said indicators are re-blended with the Volume Weighted Average ( vWap ) algorithm used by Merryl Lynch or Yapıkredi algorithms. It does not act like the classic Ichimoku or Moving Averages. TVQ was used instead of RSI . High Frequency Trade Algo's incorporate a 3-sided trading strategy that detects Risk Areas and allows you to stay Flat if necessary (red and white circles above the bars) or generates appropriate signals in the buy and sell regions, that measures the risk. In the triangle or flat / horizontal corrections you need to stay flat, it warns you beforehand that you are in the risky area, while the trend will occur, it warns you with a buy or sell signal.
This algorithm is prepared with @Top10Algo ... Optimization Risky and Wait Zone
TR: High Frequency Trade Algo TVQ, Hacim Ağırlıklı/Exponential Hareketli Ortalamalar, vWap ve Ichimoku kullanarak geliştirilen gelişmiş bir algoritmik sistemdir. Bahsi geçen göstergeler Merryl Lynch yada Yapıkredi algoritmalarının kullandığı Volume Weighted Average ( vWap ) algoritması ile yeniden harmanlanmıştır. Klasik Ichimoku yada Hareketli Ortalamalar gibi hareket etmez. RSI yerine TVQ kullanılmıştır. High Frequency Trade Algo’ lar Riskli Bölgeleri tespit edip gerekirse Flat kalmanızı sağlayan(barların üstündeki kırmızı ve beyaz daireler) yada alım ve satım bölgelerinde uygun sinyaller üreten yani riski ölçen 3 taraflı bir trading stratejisini içinde barındırır. Flat kalmanız gereken üçgen yada yassı/yatay düzeltmelerde sizi riskli bölgede olduğunuz konusunda önceden uyarırken, trend oluşacağı zamanda al yada sat sinyali ile önceden uyarır.
Bu algoritma @Top10Algo ile beraber hazırlanmıştır...Riskli ve Bekleme yapılan Flat bölgelerle ile ilgili iyileştirmeler yapıldı...
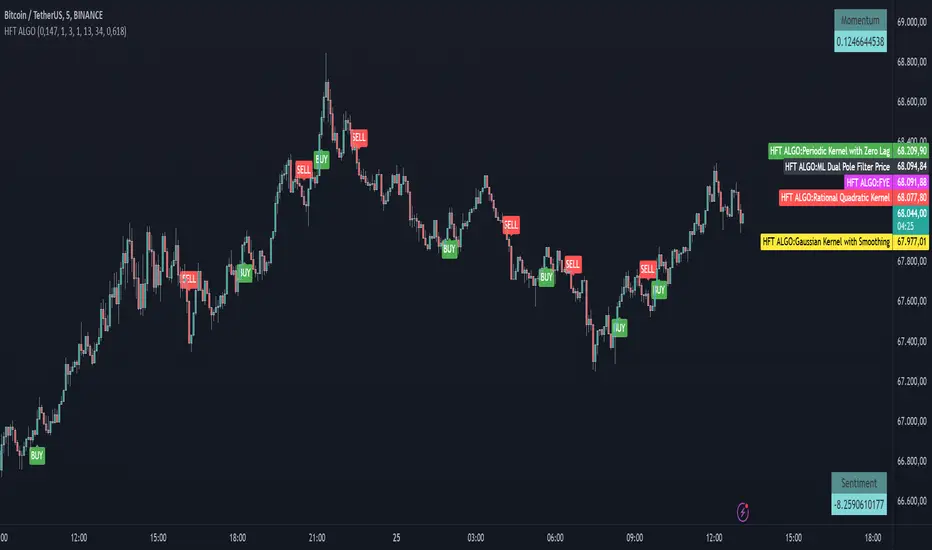
TopTenAlgo 2. HFT AlgoEN: High Frequency Trade Algo TVQ is an advanced algorithmic system developed using Volume Weighted / Exponential Moving Averages, vWap and Ichimoku . Said indicators are re-blended with the Volume Weighted Average ( vWap ) algorithm used by Merryl Lynch or Yapıkredi algorithms. It does not act like the classic Ichimoku or Moving Averages. TVQ was used instead of RSI . High Frequency Trade Algo's incorporate a 3-sided trading strategy that detects Risk Areas and allows you to stay Flat if necessary (red and white circles above the bars) or generates appropriate signals in the buy and sell regions, that measures the risk. In the triangle or flat / horizontal corrections you need to stay flat, it warns you beforehand that you are in the risky area, while the trend will occur, it warns you with a buy or sell signal.
This algorithm is prepared with @Top10Algo ... Optimization Risky and Wait Zone
TR: High Frequency Trade Algo TVQ, Hacim Ağırlıklı/Exponential Hareketli Ortalamalar, vWap ve Ichimoku kullanarak geliştirilen gelişmiş bir algoritmik sistemdir. Bahsi geçen göstergeler Merryl Lynch yada Yapıkredi algoritmalarının kullandığı Volume Weighted Average ( vWap ) algoritması ile yeniden harmanlanmıştır. Klasik Ichimoku yada Hareketli Ortalamalar gibi hareket etmez. RSI yerine TVQ kullanılmıştır. High Frequency Trade Algo’ lar Riskli Bölgeleri tespit edip gerekirse Flat kalmanızı sağlayan(barların üstündeki kırmızı ve beyaz daireler) yada alım ve satım bölgelerinde uygun sinyaller üreten yani riski ölçen 3 taraflı bir trading stratejisini içinde barındırır. Flat kalmanız gereken üçgen yada yassı/yatay düzeltmelerde sizi riskli bölgede olduğunuz konusunda önceden uyarırken, trend oluşacağı zamanda al yada sat sinyali ile önceden uyarır.
Bu algoritma @Top10Algo ile beraber hazırlanmıştır...Riskli ve Bekleme yapılan Flat bölgelerle ile ilgili iyileştirmeler yapıldı...

Price Action - Delivery Algorithm (Zeiierman)█ Overview
Price delivery algorithms in trading refer to complex computational algorithms used to determine the optimal price for executing trades. These algorithms are particularly relevant in electronic and algorithmic trading environments where large volumes of trades are executed automatically.
These algorithms are designed to analyze market data, including prices, volumes, and historical trends, to determine the most favorable price at which to execute a trade. They can take into account various factors such as market liquidity, price impact, and timing to optimize trade execution.
█ How It Works
Optimal price zones can be calculated in many different ways; we have decided to use a cycle method that determines the current dominant trend. The indicator functions by isolating a trend within a specific frequency range from various data.
Filter Logic and Loop:
The indicator computes a weighted average of historical prices over a range of past data points. It employs a loop to iterate over these past data points, applying a unique weight to each, depending on its position relative to the trend period.
Weight Calculation:
Weights are determined using triangle wave functions. The triangle wave function ensures that the weighting oscillates in synchronization with the desired trend period.
Summation:
The indicator aggregates the weighted prices from past periods to generate a single value for each point in time. This value signifies the strength and direction of the trend at the specified frequency. The results are used to determine the specific price zones.
█ How to Use
The price zones help traders identify the best times to enter and exit the market, similar to how support and resistance zones are used. The strategy is based on using price delivery algorithm zones to enter the market in areas commonly used by institutions for placing larger orders. The main advantage of this strategy is having the support of these heavier players.
█ Settings
Delivery Algorithm: This setting allows you to select the calculation method for the Delivery Algorithm. There are several options including "Price", "Swing High", "Swing Low", "Swing Mean", "Momentum", "Expansion", and "Volume". Each option represents a different way of analyzing market data, focusing on different aspects of price action or market dynamics. The choice here will influence how the algorithm interprets and responds to market data.
The corresponding length value is about the responsiveness of the Delivery Algorithm. Adjusting this value affects the algorithm's sensitivity to changes in market conditions. A higher value makes the algorithm more responsive, meaning it will react more strongly to recent market changes. This could be useful in volatile markets. On the other hand, a lower value makes the algorithm less responsive, resulting in more gradual adjustments. This might be preferable in more stable market conditions to avoid reacting to what might be considered 'market noise.'
Delivery Sensitivity: This setting adjusts the sensitivity of the algorithm's calculations to price movements. A higher value tends to smooth out the algorithm's output by considering a wider range of price data, which can be useful for identifying longer-term trends. A lower value makes the algorithm more sensitive to recent price movements, which can be helpful for short-term trading or scalping strategies. The option to enable Scalping Mode is particularly relevant for traders focusing on short-term, quick trades.
-----------------
Disclaimer
The information contained in my Scripts/Indicators/Ideas/Algos/Systems does not constitute financial advice or a solicitation to buy or sell any securities of any type. I will not accept liability for any loss or damage, including without limitation any loss of profit, which may arise directly or indirectly from the use of or reliance on such information.
All investments involve risk, and the past performance of a security, industry, sector, market, financial product, trading strategy, backtest, or individual's trading does not guarantee future results or returns. Investors are fully responsible for any investment decisions they make. Such decisions should be based solely on an evaluation of their financial circumstances, investment objectives, risk tolerance, and liquidity needs.
My Scripts/Indicators/Ideas/Algos/Systems are only for educational purposes!

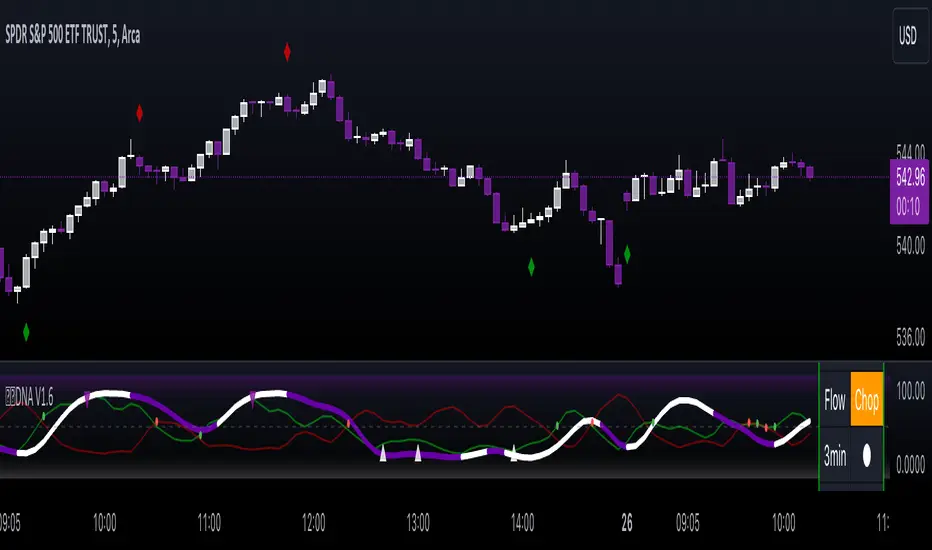
Gorb DNAIntroduction:
Gorb DNA is a versatile indicator using classic technical analysis components such as moving averages, stochastic oscillator, and histogram blending call/put flow analysis with our proprietary DNA algorithm. This indicator is designed to provide traders with useful market direction, volume, and momentum change visual cues.
Overview:
The Gorb DNA Indicator isn't just another momentum tool; it's a complex integration of innovative market analysis techniques.
By combining moving averages, stochastic oscillator, with proprietary algorithms, this indicator offers a multi-layered view of market trends, by merging call/put flow analysis with traditional market flow assessment.
This is designed for all kinds of traders, using a simple method to deliver visual changes in flow, volume, and momentum.
Core Features: Call/Put Flow & DNA
Call/Put Flow Analysis: This component examines the strength of market buying and selling pressures. It analyzes call (buying) and put (selling) flows using price range movements, providing insights smoothed over a defined period for analysis of market sentiment.
DNA Algorithm: A central feature of this indicator, the DNA algorithm utilizes a specialized moving average and oscillator technique to discern market trends. It presents an innovative approach, calculating the difference between bullish and bearish indicators to offer a detailed analysis of market momentum.
Visualization and Color Coding: The indicator employs a color-coded system for ease of interpretation, with distinct colors indicating different market conditions: white for upward/bullish movement and purple for downward/bearish movement. This feature translating complex data into a visual format that is simple to understand.
How Call/Put Flow Works:
Moving averages are used with volume and candlestick highs/lows over a specific range to help determine the overall flow. It then plots a colored line area that looks like a colored wave using just two colors to provide traders with a visual of the current market flow. This can help traders identify changes in sentiment with simple color cues.
How DNA Works:
A stochastic oscillator is used to measure the current price level relative to its price over a specific range period to analyze the momentum for the two DNA strands. Additionally moving averages are used to confirm trend and identify any divergences relative to the momentum. This is then plotted as two lines(DNA Strands) following the same color scheme as Call/Put Flow. When momentum is picking up in a specific direction, the lines will change colors and cross each other, this gives a visual of momentum now being fully on one side until it starts to change colors and flip that direction.
Custom Algorithm Elements:
Gorb DNA isn't just common tools combined into one indicator. It includes proprietary algorithmic elements tailored to enhance technical analysis and timing. These are the reasons what set this indicator apart from common momentum, sentiment, and volume methods.
We recommend experimenting with these features to choose what best suits your trading style.
Settings:
All skill-level friendly presets, easy to enable features with one-click
Call Flow: allows the user to plot a colored area that looks like waves showing increases/decreases in bullish volume (not to be followed blindly)
Put Flow: allows the user to plot a colored area that looks like waves showing increases/decreases in bearish volume (not to be followed blindly)
DNA Strand 1: allows the user to plot one of the algorithm lines to visualize momentum direction (not to be followed blindly)
DNA Strand 2: allows the user to plot one of the algorithm lines to visualize momentum direction (not to be followed blindly)
DNA Strength: allows the user to a histogram displaying momentum volume bars in the background
Flow Threshold: allows users to plot a dotted line to identify when call/put flow is now above average flow range
All colors are changeable for the user to customize to their liking
Call/Put Flow & DNA Demonstration
In the image below, we can see a basic illustration of how these core features function.
As stated above, call/put flow carefully monitors changes in moving averages, volume, and price action. If the market sentiment is shifting one direction, the call/put flow will plot those changes. If market is bullish, call flow should rise and put flow should decrease. The same goes for the opposite if the market is bearish.
As is the same for the DNA strands, if markets momentum is becoming bullish, the lines will change color and then cross to signify a change in momentum and the call flow in the background should match this change. This creates two layers of confluence in an easy understandable visual method.
Using Call/Put Flow
In the image below, we disabled everything but call flow to demonstrate usage.
On the left side of the image, you can see call flow matched price increase, then started to decline. This created a flow divergence, identifying a possible change in price action coming. This happened once flow crossed back below the threshold line and price then beginning to move lower. On the right side of the image, you can see call flow rising and price increasing. This is a good confluence showing there is bullish sentiment building in the market.
In this next image, we disabled everything but put flow to demonstrate usage.
The left side shows a put flow divergence. Put flow is slowly rising just like price is, this can help a trader identify a possible shift in sentiment coming. And on the right side, we have put flow rising above the threshold line and price beginning to decrease. Now we have confluence of bearish sentiment building in the market.
The image below shows only call & put flow enabled, to display what the above two images combined look like.
As you can see in the image above, these flow visuals help identify the underlying market sentiment. And when they cross, it leads to a change in price action in the direction of the sentiment over the threshold line.
Using DNA Strands
The image below has just DNA strands enabled to demonstrate usage.
On the left is a box highlighting bearish momentum cross. In the circles is the change in momentum shifting from bullish to bearish. The move gets stronger as the DNA strands get closer to cross over signifying strength in the move. On the right side is a box highlighting a bullish momentum cross. The circles again, show the change from bearish to bullish momentum. Like previously said, the move gets stronger as the DNA strands get closer to crossing over, signifying strength in that direction.
The next image shows call/put flow and DNA strands enabled for a full complete picture.
The circles labeled (1) are showing the change in momentum from bullish to bearish. Circle (2) shows call flow decreasing and put flow rising above calls. Finally the arrow points to the DNA strands crossing over and put flow rising above the threshold line. This is 3 levels of easy visual confluence showing a change in sentiment, volume, and momentum to the downside.
The next image will be showing the bullish side with call/put flow and DNA strands enabled.
The circles that are labeled (1), show the visual change in momentum on the DNA strands from bearish to bullish. Circle (2) is the crossing of call flow over put flow and the arrow points to the DNA strands crossing over and call flow above the threshold line. Three simple to use visual confluences to identify change in sentiment, volume, and momentum to the upside.
Conclusion:
Our goal is to provide a unique, yet simple approach to market sentiment & momentum analysis. It's a tool developed for traders seeking user-friendly and easy to use tools that provide easy visual insights of market dynamics. We believe in simplicity, effectiveness, and creating tools to support decision making for all traders.
How to get access:
You can see the Author's instructions to get access to this indicator
RISK DISCLAIMER
All content, tools, scripts & education provided by Gorb Algo are for informational & educational purposes only. Trading is risky and most lose their money, past performance does not guarantee future results.
MKAST V2 (lifetime)PLEASE READ THE ENTIRE POST BEFORE PURCHASING & USING THE MKAST Algorithm. Saves you and me some time in emails and messages. :)
This is the NEW LIFETIME ACCESS Version of the MKAST
The MKAST Buy Sell Algorithm is a very specific strategy, cut down to its roots and made perfect for the volatile crypto market.
Many Algorithms focus only on one aspect, one side, one specific rule.
As you know, this is not how life, the market or anything else works.
MKAST combines many different aspects at the same time, scans multiple other Algorithms and comes to a conclusion based on over 1350 lines of code.
It is based on Divergences, Elliott Waves, Ichimoku, MACD, MACD Histogram, RSI, Stoch, CCI, Momentum, OBV, DIOSC, VWMACD, CMF and multiple EMAs.
Every single aspect is weighted into the decision before giving out an indication.
Most buy/sell Algorithms FAIL because they try to apply the same strategy to every single chart, which
are as individual as humans.
To conquer this problem, MKAST has a wide range of settings and variables which can be easily
modified.
To make it a true strategy, MKAST has as well settings for Take Profit Points, Multiple Entries and Stop
Losses. Everything with an Alert Feature of course.
I know from experience that many people take one Algorithm and are simply too LAZY to add multiple Algorithms to make a rational choice.
The result of that is that they lose money, by following blatantly only one Algorithm.
MKAST has additional 9 Indicators, perfect for the crypto market, which can be turned on and off.
Manual
MKAST Signals Settings
“Show Signals?” - On/Off to show the Buy/Sell Signals.
“Aggressiveness” - Increase to make the signals less aggressive and decrease to make them more aggressive.
“Show Custom Signals?” - On/Off to show custom MKAST Signals as chosen in the settings below.
“Custom Buy/Sell Aggressiveness” - Choose a custom Aggressiveness for each buy and sell signal individually.
“TJ-Index Requirement For Buy/Sell” - If the TJ-Index is below the given number, it will show the signal in grey, this also applies for normal signals. Buy 0 and Sell 15 shows all signals in their original colour again.
“Don’t show signals that don’t meet index requirement?” - Checked, it will completely not show signals which would be “grey” as in the explanation above.
“Change Backgroundcolour if index is at 15 or 0?” - Checked, changes the colour of the chart if the index is at 15 or 0 points
MKAST Panel Settings
“Show Info Panel?” - Shows Info Panel on the chart.
“Move Info Panel UP by %” - Moves Info Panel up/down.
“Move Info Panel Left/Right ” - Moves Info Panel Left/Right.
“Show BitMEX Panel?” - Shows BitMEX Panel on the chart.
“Move BitMEX Panel by % ” - Moves BitMEX Panel up/down.
“Move BitMEX Panel Left/Right” - Moves BitMEX Panel Left/Right. “Signal Source” - Choose source of candle open/close for Equity calculation.
“Leverage Used?” - Select the used Leverage for your strategy and Equity calculation.
“Fees Per Trade in % ” - Deducts these fees after each trade from Equity calculation.
“Round Current Profit Price?” - Rounds the number on the Panel. “Trading Periods ” - Choose a trading Period which will be used to calculate Period Equity.
“Show separations of each Trading Period?” - Show separations on the chart of each Trading Period.
The very new feature on Tradingview and obviously now as well on MKAST are Information Panels.
I have chosen to add an Info Panel and a BitMEX Price Panel into MKAST, to make live and even
backtesting easier.
With only one blink of an eye the user is able to see ALL relevant information, without having to go
through various ways of checking and using other tools.
The Info Panel:
The first row shows the current profit. This is calculated since the signal initiation and the current candle close. Followed by a single number, which represents the current TJ-Index, removing the need of having to add the actual TJ-Index Oscillator on the chart.
The second row shows the current position and its status. This was added on request of many users wanting to know if their position is “about to change” or not. The status shows the users if the position is “endangered” or “okay”.
Followed by the “backtesting tool” already included inside the Panel. No need for complex oscillators with a hard reading for backtesting. With this one and simple panel, you see the Period Equity for the period chosen previously in the settings. This calculates all profits made inside that period and re-sets when the period ends. Right next to it, the Total Equity calculating ALL profits since the beginning of the chart.
Right below, you see the information about the last long and short position which have been open. This helps with the evaluation and documentation of the last trade.
The BitMEX Panel:
A convenient panel which shows all BitMEX contracts and their LIVE prices. The need for opening each chart goes away, the quality and experience of trading increases.
MKAST custom Signals are one of the notorious possibilities for ADVANCED strategies with MKAST.
Users who requested these features and use them frequently are the ones, having already a very unique trading strategy and they use these very custom signals as confluence or for multiple entry trades.
These custom signals and their settings can be mostly ignored by the majority of traders who are using this Algorithm.
The idea behind the grey signals has its roots in the idea of the TJ-Index. The TJ-Index being 15 Algorithms and conditions possible showing a bullish or bearish interpretation. The index counts the Algorithms which are showing a bullish interpretation.
Like that we can make sure that signals are shown in the original colour, are only those who have an additional confluence with the TJ-Index, not letting the user buy, if at least the majority is not bullish, and not letting the user sell, if at least the majority is bearish.
The custom buy and sell aggressiveness lets the user customise the MKAST algorithm even more.
Either the users wants to see how signals are changing on a different (slightly lower or higher) aggressiveness, being able to expect a change on their own settings. OR seeing that some signals of the same sort are a little out of place and is able to move these to a different aggressiveness, increasing the profitability even more.
Needless to say, custom signals are NOT a part of the Info Panel.
MKAST Label & Trendline Settings
“Show Labels?” - On/Off to show Labels above each signal, with the percentage gain or loss, calculated from the last signal to the new signal.
“Show Trendlines?” - On/Off to show automatic Trendlines following Gainzy Lines.
“Lookback Length” - Choose a length that the automatic trendiness use for calculation. Comparable to Aggressiveness.
“Wicks//Bodies” - Change between trendiness connecting from wick to wick or from body to body.
“Black lines// Coloured lines” - Change between simply black lines or changing colour lines.
“Filter Trendlines?” - On/Off to show all trendiness or just resistance decreasing and support increasing ones.
“Limit Extensions Of The Lines?” - This value increases by how much the trendiness are being extended. 0 = endless extension, otherwise 100 = maximum custom extension.MKAST Strategy “Take Profit 1” - On/Off to show TP1 points.
“Take Profit After %” - Set the percentage after which TP1 is active.
“Take Profit 2 ” - On/Off to show TP2 points.
“Take Profit 2 After %” - Set the percentage after which TP1 is
active.
“Take Profit 3” - On/Off to show TP3 points.
“Take Profit 3 After %” - Set the percentage after which TP1 is active.
“Second Entry” - On/Off to show Second Entry points.
“Second Entry After %” - Set the percentage after which Second Entry is active.
“Third Entry” - On/Off to show Third Entry points.
“Third Entry After %” - Set the percentage after which Third Entry is active.
“Stop Loss” - On/Off to show Stop Loss points.
“Stop Loss After %” - Set the percentage after which Stop Loss is active.
MKAST Strategy
To make the life of the MKAST user even easier, I have added all adjustable Take Profit Points, Multiple entry points and Stop Loss points.
I have never seen a sustainable and reliable trading strategy without TPs, Multiple entry and especially without a stop loss. Everything in the usual and fully customisable MKAST style.
Simply choose how many Take Profit points you would like to have and choose the percentage after which you would like to see the Take Profit point appear on the chart and notify you to take profits.
Are you a Trader who likes Multiple Entries? Also no problem with MKAST. Select how many additional entries you would like to have and after how many percent you would like them to appear on the chart and remind you of adding to the position.
What would a Strategy be without a Stop Loss? Same settings apply here as on the TPs and MEs.
All of the settings are able to take fractions of a number as well. This enables users to even use all of the strategy settings for scalping or FX pairs, where high leverage and the smallest of moves are used for trading.
Needless to say, all of these settings work on RENKO and Heikin Ashi as well. These might need adjustment, since the calculation is different, yet there is nothing standing in the way of it anymore.
Crypto Modified Indicators
“Show Divergences?” - On/Off to show Divergences on the Chart based on the data of 10 different Algorithms.
“Show Oversold/bought?” - On/Off to change the colour of the chart in Oversold/bought conditions.
“Oversold/bought value?” - Choose a value for which the chart is Oversold/bought.
“Show Fibonacci Levels?” - On/Off to show automatic Fibonacci Levels.
“Fibonacci Lookback Lenght” - This value states how many candles from right now are taken into account to paint the Fibonacci Levels.
“Fibonacci Custom Period” - Choose a custom Timeframe that should be used to paint the Fibonacci Levels.
“2nd-7th Fibonacci Level” - Enter a value for the Fibonacci Levels you would like to use and see on the chart.
“Plot 1.618 Level?” - On/Off for the Fibonacci extension level.
Crypto Modified Indicators
“Show Bands?” - On/Off to show the TJ-Bands on the chart.
“Bands Length” - Choose a value for the TJ-Bands Lenght
“Show Show EMA 1-3?” - On/Off to show the EMAs 1-3 on the chart.
“EMA Lenght 1-3” - Choose a value for the first to third EMA Lenght
“Show Ichimoku? ” - On/Off to show Ichimoku on the chart.
“Show Tenkin?” - On/Off to show Tenkin on the chart. “Tenkin” - Set the lenght of the Tenkin.
“Show Kijun?” - On/Off to show Kijun on the chart.
“Kijun” - Set the lenght of the Kijun.
“Show Senkou?” - On/Off to show the Senkou on the chart. “Senkou” - Set the lenght of the Senkou.
“Displacement” - Set the value of the Displacement.
“Show Chikou Span?” - On/Off to show the Chikou Span on the chart.
Crypto Custom Indicators
In the picture above, you see the first pair of Crypto Custom Indicators. The oversold and overbought conditions are highlighted.
Bullish and Bearish divergences are also plotted on the chart.
This is personally my favourite combination of Indicators and MKAST settings. It shows nicely
everything one needs to know and makes it easier to decide wether to follow a signal or not.
We here as well a perfect example of the Automatic Fibonacci Lines (Lookback 50, Timeframe 1D).
It shows all significant levels, which we can see being respected.
Orange = 23.6%, Green = 38.2%, Red = 50%, Yellow = 61.8%, Blue = 78.6%, White = 0%;100%
In this picture above, we observe the perfect ensemble of MKAST and an EMA strategy, especially modified for crypto markets.
Here, as by default, we have the EMAs at 21, 90 and 200. These have shown to be very significant moving support and resistance points in the crypto market.
In this picture above, I lowered the timeframe to show the highly significant levels of the Ichimoku. It has not the “usual values”. These here have been modified for the volatile crypto market and set as default.
An incredibly powerful tool for anyone who is ready to step up their trading game. It is a huge part of the MKAST back end and the strategy behind it.
MKAST Custom Alerts
1
MKAST without any doubt has Custom Alerts for all Signals that it is painting on the chart.
One can even choose to receive custom notifications for Take Profit points, Multiple Entry points and
the Stop Loss points.
The signals appear on the chart DURING the candle, not at the end of the candle. Therefore, the
alerts do this as well. These appear during the candle.
Here we can see all of the possible Alerts that can be chosen to be displayed. In total it is 14 different custom alerts, based on what the trader is looking for and how he is trading.
Personally, I have 10-15 coins that I trade the most and for these I have custom notifications, mostly though only the MKAST Buy/Sell and Stop Loss Signals.
To activate Alerts for MKAST,
1) Go to the “ALERT” icon on the top tool bar of your Tradingview.
2) Select “CONDITION” as “—MKAST—“
3) Then choose ONE condition from the list of conditions.
4) On “OPTIONS” you can set how many times it appears, I have “Once per Bar”.
4.1) If you want to make sure that the signal is truly there and not just a condition for a second during the candle, choose “ONCE PER BAR CLOSE”.
5) “Expiration Time” sets the time until the alert expires. PRO users have no expiration for alerts.
6) “Alert Actions” give you a row of choices what happens and how you want to be notified.
7) “Message” is the message that you receive inside the notification.
Thank you, Kong
