"algo" için komut dosyalarını ara


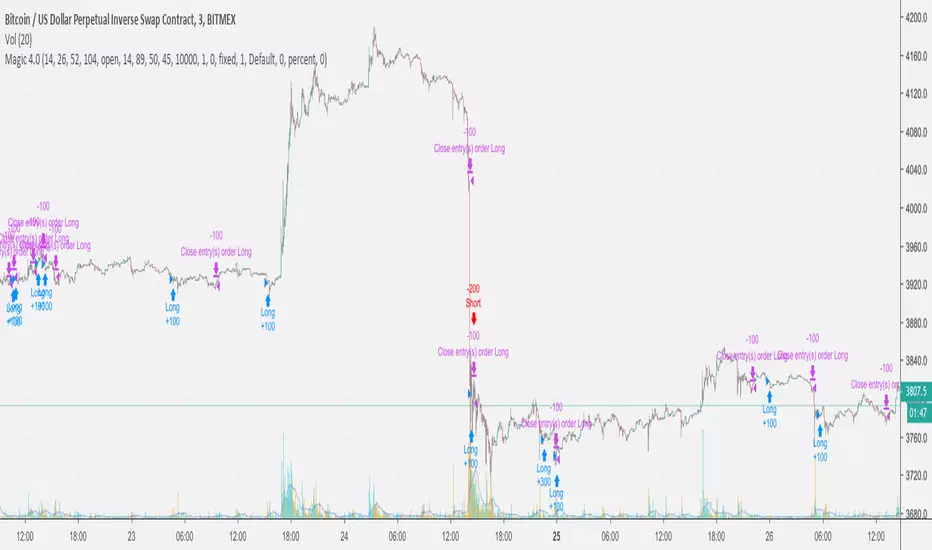
Magic 4.0 with Dynamic Stops [FINAL]The wait is over. I've ran countless simulations, stayed up days and days away slaving on this code and pulled rabbit out of the hat. This is the best of Magic I currently have to offer. It is protected by dynamic stop losses, allow it to countertrade strong trends -- but there's more. The algorithm switches to a long and short only strategy based on volatility , candle structure, volume , and ELAPSED TIME from previous impulse. Yes, there's a time component.
I was make a disclaimer here: This strategy is subscription-based; it is not open to the public, so if you're interested in making this a staple of your trading strategy and you're serious about it enough to invest a small amount to reap the benefits of my greatest work, send me a DM , and let's talk.
And by the way...
NO. IT DOES NOT REPAINT.
Sim-pe-Lyfe
FractalSqueezeRecommended; Range Bars / find the optimal hit rate between the 33R / 66R / 100R for individual securities or a combination of all 3.
Algorithm determines the geometric state of securities prices and is triggered by volatility expansion on multiple key scales in a unified direction. The unique advantage of this system is that the signal is capable of both strengthening on the long side in the face of negative price action and strengthening on the short side in the face of positive price action, to optimize the signal, trade the divergence of price and output value.

Hakimi - Decision Tree Based Strategy V.1This is a strategy based on Decision Tree (DT) algorithm which can be used as a Decision Support System (DSS).
How to use:
1- Select the Heikin Ashi chart.
2- select the strategy: "1=Long , 2=Short , 3=Long & Short".
3. Set the P value. Default value is 1000.
4- Enter Start time and End time

Matt's MACD Algo v1This script is meant to be viewed with the Heiken Ashi candlestick chart. I use it for pretty much everything. It has a lot of extra stuff just for visual reference, but the trades are based on the MACD (3,5,9) indicator. I found that speeding up the intervals of the MACD makes for a much more reactive chart. In this heavily volatile market, it has been performing well. If the market is not very volatile, it tends to have too many noisy signals. Any help or criticism would be greatly appreciated.

Support/Resistance Algo-Tradeing StrategyThis strategy Automates Support and resistance trading and a tight trailing stop loss technique. The support and resistance levels are calculated from previous highs and lows; these levels are used to make two types of trades:
1. Break out trades, taking a trade if the market is able to push through a support or resistance level.
2. Liquidity pool rejection, also known as a stop loss hunt. When the market is brought past a key level (to take out stop losses) which traders (usually institutions) use to enter, which then reverses back through the support/resistance level where the strategy enters a trade.
An optional "volatility filter" may be used when on a suitable market. This means that trades are only entered when there is suitable volatility.
A tight stop loss is kept so most trades lose, but winning trades are left to run much further. So this is a very reliable profitable strategy on many markets.
For a limited time I will provide access to this strategy for free as it is not yet complete, there is still testing to do and I would appreciate any feedback.

NMA Strategy v0.1Just stick with the basic - Moving Average! Take only historical data to predict future price action and only use close of candle for algo calculations.
Here i present to you a MA script that includes:
Date Selection for Backtesting
Custom Time Frame
Filters - Oscillator and CCI
Risk Management
This script has been optimized for ETHUSD perpetual swap on Bitmex.

[Simple strategy] Main-chart + Sub-chart indicator - Long onlyThis is a relative simple strategy with merely 2 indicators. The main-chart indicator defines the entry point and the sub-chart indicator defines the exit point. With the help of Heikin-Ashi candle, most of the market noise was screened off, resulting in a smooth and steady growing equity curve.
In the back test report using 15 min time frame, the capital grows over 3 folds (312%) in just 4 months (31 July 2018 - 28 December 2018).
Algo trader may use a smaller time frame to gain better net profit result.
Note:
This is a non repaint script based on the latest "Pinescript version 3"
Disclaimer:
All trading involves high risk; past performance is not necessarily indicative of future results. Hypothetical or simulated performance results have certain inherent limitations. Unlike an actual performance record, simulated results do not represent actual trading. Also, since the trades have not actually been executed, the results may have under- or over-compensated for the impact, if any, of certain market factors, such as lack of liquidity. Simulated trading programs in general are also subject to the fact that they are designed with the benefit of hindsight. No representation is being made that any account will or is likely to achieve profits or losses similar to those shown.

[Simple strategy] Main-chart + Sub-chart indicator - Long onlyThis is a relative simple strategy with merely 2 indicators. The main-chart indicator defines the entry point and the sub-chart indicator defines the exit point. With the help of Heikin-Ashi candle, most of the market noise was screened off, resulting in a smooth and steady growing equity curve.
In the back test report using 15 min time frame, the capital grows over 3 folds (312%) in just 4 months (31 July 2018 - 28 December 2018).
Algo trader may use a smaller time frame to gain better net profit result.
Note:
This is a non repaint script based on the latest "Pinescript version 3"
Disclaimer:
This trading view script, strategy and guide is strictly for individual use and for informational purposes only. In no way we are responsible for any damages or any losses you may incur. Despite the results above, this is not a financial or investment advice rather it is more of an educational tool to assist you in your own decision making. Please invest wisely and remember to always do your research!

BITCOIN DOMINATOR-- BOT-- Bitmex Ready!ladies and gentlemen,
We cracked the XBT code.
For more information, visit the website in my bio.
Moon Bound! god speed!
Bitcoin Acceleration StrategyThe objective for this strategy was to reduce the standard divination of bitcoin returns through risk management, this is done with both long and short trades. It looks to get on board when a trend is detected and adds to the position to average out all entry points. When the momentum begins to decelerate all trades are closed. In short trades it looks for a capitulation structure to exit. 50% of these trades will usually be in profit and 50% will usually be a loss, however profits are 3x larger than losses. I am also pleased that the algorithm shorted through the recent crash.
To demonstrate that the deviation of retuns of the strategy is lower than hodling, I leaveraged the strategy to a similar drawdown level to hodling so that you can compare the two.
When risk adjusted, my strategy beats buy and hold returns by about 600%, although I am personally trading the strategy unleaveraged.
Message me for details on granting access

BTC Swinger v1Daily interval swing trading algorithm based on momentum techniques using ATR Stops. Made by Kory Hoang from Stably.
Shout out to the Advanced Crypto Asset Trading crew! ;)

MW+MA Cross StrategyThe strategy uses WMA and SMA indicators with certain algorithm in order to create signals when they cross.

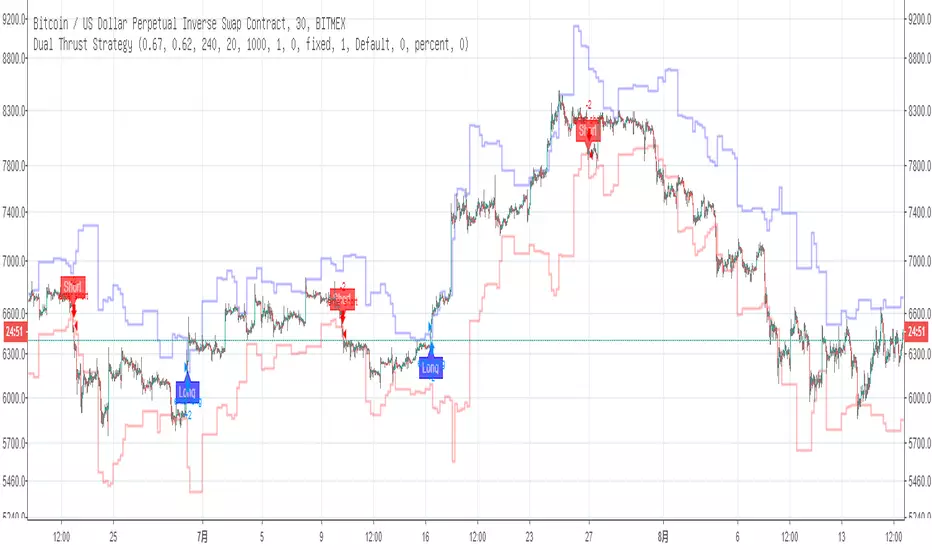
Dual Thrust StrategyThe Dual Thrust trading algorithm is a famous strategy developed by Michael Chalek. Its logical prototype is one of the most common Day trading strategies. The opening range breakout strategy is based on today’s opening price plus or minus a certain percentage of yesterday’s amplitude to determine the upper and lower rails. When the price breaks through the upper track, it will buy long, and when it breaks the lower track, it will sell short.
When using this strategy, on the one hand, you can refer to the optimal parameters of historical data testing. On the other hand, you can start to adjust K1 and K2 in stages according to your own judgment of the post-trend or from other major cycle technical indicators.
Strategy - Bobo's Pivot ATR SwingHi there, welcome to my pivot ATR swing bot. I put this out there with source code hidden to see what ideas others have to use it. Also if there are any coders of trading systems out there who wanted to work with me to put this into a form that could trade automatically we could both use... I'd welcome that kind of collaboration and will happily share the underlying rules of this and the more highly developed version that isn't public.
But as it is, the signals are free for all, use them as you wish and at your own risk. If you want to discuss the code, strategy or ideas, I'm around fairly regularly just message.
The bot is fairly simple design that will give you signals for long and short intraday/week on equity futures / CFDs / ETFs. You'll see it backtests fairly well on an hourly SPX500 chart as configured. You will need to set up certain parameters to account for any different timeframes and markets you wish to trade. For me it's most effective pick out a few good swing trades per week in equity futures. However part of the idea of putting this in the public domain is to see if other people will have good but different ideas how to use it. Please share with me if so :).
The basic concept is a series of 3 lines that define the area and movement we wish to trade. The daily pivot is the central line (blue). We are looking to capture reversions to this middle line from extremes (red and green). Therefore the bot will signal exit at the close of every candle that has passed through the pivot.
Entry is decided by the outer bands around the blue line. Red is the top band, green the bottom. As configured, these are simply placed a daily ATR value apart, centred around the pivot. You can change this quite a lot though, so let's go through the settings:
Pivot Timeframe - simple, a daily pivot is calculated from the previous day's values (high + low + close)/3 . BUt the same calculation can be applied to any length candle, day, minute, month or whatever. This makes the middle target line more or less responsive to recent price action.
ATR Band Timeframe - When we calculate the average range, we need to know what candle length makes up our series. Daily candles is the default, but you can change that here.
ATR Lookback - When we calculate the average range, we need to know how many instances of the timeframe (day, minute, hour etc) we look back to create an average. The lower the lookback value, the more the width of the bands (the distance from pivot) will change quickly based on the volatility of previous candles. The higher the lookback value, the more stable the band width will be to recent volatility.
ATR divisor - The ATR value above is divided by this value, before being added or subtracted to the pivot to create the red and green lines. Default value is 2, and this means the distance from the red band to the green band will be equal to 1 ATR, as calculated according to the parameters above. Setting this to 1 would mean that each band is one ATR away from pivot (ie the bands got wider apart). Set this to 4, and it means that it is only 1/2 an ATR from green to red.
Take Profit / Stop Loss. - We know what a stop and profit target are, but worth nothing that a 0 value disables stop loss or profit targets. The bot will still close positions when crossing pivot.
Also, note the mintick value of the instrument you apply this to. For example for the CFD chart SPX500 the mintick value is 0.1. So a 100 value for stop loss = 10 points on SPX500. but if you were to trade the same thing basically, but the emini future ES, the mintick value is 0.25. So for a 10 point stop on the ES chart, you would need a value of 40 in this bot. US30 and YM have convenient mintick values of 1. Currencies can be a bit of a nightmare :).

Donchian Channel Strategy (DCS) [cI8DH]This is a simple backtest of the bulit-in Donchian Channel indicator. For an indicator with a single parameter, the backtest results are impressive at 87k%. My previous indicator MASARS showed better results (176K%) but it achieved it by 4 parameters. Fewer parameters reduces the chance of overfitting. I am testing these indicators for use in my final algo, so please don't trade based on a single indicator's signal alone.

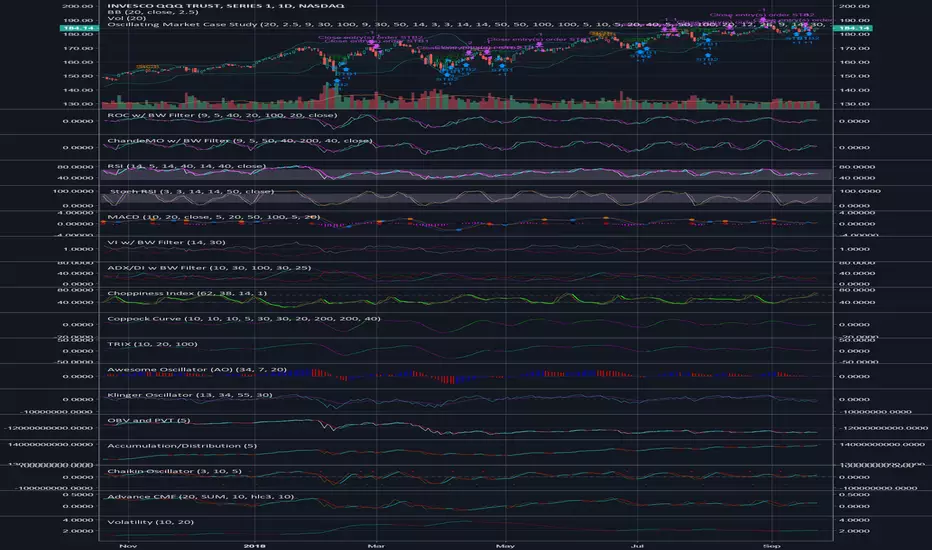
Oscillating Market Case StudyThis is a little something I created to analyze the market. Ultimately, I wanted to create something that could encapsulate the entire market as best as possible. The idea was simple, use technical analysis to create cases that would indicate entry positions and exit positions for long positions initially. After completing that, I decided to add a few shorting cases.
A combination of 25-30 indicators were used to create this, and the indicators were modified with a filter to create a smoothed overlay.
So here's the breakdown:
- 10 total cases: 7 long, 3 short
- The 7 long cases are broken down into three categories; long term, medium term, short term
- Short Term: OC1, OC2, STB1, STB2
- Medium Term: STB1, STB2
- Long Term: LTB1
- Shorting Cases: SC1, SC2, SC3
- The cases are both plotted as text and entry orders; this can be toggled on and off through the format menu.
I suggest you use the format menu to get the most out of this script. The menu consists of toggles to turn of the plots and/or the entries. It's pretty self explanatory. Use it to keep the chart cleared and concise so you only visualise the cases that you need.
Personally, the cases that have worked the best for me are:
- Long Cases: OC1, OC2, STB2, LTB1
- Shorting Cases: SC2, SC3
I kept this description as short as possible, but please feel free to reach out if you have any questions.
Pretty much, use the cases and see if it works for you.
[frac] Flowrate StrategyThis script employs an algorithm to assess the net volume traded. Entry and exit signals are a function of the MA crossovers. The default settings produce extremely strong results on 4hr charts. Alternative settings set to EMA and a 233 Channel Length also produce very encouraging results on higher resolution timeframes, specifically the 15m-1hr.

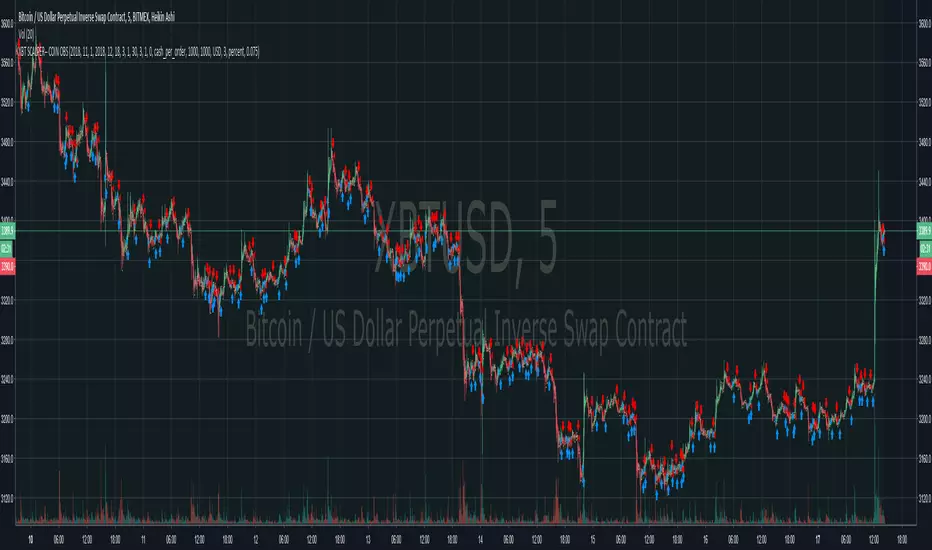
[Development version] XBTUSD (Bitmex) Short term- Features:
+ Development version for XBTUSD (Bitmex) short term: M15/M5
+ Separately optimized AI trading algorithm for different time frames: M15/M5 (including Margin and Exchange Trading).
+ Trustworthy backtesting accuracy result with 100% non-repainting, no difference between backtesting and live trading.
+ Still in development stage, will release this version asap.

XT AI Trading System for XBTUSD (BitMEX)- Features:
+ XT-AI-TRADE System with special built-in XT-AI Trend line, trend cloud indicator for XBTUSD (BitMEX) with the best performance.
+ Full backtesting from April 2018 with results as below:
Time frame / Net profit / Percent profitable / Profit factor
H1: 450% / 80% / 74.187
H2: 445% / 100% / Max
H3: 778% / 80% / 17.264
H4: 624% / 85.71% / 119.905
D1: 169% / 100% / Max
+ Separately optimized AI trading algorithm for different time frames: H1/H2/H3/H4/D1 (including Margin and Exchange Trading).
+ Trustworthy backtesting accuracy result with 100% non-repainting, no difference between backtesting and live trading.
+ Real-time push notification system: Email / Telegram... to your PC and Smartphone => Enjoy trading life.
+ 24/7 business operation.
*** Sign up for a trial here : goo.gl
