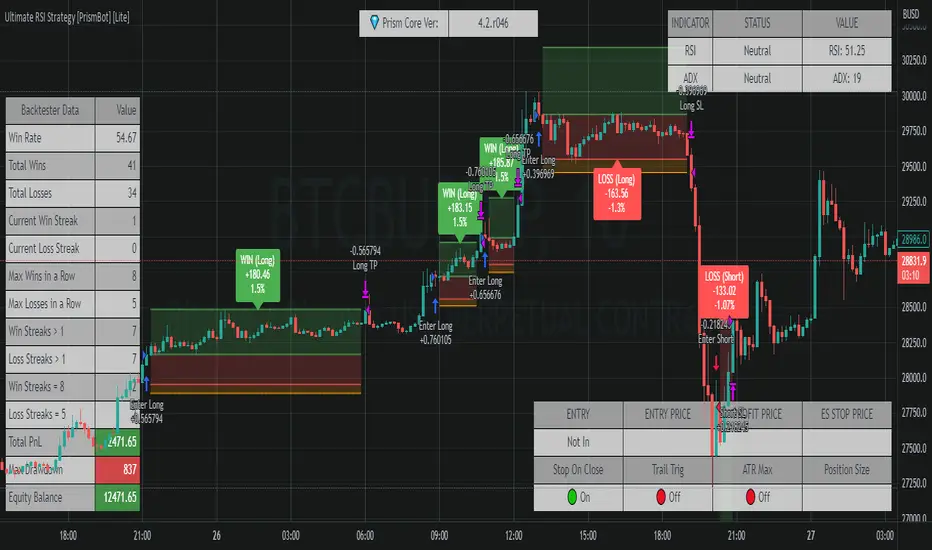
Ultimate RSI Strategy [PrismBot] [Lite]Included in this Ultimate MACD Lite Strategy:
✔️ Tweak a multitude of specific settings (MA lengths, R:R, SL distance etc)
✔️ Enable advanced setup filters
✔️ Use money management and risk calculations
✔️ Draw trade info directly to chart (eg. SL size in percent, win rate etc)
✔️ Use various filters (eg. time filter, date filter, MA slope angle etc)
✔️ Manage risk per position when auto-trading forex through AutoView
✔️ Choose from various alert conditions!
✔️ Sync to any bot or algorithmic trading system
Some details about this strategy:
There are several strategies that people use for the RSI , and one of my favorites is very different than one you have probably heard from every online RSI strategy source.
In order to compliment the RSI , there is also a built-in ADX / DMI strategy (per our All-In-One strategy on my profile as well) and you will also find a Global Trend filter (200 EMA by default).
You can also use a pullback confirmation prior to a trade entering. I.E., you have the RSI signal, wait for a pullback to the pullback EMA , and then the strategy will enter a trade.
You can easily enable and disable strategies using the checkbox.
This strategy incorporates a risk to reward system where the user can select between ATR and Percent based stop losses and take profit targets. This means that the user has much better control over money management when utilizing this strategy and it doesn't require you to babysit the strategy to ensure it's entering and existing strategies in an ideal place.
"algo" için komut dosyalarını ara
Ultimate MACD Strategy [PrismBot] [Lite]Included in this Ultimate MACD Lite Strategy:
✔️ Tweak a multitude of specific settings (MA lengths, R:R, SL distance etc)
✔️ Enable advanced setup filters
✔️ Use money management and risk calculations
✔️ Draw trade info directly to chart (eg. SL size in percent, win rate etc)
✔️ Use various filters (eg. time filter, date filter, MA slope angle etc)
✔️ Manage risk per position when auto-trading forex through AutoView
✔️ Choose from various alert conditions!
✔️ Sync to any bot or algorithmic trading system
Some details about this strategy:
LONG SIGNAL
When the MACD is below the zero line of the histogram, close is above the 200EMA, and the MACD line crosses above the signal line, longs are taken
SHORT SIGNAL
When the MACD is above the zero line of the histogram, close is below the 200EMA, and the MACD line crosses below the signal line, shorts are taken
A couple of options are given for how to calculator stop losses.
The Take profit is calculated by the risk of the stop loss. So a 1.5 take profit target is 1.5 times the stop loss added to the entry price.
There is also an option to filter out trades by the histogram deviation. This prevents crossovers that are too close to the histogram from being taken.
Please note I used the code for the PPO instead of the traditional MACD to make calculating these percentage deviations more consistent across multiple asset types.
You can easily enable and disable strategies using the checkbox.
This strategy incorporates a risk to reward system where the user can select between ATR and Percent based stop losses and take profit targets. This means that the user has much better control over money management when utilizing this strategy and it doesn't require you to babysit the strategy to ensure it's entering and existing strategies in an ideal place.
You can also enter custom messages for alerts for use with bots (set alerts to "alert() function calls only")

Keltner Worm Strategy [PrismBot] [Lite]Included in this Keltner Worm Lite Strategy:
✔️ Tweak a multitude of specific settings (MA lengths, R:R, SL distance etc)
✔️ Enable advanced setup filters
✔️ Use money management and risk calculations
✔️ Draw trade info directly to chart (eg. SL size in percent, win rate etc)
✔️ Use various filters (eg. time filter, date filter, MA slope angle etc)
✔️ Manage risk per position when auto-trading forex through AutoView
✔️ Choose from various alert conditions!
✔️ Sync to any bot or algorithmic trading system
Some details about this strategy:
- it incorporates 2 strategies - Keltner Re-entry and Baseline MA Crossing
- it uses a take profit and stop loss level fixed
- there are up to 6 allowable "worms"
- the worm multipliers are exponential, so a value of 2 will mean that the 6th worm is multiplied by 6
- you can multiply the offset or the Keltner Channel default values
- You can enable alerts for order entry, take profit, and stop loss values
- You can easily enable and disable strategies using the checkbox.
- This strategy incorporates a risk to reward system where the user can select between ATR and Percent based stop losses and take profit targets. This means that the user has much better control over money management when utilizing this strategy and it doesn't require you to babysit the strategy to ensure it's entering and existing strategies in an ideal place.

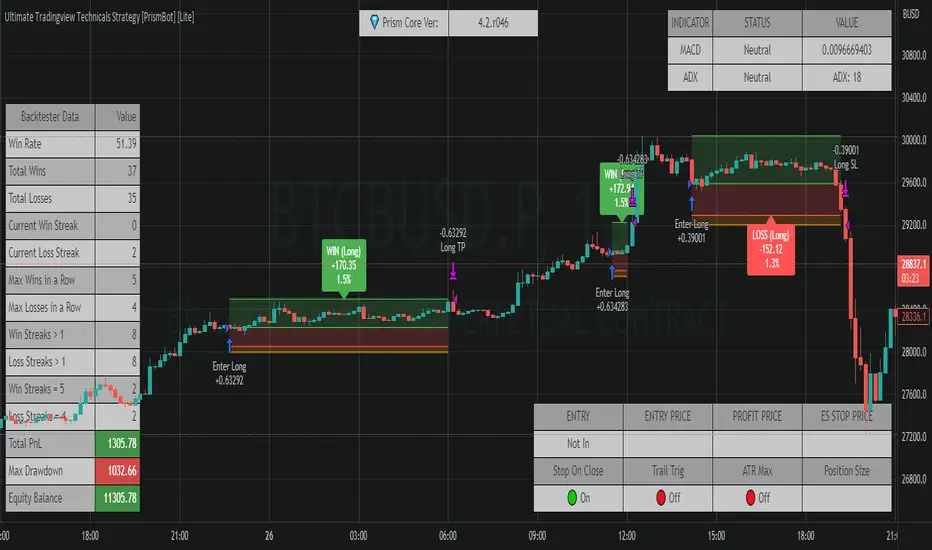
Ultimate Tradingview Technicals Strategy [PrismBot] [Lite]Included in this builder:
MACD
RSI
Tradingview Technical Analysis
Ichimoku
Global Trend Filter
Pullback Filter
Our most robust strategy to date with MACD , RSI , and many other basic strategies included as well as additional filters and alert options.
It is an advanced trading strategy built with the intent to make it easy for anyone to begin trading, but also avoid too much complication of strategy concepts.
For instance, you can change the MACD settings to be "more sensitive" by using a simple dropdown menu, and adjust which strategy you are employing with the MACD on the fly with another.
You can easily enable and disable strategies using the checkbox.
The strategy demo results use 100% equity per trade as an example - the reason for this is that the stop loss is set to 1%, so each trade is risking 1% (give or take slippage). Slippage is set to 5 ticks, and a 0.04% commission (Binance average for market and limit orders)
This strategy incorporates a risk to reward system where the user can select between ATR and Percent based stop losses and take profit targets. This means that the user has much better control over money management when utilizing this strategy and it doesn't require you to babysit the strategy to ensure it's entering and existing strategies in an ideal place.
The status box shows the current state of the various strategies and their values. A red circle indicates the filter / strategy is not valid for entry yet. A green circle indicates that filter / strategy is valid for entry. When all selected strategies are valid simultaneously, the next bar will trigger an entry signal.
If you have any questions about this strategy, please leave them in the comments below, or DM for more details. Thanks!
Additional features in this lite strategy:
✔️ Tweak a multitude of specific settings (MA lengths, R:R, SL distance etc)
✔️ Use money management and risk calculations
✔️ Draw trade info directly to chart (eg. SL size in percent, win rate etc)
✔️ Use various filters (eg. time filter, date filter etc)
✔️ Manage risk per position
✔️ Sync to any bot or algorithmic trading system
SMA-Extendido-Estrategia por NeilDescription:
Strategy that identifies entry and exit operations, using 3 moving averages and 5 strategies. New strategies are implemented such as the prediction of closing operations, independent of the events that justify entry operations.
How does it work:
1) Long strategy: if SMA5 crosses up to SMA200 and SMA200 is bullish, a buy operation begins, if SMA5 crosses down to SMA200 and SMA200 is bearish, a sale begins.
2) Short strategy with smooth filtering of operations: if SMA5 crosses up to SMA20 and SMA20 is bullish and (SMA5 are above SMA200) a buy operation is initiated. If SMA5 crosses down to SMA20 and SMA20 is bearish and (SMA5 are below SMA200) a sell trade is initiated
3) Short strategy with strong filtering of operations: if SMA5 crosses up to SMA20 and SMA20 is bullish and (SMA5 and SMA20 are above SMA200 and SMA200 is bullish) a buy is initiated, in other words, buy operations occur only if SMA5 and SMA20 are above SMA200; if SMA5 crosses down to SMA20 and SMA20 is bearish and (SMA5 and SMA20 are below SMA200 and SMA200 is bearish) a sell is initiated, that is, sell operations occur only if SMA5 and SMA20 are below SMA200
4) Short strategy without filtering operations: if SMA5 crosses up to SMA20 and SMA20 is bullish, a buy is initiated (the location of MA200 does not matter). If SMA5 crosses down to SMA20 and SMA20 is bearish, a sell is initiated (it does not matter where the MA200 is located)
5) Prediction of closing operations: the algorithm evaluates potential closing operations differently and considers the following rules: If there is an active buy trade and SMA5 crosses down to SMA20, we close the current buy (the location of the SMA200 does not matter). If there is an active sell trade and SMA5 crosses up to SMA20, we close the sale in progress (the location of the SMA200 does not matter)
How to use it:
Press the "Indicators" option, go to the "Public Librarian" segment, write the name "SMA-Extendido-Estrategia por Neil", double-click on the record in question and you will have it added in your work panel, now, just It remains to be used to identify the inputs and outputs and you can do it visually or by defining the automatic notification alerts.

Hull Crossover Strategy no TP or SLWhat is it?
A simple yet effective strategy ran on the 30m chart.
This is a basic idea that can be expanded on using different indicator to either add signals or filter out certain bad signals!
The strategy consists of 1 fast moving average and 1 slow moving average.
Both of these moving averages are the Hull Moving Average
What is the Hull Moving Average?
The Hull Moving Average ( HMA ) is a directional trend indicator.
It captures the current market conditions and uses recent price action to determine if conditions are bullish or bearish relative to historical data.
The Hull is different from traditional trend indicators like the EMA and the SMA .
It is designed to reduce the lag often associated with other MAs by providing a faster signal on a smoother visual plane.
How it works?
When the fast HMA crosses over the slow HMA , we initiate a long signal, and
when the fast HMA crosses under the slow HMA , we initiate a short signal.
Conclusion
The power of simplicity is what makes this such a great core to use to build onto making something even better!
The results were optimised to suit the most common market conditions seen today.
******** Not financial advice! ********

[Joy] Aladdin Long Trading Strategy 1.0.0 AlphaAladdin's Long trading strategy is to test out Aladdin for long trades only
This strategy is mainly used to test whether Aladdin is suitable for a coin/stocks/futures or for any trading. The profitability, average drawdown, average profits, etc are used by me to decide whether to use it for trading.
What is Aladdin and what does it do?
Using the volume and gradual flow of non-interrupted data (wicks and body of the candles), it tries to detect the macro condition of the market so that one may know in which direction the market is flowing.
* Bearish / Sell sign: On the candle's close, I open a short position
* Bullish sign: On the candle's close, I open a long position
* I take at least 50% profit when the indicator indicates to do so. One can configure that value as desired from the configuration depending on one's risk/money management. I might even convert some portion of the position into stable coins.
FAQ
Q: Does it use some EMA /MA/etc.? Does it use any indicator with tweaked settings?
Answer: No.
Q: What does it mostly depend on?
Answer: Volume and gradual flow of non-interrupted data. The logic depends purely on volume , price bars and the wicks.
Q: Does it work with all coins, stocks, futures, instruments?
Answer: I prefer to use the exchange with the best possible data. Then backtest out to find the best possible timeframe, stop loss and target all derived from this script data.
Q: Can you make it free or make it open source?
Answer: There is no free lunch in this world. I will never reveal or share the source code!
Q: Do you provide ongoing support for the indicator?
Answer: Yes, as long as I can, I will continue updating the indicator
Q: Are the bullish /buy & the bearish/sell markers automatic?
Answer: I have no control over the markers. It is driven purely by logic from the script.
Q: Is this financial advice?
Answer: This is not financial advice. I do not guarantee any profit or loss. I am not responsible for any of your losses or profits. My indicators do not assure profit or loss. It also does not auto-open or auto-close a trade.
Assumptions:
Only long trades are opened and closed. No short trades.
Starting Capital: $20,000
Order Size: 20% of Capital
Data used: Whatever data is available from 2011 till today on Trading view
Findings:
INDEX: BTCUSD 83% profitability using 2day tf
54 closed trades
Profit factor: 16
Sortino Ratio: 5.2
Average Winning Trade: 30%
Average Losing Trade: 9.12%
Largest Winning Trade: 1218%
Largest Losing Trade: 20.25%
Below are the profitability rate for the timeframe and the coins listed as found by running the trading strategy over the following as of today (Aug 1st 2021 12:40 pm Sydney Time).
⚜️ INDEX:BTCUSD 83% using 2day tf
⚜️INDEX:ETHUSD 80% using 1day tf
⚜️FTTUSD 81% using 2day tf
⚜️SRMUSD 71% using 1day tf
⚜️ADAUSDT 81% using 2day tf
⚜️ALGOUSD > 90% using 2day tf
⚜️ALTPERP 81% using 2day tf
⚜️AVAXUSDT 75% using 1day tf
⚜️BANDUSD > 90% using 2day tf
⚜️BCHUSD 82% using 2day tf
⚜️BNBUSD 79% using 1day tf
⚜️BNBUSD 85% using 2day tf
⚜️CHZUSD 71% using 1day tf
⚜️COMPUSD 81% using 1day tf
⚜️DOGEUSD 77% using 1day tf
⚜️EXCHPERP 83% using 1day tf
⚜️FILUSD > 90% using 1day tf
⚜️FTMUSD 70% using 2day tf
⚜️HTUSDT 75% using 2day tf
⚜️KINUSD >90% using 2day tf
⚜️LINKPERP 85% using 2day tf
⚜️LTCUSD 80% using 2day tf
⚜️MATICUSD 77% using 2day tf
⚜️NEOUSD 80% using 1day tf
⚜️NEXOUSD > 90% using 1day tf
⚜️OKBUSD 71% using 1day tf
⚜️OMGUSD 75% using 1day tf
⚜️RSRUSD 87% using 1day tf
⚜️RUNEUSD > 90% using 1day tf
⚜️SHITPERP > 90% using 1day tf
⚜️SOLUSD 84% using 1day tf
⚜️SUSHIUSD 71% using 1day tf
⚜️THETAUSD > 90% using 2day tf
⚜️UNIPERP 83% using 1day tf
⚜️VERTPERP > 90% using 1day tf
⚜️XAUUSD 63% using 2day tf
⚜️XTZUSD 83% using 2day tf
⚜️ZECUSD 72% using 2day tf
Disclaimer:
No one knows what will happen in the future. DYOR and decide on your own conditions. Do realize that neither I nor my indicator can guarantee any profit or loss. And there is no assurance that any trade will ever result in any profit. It is not financial advice.

HYSTERIAN BIST:SISE TRADE ALGORITHMThis strategy is using 5 minute charts and relative price movement in that period of time and determines optimum entry levels.
This strategy optimized ONLY FOR BIST:SISE stock futures because of its unique characteristics.
Strategy needs minimum 50000TRY account balance on Futures account and opens 100 lot SISE1! (Current contract in Front) Buy order when criterias met and TP or stop when criterias triggered. No pyramiding. One position at a time.
Commission used in strategy is 0.15 TRY per lot which i currently have in my real account.
Backtest results shows that strategy has an impressive %80 hit rate and above %40 percent profit in total of 81 positions. Max drawdown is below %6 percent.
You can use more position size if you have a bigger account. For example if you have 100000TRY balance in your trading account, you can set position size for 200 lot.
Brief summary in Turkish:
SISE hissesine özel tasarlanmış bir koddur. VIOP'ta kullanılır.
Hem yükselen hem düşen piyasada , sadece LONG yönlü işlem yapar. İşlemlerin yaklaşık %80 başarı oranı vardır. 1 yıllık backtest sonuçları yaklaşık %40 portföy büyümesine işaret etmektedir. Maksimum geri çekilme ise %6'nın altında olmuştur.
Her işlem 100 kontrat ile açılır, kapanana kadar yeni işlem açılmaz. 50 bin liralık bir VIOP hesabı ile kullanılması planlanmıştır.
Hesap büyüklüğüne bağlı olarak lot miktarı büyütülebilir. Yani viop hesabınız 100 bin TL ise, 200 lot ile işlem yapabilirsiniz.
5 dakikalık grafiklerde kullanılmalıdır, fiyatın o zaman dilimindeki relatif hareketlerine göre optimum giriş seviyesinde pozisyon açar. Stop ve TP seviyeleri koda gömülüdür ve optimize edilmiştir.
Lot başına 0.15 TRY komisyon tanımlanmıştır, gerçek hesabımdaki komisyon oranıdır.

Double Bollinger StrategyFrom "Bitcoin Trading Strategies: Algorithmic Trading Strategies For Bitcoin And Cryptocurrency That Work" by David Hanson.
*Works better with 1hr time frame and some input optimisations.
"Double Bollinger Band Scalping System
Recommended Timeframe: 1 minute or 5 minute *
Required Indicators:
// - RSI with a length of 14 (default settings)
// - Bollinger band #1 settings: Length = 50, stDev = 1 Hide the basis/middle line (basis line not needed for this strategy)
Note: This is the slower bollinger band in the directions
// - Bollinger band #2 settings: Length 20, stDev = 1 Hide the basis/middle line (basis line not needed for this strategy)
Note: This is the faster bollinger band in the directions
Enter Long/Buy Trade When:
// - RSI is above the level 50
// - A candle closes above the top of the faster bollinger band
Enter a long when a candle then closes above the top of the slower bollinger band, and price is above the top of both bands
Place a stop loss under the low of the entry candle Example of a long trade using this strategy
Exit Long Trade When: A candle closes below the top band of the fast bollinger band
Enter Short/Sell Trade When:
// - RSI is below the level 50
// - A candle closes below the bottom of the faster bollinger band
Enter a short when a candle then closes below the bottom of the slower bollinger band, and price is below both bands
Place a stop loss above the high of the entry candle Example of a short trade using this strategy
Exit Short Trade When: Price closes inside the bottom of the faster bollinger band"

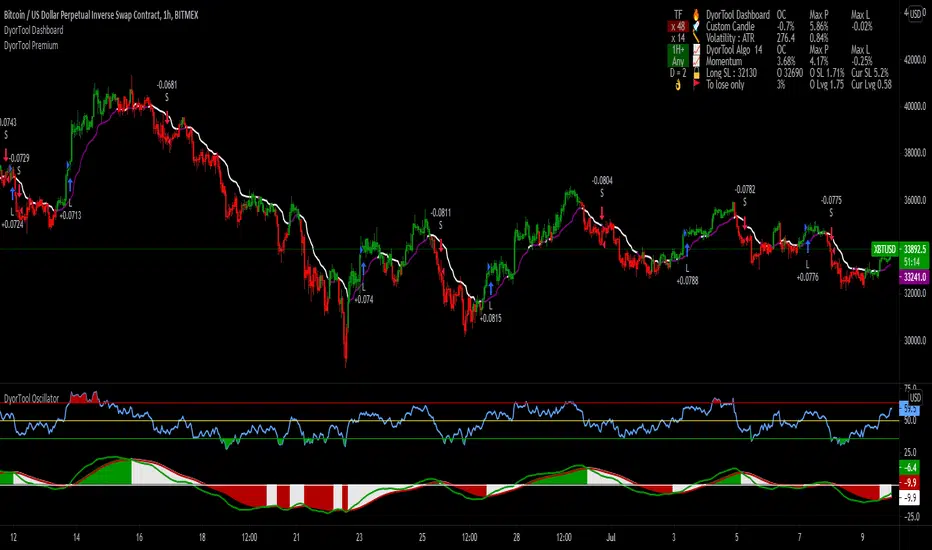
DyorTool PremiumWhat is the DyorTool Suite?
It is a toolkit that helps the trader to trade the market emotionless, under any condition.
This package is made of 3 scripts :
DyorTool Premium
DyorTool Oscillator
DyorTool Dashboard
What indicators are in these scripts?
DyorTool Premium
DyorTool Algo which gives buy and sell signals : 4 setups. The stats shown in the picture is set with a leverage of 0.4 on each trade with the commission of Binance ( without reduction ).
Range : 4 setups
Ribbon : 4 setups
Aggressiv Scalping : Trend Following - low UT : 2 setups
EVWMA : 4 setups
Ping Pong scalping : 4 setups
Support Line : 4 setups
DyorTool Oscillator
DyorTool RSI : 8 setups
DyorTool Oscillator : 8 setups
Smart candle color : Filter noise of the market
DyorTool Dashboard
Allows the user to feel the market sentiment with a custom candle
Measure the volatility of the market
Show DyorTool Algo trend
Show the momentum trend and measure his evolution.
Smart Stop Loss and Leverage calculation in order to not get in a trade if you are late, or to protect your capital.
All these indicators allow users to :
Trade the market easier, within a clearly defined framework - range.
Detect macro trend and the nearby momentum
Get early in a trade by entering in a trade with one of the 42 setups explained.
Have realistic target profit
Protect your capital with a smart stop loss and calculate the leverage for a defined stop loss
Detect if the market is with or against you so you are not holding more than you should.
This package is unique in its kind and it is complete. You can either do scalping or day-trading with it.
There are many different indicators in it. And a formation is given to explain in detail each indicator. This formation is easy to understand.
As you saw, each indicator has its own setups. These setups are explained one by one, under what condition you can enter in a trade, how to do it, where to exit, what to understand about the market next.
There is no interpretation possible. You are either in a setup or in a waiting zone.
These indicators are self-sufficient. You don't have to use all of them, and not at the same time. You use the ones which fit you better.
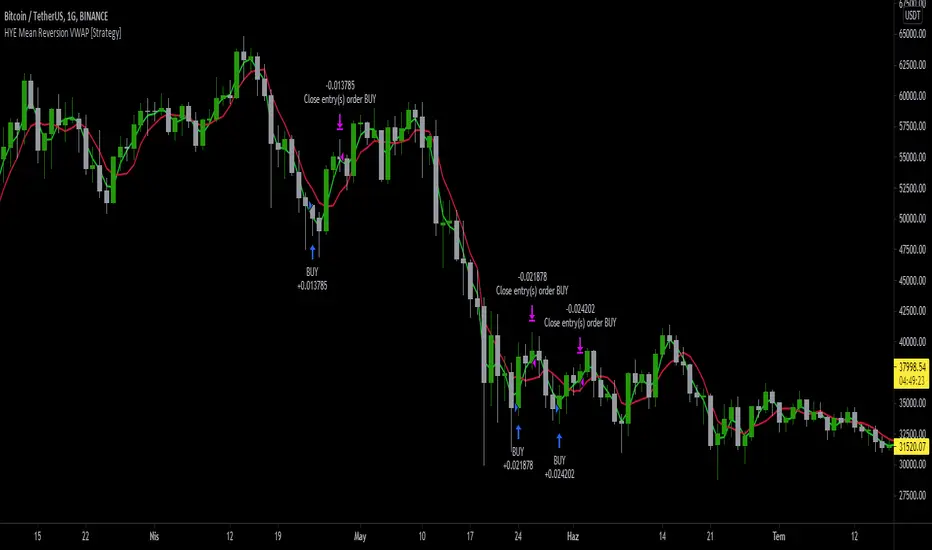
HYE Mean Reversion VWAP [Strategy]An RSI filtered version of PJ Sutherland's Jaws Mean Reversion algorithm using volume weighted average price (VWAP) instead of simple moving average (SMA).
"Long" on the close when;
1-) 2 period VWAP closes 3% or more below the 5 period VWAP ,
2-) 5 period exponential average of the 2 period RSI is below 30.
"Exit Long" on the close when;
1-) 2 period VWAP closes above the 5 period VWAP.
"Short" on the close when;
1-) 2 period VWAP closes 3% or more above the 5 period VWAP ,
2-) 5 period exponential average of the 2 period RSI is above 70.
"Exit Short" on the close when;
1-) 2 period VWAP closes below the 5 period VWAP.
*** You can change the needed percentage for long and short trades, periods of VWAPs and RSI levels.
*** You can select the trend direction: "Long Only" , "Short Only" or "Both". Default is "Long Only".
I used the "VWAP with period" indicator code of @neolao. Special thanks to @neolao.
Indicator Link:
HYE Mean Reversion SMA [Strategy]An RSI filtered version of PJ Sutherland's Jaws Mean Reversion algorithm.
"Long" on the close when;
1-) 2 period simple moving average closes 3% or more below the 5 period simple moving average,
2-) 5 period exponential average of the 2 period RSI is below 30.
"Exit Long" on the close when;
1-) 2 period simple moving average closes above the 5 period moving average.
"Short" on the close when;
1-) 2 period simple moving average closes 3% or more above the 5 period simple moving average,
2-) 5 period exponential average of the 2 period RSI is above 70.
"Exit Short" on the close when;
1-) 2 period simple moving average closes below the 5 period moving average.
*** You can change the needed percentage for long and short trades, periods of simple moving averages and RSI levels.
*** You can select the trend direction: "Long Only" , "Short Only" or "Both". Default is "Long Only".

5MA_X_LThis is a 5 day moving average crossing long strategy in 10 min. chart, used in short term momentum trading strategy.
Momentum trading Strategy: When S&P 500 index is at up trend (or above 60 sma ), buy 10+ stocks in top 20% stock RS ranking at equal weight using this MA5X_L strategy. Change stocks when any stock exited by algorithm.
Back test start since 2020/7/1, each long entry for condition 1 is $30000, condition 2 is $20000, with max of 2 long positions.
Setup: 10 minutes chart
Buy condition 1) 3 wma cross up 195 wma (5day) 2) 3wma > 78wma > 195wma UP Trend Arrangement (UTA)
Exit condition 1) 3 wma cross under 195 wma 2) position profit > 20% and 3 wma cross under 6 ATRs line (green)

How to use Leverage and Margin in PineScriptEn route to being absolutely the best and most complete trading platform out there, TradingView has just closed 2 gaps in their PineScript language.
It is now possible to create and backtest a strategy for trading with leverage.
Backtester now produces Margin Calls - so recognizes mid-trade drawdown and if it is too big for the broker to maintain your trade, some part of if will be instantly closed.
New additions were announced in official blogpost , but it lacked code examples, so I have decided to publish this script. Having said that - this is purely educational stuff.
█ LEVERAGE
Let's start with the Leverage. I will discuss this assuming we are always entering trades with some percentage of our equity balance (default_qty_type = strategy.percent_of_equity), not fixed order quantity.
If you want to trade with 1:1 leverage (so no leverage) and enter a trade with all money in your trading account, then first line of your strategy script must include this parameter:
default_qty_value = 100 // which stands for 100%
Now, if you want to trade with 30:1 leverage, you need to multipy the quantity by 30x, so you'd get 30 x 100 = 3000:
default_qty_value = 3000 // which stands for 3000%
And you can play around with this value as you wish, so if you want to enter each trade with 10% equity on 15:1 leverage you'd get default_qty_value = 150.
That's easy. Of course you can modify this quantity value not only in the script, but also afterwards in Script Settings popup, "Properties" tab.
█ MARGIN
Second newly released feature is Margin calculation together with Margin Calls. If the market goes against your trades and your trading account cannot maintain mid-trade drawdown - those trades will be closed in full or partly. Also, if your trading account cannot afford to open more trades (pyramiding those trades), Margin mechanism will prevent them from being entered.
I will not go into details about how Margin calculation works, it was all explainged in above mentioned blogpost and documentation .
All you need to do is to add two parameters to the opening line of your script:
margin_long = 1./30*50, margin_short = 1./30*50
Whereas "30" is a leverage scale as in 30:1, and "50" stands for 50% of Margin required by your broker. Personally the Required Margin number I've met most often is 50%, so I'm using value 50 here, but there are literally 1000+ brokers in this world and this is individual decision by each of them, so you'd better ask yourself.
--------------------
Please note, that if you ever encounter a strategy which triggers Margin Call at least once, then it is probably a very bad strategy. Margin Call is a last resort, last security measure - all the risks should be calculated by the strategy algorithm before it is ever hit. So if you see a Margin Call being triggred, then something is wrong with risk management of the strategy. Therefore - don't use it!

HMA_ATR StrategyATR with HMA experimental minimalist bot for ETHBTC .
A strategy for use by Automated Algorithm systems.
Different from normal ATR as it uses HMA for smoothing.
Example settings result shown here on chart include commission 0.5%

Dankland Playground Moneymaker - V2“version 2” of my playground bot script. Its essentially a powerhouse suite of strategies. Although it is similar to the previous script, it nets different results as sections have been changed. Such as the somewhat reluctant removal of the Chande Momentum... The RSIs have also been updated, this was one of the main changes. RSIS now include a Moving Average cross of RSI to generate signals above and below the given thresholds instead of simply on crossing a threshold. This should give greater functionality overall. Most functions including Moving Averages have been updated to include a wider range of kinds of moving averages. This includes not just the moving average cross, but MACD and RSIs as well. I tried to perform the same upgrade on the %B, Stochastics and SMI, but hit the unpacked code limit of 60,000 lines... So, more “versions” will have to come for future “upgrades”, with the recognition that there will be cases where the old, “downgraded” versions may perform better and that some people (like myself) may continue to use them on some markets until I/we devise superior settings on the new ones for said markets. For instance, instead of replacing my 1 hr BTCUSD bot (where I used the now deleted Chande to pretty pleasing affect...) I made a new one for LINKUSD 10 min so I can have both running for now and work on replacing the BTCUSD later.
How it works basically is this... you have 16 oscillators which can all be used as independently as you wish. They can be split up into different groups or ran all together.
When in separate groups they should not be able to sell eachothers positions without triggering a full stop loss by turning the Independence/Stop All switches on. Every single oscillator has its own entry and exit position sizing which can be stated as either a percent of balance or a flat amount of contracts (or both combined). Each oscillator has a minimum amount of profit you can tell it to sell it, which is calculated from the average cost of your current position, which does include all groups. This works out to help you average out better entry and exit prices, essentially a method of DCAing.
You can set the minimum sale amount, which is to keep it from placing orders below your exchanges minimum dollar trade cost.
All this functionality combined also ensures more accurate back tests by ensuring that the script simply cannot spend money it doesn't see as in the balance, whereas other scripts will use a percentage of equity, and once 100% of your equity is in BTC for instance, it will keep buying more BTC for free and thus spoof up backtest numbers. If you look through the strategies here, many people claim to have amazing scripts and then you look into it and this is happening and skewing their numbers. These people are either very ignorant or what they made or scam artists and trolls in my opinion.
This version also includes On Bar Close switches for each oscillator. When switched on, signals are only allowed to generate on Bar Close. This helps to prevent retriggering from live signals, which when you are running this many oscillators, will become a problem! However, in most cases, you do not need to generate signals intrabar, as backtests will show, ignoring intrabar buys and sells (intrabar stop losses can still be very important though!) won't exactly keep you from high profitability strategies, but rather, allowing elements of chaos from live indicators moving up and down intrabar will, in fact, drift your actual results further and further from the backtest. You want an accurate backtest though. So choose wisely when you turn these off and you will do better.
The included oscillators are as follows:
NO MORE Chande Momentum cross – REMOVED – I was hitting PINE code limits here so I had to make choices and this one simply had to go. Begone!
Moving Average Cross
MACD cross
%B Bollinger cross
Stochastic cross + region filter
Stochastic RSI cross + region filter
SMII cross and region filter
Three RMIs
Know-Sure-Thing line-cross
Coppock Curve line-cross
TRIX line-cross
RSI of MA w/ MA cross
RSI of MA of KST w/ MA cross
RSI of MA of Coppock Curve w/ MA cross
RSI of MA of Trix w/ MA cross
So the idea is that this is essentially multiple strategies combined into one backtestable house. Balance is calculated for all position sizes in order to try to prevent false entries that plague so many scripts (IE, you set pyramiding to 2, each buy $1000, initial balance $1000, and yet it buys two orders off the bat for $2000 total and nets 400% profit because the second was considered free, happens on 90+% of scripts on Tradingview if you aren't very very careful!)
You tune each indicator and position size them so that they work together as well as you can and in doing so you are able to create a single backtest that is capable of running a bot, essentially, between multiple strategies - you can run a slower Moving Average cross, a faster SMI cross or MACD , or Bollinger that grabs big moves only, all the while having MACD trade small bonuses along the way. This way you can weight the Risk to Reward of each against eachother.
I will not try to claim this is something you can open and with no work have the best bot on the planet. This scripts intention is to take a lot of relatively common trading strategies and combine them under on roof with some risk management and the ability to weigh each against eachother.
If you are looking for a super advanced singular algorithm that tries to capture every peak and valley exactly on the dot, this is not for you. If you are looking for a tool with a high level of customizability, with a publisher who intends to update it to the best of his ability in accordance to seeking to make the best product that I personally can make for both myself and the community (because I will be using this myself of course!) that was specifically designed with the intention of performing well in spot markets by averaging low entry costs and high exit costs, this is for you! That is the exact intention here. It can certainly work with margin, but you will have to take extra care in setting your stop losses. I intend to make a version capable of going short which will be included as part of the package. It may take some work to keep all of the risk management working as well for shorts though. There will be more scripts added to the “package” as I hit the limit on this one a few times and have had to keep some ideas out already.
The current backtest shown is hand-optimized by myself for Link /USD 10min market (Binance US – shouldn't need much work to fit to other exchange markets) with multiple stop losses.

Stochastic TrendDear community,
I've made another simple trading bot for you to use. This bot is based on the Stochastic Oscillator. It only produces long trades currently.
I changed the oscillation period to a much longer one, which in turn creates opportunities to trade long term trends.
The bot goes long when the Entry lines is crossed from below and it will close its long position once the Exit line has been crossed from above.

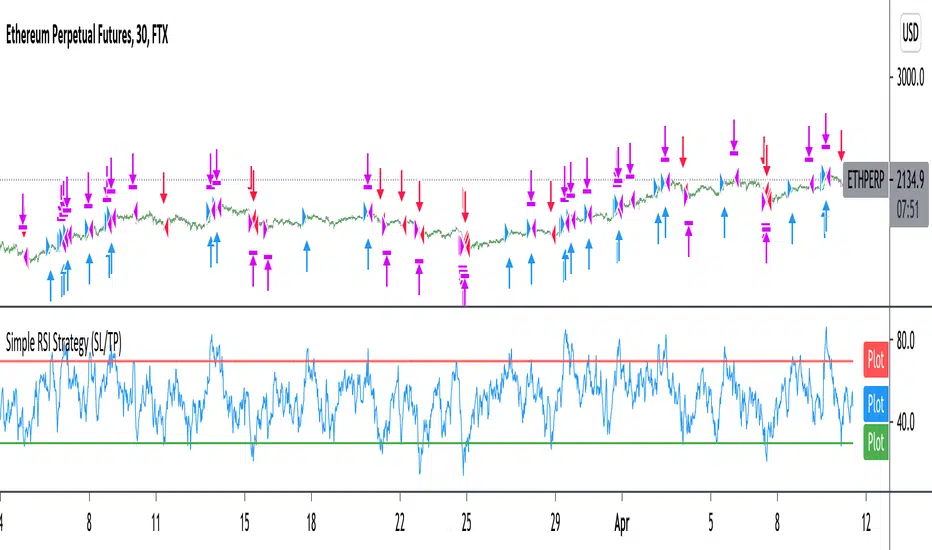
Improved simple RSI Buy/Sell at a level (SL/TP)Improved Simple Strategy based on RSI, using overbought or oversold levels.
Backtest: ETHPERP (FTX) - 30m
Set STOP LOSS and GET PROFIT as a percentage (2% and 10% by default).
If strategy.position_size != 0 algorithm convert percentages into points and set stop loss and take profit limit orders.
Fibonacci DCA TrendThis bot makes use of an algorithm which detects new heights and places limit orders according to the Fibonacci retracement theory. By placing limit orders under the current price, the bot allows itself to catch smaller and larger dips. This is also known as “Dollar-Cost-Averaging”, DCA in short. This bot is ideal for bull markets, both on crypto and stock indices.
The green lines are the limit orders. As soon as the price touches the limit order, a position is entered.
The settings of the back test as follows:
starting capital = 100k
leverage = 1
commission = 0.2%
Equity per trade = 5%, a realistic investment strategy when trading 2-3 assets with this bot.
It’s advised to trade this bot with futures for potential leverage. On time frames lower than H1 I’d use 2x-3x leverage for better results, especially in trending markets. On larger time frames I wouldn’t use any leverage.
This bot has very strong results on a multitude of assets. The best results are on the M15 time frame.
To give you a few ideas, this bot is tested on the assets below. All the results are very similar. You can contact me for a back-test on a specific asset. You can find the back-test results on my website.
BTC
ETH
SPX500
NAS100
The standard inputs are generally the best all-round inputs. Feel free to change the inputs to your liking.
I've also made a study-script for easy implementation on the exchange. You get that script once you get access to this bot.

RSMI have published that script not like oscillator, which in fact it is, because tradingview doesn't support dual plots in overlay=true and overlay=false. So I have decided that to show filter is better idea. Yes, it decrease potential profit on long term, but for me personally, it is much better to understand the direction of the market movement and take potential trades more seriously. Also about this script: in general based on RSI and works pretty nice on 1H timeframe. Yes, theoretically it can work on both 4H and 1D timeframes, but for this you need to change the settings that are not displayed in the inputs (I did not add them, due to the fact that they can be confusing, because I decided to add a filter). And about filter - it is one of the variations of the SuperTrend. According to House Rules, I cannot insert links here, but only if you are interested in trying this work in auto trading, you can follow the link (located even lower) and find there an algorithm with the same name.

Strategy NNFX Tester Strategy NNFX, Baseline, QQEs Fast C1, Slow C2, ATR, Volume and Exit
This is a Strategy Tester designed to work with Study (Alerts) of the same.
At time of creation based on Revision 8 of the Study.
DO NOT USE the Currency/Money Management section under settings. use the position sizing under "Inputs" - "Money Management" - "Risk per trade" which is defaulted to 2%
This has adjustable Baselines, Exits, ATR calculations, C1 and C2 are currently QQE & QQE Histo with adjustable settings but I'll include more choice of C1 & C2 as time goes on.
Find settings that work for you, then move them over to the Study version for best results.
Forward plans are to add much more options to both Alert/Strategy.
If anyone wants to collaborate or anything hit me up.

Dankland Playground DCAing multi-strategy OPThis is essentially a script that I made for myself before deciding it may be good enough for you all as well.
How it works basically is this... you have 18 oscillators which can all be used as independently as you wish. That means there are 20 groups which they can be split amongst as you choose.
When in separate groups they should not be able to sell eachothers positions without triggering a stop loss. Every single oscillator has its own position sizing and exit sizing which can be stated as either a percent of balance or a flat amount of contracts. Each oscillator has a minimum amount of profit you can tell it to sell it, which is calculated from the average cost of your current position, which does include all groups. This works out to help you average out better entry and exit prices, essentially a method of DCAing.
You can set the minimum sale amount, which is to keep it from placing orders below your exchanges minimum dollar trade cost.
The included oscillators are as follows:
Chande Momentum cross
Moving Average Cross
MACD cross
%B Bollinger cross
Stochastic cross + region filter
Stochastic RSI cross + region filter
SMII cross and region
Three RMIs
Standard RSI
LSMA-smoothed RSI
Know Sure Thing
RSI of KST
Coppock Curve
RSI of Curve
PPO
RSI of PPO
Trix
RSI of Trix
So the idea is that this is essentially multiple strategies combined into one backtestable house. Balance is calculated for all position sizes in order to try to prevent false entries that plague so many scripts (IE, you set pyramiding to 2, each buy $1000, initial balance $1000, and yet it buys two orders off the bat for $2000 total and nets 400% profit because the second was considered free)/
You tune each side and position size them so that they work together as well as you can and in doing so you are able to create a single backtest that is capable of running a bot, essentially, between multiple strategies - you can run a slower Moving Average cross, a faster SMI cross or MACD, or Bollinger that grabs big moves only, all the while having MACD trade small bonuses along the way. This way you can weight the Risk to Reward of each against eachother.
I will not try to claim this is something you can open and with no work have the best bot on the planet. This scripts intention is to take a lot of relatively common trading strategies and combine them under on roof with some risk management and the ability to weigh each against eachother.
If you are looking for a super advanced singular algorithm that tries to capture every peak and valley exactly on the dot, this is not for you. If you are looking for a tool with a high level of customizability, with a publisher who intends to update it to the best of his ability in accordance to seeking to make the best product that I personally can make for both myself and the community (because I will be using this myself of course!) that was specifically designed with the intention of performing well in spot markets by averaging low entry costs and high exit costs, this is for you! That is the exact intention here.
I do not trade margin currently, I trade spot. I am sure this script can be tuned to work on margin but this is not my intention or area so if this is you and there is something you need for margin specifically implemented, ask, because I likely don't know what you need yet.
The current backtest shown is hand-optimized by myself for BTC/USD 1hr market with NO stop loss enabled and all sales weighed to be around 0% minimum profit from the total average entry cost.
I chose to run it myself with no stop losses because Bitcoin is so bullish to me. The stop losses can still be very profitable, but not 1495% net profit. This style of automation is not for everyone as when running with no stop loss and the requirement every sale is somewhat profitable, or at least no very noticeable loss, you wind up relying on yourself to manually stop out if things crash too much and the bot has to stop trading to wait for market to go back up. The thing to do here if you are playing without a stop loss is to have your own alerts set at your fear level, a % drop in a period of time or something like that, and when you reach that point I would consider resetting the bot so it continues to take trades. I personally will accept a temporary drop in USD as long as I can keep my BTC holdings up overall as the goal should always be to have as many BTC as possible by the start and end of the bull run.

NIKI MSS BANKNIFTYThis is the strategy version of my old indicator NIKI BANKIFTY. It is more suitable for day trading with a 5 min chart. It is more profitable in BANKNIFTY future. It is based on multiple Supertrend, moving average, Donchain channel, and linear regression. The background color indicates the main trend and the color of the candle represents a short-term trend. The label with TA and SL represents more profitable entry positions. The label RE: LE and RE: SE stands for re-entry positions or signals with less accuracy. Consider the direction of the linear regression line to take trades on re-entry positions. The yellow candle indicates the entry and the blue candle represents the target or stop-loss.
The backtest results are based on BANKNIFTY last year's data. It has an initial capital of 100000 and the size of the lot is 1. The target is 0.3% and stop-loss is 1.5%. It exactly not following the stop loss, the trade will exit based on the Donchain channel breakout. It appears on the chart as a blue candle. The commission paid is 20 cash per trade and the slippage is 5 ticks per trade. Some of the Indian broker's commission is only 10 cash per trade. Adjust the commission as per your broker. Trades are conducted based on the intraday time in India set from 9.20 am to 2.25 pm. All positions will get square off at 3.00 pm. It will execute a maximum of 4 trades per day. All other parameters are suitable for Robo trading with Indian stock brokers.
Contact us using the link given below to obtain access to this indicator.
