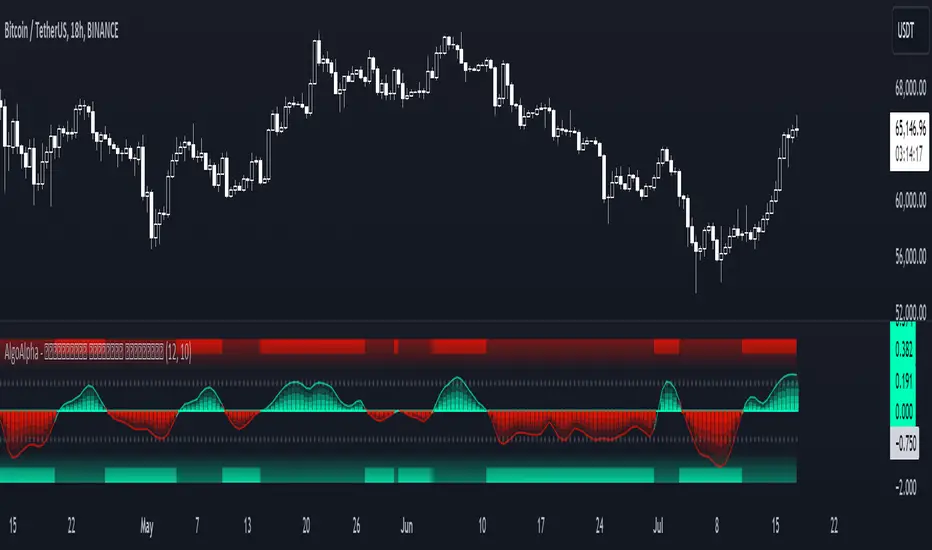
Rolling Price Activity Heatmap [AlgoAlpha]📈 Rolling Price Activity Heatmap 🔥
Enhance your trading experience with the Rolling Price Activity Heatmap , designed by AlgoAlpha to provide a dynamic view of price activity over a rolling lookback period. This indicator overlays a heatmap on your chart, highlighting areas of significant price activity, allowing traders to spot key price levels at a glance.
🌟 Key Features
📊 Rolling Heatmap: Visualize historical price activity intensity over a user-defined lookback period.
🔄 Customizable Lookback: Adjust the heatmap lookback period to suit your trading style.
🌫️ Transparency Filter: Fine-tune the heatmap’s transparency to filter out less significant areas.
🎨 Color Customization: Choose colors for up, down, and highlight areas to fit your chart’s theme.
🔄 Inverse Heatmap Option: Flip the heatmap to highlight less active areas if needed.
🛠 Add the Indicator: Add the Indicator to favorites. Customize settings like lookback period, transparency filter, and colors to fit your trading style.
📊 Market Analysis: Watch for areas of high price activity indicated by the heatmap to identify potential support and resistance levels.
🔧 How it Works
This script calculates the highest and lowest prices within a specified lookback period and divides the price range into 15 segments. It counts the number of candles that fall within each segment to determine areas of high and low price activity. The script then plots the heatmap on the chart, using varying levels of transparency to indicate the strength of price activity in each segment, providing a clear visual representation of where significant trading occurs.
Stay ahead of the market with this powerful visualization tool and make informed trading decisions! 📈💼
Komut dosyalarını "algo" için ara
Efficiency Weighted OrderFlow [AlgoAlpha]Introducing the Efficiency Weighted Orderflow Indicator by AlgoAlpha! 📈✨
Elevate your trading game with our cutting-edge Efficiency Weighted Orderflow Indicator, designed to provide clear insights into market trends and potential reversals. This tool is perfect for traders seeking to understand the underlying market dynamics through efficiency-weighted volume calculations.
🌟 Key Features 🌟
✨ Smooth OrderFlow Calculation : Option to smooth order flow data for more consistent signals.
🔧 Customizable Parameters : Adjust the Order Flow Period and HMA Smoothing Length to fit your trading strategy.
🔍 Visual Clarity : Easily distinguish between bullish and bearish trends with customizable colors.
📊 Standard Deviation Normalization : Keeps order flow values normalized for better comparison across different market conditions.
🔔 Trend Reversal Alerts : Stay ahead with built-in alert conditions for significant order flow changes.
🚀 Quick Guide to Using the Efficiency Weighted Orderflow Indicator
🛠 Add the Indicator: Search for "Efficiency Weighted Orderflow " in TradingView's Indicators & Strategies. Customize settings like smoothing and order flow period to fit your trading style.
📊 Market Analysis: Watch for trend reversal alerts to capture trading opportunities by studying the behaviour of the indicator.
🔔 Alerts: Enable notifications for significant order flow changes to stay updated on market trends.
🔍 How It Works
The Efficiency Weighted Orderflow Indicator starts by calculating the efficiency of price movements using the absolute difference between the close and open prices, divided by volume. The order flow is then computed by summing these efficiency-weighted volumes over a specified period, with an option to apply Hull Moving Average (HMA) smoothing for enhanced signal stability. To ensure robust comparison, the order flow is normalized using standard deviation. The indicator plots these values as columns, with distinct colors representing bullish and bearish trends. Customizable parameters for period length and smoothing allow traders to tailor the indicator to their strategies. Additionally, visual cues and alert conditions for trend reversals and significant order flow changes keep traders informed and ready to act. This indicator improves on the Orderflow aspect of our Standardized Orderflow indicator. The Efficiency Weighted Orderflow is less susceptible to noise and is also quicker at detecting trend changes.
Moving Average Cross Probability [AlgoAlpha]Moving Average Cross Probability 📈✨
The Moving Average Cross Probability by AlgoAlpha calculates the probability of a cross-over or cross-under between the fast and slow values of a user defined Moving Average type before it happens, allowing users to benefit by front running the market.
✨ Key Features:
📊 Probability Histogram: Displays the Probability of MA cross in the form of a histogram.
🔄 Data Table: Displays forecast information for quick analysis.
🎨 Customizable MAs: Choose from various moving averages and customize their length.
🚀 How to Use:
🛠 Add Indicator: Add the indicator to favorites, and customize the settings to suite your trading style.
📊 Analyze Market: Watch the indicator to look for trend shifts early or for trend continuations.
🔔 Set Alerts: Get notified of bullish/bearish points.
✨ How It Works:
The Moving Average Cross Probability Indicator by AlgoAlpha determines the probability by looking at a probable range of values that the price can take in the next bar and finds out what percentage of those possibilities result in the user defined moving average crossing each other. This is done by first using the HMA to predict what the next price value will be, a standard deviation based range is then calculated. The range is divided by the user defined resolution and is split into multiple levels, each of these levels represent a possible value for price in the next bar. These possible predicted values are used to calculate the possible MA values for both the fast and slow MAs that may occur in the next bar and are then compared to see how many of those possible MA results end up crossing each other.
Stay ahead of the market with the Moving Average Cross Probability Indicator AlgoAlpha! 📈💡
Activity and Volume Orderflow Profile [AlgoAlpha]🔍 Activity and Volume Orderflow Profile 📊
🚀 Unlock the power of market order flow analysis with the Activity and Volume Orderflow Profile indicator by AlgoAlpha . This versatile tool helps you visualize and understand the dynamics of buying and selling pressure within a specified lookback period. Perfect for traders who want to dig deeper into volume-based market insights!
Key Features:
📊 Profile Type Options : Choose between "Comparison" and "Net Order Flow" to analyze market activity based on your preferred method.
🔎 Adjustable Lookback Period : Customize the lookback period to fit your trading strategy.
🎨 Flexible Appearance Settings : Toggle the display of the profile, lookback period visualization, and heatmap to suit your preferences.
🖍 Color Customization : Set your preferred colors for up and down volumes.
🕹 High Activity Highlight : Use the minimum transparency setting to highlight areas of significant activity.
Quick Guide to Using the Activity and Volume Orderflow Profile
🛠 Add the Indicator: Add the indicator to your favorites. Customize settings like profile type, lookback period, and resolution to fit your trading style.
📊 Market Analysis: Use the profile to identify areas of high buying or selling pressure. In "Comparison" mode, look for significant volume differences; in "Net Order Flow" mode, focus on net volume changes. Additionally, you can use the activity heatmap to find key levels that can act as support and resistance as price is likely to react to the zones as indicated by the heatmap.
How it Works:
The indicator operates by first gathering data on high and low prices, as well as buy and sell volumes, over a user-defined lookback period. It then calculates the maximum and minimum prices during this period and divides this range into bins based on the chosen resolution. For each bin, it computes the total volume of buy and sell orders. In "Comparison" mode, it displays side-by-side boxes representing buy and sell volumes, while in "Net Order Flow" mode, it shows the net volume difference. The indicator visually presents these profiles on the chart with customizable colors, transparency levels, and the option to display a heatmap for enhanced volume activity insights.
Maximize your trading with the Activity and Volume Orderflow Profile from AlgoAlpha! 🚀✨
Swing Failure Zones and Signals [AlgoAlpha]Elevate your trading strategy with the Swing Failure Zones and Signals indicator by AlgoAlpha! This powerful tool helps you identify potential swing failure zones, offering clear bullish and bearish signals to guide your trading decisions. 📈💡
🎨 Bullish/Bearish Color Customization : Easily set the colors for bullish and bearish signals to match your chart preferences.
🧹 Mitigated Zone Removal : Option to remove mitigated zones from the chart for a cleaner view.
🔍 Range High/Low Lookback : Adjustable lookback period for determining significant highs and lows.
🖌 Dynamic Zone Creation : Automatically draws zones based on swing failure criteria.
🔔 Alert Conditions : Set alerts for both bullish and bearish swing failure conditions to stay informed without constant monitoring.
Quick Guide to Using the Swing Failure Zones and Signals Indicator
🛠 Add the Indicator : Search for "Swing Failure Zones and Signals " in TradingView's Indicators & Strategies. Customize settings like lookback period, colors, and zone removal options to fit your trading style.
📊 Market Analysis : Watch for the appearance of the zones and the directional arrows for potential reversal signals. Use these signals to identify key market entries and exits.
🔔 Alerts : Enable alerts for bullish and bearish swing failure conditions to capture trading opportunities without constant chart monitoring.
How it works
The indicator calculates the direction and length of each candle to identify swing failure points by comparing current high and low prices with those from the lookback period. A bullish swing failure is detected when the current low is lower than the previous low and the close is higher than the previous high, while a bearish swing failure occurs when the current high is higher than the previous high and the close is lower than the previous low. Upon detection, the script creates zones on the chart to indicate these failure points and manages them by removing invalidated zones based on the user's settings. Visual signals are plotted on the chart as arrows, and alerts are set for these conditions to help traders capture potential entry opportunities efficiently.
Enhance your trading edge with this robust tool designed to spotlight critical swing failure points in the market! 💪📈
Volume Weighted Relative Strength Index (VWRSI) [AlgoAlpha]Volume Weighted Relative Strength Index 📈✨
The Volume Weighted Relative Strength Index (VWRSI) by AlgoAlpha enhances traditional RSI by incorporating volume weighting, providing a more nuanced view of market strength. It uses custom range detection to measure consolidation strength, applying dynamic scoring to highlight trend phases. The indicator includes customizable moving averages (SMA, EMA, WMA, VWMA) and color-coded visual cues for uptrends and downtrends. Additionally, it marks significant bullish and bearish trend points with symbols, making it easier to identify potential trading opportunities. This powerful tool helps traders make informed decisions by combining volume, price action, and trend analysis.
✨ Key Features :
📊 Volume-Weighted RSI : Combines RSI with volume for better accuracy.
🔄 Range Detection : Identifies consolidation phases.
🎨 Customizable MAs : Choose from various moving averages.
🔔 Alert Capabilities : Set notifications for trend points.
🚀 How to Use :
🛠 Add Indicator : Add the indicator to favorites, and customize the settings to suite your trading style.
📊 Analyze Market : Watch RSI and range score for trends.
🔔 Set Alerts : Get notified of bullish/bearish points.
✨ How It Works :
The Volume Weighted Relative Strength Index (VWRSI) combines traditional RSI with volume weighting to offer a more comprehensive view of market momentum. It calculates the RSI using the closing price, then weights it by volume to enhance the accuracy of the trend analysis. The indicator also includes a custom range detection feature that evaluates consolidation strength by dynamically scoring the RSI over a specified period. This scoring helps identify phases of strong trends and consolidations. Visual elements like color-coded trend fills and symbols for bullish and bearish points make it easier to spot key market movements and potential trading opportunities.
Stay ahead with VWRSI by AlgoAlpha! 📈💡
Donchian Trend Ranges [AlgoAlpha]🚀🔗 Donchian Trend Ranges 🔗🚀
Elevate your trading game with the Donchian Trend Ranges indicator from AlgoAlpha! 🌟📈 This advanced tool helps you visualize market trends and potential reversal points using Donchian channels, volatility measures, and average true range (ATR).
Key Features
⚙️ Customizable Parameters: Adjust the lookback period and range multiplier to fit your trading style.
🎨 Color-Coded Trends: Easily distinguish between uptrends and downtrends with customizable colors.
📊 Dynamic Channels: Visualize multiple dynamic channels based on Donchian ranges and volatility.
☁️ Trend Clouds: See market strength and weakness with upper and lower trend clouds.
🔔 Signal Alerts: Get notified of potential trend shifts and take profit points.
How to Use
🛠 Add the Indicator: Add the indicator to favorites. Customize settings such as the lookback period and range multiplier to match your trading needs.
🔍 Analyze Trends: The indicator calculates the highest and lowest prices over a specified period to create dynamic channels. It then uses standard deviation and ATR to adjust these channels for market volatility, plotting upper and lower ranges. Green bars indicate an up trend and red bars for a down trend.
🔔 Set Alerts: Enable notifications for bullish and bearish trend shifts, as well as weak and strong take profit points, ensuring you never miss an opportunity.
How it Works
The Donchian Trend Ranges indicator calculates the highest and lowest prices over a specified period to create a basis line. It creates a range around the basis based on standard deviations and the clouds' width is determined by a 14 period ATR. The basis line and bar colors changes based on whether the closing price is above or below it, indicating trends. Clouds around these lines represent market reversal zones that can be used as entry levels when used in confluence with momentum indicators, visual signals ("X" and "◆") marking strong and weak take profit points are also printed when the prices revert from the clouds towards the basis. Integrated alerts notify you of significant events like trend shifts and take profit signals, keeping you informed without constant monitoring.
Unleash the power of the Donchian Trend Ranges in your trading strategy! 🌐📈✨
Candlestick Trend Strength [AlgoAlpha]🚀🎉 Introducing the Candlestick Trend Strength by AlgoAlpha, a dynamic TradingView indicator designed to visually communicate the strength and direction of market trends right on your charts! 🕯️💪
Key Features:
🌈 Visual gauge for trend strength, color-coded for intuitive insights.
⏳ Customizable trend detection and normalization periods to match your trading strategy.
🎨 Flexible color settings for both uptrend (green) and downtrend (red).
🔔 Real-time alerts for trend reversals, helping you stay ahead of market moves.
How to Use:
🛠 Add the Indicator: Add the indicator to favorites and customize it to suit your needs.
🔍 Analyze the Trends: Monitor the color changes in the gauge and bar color to identify strengthening or weakening trends.
🔔 Set Alerts: Configure alerts to notify you of trend changes, allowing you to react swiftly to trading opportunities without constant monitoring.
Basic Logic Explained:
The "Candlestick Trend Strength" indicator calculates the trend strength score by analyzing the ratio of the candle's wick to its body, alongside the direction of the candle (up or down). It uses a normalization period to adjust the sum of the trend score into a scale from -1 to 1, which is then plotted as a color gradient gauge from red (downtrend) to green (uptrend) on the chart. This representation helps traders quickly assess whether a trend is gaining or losing strength, and it updates in real-time with each new bar, providing a highly responsive tool for technical analysis.
Embrace the power of visual trend analysis with the "Candlestick Trend Strength" by AlgoAlpha and transform your trading experience today! 🌟📈
Smart Money Interest Index [AlgoAlpha]🌟 Smart Money Interest Index by AlgoAlpha 🌟
Welcome to the innovative Smart Money Interest Index indicator, designed meticulously by AlgoAlpha to revolutionize the way you trade! 📈🧠 This indicator is engineered to decipher the activities of smart money investors relative to the less informed (dumb money) and dynamically display their dominance in the trading landscape through a sophisticated visual index. 🚀💹
🔑 Key Features:
- Smart vs. Dumb Money Analysis: Tracks and compares the movements of smart money (informed investors) and dumb money (general public) within the market to identify potential investment signals.
- Relative Strength Index (RSI) Based Ratios: Utilizes RSI for both smart and dumb money to create a ratio that indicates buying or selling pressures.
- Dynamic Normalization: Employs a long-term peak normalization over a customizable period to ensure the index remains relevant regardless of market conditions.
- Visual Thresholds and Signals: Highlights significant shifts in market dynamics with color-coded thresholds, making it easier to spot changes at a glance.
🛠 How to Use the Smart Money Interest Index:
🔹 🚀 Step 1: Adding the Indicator
- Add the indicator to your favourites.
- Customize the settings according to your analysis needs:
- `Index Period`, `Volume Flow Period`, `Normalization Period`, `High Interest Threshold`
🔹 📊 Step 2: Interpretation of the Index
- Monitor the index plot; a rising index suggests increasing smart money interest, potentially indicating a buying opportunity.
- A value above the high interest threshold (in yellow) highlights significant interest by smart money, suggesting a good time to buy.
🔹 🔔 Step 3: Setting Alerts
- Configure alerts to notify you when the index crosses above the set threshold, enabling you to capitalize on trading opportunities timely and efficiently.
📐 Basic Logic Overview:
The Smart Money Interest Index by AlgoAlpha provides a unique metric that contrasts the investment behaviors of informed (smart money) and general (dumb money) investors. Utilizing the Relative Strength Index (RSI), this indicator evaluates the trading pressure exerted by both groups over specified periods, then forms a ratio of these activities to identify dominance in buying or selling trends. For example, when we see dumb money selling and smart buying, this suggests that the conditions for buying the asset is optimal as smart money is willing to buy the dip. The outputs are normalized against the highest values observed in a user-defined term to maintain consistency through varying market conditions. When the index exceeds a certain threshold, it suggests that smart money presence is particularly strong, possibly indicating that smart money is looking to enter positions on the asset. This tool serves as a sophisticated visual guide to understanding market dynamics and making well-informed trading decisions based on the activities of market-savvy investors. Smart money activity is identified during areas of low volume and the opposite for dumb money, the indicator uses the NVI and PVI metrics as its foundation for smart and dumb money analysis.
📊 Enhance Your Trading Strategy:
Leverage the Smart Money Interest Index to gain deeper insights into market dynamics and enhance your decision-making process with a powerful, data-driven approach. Whether you're looking to identify entry points or set strategic exits, this tool is designed to provide you with the competitive edge you need in the fast-paced world of trading. 🌐✨
Transform your trading with the power of smart money analysis—start using the Smart Money Interest Index today! 🚀🔔
Volumetric Fair Value Gaps [AlgoAlpha]🎯 Introducing the Volumetric Fair Value Gaps by AlgoAlpha 🎯
Embrace the power of volume and price action with the Volumetric Fair Value Gaps (VFVG) indicator, designed meticulously by AlgoAlpha. This innovative tool enhances your charting capabilities by highlighting fair value gaps in real-time, facilitating superior market entry and exit decisions. 🚀📈
🔍 Key Features:
🔹 Fair Value Gap Detection: Utilizes price action and volume to identify significant fair value gaps, offering potential high-probability trading opportunities.
🔹 Adjustability: Customize the sensitivity with 'FVG Noise Reduction Length' and 'Noise Reduction Factor' to match the volatility and characteristics of the asset being traded.
🔹 Visual Appeal: Displays bullish gaps in a soothing Bullish Color and bearish gaps in a striking Bearish Color, making it easy to spot and analyze trends on the fly.
🔹 Overlay Feature: Plots directly on the price chart for seamless integration and analysis.
🌟 Quick Guide to Using the Volumetric Fair Value Gaps Indicator:
🛠 Add the Indicator: Add the indicator to favourites and set it up with your desired settings.
📊 Market Analysis: Watch for the appearance of colored boxes (blue for bearish, gray for bullish) which represent the fair value gaps. These are high-probability areas for reversals or continuations. FVGs with higher volume are implied to induce a stronger reaction on price.
🔔 Alerts: Set up alerts to notify you when new gaps are detected, ensuring you never miss out on potential trades!
🛠 How It Works:
The Volumetric Fair Value Gaps (VFVG) indicator identifies significant price gaps that are not just based on price action but are also substantiated by volume, which are often overlooked in typical analyses. It operates by comparing the current candle’s price range against historical averages and is calculated over a user-defined period, displayed with volume for further insights. For a gap to be recognized as significant (either bullish or bearish), it must exceed a certain size relative to these averages, which can be adjusted for sensitivity using the provided settings. Bullish gaps are identified when the current low is higher than the second previous high after surpassing the threshold, and bearish gaps are marked when the current high is below the second previous low, similarly surpassing the threshold. This dual-confirmation (volume and price deviation) approach minimizes false signals and enhances the reliability of identified gaps.
Maximize your trading strategy with the VFVG Indicator by AlgoAlpha and turn those gaps into opportunities! 🌈✨
Price Action Fractal Forecasts [AlgoAlpha]🔮 Price Action Fractal Forecasts - Unleash the Power of Historical Patterns! 🌌✨
Dive into the future with AlgoAlpha's Price Action Fractal Forecasts ! This innovative indicator utilizes the mesmerizing complexity of fractals to predict future price movements, offering traders a unique edge in the market. By analyzing historical price action and identifying repeating patterns, this tool forecasts future price trends, providing visually engaging and actionable insights.
Key Features:
🔄 Flexible Data Series Selection: Choose your preferred data series for precise analysis.
🕰 Flexible Training and Reference Data Windows: Customize the length of training data and reference periods to match your trading style.
📈 Custom Forecast Length: Adjust the forecast horizon to suit your strategic objectives.
🌈 Customizable Visual Elements: Tailor the colors of forecast deviation cones, data reference areas, and more for optimal chart readability.
🔄 Anticipatory and Repetitive Forecast Modes: Select between anticipating future trends or identifying repetitive patterns for forecasts.
🔎 Enhanced Similarity Search: Leverages correlation metrics to find the most similar historical data segments.
📊 Forecast Deviation Cone: Visualize potential price range deviations with adjustable multipliers.
🚀 Quick Guide to Maximizing Your Trading with Price Action Fractal Forecasts:
🛠 Add the Indicator: Search for "Price Action Fractal Forecasts" in TradingView's Indicators & Strategies. Customize settings according to your trading strategy.
📊 Strategic Forecasting: Monitor the forecast deviation cone and forecast directional changes for insights into potential future price movements.
🔔 Alerts for Swift Action: Set up notifications based on forecast changes to stay ahead of market movements without constant monitoring.
Behind the Magic: How It Works
The core of the Price Action Fractal Forecasts lies in its ability to compare current market behavior with historical data to unearth similar patterns. It first establishes a training data window to analyze historical prices. Within this window, it then defines a reference length to identify the most recent price action that will serve as the basis for comparison. The indicator searches through the historical data within the training window to find segments that closely match the recent price action in the reference period.
Depending on whether you choose the anticipatory or repetitive forecast mode, the indicator either looks ahead to predict future prices based on past outcomes following similar patterns or focuses on the repeating patterns within the reference period itself for forecasts. The forecast's direction can be configured to reflect the mean average of forecasted prices or the end-point relative to the start-point of the forecast, offering flexibility in how forecasts are interpreted.
To enhance the comprehensiveness and visualization, the indicator features a forecast deviation cone. This cone represents the potential range of price movements, providing a visual cue for volatility and uncertainty in the forecasted prices. The intensity of this cone can be adjusted to suit individual preferences, offering a visual guide to the level of risk and uncertainty associated with the forecasted price path.
Embrace the fractal magic of markets with AlgoAlpha's Price Action Fractal Forecasts and transform your trading today! 🌟🚀
Supertrended RSI [AlgoAlpha]🚀📈 Introducing the Supertrended RSI Indicator by AlgoAlpha!
Designed to empower your trading decisions, this innovative Pine Script™ creation marries the precision of the Relative Strength Index (RSI) with the dynamic prowess of the SuperTrend methodology. Whether you’re charting the course of cryptos, riding the waves of stock markets, or navigating the futures landscape, our SuperTrended RSI Indicator is your go-to tool for uncovering unique trend insights and crafting trading strategies. 🌟
Key Features:
🔍 Enhanced RSI Analysis: Combines the traditional RSI with a supertrend calculation for a dynamic look at market trends.
🔄 Multiple Moving Averages: Offers a selection of moving averages including SMA, HMA, EMA, and more for tailored analysis.
🎨 Customizable Visuals: Choose your own color scheme for uptrends and downtrends to match your trading dashboard.
📊 Flexible Input Settings: Tailor the indicator with customizable lengths, factors, and smoothing options.
⚡ Real-Time Alerts: Set alerts for bullish and bearish reversals to stay ahead of market movements.
Quick Guide to Using the Supertrended RSI Indicator
Maximize your trading with the Supertrended RSI by following these streamlined steps! 🚀✨
🛠 Add the Indicator: Search for "Supertrended RSI " in TradingView's Indicators & Strategies. Customize settings like RSI length, MA type, and Supertrend factors to fit your trading style.
🎨 Visual Customization: Adjust uptrend and downtrend colors for clear trend visualization.
📊 Market Analysis: Watch for the Supertrend color change for trend reversals. Use the 70 and 30 lines to spot overbought/oversold conditions.
🔔 Alerts: Enable notifications for reversal conditions to capture trading opportunities without constant chart monitoring.
How It Works:
At the core of this indicator is the combination of the Relative Strength Index (RSI) and the Supertrend framework, it does so by applying the SuperTrend on the RSI. The RSI settings can be adjusted for length and smoothing, with the option to select the data source. The Supertrend calculation takes into account a specified trend factor and the Average True Range (ATR) over a given period to determine trend direction.
Visual elements include plotting the RSI, its moving average, and the Supertrend line, with customizable colors for clarity. Overbought and oversold conditions are highlighted, and trend changes are filled with distinct colors.
🔔 Alerts: Enable alerts for crossover and crossunder events to catch every trading opportunity.
🌈 Whether you're a seasoned trader or just starting, the Supertrended RSI offers a fresh perspective on market trends. 📈
💡 Tip: Experiment with different settings to find the perfect balance for your trading style!
🔗 Explore, customize, and enhance your trading experience with the Supertrended RSI Indicator! Happy trading! 🎉
Normalised Gaussian MACD Heikin Ashi [AlgoAlpha]🌟🚀Introducing the Normalised Gaussian MACD Heikin Ashi by AlgoAlpha !
Elevate your trading game with this multipurpose indicator, crafted to pinpoint trend continuation opportunities while highlighting volatility and oversold/overbought conditions. Whether you're embarking on your trading journey or you're a seasoned market navigator, this tool is equipped with intuitive visual cues to amplify your decision-making prowess and enrich your market analysis toolkit. Let's dive into the key features, utilization strategies, and the innovative logic underpinning this indispensable trading asset.
Key Features:
🔧 Enhanced Customization : Tailor your experience with adjustable parameters including Fast Length, Slow Length, Source, Macd Smoothing Length, Signal Smoothing, and more.
🖌️ Visual Enhancements : Opt for Heikin Ashi Candles display and choose to show or hide MACD and Signal lines for a clutter-free chart.
🌈 Color Customization : Personalize your chart with selectable primary and secondary up and down colors to suit your visual preferences.
🔔 Advanced Alert System : Stay ahead with comprehensive alert conditions for market movements, including trend reversals, bullish and bearish swings.
How to Use:
Configure the Inputs : Start by customizing the indicator’s settings to match your trading style. Adjust the length parameters, source selection, and smoothing lengths to fine-tune the indicator’s sensitivity.
Interpret the Candles and Colors : Keep an eye on the Heikin Ashi Candles (if enabled) and the color shifts within the MACD Line Candles and Histogram. These visual cues are pivotal for identifying market trends.
Analyze with Flexibility : Make use of the option to display or hide the MACD and Signal lines based on your analysis requirements. This can help in focusing on the essential information without overcrowding your chart.
Utilize Alerts for Timely Decisions : Leverage the extensive alert system to get notified about potential market movements. These alerts can help you capture the right moment to enter or exit trades.
Basic Logic:
The Normalised Gaussian MACD Heikin Ashi by AlgoAlpha integrates Gaussian filters to elevate the traditional MACD indicator's efficiency, providing a more detailed analysis of market trends and momentum. This sophisticated approach reduces noise and enhances signal speed, which is crucial for identifying momentum trading opportunities.
Gaussian Filter Implementation : The core innovation lies in applying a Gaussian filter to the input price series. This mathematical technique smooths the price data, significantly reducing market noise and making trend signals clearer and more reliable. The Gaussian filter calculates a smoothed value for each data point by weighting nearby data points, with the weights decreasing as the distance from the current data point increases.
Refined MACD Calculation : The Gaussian MACD is derived from the difference between two Gaussian smoothed moving averages (fast and slow), which are then normalized to account for market volatility. This normalization process involves dividing the difference by a measure of market range (such as the high minus the low), and multiplying by a factor (usually 100) to scale the indicator appropriately.
🔑 This script is a versatile tool designed to aid in the identification of momentum and reversals, helping traders to make informed decisions based on technical analysis. Its customization options allow for a tailored analysis experience, fitting the unique needs and strategies of each trader.
Trend Continuation Signals [AlgoAlpha]Introducing the Trend Continuation Signals by AlgoAlpha 🌟🚀
Elevate your trading game with this multipurpose indicator, designed to pinpoint trend continuation opportunities as well as highlight volatility and oversold/overbought conditions. Whether you're a trading novice or a seasoned market veteran, this tool offers intuitive visual cues to boost your decision-making and enhance your market analysis. Let's explore the key features, how to use it effectively, and delve into the operational mechanics that make this tool a game-changer in your trading arsenal:
Key Features:
🔥 Advanced Trend Detection : Leverages the Hull Moving Average (HMA) for superior trend tracking as compared to other MAs, offering unique insights into market momentum.
🌈 Volatility Bands : Implements adjustable bands around the trend line, which evolve with market conditions to highlight potential trading opportunities.
⚡ Trend Continuation Signals : Identifies bullish and bearish continuation signals, equipping you with actionable signals to exploit the prevailing market trend.
🎨 Intuitive Color Coding : Employs a vibrant color scheme to distinguish between uptrends, downtrends, and neutral phases, facilitating easy interpretation of the indicator's insights.
🛠 How to Use "Trend Continuation Signals ":
🔍 Setting Up : Incorporate the indicator onto your chart and customize the indicator to suite your preferences.
👀 Reading the Signals : Pay attention to the color-coded trend lines and volatility bands. Green indicates an uptrend, red signifies a downtrend, and gray denotes a neutral market condition.
📈 Identifying Entry Points : Look for bullish (▲) and bearish (▼) continuation icons below or above the price bars as signals for potential entry points for long or short positions, respectively.
🔄 Confirmation : Validate your trades with further analysis or other indicators. The Trend Continuation Signals are most effective when complemented by other technical analysis tools or fundamental insights.
📉 Risk Management : Implement stop-loss orders in line with your risk appetite and adjust them based on the volatility bands provided by the indicator to safeguard your investments.
How It Operates:
The essence of the indicator is captured through the hull moving averages for both the primary and secondary lines, set at periods of 93 and 50, respectively, to reflect market trends and pullbacks that trigger the continuation signals every time price recovers from a detected pullback.
Volatility is quantified through the standard deviation of the midline, magnified by a factor, establishing the upper and lower trend band boundaries.
Further volatility bands are plotted around the main volatility band, providing a granular view of market volatility and potential breakout or breakdown zones.
Market trend direction is determined by comparing the HMA line's current position to its previous value, enhanced by the secondary line to identify continuation patterns.
Embrace the power of the Trend Continuation Signals to enhance your trading strategy! It is important to note that all indicators are best used in confluence with other forms of analysis, happy trading! 📊💥
MVRV Z-Score [AlgoAlpha]Introducing the ∑ MVRV Z-Score by AlgoAlpha, a dynamic and sophisticated tool designed for traders seeking to gain an edge in INDEX:BTCUSD analysis. This script employs advanced statistical techniques on Bitcoin On-Chain data to offer a deeper understanding of market conditions, focusing on valuation extremes and momentum trends. Let's explore the features and functionalities that make this tool a valuable addition to your trading arsenal.
Key Features:
🔶 Adjustable Parameters: Customize the Z score lookback length, moving average lookback length, and choose from six moving average types, tailoring the analysis to your trading style.
🔶 Heiken Ashi Compatibility: Incorporate Heiken Ashi plots to visualize market trends, adding a layer of clarity to your technical analysis.
🔶 Divergence Alerts: Detect significant bullish and bearish divergences, allowing for timely identification of potential market reversals.
🔶 Configurable Alerts: Set alerts for overbought, oversold, and divergence conditions, ensuring you never miss an opportunity.
How to Use:
1. ➡️ Parameter Selection: Start by configuring the Z-Score and moving average settings according to your analysis needs. This includes selecting the lookback period and the type of moving average.
2. ➡️ Visualization Options: Choose to enable Heiken Ashi plots for an alternative view of the Z-Score, which can help in identifying trend directions more clearly.
3. ➡️ Monitor for Signals: Keep an eye out for divergence signals and overbought/oversold conditions as potential indicators for entering or exiting trades.
4. ➡️ Alert Setup: Configure alerts based on your selected parameters to receive notifications for important market movements and conditions.
How It Works:
The core of this tool is the Z-Score calculation, which assesses the standard deviation of the current market value from its mean, highlighting overvalued or undervalued market conditions. Here's a brief overview of the script's operational mechanics:
1. 📊 Calculating the Z-Score: The script first calculates the mean over a user-defined lookback period of the MVRV ratio, then it computes the Z-Score to identify deviations from the average.
meanValue = ta.sma(marketValue, zScoreLookback)
zScoreValue = (marketValue - meanValue) / ta.stdev(marketValue, zScoreLookback)
2. 📈 Applying a Moving Average: To smooth the Z-Score data and make trends more discernible, a moving average is applied. Users can choose from several types, such as SMA, EMA, or HMA, based on their preference.
3. 🔄 Heiken Ashi Visualization: For those opting for a more intuitive trend analysis, Heiken Ashi plots can be enabled, transforming the Z-Score data into candlestick charts that simplify trend identification.
4. 🔍 Identifying Divergences: The script is equipped to spot divergences between the market price action and the Z-Score, signaling potential bullish or bearish market reversals.
oscHigherLow = haClose > ta.valuewhen(findPivotLow, haClose , 1) and isInRange(findPivotLow )
priceLowerLow = low < ta.valuewhen(findPivotLow, low , 1)
bullishCondition = enablePlotBullish and priceLowerLow and oscHigherLow and findPivotLow
5. 🚨 Configurable Alerts: Lastly, the script allows for the setting of customizable alerts based on the Z-Score, moving averages, and identified divergences, enabling traders to react promptly to market changes.
The ∑ MVRV Z-Score by AlgoAlpha is an essential tool for traders looking to analyze and interpret market dynamics through a quantitatively rigorous lens. Whether you're focused on identifying market extremes or tracking trend momentum, this script offers the insights needed to support informed trading decisions. 🌟📊💡
Volume-Trend Sentiment (VTS) [AlgoAlpha]Introducing the Volume-Trend Sentiment by AlgoAlpha, a unique tool designed for traders who seek a deeper understanding of market sentiment through volume analysis. This innovative indicator offers a comprehensive view of market dynamics, blending volume trends with price action to provide an insightful perspective on market sentiment. 🚀📊
Key Features:
1. 🌟 Dual Trend Analysis: This indicator combines the concepts of price movement and volume, offering a multi-dimensional view of market sentiment. By analyzing the relationship between the closing and opening prices relative to volume, it provides a nuanced understanding of market dynamics.
2. 🎨 Customizable Settings: Flexibility is at the core of this indicator. Users can adjust various parameters such as the length of the volume trend, standard deviation, and SMA length, ensuring a tailored experience to match individual trading strategies.
3. 🌈 Visual Appeal: With options to display noise, the main plot, and background colors, the indicator is not only informative but also visually engaging. Users can choose their preferred colors for up and down movements, making the analysis more intuitive.
4. ⚠️ Alerts for Key Movements: Stay ahead of market changes with built-in alert conditions. These alerts notify traders when the Volume-Trend Sentiment crosses above or below the midline, signaling potential shifts in market momentum.
How It Works:
The core of the indicator is the calculation of the Volume-Trend Sentiment (VTS). It is computed by subtracting a double-smoothed Exponential Moving Average (EMA) of the price-volume ratio from a single EMA of the same ratio. This method highlights the trend in volume relative to price changes.
volumeTrend = ta.ema((close - open) / volume, volumeTrendLength) - ta.ema(ta.ema((close - open) / volume, volumeTrendLength), volumeTrendLength)
To manage volatility and noise in the volume trend, the indicator employs a standard deviation calculation and a Simple Moving Average (SMA). This smoothing process helps in identifying the true underlying trend by filtering out extreme fluctuations.
standardDeviation = ta.stdev(volumeTrend, standardDeviationLength) * 1
smoothedVolumeTrend = ta.sma(volumeTrend / (standardDeviation + standardDeviation), smaLength)
A unique feature is the dynamic background color, which changes based on the sentiment level. This visual cue instantly communicates the market's bullish or bearish sentiment, enhancing the decision-making process.
getColor(volumeTrendValue) =>
sentimentLevel = math.abs(volumeTrendValue * 10)
baseTransparency = 60 // Base transparency level
colorTransparency = math.max(90 - sentimentLevel * 5, baseTransparency)
volumeTrendValue > 0 ? color.new(upColor, colorTransparency) : color.new(downColor, colorTransparency)
bgcolor(showBackgroundColor ? getColor(smoothedVolumeTrend) : na)
In summary, the Volume-Trend Sentiment by AlgoAlpha is a comprehensive tool that enhances market analysis through a unique blend of volume and price trends. Whether you're a seasoned trader or just starting out, this indicator offers valuable insights into market sentiment and helps in making informed trading decisions. 📈📉🔍🌐
Volume Exhaustion [AlgoAlpha]Introducing the Volume Exhaustion by AlgoAlpha, is an innovative tool that aims to identify potential exhaustion or peaks in trading volume , which can be a key indicator for reversals or continuations in market trends 🔶.
Key Features:
Signal Plotting : A special feature is the plotting of 'Release' signals, marked by orange diamonds, indicating points where the exhaustion index crosses under its previous value and is above a certain boundary. This could signify critical market points 🚨.
Calculation Length Customization : Users can adjust the calculation and Signal lengths to suit their trading style, allowing for flexibility in analysis over different time periods. ☝️
len = input(50, "Calculation Length")
len2 = input(8, "Signal Length")
Visual Appeal : The script offers customizable colors (col for the indicator and col1 for the background) enhancing the visual clarity and user experience 💡.
col = input.color(color.white, "Indicator Color")
col1 = input.color(color.gray, "Background Color")
Advanced Volume Processing : At its core, the script utilizes a combination of Hull Moving Average (HMA) and Exponential Moving Average (EMA) applied to the volume data. This sophisticated approach helps in smoothing out the volume data and reducing lag.
sv = ta.hma(volume, len)
ssv = ta.hma(sv, len)
Volume Exhaustion Detection : The script calculates the difference between the volume and its smoothed version, normalizing this value to create an exhaustion index (fff). Positive values of this index suggest potential volume exhaustion.
f = sv-ssv
ff = (f) / (ta.ema(ta.highest(f, len) - ta.lowest(f, len), len)) * 100
fff = ff > 0 ? ff : 0
Boundary and Zero Line : The script includes a boundary line (boundary) and a zero line (zero), with the area between them filled for enhanced visual interpretation. This helps in assessing the relative position of the exhaustion index.
Customizable Background : The script colors the background of the chart for better readability and to distinguish the indicator’s area clearly.
Overall, Volume Exhaustion is designed for traders who focus on volume analysis. It provides a unique perspective on volume trends and potential exhaustion points, which can be crucial for making informed trading decisions. This script is a valuable addition for traders looking to enhance their trading experience with advanced volume analysis tools.
Peak & Valley Levels [AlgoAlpha]The Peak & Valley Levels indicator is a sophisticated script designed to pinpoint key support and resistance levels in the market. By utilizing candle length and direction, it accurately identifies potential reversal points, offering traders valuable insights for their strategies.
Core Components:
Peak and Valley Detection: The script recognizes peaks and valleys in price action. Peaks (potential resistance levels) are identified when a candle is longer than the previous one, changes direction, and closes lower, especially on lower volume. Valleys (potential support levels) are detected under similar conditions but with the candle closing higher.
Color-Coded Visualization:
Red lines mark resistance levels, signifying peaks in the price action.
Green lines indicate support levels, representing valleys.
Dynamic Level Adjustment: The script adapts these levels based on ongoing market movements, enhancing their relevance and accuracy.
Rejection Functions:
Bullish Rejection: Determines if a candlestick pattern rejects a level as potential support.
Bearish Rejection: Identifies if a pattern rejects a level as possible resistance.
Usage and Strategy Integration:
Visual Aid for Support and Resistance: The indicator is invaluable for visualizing key market levels where price reversals may occur.
Entry and Exit Points: Traders can use the identified support and resistance levels to fine-tune entry and exit points in their trading strategies.
Trend Reversal Signals: The detection of peaks and valleys serves as an early indicator of potential trend reversals.
Application in Trading:
Versatile for Various Trading Styles: This indicator can be applied across different trading styles, including swing trading, scalping, or trend-following approaches.
Complementary Tool: For best results, it should be used alongside other technical analysis tools to confirm trading signals and strategies.
Customization and Adaptability: Traders are encouraged to experiment with different settings and timeframes to tailor the indicator to their specific trading needs and market conditions.
In summary, the Peak & Valley Levels by AlgoAlpha is a dynamic and adaptable tool that enhances a trader’s ability to identify crucial market levels. Its integration of candlestick analysis with dynamic level adjustment offers a robust method for spotting potential reversal points, making it a valuable addition to any trader's toolkit.
Limited Growth Stock-to-Flow (LGS2F) [AlgoAlpha]Description:
The "∂ Limited Growth Stock-to-Flow (LG-S2F)" indicator, developed by AlgoAlpha, is a technical analysis tool designed to analyze the price of Bitcoin (BTC) based on the Stock-to-Flow model. The indicator calculates the expected price range of BTC by incorporating variables such as BTC supply, block height, and model parameters. It also includes error bands to indicate potential overbought and oversold conditions.
How it Works:
The LG-S2F indicator utilizes the Stock-to-Flow model, which measures the scarcity of an asset by comparing its circulating supply (stock) to its newly produced supply (flow). In this script, the BTC supply and block height data are obtained to calculate the price using the model formula. The formula includes coefficients (a, b, c) and exponentiation functions to derive the expected price.
The script incorporates error bands based on uncertainty values derived from the standard errors of the model parameters. These error bands indicate the potential range of variation in the expected price, accounting for uncertainties in the model's parameters. The upper and lower error bands visualize potential overbought and oversold conditions, respectively.
Usage:
Traders can utilize the LG-S2F indicator to gain insights into the potential price movements of Bitcoin. The indicator's main line represents the expected price, while the error bands highlight the potential range of variation. Traders may consider taking long positions when the price is near or below the lower error band and short positions when the price is close to or above the upper error band.
It's important to note that the LG-S2F indicator is specifically designed for Bitcoin and relies on the Stock-to-Flow model. Users should exercise caution and consider additional analysis and factors before making trading decisions solely based on this indicator.
Originality:
The LG-S2F indicator, developed by QuantMario and AlgoAlpha, is an original implementation that combines the Stock-to-Flow model with error bands to provide a comprehensive view of BTC's potential price range. While the concept of Stock-to-Flow analysis exists, the specific calculations, incorporation of error bands, and customization options in this script are unique to QuantMario's methodology. The script is released under Mozilla Public License 2.0, allowing users to utilize and modify it while adhering to the license terms.
Fibonacci Volume Profiles [AlgoAlpha]Unlock a deeper understanding of price action with the Fibonacci Volume Profiles indicator by AlgoAlpha! This powerful tool blends Fibonacci retracement levels with customizable volume profiles, helping traders identify high-probability areas of support, resistance, and accumulation. Designed for both continuous dynamic levels and custom time periods, this indicator is a must-have for traders seeking confluence in market structure analysis.
🔑 Key Features
📈 Dual Mode Selection : Choose between Continuous Fibonacci levels, which adapt dynamically to pivots, or a Custom Period mode, where you set your own start and end points.
📊 Integrated Volume Profile : Visualize volume distributions at key Fibonacci retracement levels, revealing areas of strong buying/selling interest.
🎨 Customizable Colors & Transparency : Adjust Fibonacci level colors, fill zones, and profile transparency for a visually clear experience.
🔍 Profile Resolution & Scaling : Control the number of price levels and width of the volume profile for detailed market insights.
🛠 Extendable Levels : Optionally extend Fibonacci levels to the right of the chart for better visualization of future price interaction.
📌 How to Use
Add the Indicator: Click on the star icon to add it to your favorites and apply it to your TradingView chart.
Analyze The Market: Observe how price interacts with Fibonacci levels alongside the volume profile to confirm support/resistance zones. Switch between custom range or continuous mode to align the tool with your trading style.
⚙️ How It Works
The indicator calculates pivot highs/lows dynamically (or uses user-defined time periods) to plot Fibonacci retracement levels. It then builds a volume profile by analyzing historical volume data, grouping it into price bins to highlight volume-heavy zones. The Point of Control (PoC) is identified as the level with the highest traded volume, acting as a key price magnet. The color-coded Fibonacci levels help traders spot retracement zones, while the volume profile confirms strength or weakness in those areas.
Smoothed Gaussian Trend Filter [AlgoAlpha]Experience seamless trend detection and market analysis with the Smoothed Gaussian Trend Filter by AlgoAlpha! This cutting-edge indicator combines advanced Gaussian filtering with linear regression smoothing to identify and enhance market trends, making it an essential tool for traders seeking precise and actionable signals.
Key Features :
🔍 Gaussian Trend Filtering: Utilizes a customizable Gaussian filter with adjustable length and pole settings for tailored smoothing and trend identification.
📊 Linear Regression Smoothing: Reduces noise and further refines the Gaussian output with user-defined smoothing length and offset, ensuring clarity in trend representation.
✨ Dynamic Visual Highlights: Highlights trends and signals based on volume intensity, allowing for real-time insights into market behavior.
📉 Choppy Market Detection: Identifies ranging or choppy markets, helping traders avoid false signals.
🔔 Custom Alerts: Set alerts for bullish and bearish signals, trend reversals, or choppy market conditions to stay on top of trading opportunities.
🎨 Color-Coded Visuals: Fully customizable colors for bullish and bearish signals, ensuring clear and intuitive chart analysis.
How to Use :
Add the Indicator: Add it to your favorites and apply it to your TradingView chart.
Interpret the Chart: Observe the trend line for directional changes and use the accompanying buy/sell signals for entry and exit opportunities. Choppy market conditions are flagged for additional caution.
Set Alerts: Enable alerts for trend signals or choppy market detections to act promptly without constant chart monitoring.
How It Works :
The Smoothed Gaussian Trend Filter uses a combination of advanced smoothing techniques to identify trends and enhance market clarity. First, a Gaussian filter is applied to price data, using a user-defined length (Gaussian length) and poles (smoothness level) to calculate an alpha value that determines the degree of smoothing. This creates a refined trend line that minimizes noise while preserving key market movements. The output is then further processed using linear regression smoothing, allowing traders to adjust the length and offset to flatten minor oscillations and emphasize the dominant trend. To incorporate market activity, volume intensity is analyzed through a normalized Hull Moving Average (HMA), dynamically adjusting the trend line's color transparency based on trading activity. The indicator also identifies trend direction by comparing the smoothed trend line with a calculated SuperTrend-style level, generating clear trend regimes and highlighting ranging or choppy conditions where trends are less reliable and avoiding false signals. This seamless integration of Gaussian smoothing, regression analysis, and volume dynamics provides traders with a powerful and intuitive tool for market analysis.
Trend Reversal Probability [Algoalpha]Introducing Trend Reversal Probability by AlgoAlpha – a powerful indicator that estimates the likelihood of trend reversals based on an advanced custom oscillator and duration-based statistics. Designed for traders who want to stay ahead of potential market shifts, this indicator provides actionable insights into trend momentum and reversal probabilities.
Key Features :
🔧 Custom Oscillator Calculation: Combines a dual SMA strategy with a proprietary RSI-like calculation to detect market direction and strength.
📊 Probability Levels & Visualization: Plots average signal durations and their statistical deviations (±1, ±2, ±3 SD) on the chart for clear visual guidance.
🎨 Dynamic Color Customization: Choose your preferred colors for upward and downward trends, ensuring a personalized chart view.
📈 Signal Duration Metrics: Tracks and displays signal durations with columns representing key percentages (80%, 60%, 40%, and 20%).
🔔 Alerts for High Probability Events: Set alerts for significant reversal probabilities (above 84% and 98% or below 14%) to capture key trading moments.
How to Use :
Add the Indicator: Add Trend Reversal Probability to your favorites by clicking the star icon.
Market Analysis: Use the plotted probability levels (average duration and ±SD bands) to identify overextended trends and potential reversals. Use the color of the duration counter to identify the current trend.
Leverage Alerts: Enable alerts to stay informed of high or extreme reversal probabilities without constant chart monitoring.
How It Works :
The indicator begins by calculating a custom oscillator using short and long simple moving averages (SMA) of the midpoint price. A proprietary RSI-like formula then transforms these values to estimate trend direction and momentum. The duration between trend reversals is tracked and averaged, with standard deviations plotted to provide probabilistic guidance on trend longevity. Additionally, the indicator incorporates a cumulative probability function to estimate the likelihood of a trend reversal, displaying the result in a data table for easy reference. When probability levels cross key thresholds, alerts are triggered, helping traders take timely action.
Kalman Step Signals [AlgoAlpha]Take your trading to the next level with the Kalman Step Signals indicator by AlgoAlpha! This advanced tool combines the power of Kalman Filtering and the Supertrend indicator, offering a unique perspective on market trends and price movements. Designed for traders who seek clarity and precision in identifying trend shifts and potential trade entries, this indicator is packed with customizable features to suit your trading style.
Key Features
🔍 Kalman Filter Smoothing : Dynamically smooths price data with user-defined parameters for Alpha, Beta, and Period, optimizing responsiveness and trend clarity.
📊 Supertrend Overlay : Incorporates a classic Supertrend indicator to provide clear visual cues for trend direction and potential reversals.
🎨 Customizable Appearance : Adjust colors for bullish and bearish trends, along with optional exit bands for more nuanced analysis.
🔔 Smart Alerts : Detect key moments like trend changes or rejection entries for timely trading decisions.
📈 Advanced Visualization : Includes optional entry signals, exit bands, and rejection markers to pinpoint optimal trading opportunities.
How to Use
Add the Indicator : Add the script to your TradingView favorites. Customize inputs like Kalman parameters (Alpha, Beta, Period) and Supertrend settings (Factor, ATR Period) based on your trading strategy.
Interpret the Signals : Watch for trend direction changes using Supertrend lines and directional markers. Utilize rejection entries to identify price rejections at trendlines for precision entry points.
Set Alerts : Enable the built-in alert conditions for trend changes or rejection entries to act swiftly on trading opportunities without constant chart monitoring.
How It Works
The indicator leverages a Kalman Filter to smooth raw price data, balancing responsiveness and noise reduction using user-controlled parameters. This refined price data is then fed into a Supertrend calculation, combining ATR-based volatility analysis with dynamic upper and lower bands. The result is a clear and reliable trend-detection system. Additionally, it features rejection markers for bullish and bearish reversals when prices reject the trendline, along with exit bands to visualize potential price targets. The integration of customizable alerts ensures traders never miss critical market moves.
Add the Kalman Step Signals to your TradingView charts today and enjoy a smarter, more efficient trading experience! 🚀🌟